


Gas Sensing Performance of Zinc Oxide Nanoparticles Fabricated via Ochradenus baccatus Leaf


 ,
,  ,
,
Abstract
1. Introduction
2. Materials and Methods
2.1. Preparation of ZnO Nanoparticles
2.2. Characterizations
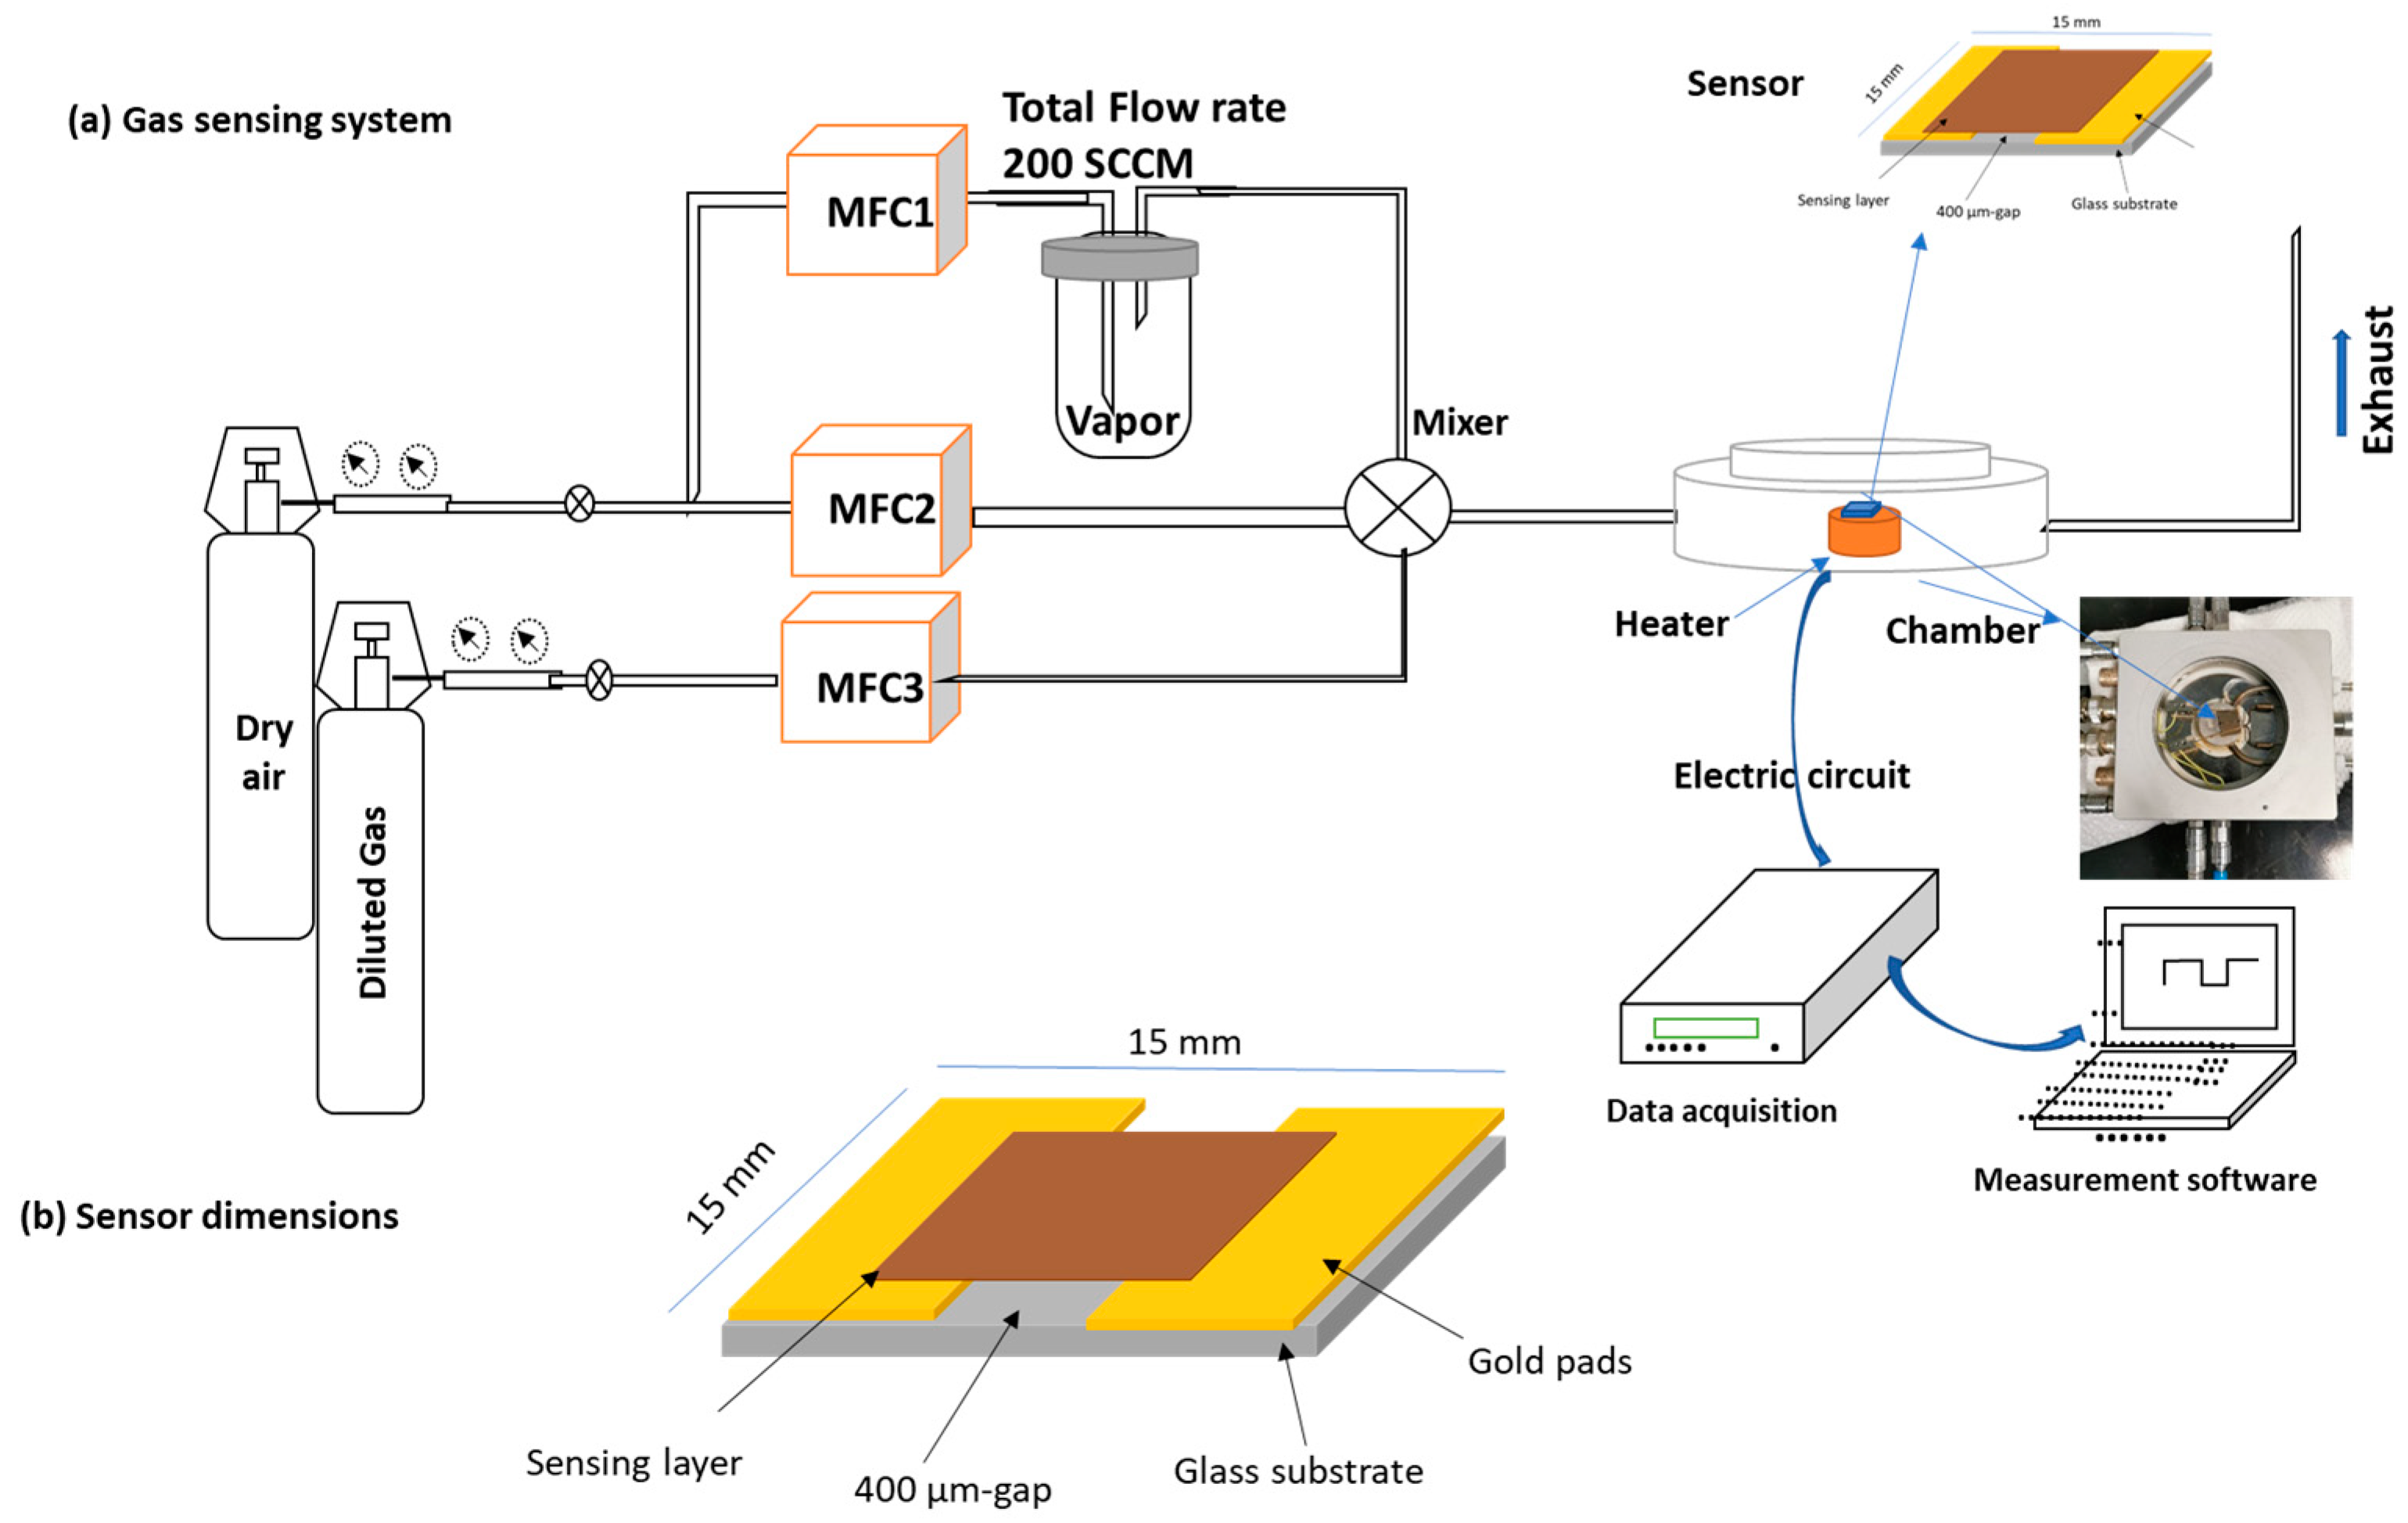
2.3. Gas Sensor Preparation and Characterizations
3. Results and Discussion
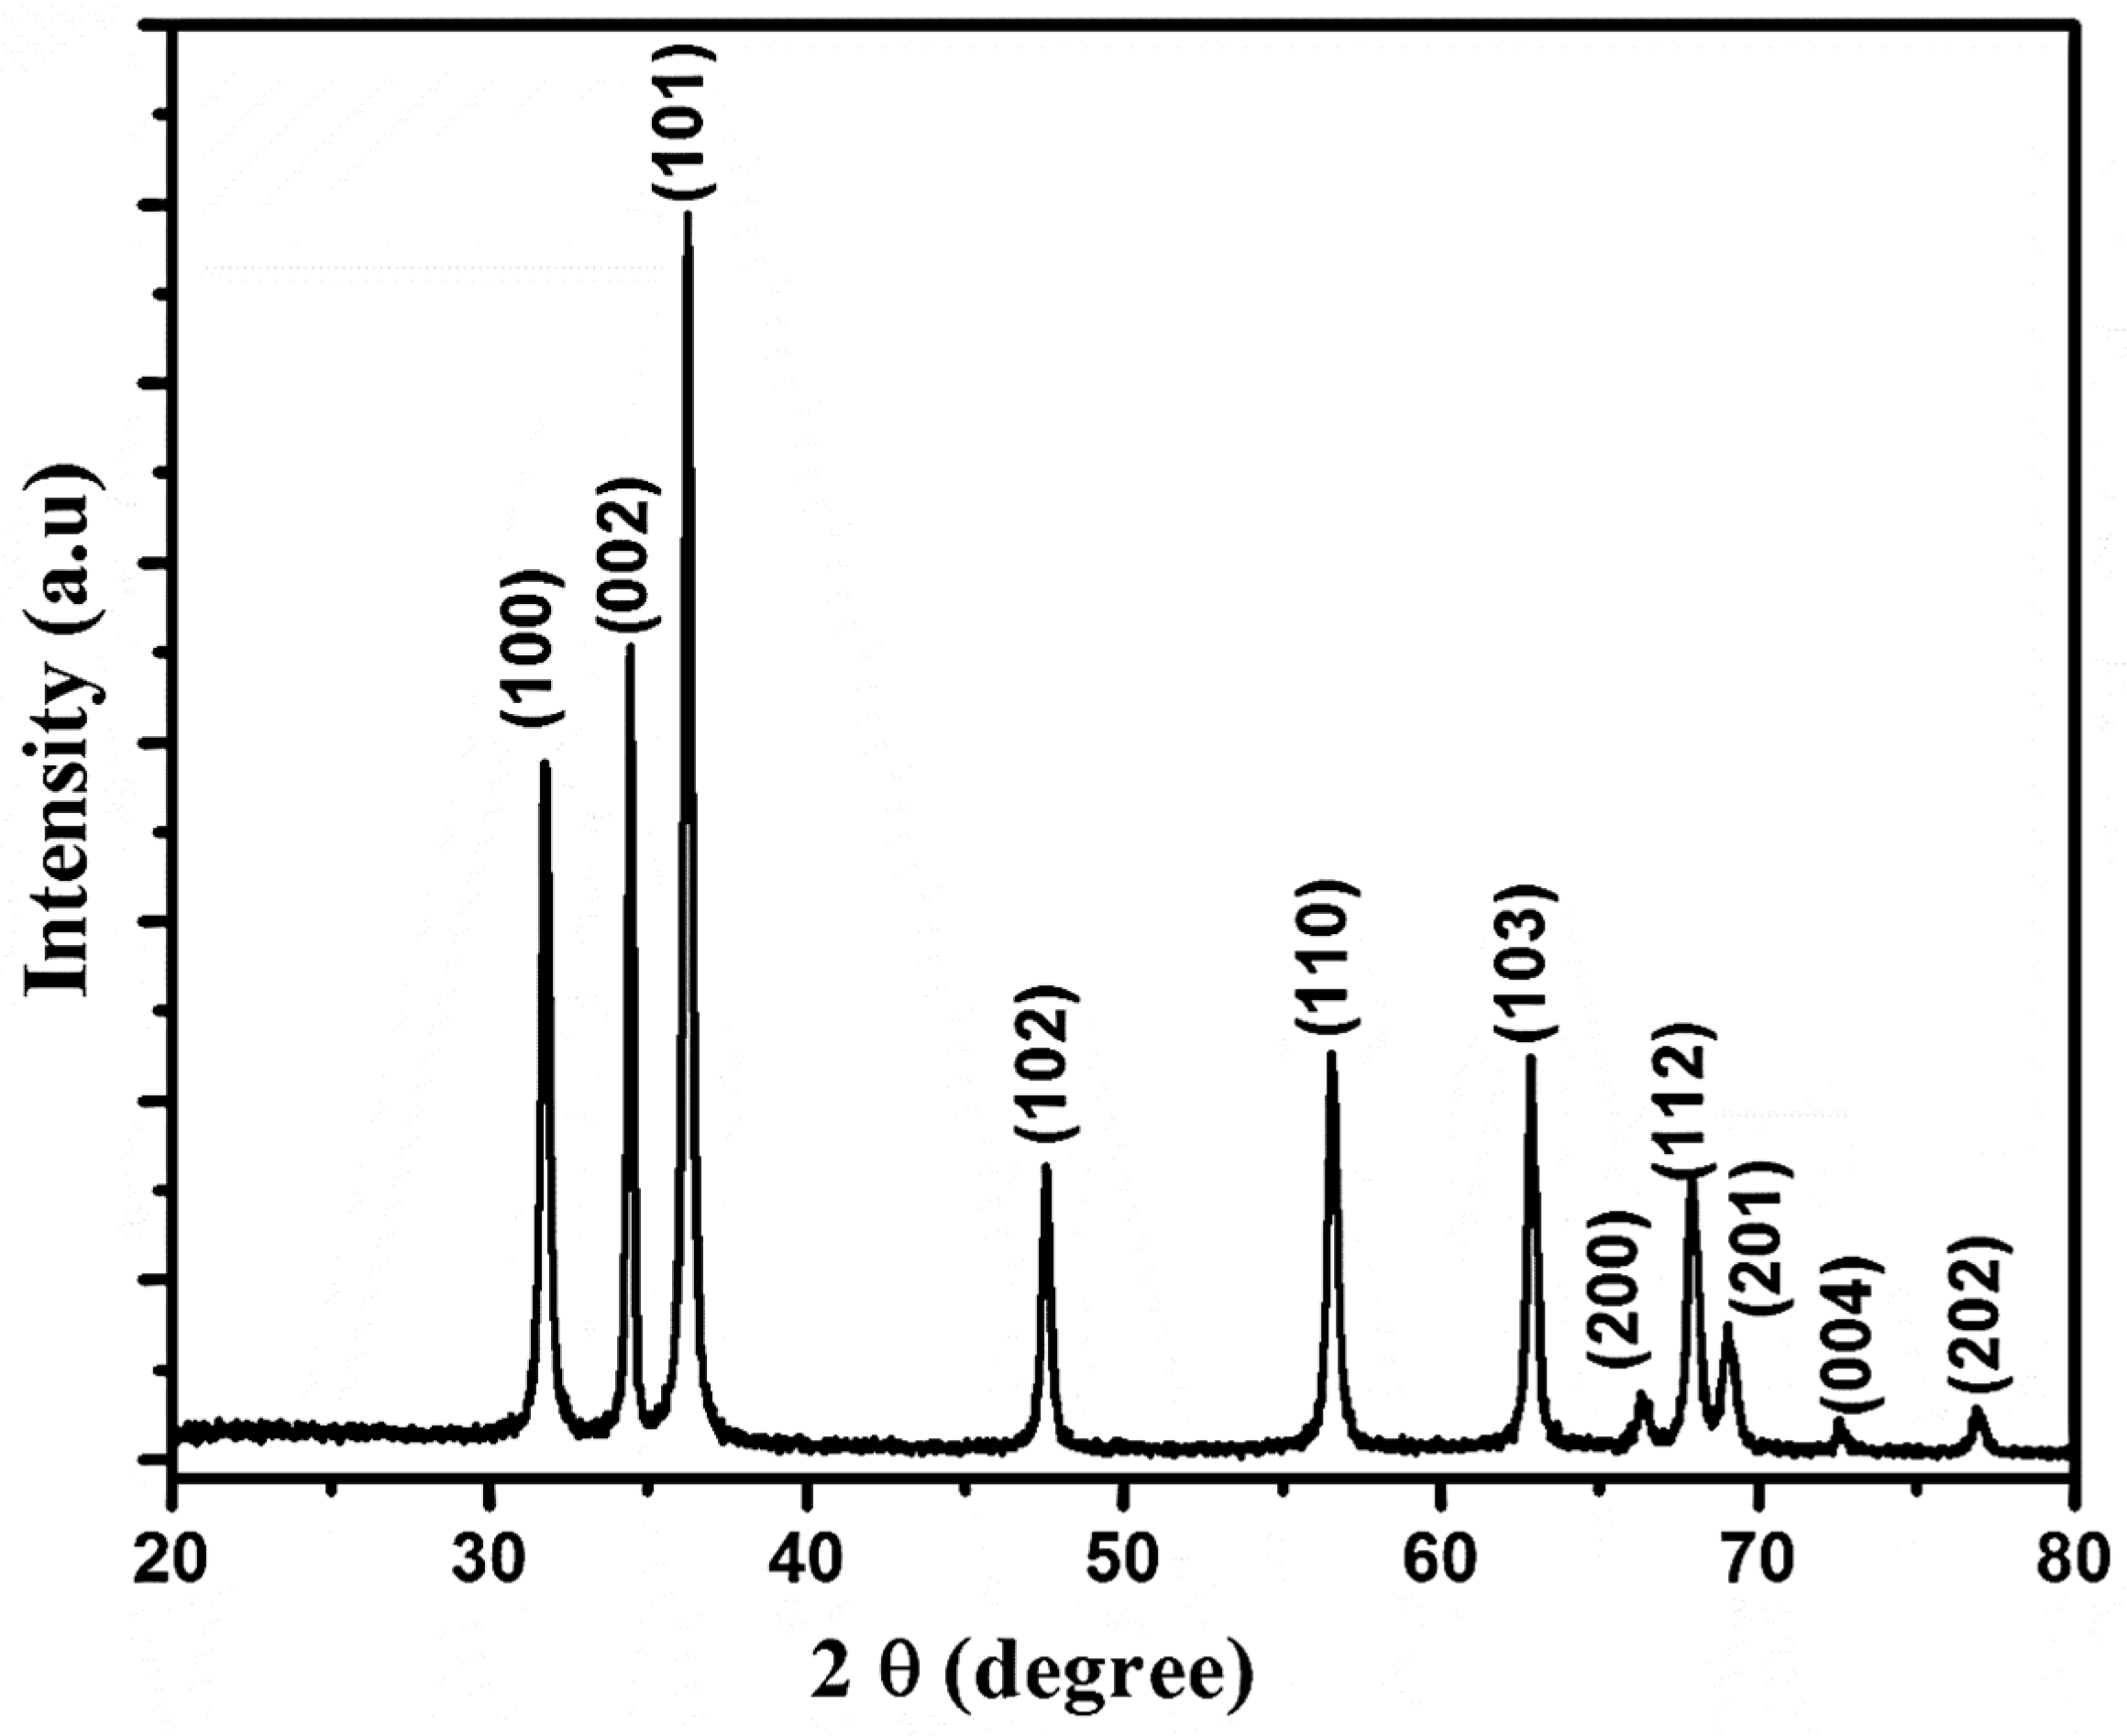
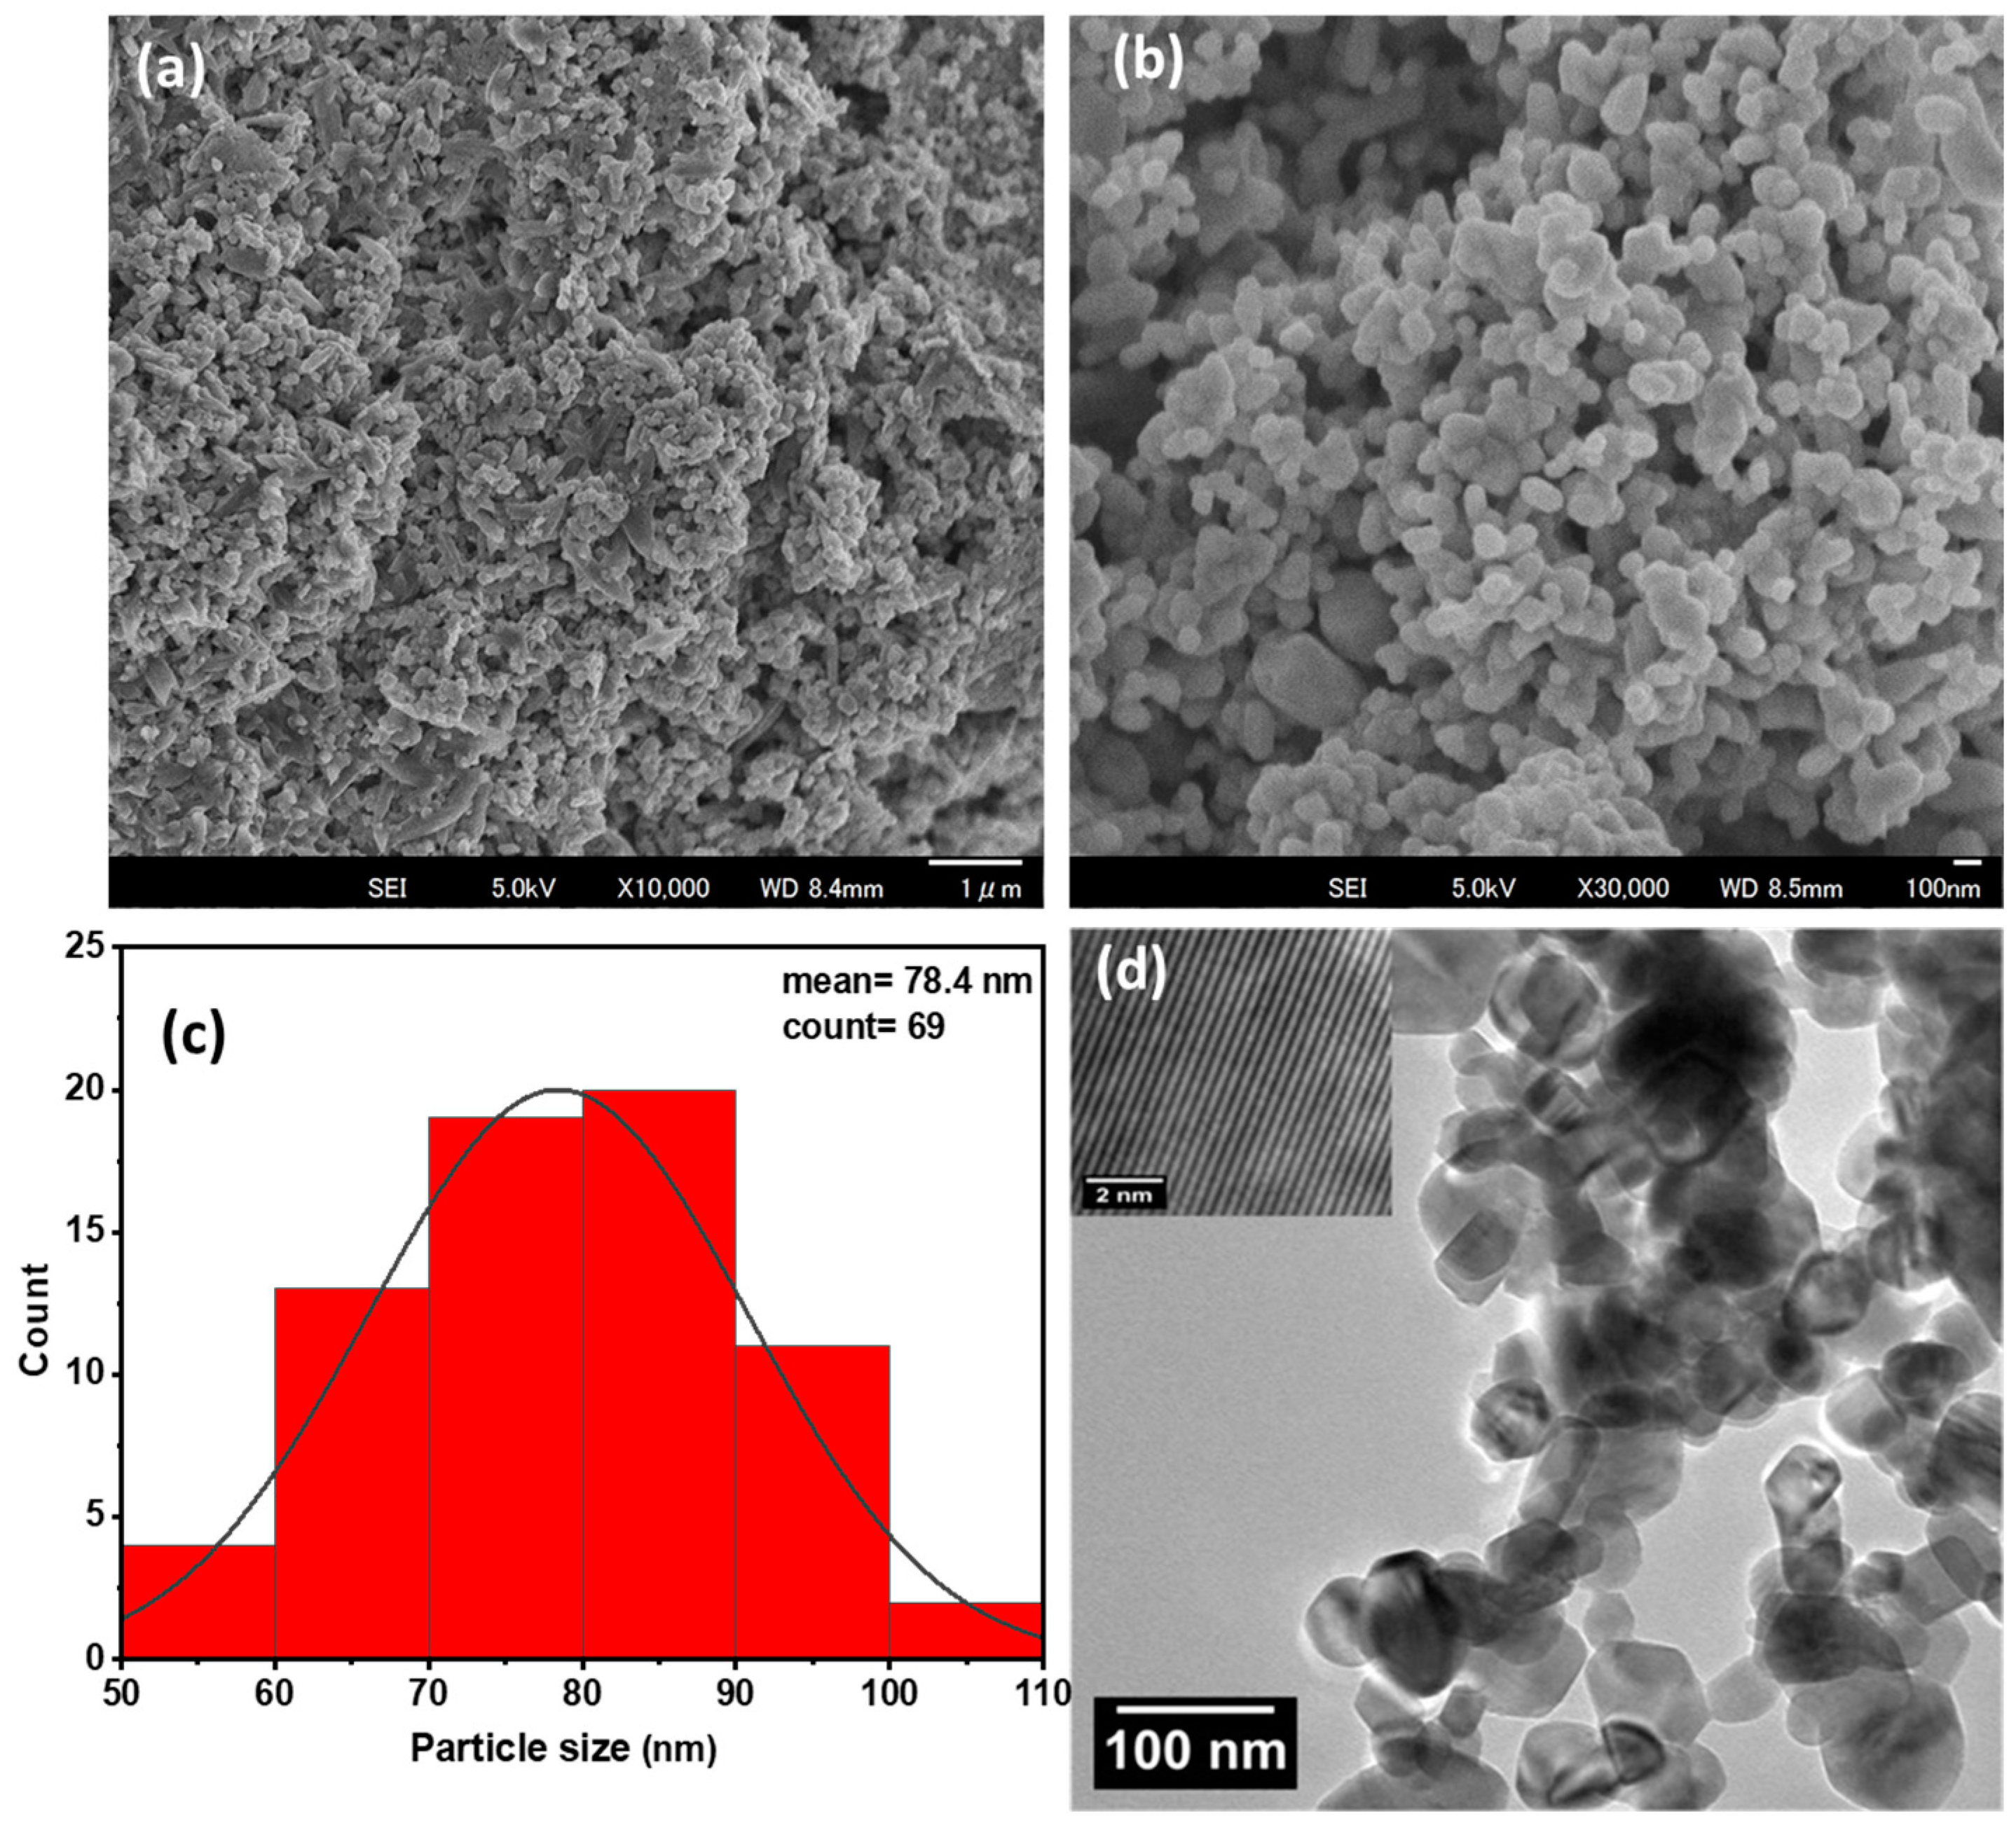
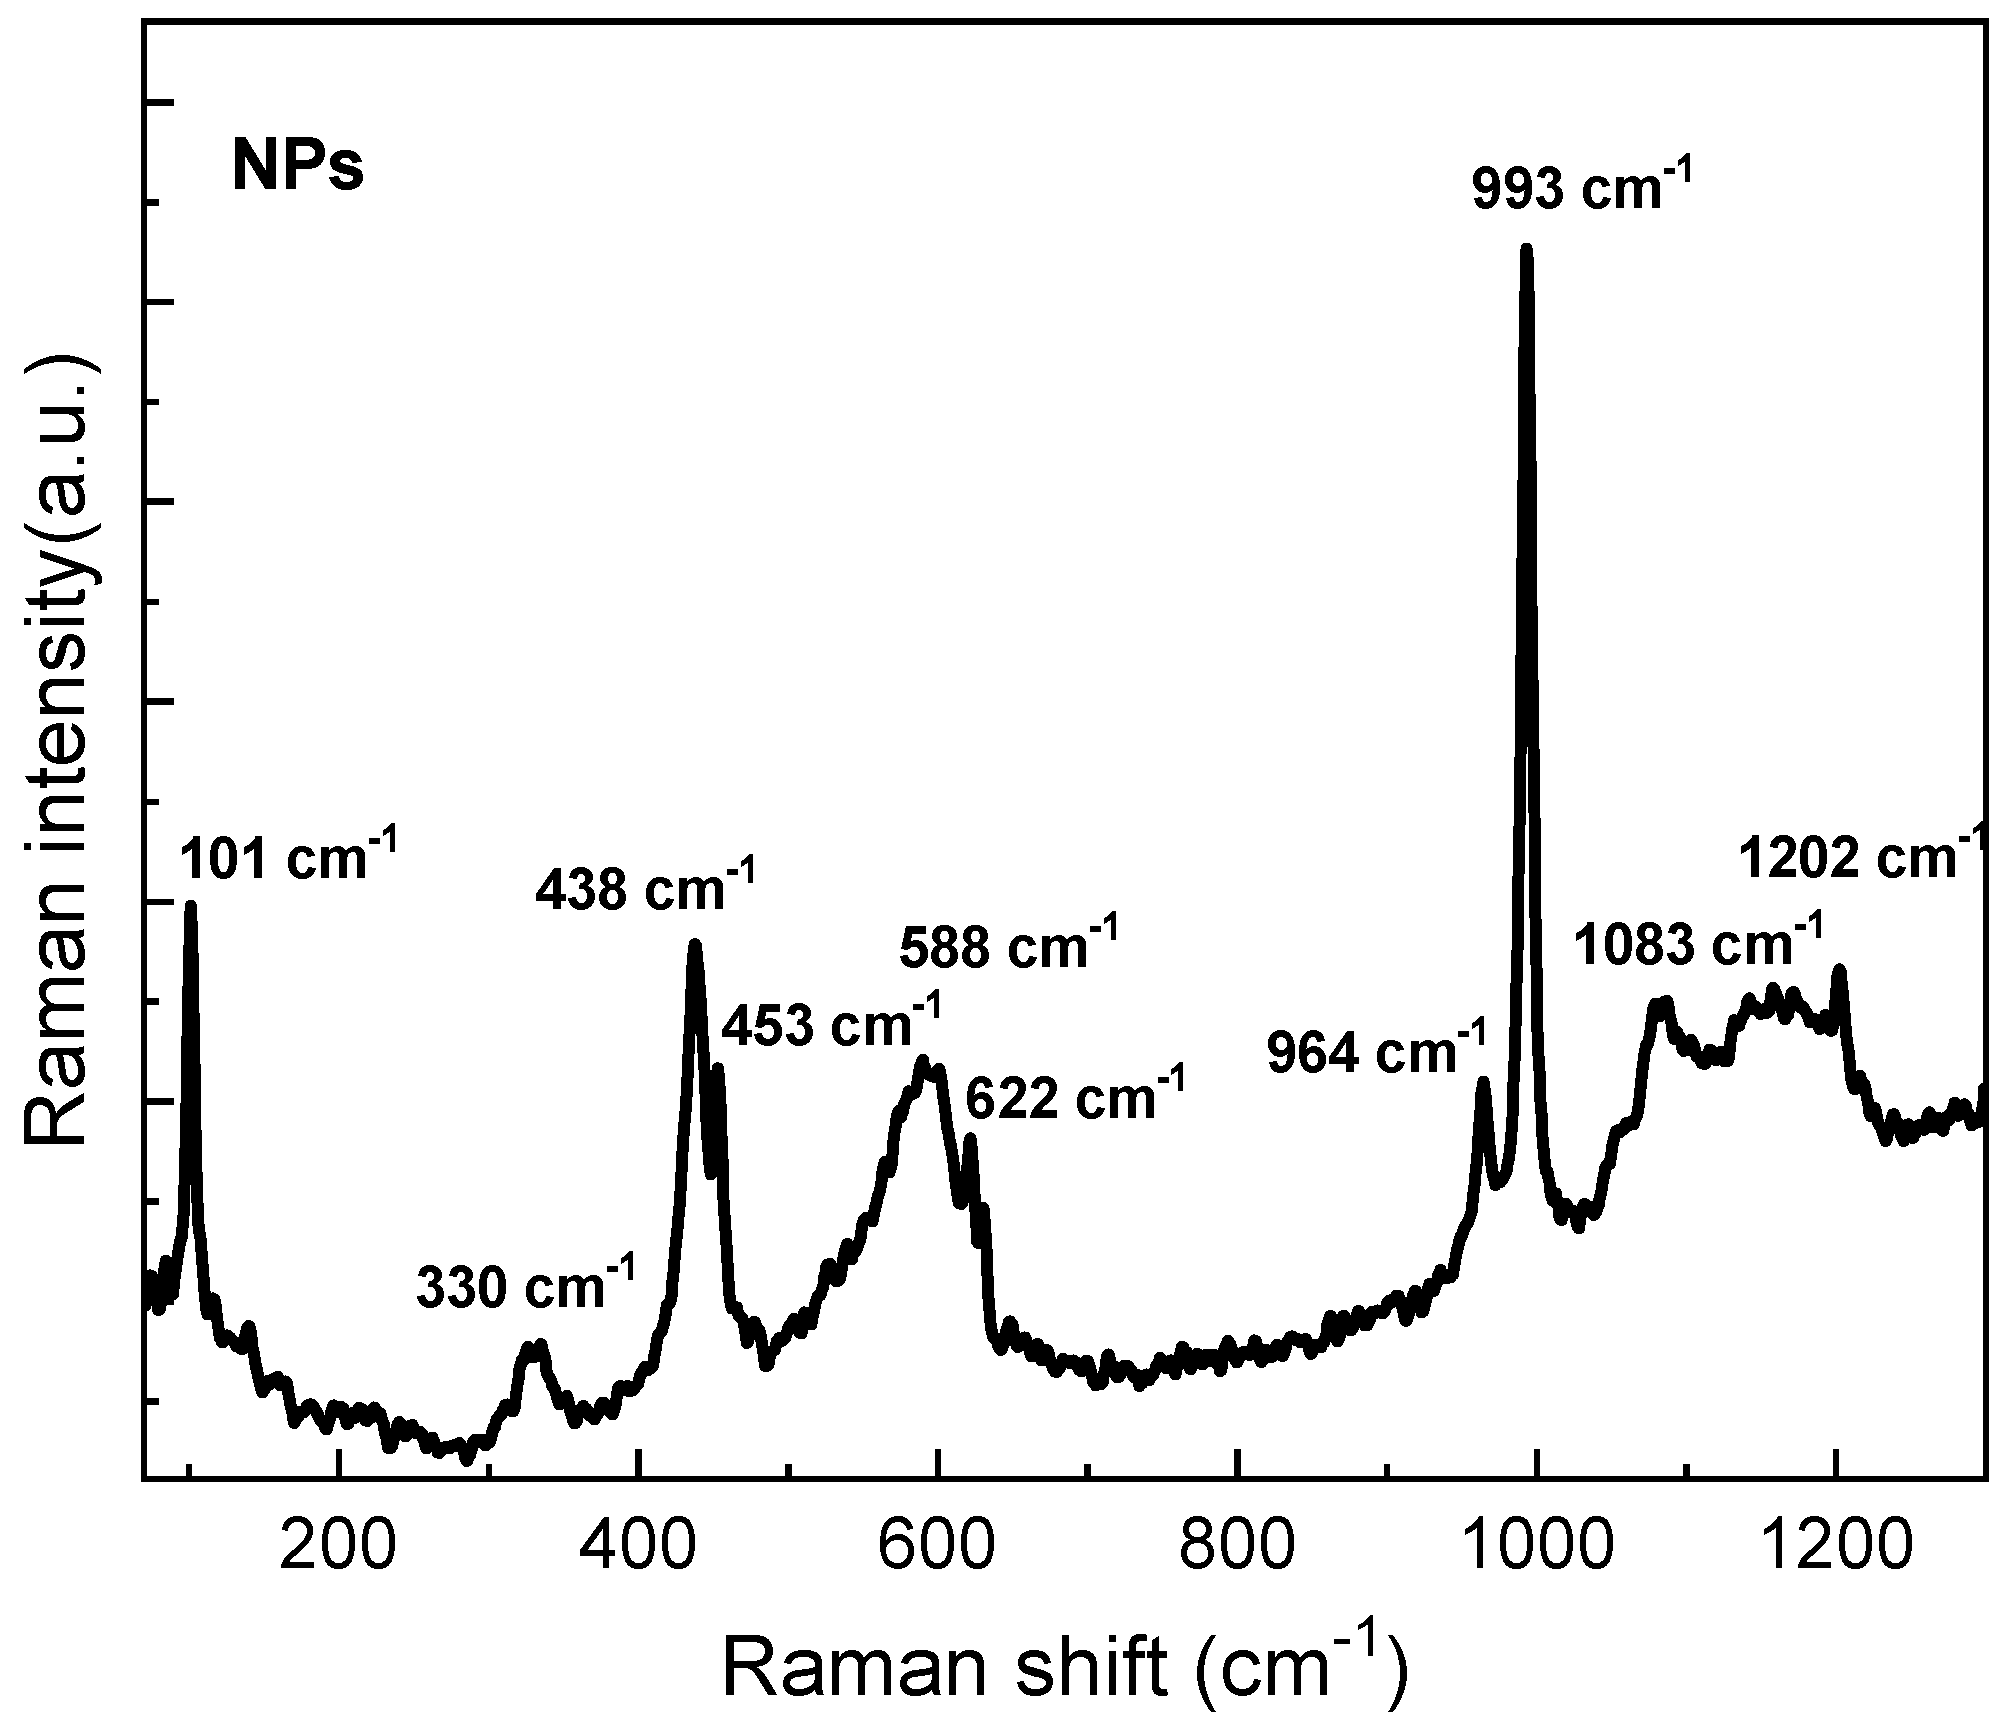
3.1. Structural and Morphology of ZnO NPs
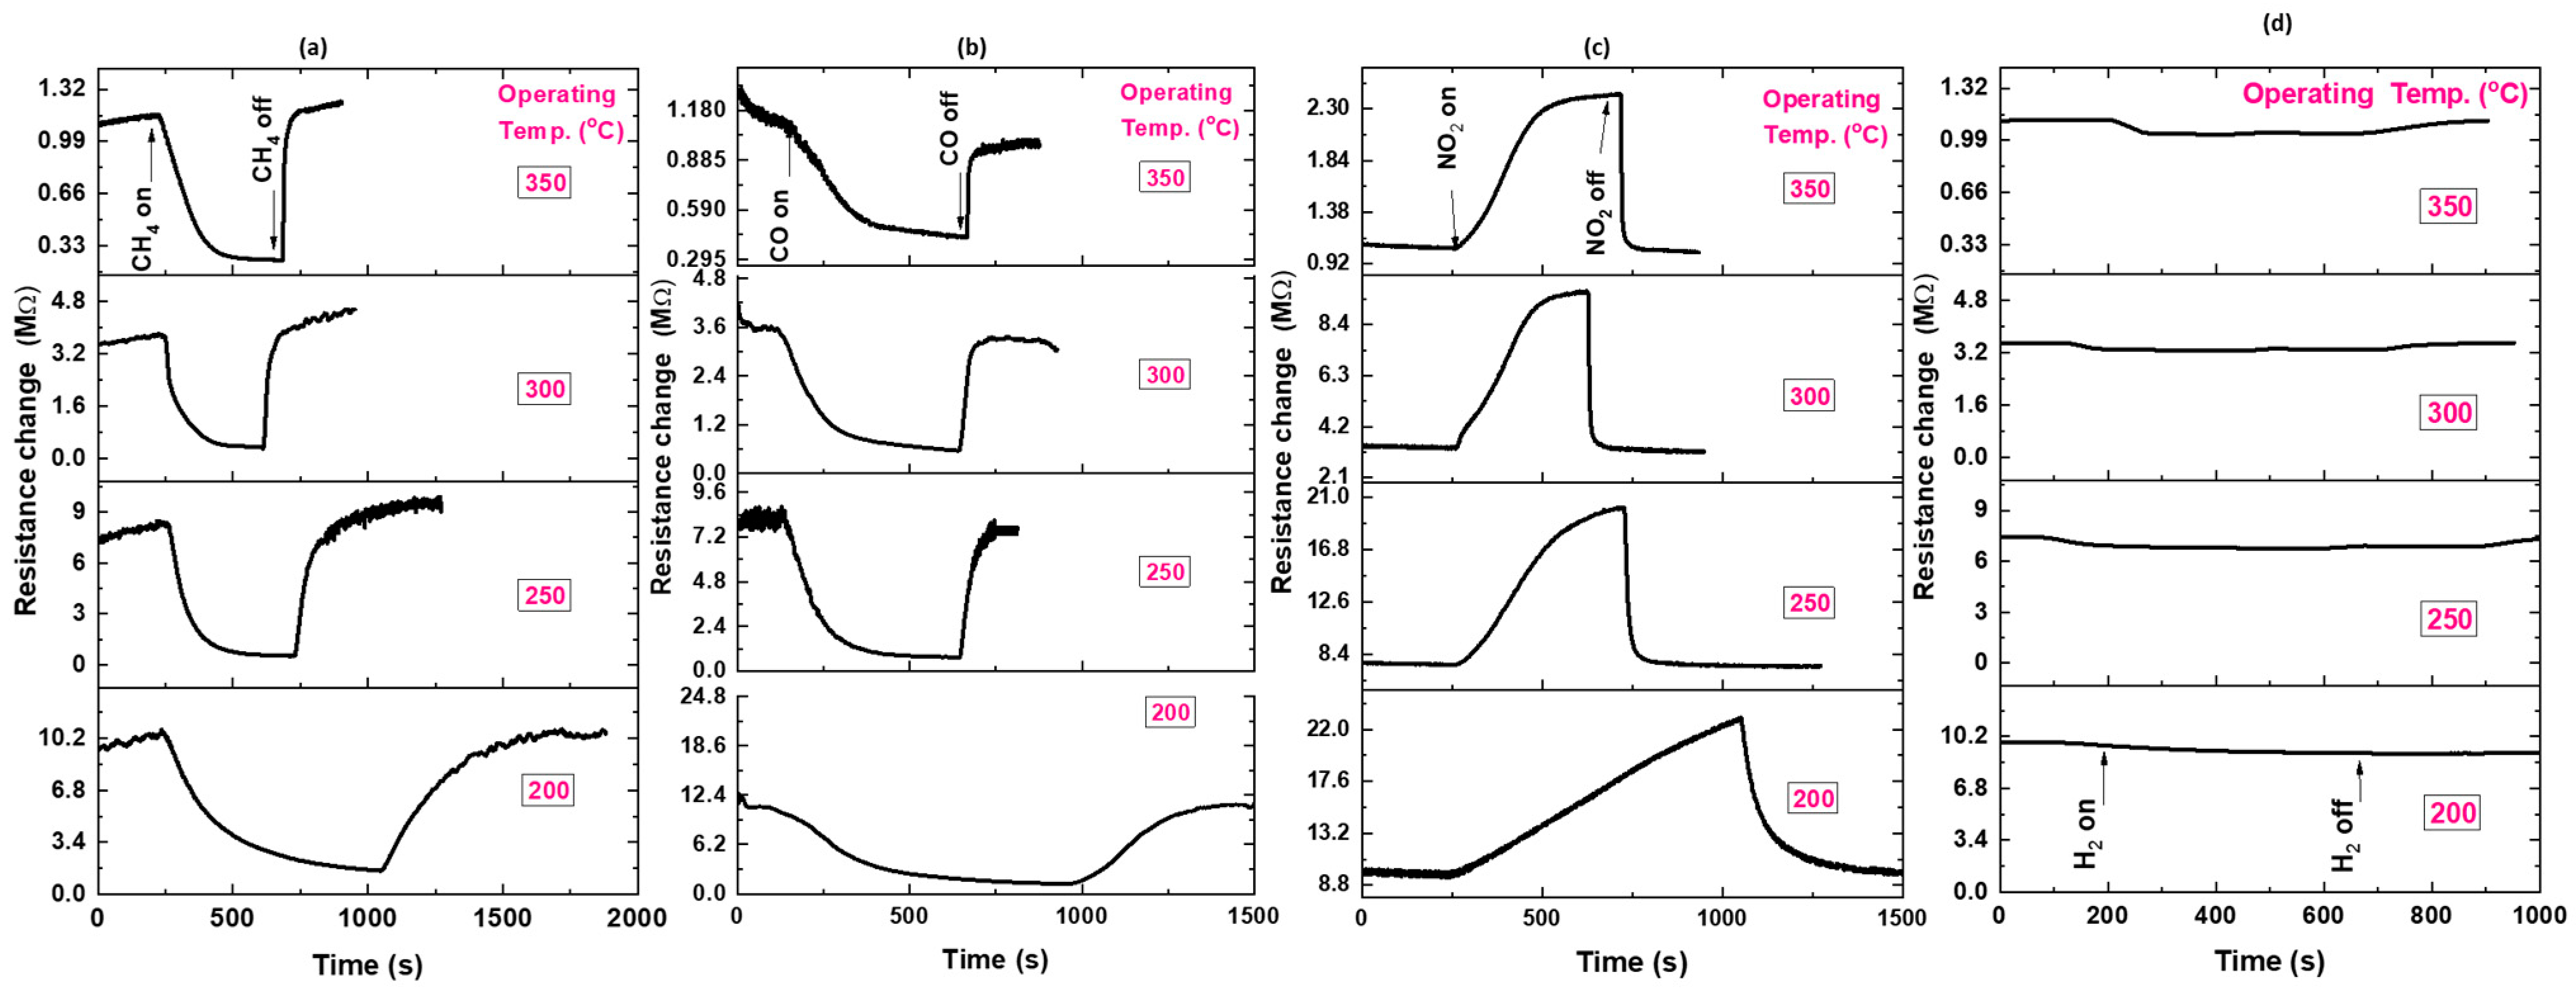
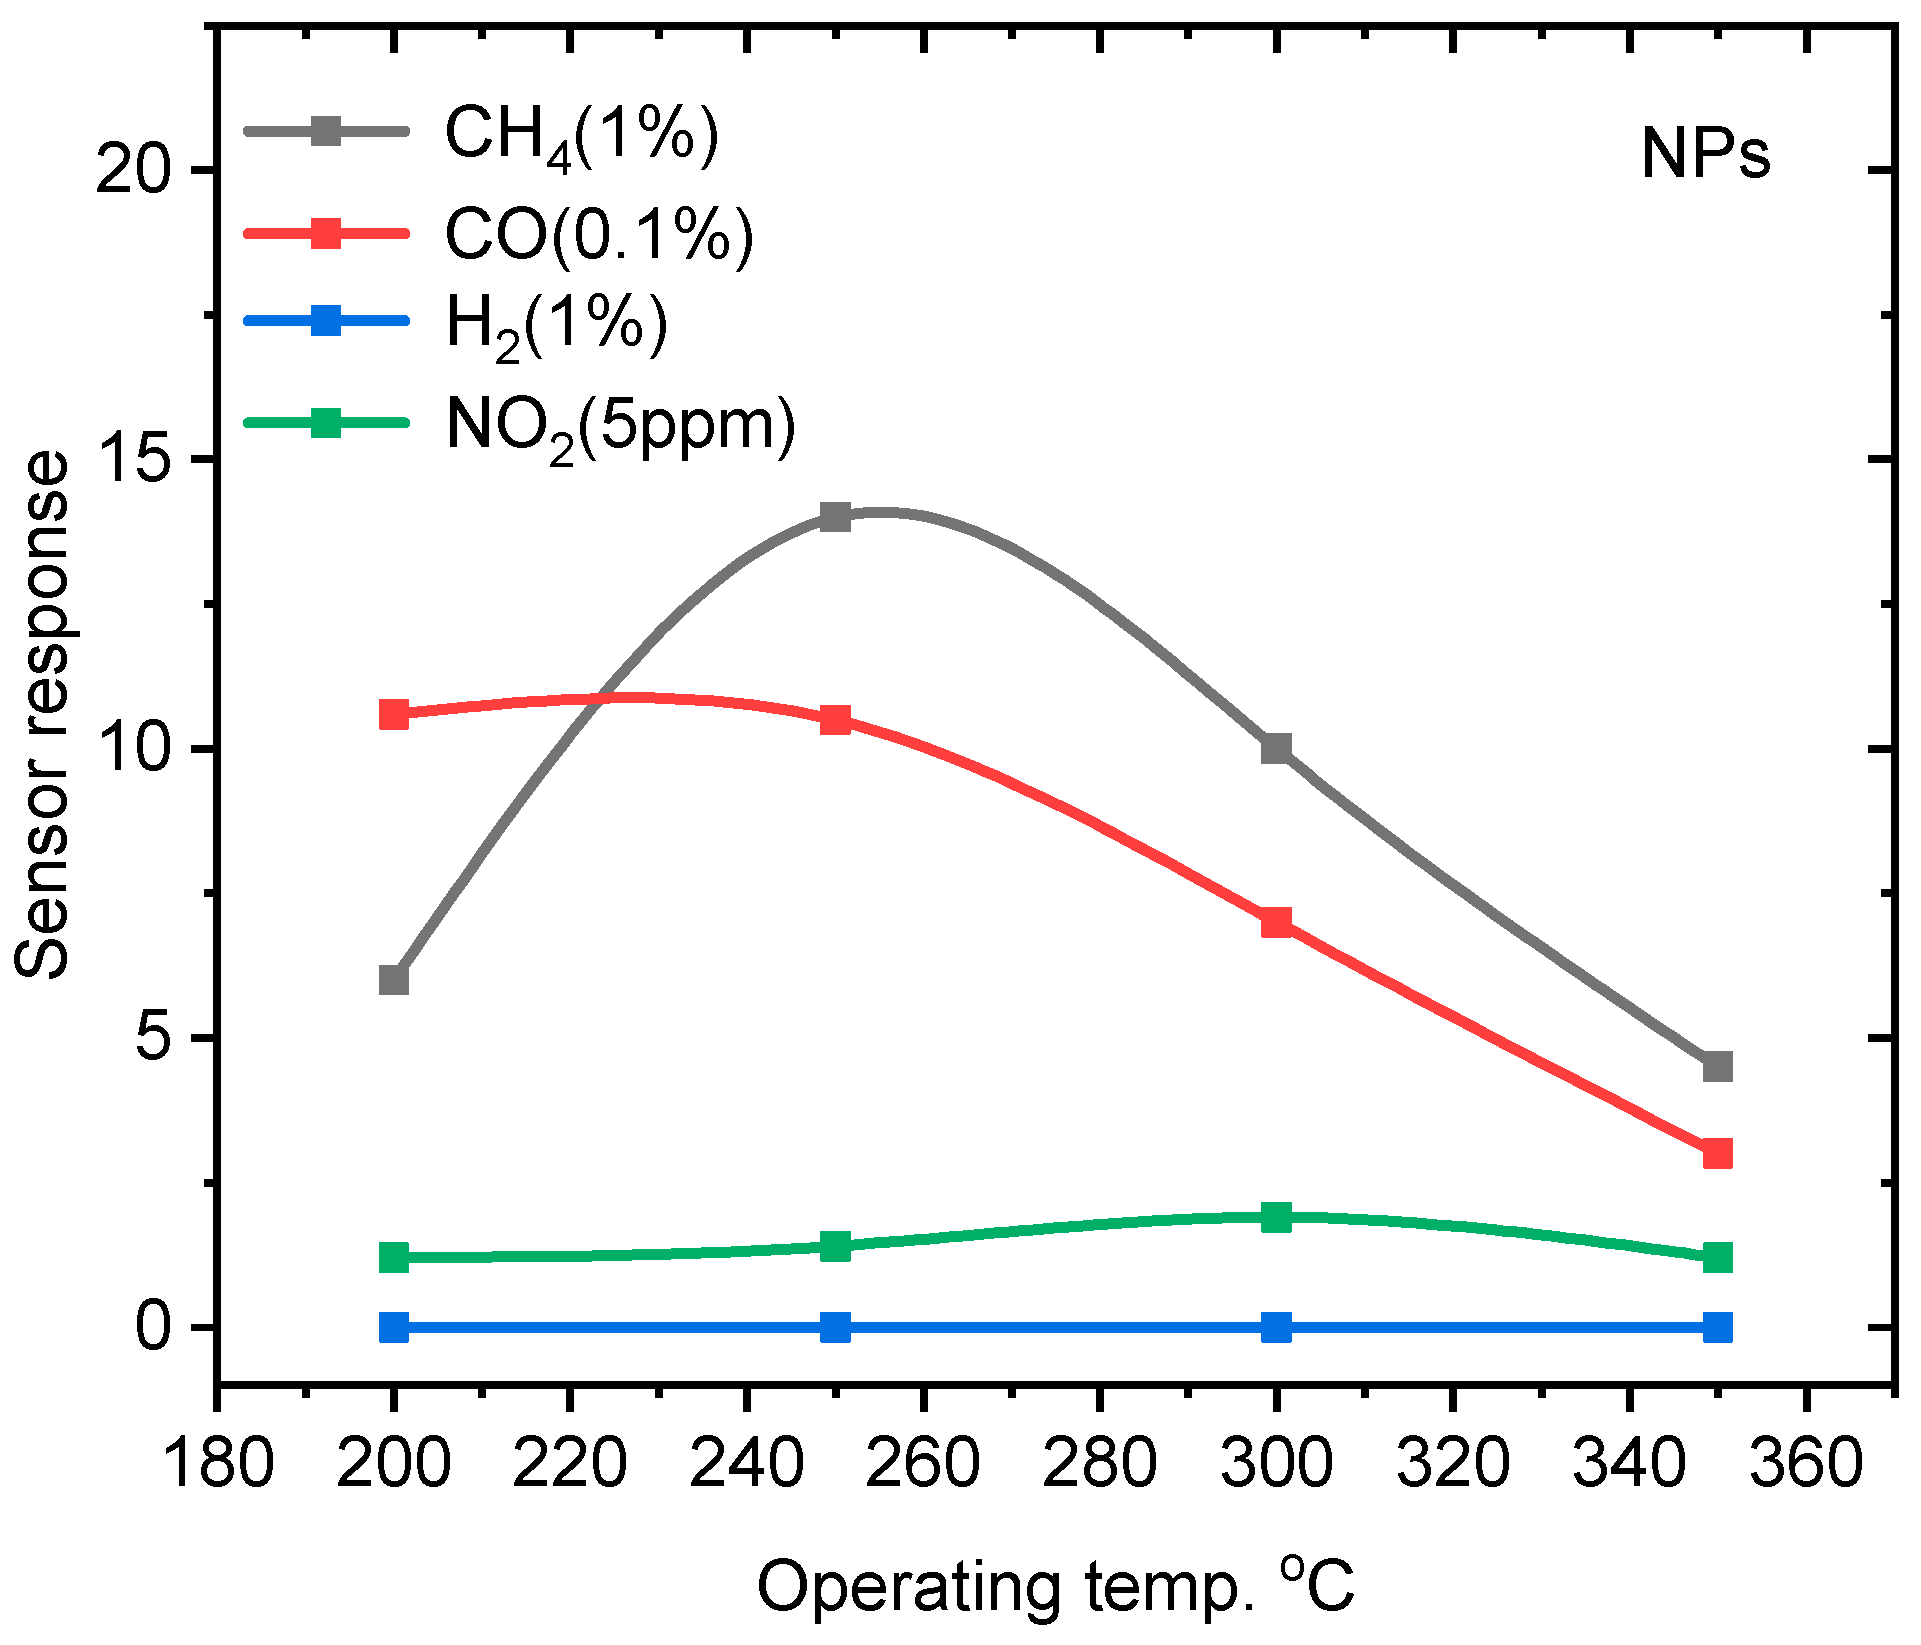
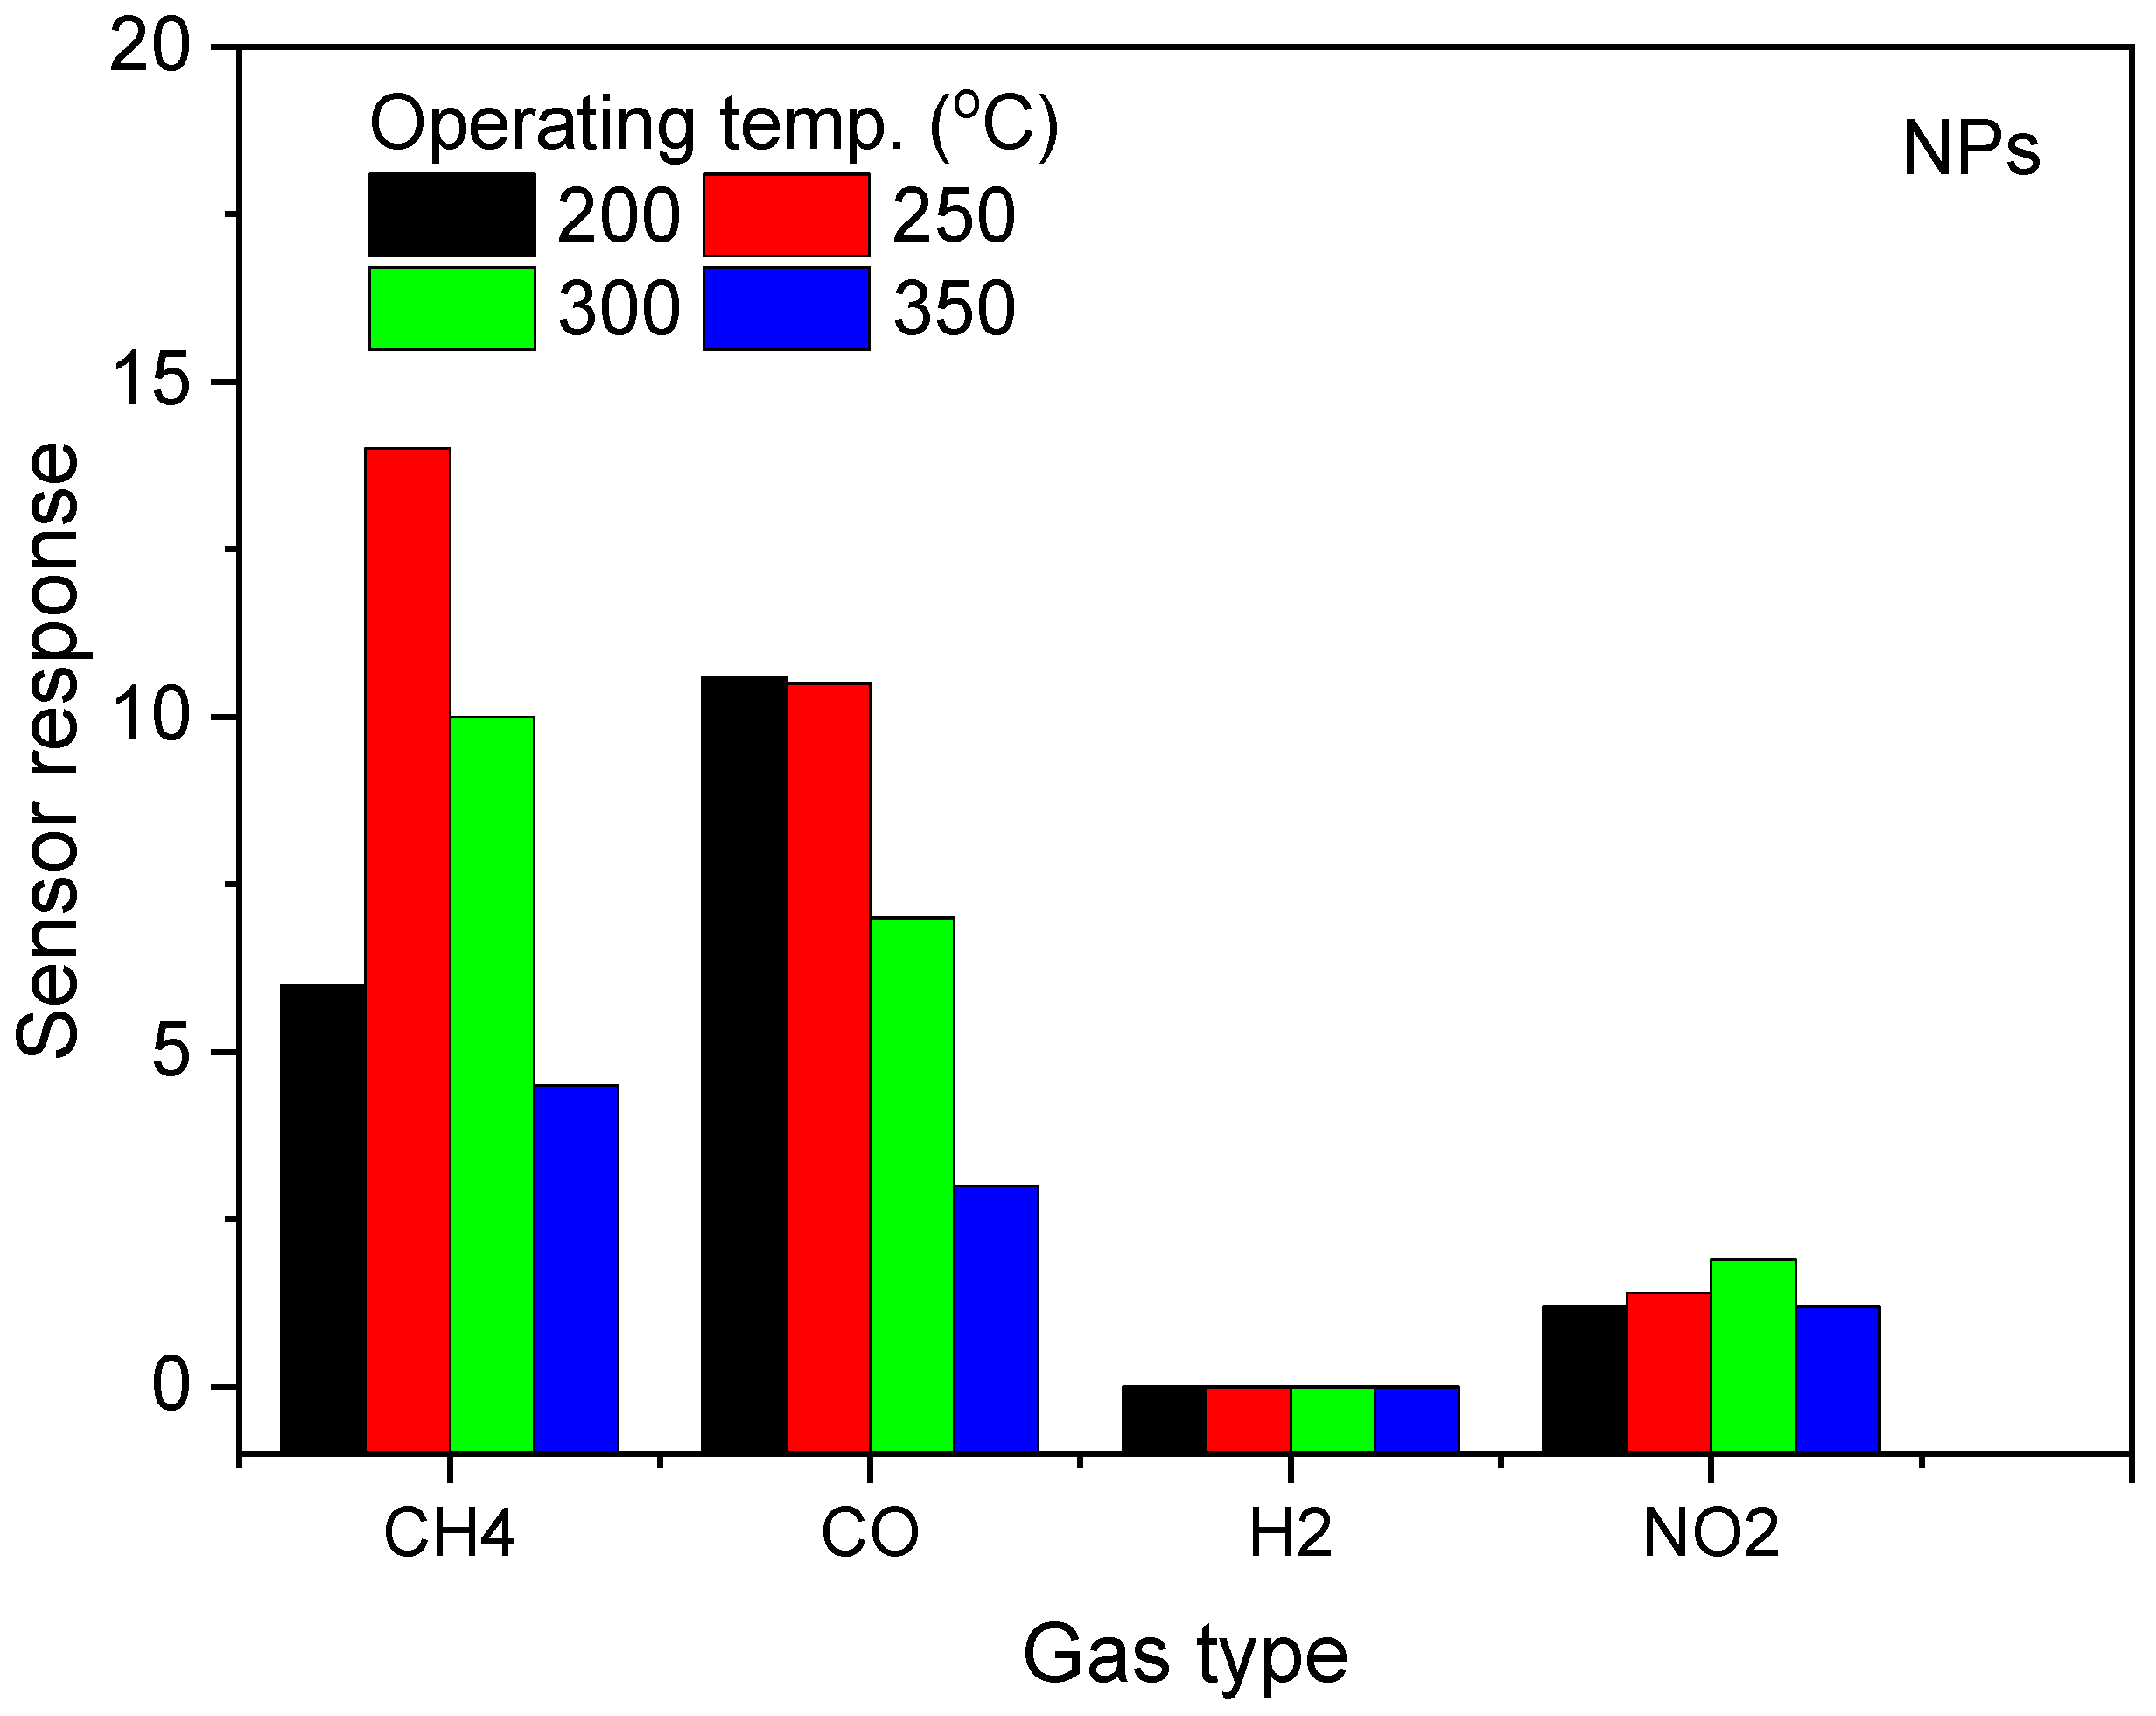
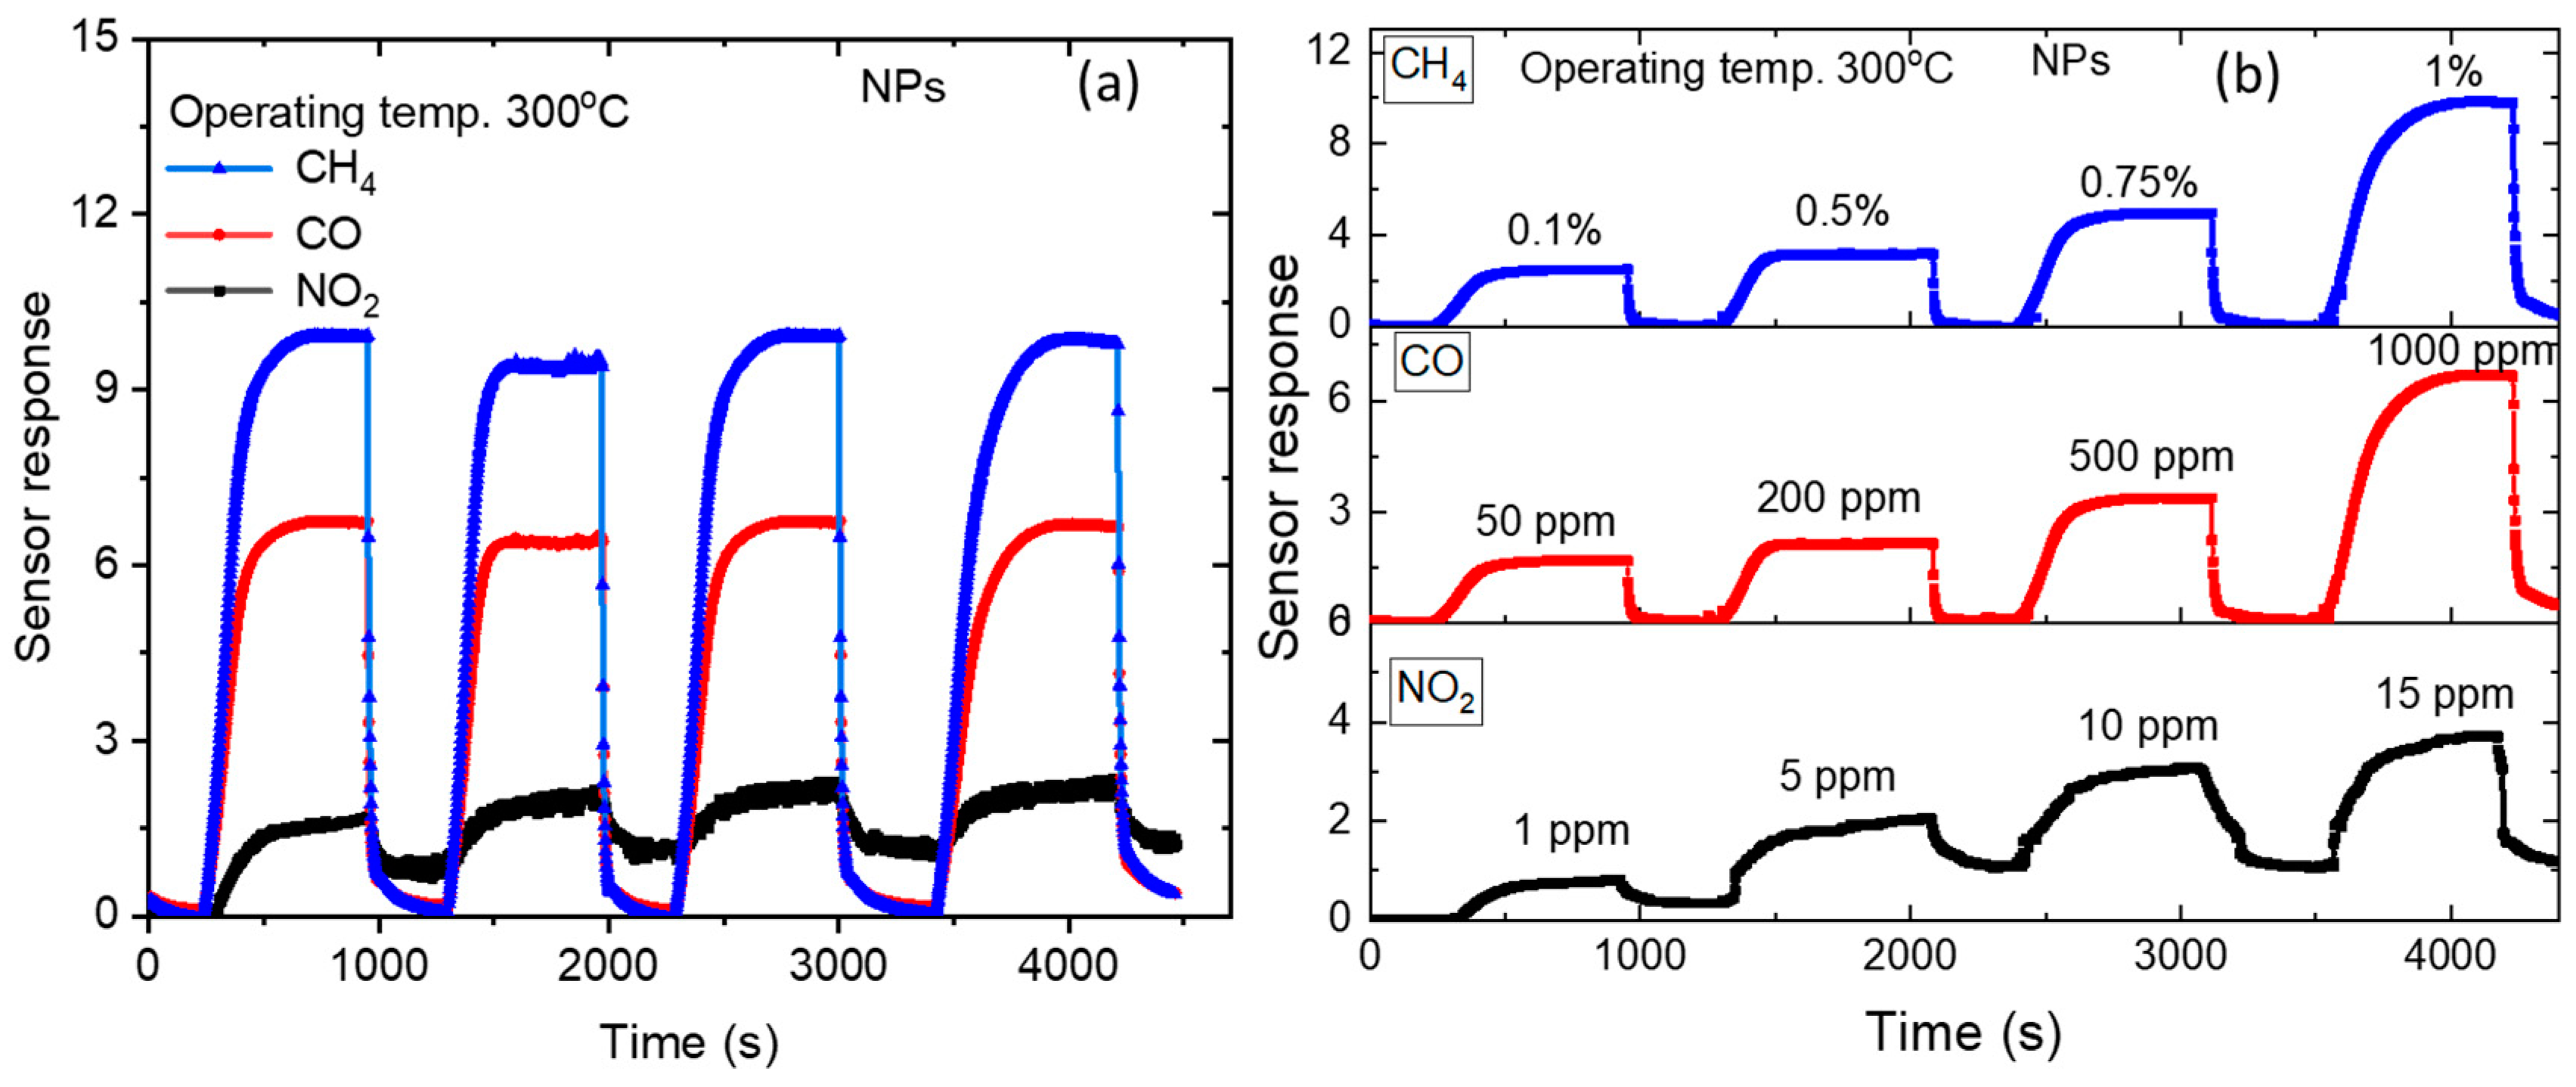
3.2. Gas Sensing Properties of ZnO NPs
4. Conclusions
Author Contributions
Funding
Institutional Review Board Statement
Informed Consent Statement
Data Availability Statement
Conflicts of Interest
References
- Kumar, R.; Kumar, G.; Umar, A. Zinc Oxide Nanostructures for NO2 Gas—Sensor Applications. Nano-Micro Lett. 2015, 7, 97–120. [Google Scholar] [CrossRef] [PubMed]
- Brookes, C.; Wells, P.P.; Cibin, G.; Dimitratos, N.; Jones, W.; Morgan, D.J.; Bowker, M. Molybdenum Oxide on Fe2O3 Core—Shell Catalysts: Probing the Nature of the Structural Motifs Responsible for Methanol Oxidation Catalysis. ACS Catal. 2014, 4, 243–250. [Google Scholar] [CrossRef]
- Roy, P.; Berger, S.; Schmuki, P. TiO2 nanotubes: Synthesis and applications. Angew. Chem. Int. Ed. Engl. 2011, 50, 2904–2939. [Google Scholar] [CrossRef]
- Spencer, M.J.S. Gas sensing applications of 1D-nanostructured zinc oxide: Insights from density functional theory calculations. Prog. Mater. Sci. 2012, 57, 437–486. [Google Scholar] [CrossRef]
- Segets, D.; Gradl, J.; Taylor, R.K.; Vassilev, V.; Peukert, W. Analysis of Optical Absorbance Spectra for the Determination of ZnO Nanoparticle Size Distribution, Solubility, and Surface Energy. ACS Nano 2009, 3, 1703–1710. [Google Scholar] [CrossRef]
- Wang, J.; Cao, J.; Fang, B.; Lu, P.; Deng, S.; Wang, H. Synthesis and characterization of multipod, flower-like, and shuttle-like ZnO frameworks in ionic liquids. Mater. Lett. 2005, 59, 1405–1408. [Google Scholar] [CrossRef]
- Bacaksiz, E.; Parlak, M.; Tomakin, M.; Özçelik, A.; Karakız, M.; Altunbaş, M. The effects of zinc nitrate, zinc acetate and zinc chloride precursors on investigation of structural and optical properties of ZnO thin films. J. Alloys Compd. 2008, 466, 447–450. [Google Scholar] [CrossRef]
- Lee, J.; Tak, Y. Electrodeposition of ZnO on ITO Electrode by Potential Modulation Method. Electrochem. Solid-State Lett. 2001, 4, C63. [Google Scholar] [CrossRef]
- Chen, Y.W.; Liu, Y.C.; Lu, S.X.; Xu, C.S.; Shao, C.L.; Wang, C.; Zhang, J.Y.; Lu, Y.M.; Shen, D.Z.; Fan, X.W. Optical properties of ZnO and ZnO:In nanorods assembled by sol-gel method. J. Chem. Phys. 2005, 123, 134701. [Google Scholar] [CrossRef]
- Lakshmi, B.B.; Dorhout, P.K.; Martin, C.R. Sol−Gel Template Synthesis of Semiconductor Nanostructures. Chem. Mater. 1997, 9, 857–862. [Google Scholar] [CrossRef]
- Park, J.-A.; Moon, J.; Lee, S.-J.; Lim, S.-C.; Zyung, T. Fabrication and characterization of ZnO nanofibers by electrospinning. Curr. Appl. Phys. 2009, 9, S210–S212. [Google Scholar] [CrossRef]
- Rajesh, D.; Vara Lakshmi, B.; Sunandana, C.S. Two-step synthesis and characterization of ZnO nanoparticles. Phys. B Condens. Matter 2012, 407, 4537–4539. [Google Scholar] [CrossRef]
- Wu, J.-J.; Liu, S.-C. Low-Temperature Growth of Well-Aligned ZnO Nanorods by Chemical Vapor Deposition. Adv. Mater. 2002, 14, 215–218. [Google Scholar] [CrossRef]
- Khorsand Zak, A.; Abd Majid, W.H.; Wang, H.Z.; Yousefi, R.; Moradi Golsheikh, A.; Ren, Z.F. Sonochemical synthesis of hierarchical ZnO nanostructures. Ultrason. Sonochem. 2013, 20, 395–400. [Google Scholar] [CrossRef]
- Kooti, M.; Naghdi Sedeh, A. Microwave-Assisted Combustion Synthesis of ZnO Nanoparticles. J. Chem. 2013, 2013, 562028. [Google Scholar] [CrossRef]
- Shetty, A.; Nanda, K.K. Synthesis of zinc oxide porous structures by anodization with water as an electrolyte. Appl. Phys. A 2012, 109, 151–157. [Google Scholar] [CrossRef]
- Kumar, S.S.; Venkateswarlu, P.; Rao, V.R.; Rao, G.N. Synthesis, characterization and optical properties of zinc oxide nanoparticles. Int. Nano Lett. 2013, 3, 30. [Google Scholar] [CrossRef]
- Gunalan, S.; Sivaraj, R.; Rajendran, V. Green synthesized ZnO nanoparticles against bacterial and fungal pathogens. Prog. Nat. Sci. Mater. Int. 2012, 22, 693–700. [Google Scholar] [CrossRef]
- Ain Samat, N.; Md Nor, R. Sol–gel synthesis of zinc oxide nanoparticles using Citrus aurantifolia extracts. Ceram. Int. 2013, 39, S545–S548. [Google Scholar] [CrossRef]
- Rajiv, P.; Rajeshwari, S.; Venckatesh, R. Bio-fabrication of zinc oxide nanoparticles using leaf extract of Parthenium hysterophorus L. and its size-dependent antifungal activity against plant fungal pathogens. Spectrochim. Acta A Mol. Biomol. Spectrosc. 2013, 112, 384–387. [Google Scholar] [CrossRef]
- Pan, X.; Liu, X.; Bermak, A.; Fan, Z. Self-Gating Effect Induced Large Performance Improvement of ZnO Nanocomb Gas Sensors. ACS Nano 2013, 7, 9318–9324. [Google Scholar] [CrossRef]
- Hosseini, Z.S.; Mortezaali, A.; Irajizad, A.; Fardindoost, S. Sensitive and selective room temperature H2S gas sensor based on Au sensitized vertical ZnO nanorods with flower-like structures. J. Alloys Compd. 2015, 628, 222–229. [Google Scholar] [CrossRef]
- Guo, W.; Liu, T.; Zhang, H.; Sun, R.; Chen, Y.; Zeng, W.; Wang, Z. Gas-sensing performance enhancement in ZnO nanostructures by hierarchical morphology. Sens. Actuators B Chem. 2012, 166–167, 492–499. [Google Scholar] [CrossRef]
- Bai, S.; Guo, T.; Zhao, Y.; Sun, J.; Li, D.; Chen, A.; Liu, C.C. Sensing performance and mechanism of Fe-doped ZnO microflowers. Sens. Actuators B Chem. 2014, 195, 657–666. [Google Scholar] [CrossRef]
- Guo, W.; Liu, T.; Wang, J.; Yu, W.; Sun, R.; Chen, Y.; Hussain, S.; Peng, X.; Wang, Z. Hierarchical ZnO porous microspheres and their gas-sensing properties. Ceram. Int. 2013, 39, 5919–5924. [Google Scholar] [CrossRef]
- Roy, S.; Banerjee, N.; Sarkar, C.K.; Bhattacharyya, P. Development of an ethanol sensor based on CBD grown ZnO nanorods. Solid-State Electron. 2013, 87, 43–50. [Google Scholar] [CrossRef]
- Tarwal, N.L.; Rajgure, A.V.; Patil, J.Y.; Khandekar, M.S.; Suryavanshi, S.S.; Patil, P.S.; Gang, M.G.; Kim, J.H.; Jang, J.H. A selective ethanol gas sensor based on spray-derived Ag–ZnO thin films. J. Mater. Sci. 2013, 48, 7274–7282. [Google Scholar] [CrossRef]
- Chen, X.; Liu, J.; Jing, X.; Wang, J.; Song, D.; Liu, L. Self-assembly of ZnO nanosheets into flower-like architectures and their gas sensing properties. Mater. Lett. 2013, 112, 23–25. [Google Scholar] [CrossRef]
- Luo, J.; Ma, S.Y.; Li, F.M.; Li, X.B.; Li, W.Q.; Cheng, L.; Mao, Y.Z.; Gz, D.J. The mesoscopic structure of flower-like ZnO nanorods for acetone detection. Mater. Lett. 2014, 121, 137–140. [Google Scholar] [CrossRef]
- Kim, K.-M.; Kim, H.-R.; Choi, K.-I.; Kim, H.-J.; Lee, J.-H. ZnO hierarchical nanostructures grown at room temperature and their C2H5OH sensor applications. Sensors Actuators B Chem. 2011, 155, 745–751. [Google Scholar] [CrossRef]
- Wei, S.; Wang, S.; Zhang, Y.; Zhou, M. Different morphologies of ZnO and their ethanol sensing property. Sens. Actuators B Chem. 2014, 192, 480–487. [Google Scholar] [CrossRef]
- Miao, X.-J.; Zhao, X.-J.; Qin, H.; Jin, Q.; Chen, Y.; Cao, Z.-Q.; Yang, W.-T.; Wang, Q.-J.; Pan, Q.-H. Synergistic effect of cubic C3N4/ZnO/C hybrid composite for selective detection of sulfur dioxide. Rare Met. 2022, 41, 3662–3670. [Google Scholar] [CrossRef]
- Del Zompo, F.; Ojetti, V.; Feliciani, D.; Mangiola, F.; Petruzziello, C.; Tesori, V.; Gaetani, E.; Gasbarrini, A.; Franceschi, F. Helicobacter pylori infection is associated with high methane production during lactulose breath test. Eur. Rev. Med. Pharmacol. Sci. 2016, 20, 3452–3456. [Google Scholar]
- Coskun, A.; Demirci, B.; Turkdogan, K.A. Association of carbon monoxide poisonings and carboxyhemoglobin levels with COVID-19 and clinical severity. World J. Methodol. 2023, 13, 248–258. [Google Scholar] [CrossRef]
- Chatterjee, S.; Park, S.; Low, K.; Kong, Y.; Pimentel, M. The degree of breath methane production in IBS correlates with the severity of constipation. Am. J. Gastroenterol. 2007, 102, 837–841. [Google Scholar] [CrossRef]
- Attaluri, A.; Jackson, M.; Valestin, J.; Rao, S.S.C. Methanogenic flora is associated with altered colonic transit but not stool characteristics in constipation without IBS. Am. J. Gastroenterol. 2010, 105, 1407–1411. [Google Scholar] [CrossRef]
- Mathur, R.; Amichai, M.; Chua, K.S.; Mirocha, J.; Barlow, G.M.; Pimentel, M. Methane and hydrogen positivity on breath test is associated with greater body mass index and body fat. J. Clin. Endocrinol. Metab. 2013, 98, E698–E702. [Google Scholar] [CrossRef]
- Basseri, R.J.; Basseri, B.; Pimentel, M.; Chong, K.; Youdim, A.; Low, K.; Hwang, L.; Soffer, E.; Chang, C.; Mathur, R. Intestinal methane production in obese individuals is associated with a higher body mass index. Gastroenterol. Hepatol. 2012, 8, 22–28. [Google Scholar]
- Patterson, A.L. The scherrer formula for X-ray particle size determination. Phys. Rev. 1939, 56, 978–982. [Google Scholar] [CrossRef]
- Zhang, X.; Liu, Y.; Chen, S. A novel method for measuring distribution of orientation of one-dimensional ZnO using resonance Raman spectroscopy. J. Raman Spectrosc. 2005, 36, 1101–1105. [Google Scholar] [CrossRef]
- Zhang, R.; Yin, P.-G.; Wang, N.; Guo, L. Photoluminescence and Raman scattering of ZnO nanorods. Solid State Sci. 2009, 11, 865–869. [Google Scholar] [CrossRef]
- Damen, T.C.; Porto, S.P.S.; Tell, B. Raman Effect in Zinc Oxide. Phys. Rev. 1966, 142, 570–574. [Google Scholar] [CrossRef]
- Calleja, J.M.; Cardona, M. Resonant Raman scattering in ZnO. Phys. Rev. B 1977, 16, 3753–3761. [Google Scholar] [CrossRef]
- Ruhland, B.; Becker, T.; Müller, G. Gas-kinetic interactions of nitrous oxides with SnO2 surfaces. Sens. Actuators B Chem. 1998, 50, 85–94. [Google Scholar] [CrossRef]
- Shaalan, N.M.; Yamazaki, T.; Kikuta, T. Influence of morphology and structure geometry on NO2 gas-sensing characteristics of SnO2 nanostructures synthesized via a thermal evaporation method. Sensors Actuators B Chem. 2011, 153, 11–16. [Google Scholar] [CrossRef]
- Koziej, D.; Thomas, K.; Barsan, N.; Thibault-Starzyk, F.; Weimar, U. Influence of annealing temperature on the CO sensing mechanism for tin dioxide based sensors—Operando studies. Catal. Today 2007, 126, 211–218. [Google Scholar] [CrossRef]
- Haridas, D.; Gupta, V. Enhanced response characteristics of SnO2 thin film based sensors loaded with Pd clusters for methane detection. Sens. Actuators B Chem. 2012, 166–167, 156–164. [Google Scholar] [CrossRef]
- Shaalan, N.M.; Hamad, D.; Aljaafari, A.; Abdel-Latief, A.Y.; Abdel-Rahim, M.A. Preparation and Characterization of Developed CuxSn1−xO2 Nanocomposite and Its Promising Methane Gas Sensing Properties. Sensors 2019, 19, 2257. [Google Scholar] [CrossRef]
- Shaalan, N.M.; Morsy, A.E.A.; Abdel-Rahim, M.A.; Rashad, M. Simple preparation of Ni/CuO nanocomposites with superior sensing activity toward the detection of methane gas. Appl. Phys. A 2021, 127, 455. [Google Scholar] [CrossRef]
- Hjiri, M.; Bahanan, F.; Aida, M.S.; El Mir, L.; Neri, G. High Performance CO Gas Sensor Based on ZnO Nanoparticles. J. Inorg. Organomet. Polym. Mater. 2020, 30, 4063–4071. [Google Scholar] [CrossRef]
- Aljaafari, A.; Ahmed, F.; Awada, C.; Shaalan, N.M. Flower-Like ZnO Nanorods Synthesized by Microwave-Assisted One-Pot Method for Detecting Reducing Gases: Structural Properties and Sensing Reversibility. Front. Chem. 2020, 8, 456. [Google Scholar] [CrossRef]
- Shaalan, N.M.; Yamazaki, T.; Kikuta, T. Effect of micro-electrode geometry on NO2 gas-sensing characteristics of one-dimensional tin dioxide nanostructure microsensors. Sens. Actuators B Chem. 2011, 156, 784–790. [Google Scholar] [CrossRef]
- Zhang, Y.; Li, Z. Effects of pH on High-Performance ZnO Resistive Humidity Sensors Using One-Step Synthesis. Sensors 2019, 19, 5267. [Google Scholar] [CrossRef]
- Sonker, R.K.; Yadav, B.C.; Sharma, A.; Tomar, M.; Gupta, V. Experimental investigations on NO2 sensing of pure ZnO and PANI–ZnO composite thin films. RSC Adv. 2016, 6, 56149–56158. [Google Scholar] [CrossRef]
- Öztürk, S.; Kılınç, N.; Öztürk, Z.Z. Fabrication of ZnO nanorods for NO2 sensor applications: Effect of dimensions and electrode position. J. Alloys Compd. 2013, 581, 196–201. [Google Scholar] [CrossRef]
- Shi, L.; Naik, A.J.T.; Goodall, J.B.M.; Tighe, C.; Gruar, R.; Binions, R.; Parkin, I.; Darr, J. Highly Sensitive ZnO Nanorod- and Nanoprism-Based NO2 Gas Sensors: Size and Shape Control Using a Continuous Hydrothermal Pilot Plant. Langmuir 2013, 29, 10603–10609. [Google Scholar] [CrossRef]
- An, S.; Park, S.; Ko, H.; Jin, C.; Lee, W.I.; Lee, C. Enhanced gas sensing properties of branched ZnO nanowires. Thin Solid Films 2013, 547, 241–245. [Google Scholar] [CrossRef]
- Sadek, A.Z.; Wlodarski, W.; Kalantar-zadeh, K.; Choopun, S. ZnO Nanobelt Based Conductometric H2 and NO2 Gas Sensors. In Proceedings of the Sensors, Irvine, CA, USA, 30 October—3 November 2005; pp. 1326–1329. [Google Scholar]
- Pawar, R.C.; Lee, J.-W.; Patil, V.B.; Lee, C.S. Synthesis of multi-dimensional ZnO nanostructures in aqueous medium for the application of gas sensor. Sens. Actuators B Chem. 2013, 187, 323–330. [Google Scholar] [CrossRef]
- Chougule, M.A.; Sen, S.; Patil, V.B. Fabrication of nanostructured ZnO thin film sensor for NO2 monitoring. Ceram. Int. 2012, 38, 2685–2692. [Google Scholar] [CrossRef]
- Calestani, D.; Zha, M.; Mosca, R.; Zappettini, A.; Carotta, M.C.; Di Natale, V.; Zanotti, L. Growth of ZnO tetrapods for nanostructure-based gas sensors. Sens. Actuators B Chem. 2010, 144, 472–478. [Google Scholar] [CrossRef]
- Fomekong, R.L.; Saruhan, B. Influence of humidity on NO2-sensing and selectivity of spray-CVD grown ZnO thin film above 400 °C. Chemosensors 2019, 7, 42. [Google Scholar] [CrossRef]
- Ryu, H.W.; Park, B.S.; Akbar, S.A.; Lee, W.S.; Hong, K.J.; Seo, Y.J.; Shin, D.C.; Park, J.S.; Chio, G.P. ZnO sol-gel derived porous film for CO gas sensing. Sens. Actuators B Chem. 2003, 96, 717–722. [Google Scholar] [CrossRef]
- Krishnakumar, T.; Jayaprakash, R.; Pinna, N.; Donato, N.; Bonavita, A.; Micali, G.; Neri, G. CO gas sensing of ZnO nanostructures synthesized by an assisted microwave wet chemical route. Sens. Actuators B Chem. 2009, 143, 198–204. [Google Scholar] [CrossRef]
- Lim, S.K.; Hwang, S.H.; Kim, S.; Park, H. Preparation of ZnO nanorods by microemulsion synthesis and their application as a CO gas sensor. Sens. Actuators B Chem. 2011, 160, 94–98. [Google Scholar] [CrossRef]
- Karaduman, I.; Yıldırım, M.A.; Yıldırım, S.T.; Ateş, A.; Özdemir, Y.A.; Acar, S. The effect of different doping elements on the CO gas sensing properties of ZnO nanostructures. J. Mater. Sci. Mater. Electron. 2017, 28, 18154–18163. [Google Scholar] [CrossRef]
- Vijayakumar; Shivaraj, B.W.; Manjunatha, C.; Abhishek, B.; Nagaraju, G.; Panda, P.K. Hydrothermal synthesis of ZnO nanotubes for CO gas sensing. Sens. Int. 2020, 1, 100018. [Google Scholar] [CrossRef]
- Wang, Y.; Cui, Y.; Meng, X.; Zhang, Z.; Cao, J. A gas sensor based on Ag-modified ZnO flower-like microspheres: Temperature-modulated dual selectivity to CO and CH4. Surf. Interfaces 2021, 24, 101110. [Google Scholar] [CrossRef]
- Gruber, D.; Kraus, F.; Müller, J. A novel gas sensor design based on CH4/H2/H2O plasma etched ZnO thin films. Sens. Actuators B Chem. 2003, 92, 81–89. [Google Scholar] [CrossRef]
- Bhattacharyya, P.; Basu, P.K.; Mondal, B.; Saha, H. A low power MEMS gas sensor based on nanocrystalline ZnO thin films for sensing methane. Microelectron. Reliab. 2008, 48, 1772–1779. [Google Scholar] [CrossRef]
- Chen, T.P.; Chang, S.P.; Hung, F.Y.; Chang, S.J.; Hu, Z.S.; Chen, K.J. Simple fabrication process for 2D ZnO nanowalls and their potential application as a methane sensor. Sensors 2013, 13, 3941–3950. [Google Scholar] [CrossRef]
- Teimoori, F.; Khojier, K.; Dehnavi, N.Z. Investigation on the Electrical and Methane Gas-Sensing Properties of ZnO Thin Films Produced by Different Methods. J. Electron. Mater. 2016, 45, 4881–4889. [Google Scholar] [CrossRef]

| Temp | 200 °C | 250 °C | 300 °C | 350 °C | ||||
|---|---|---|---|---|---|---|---|---|
| Gases | τres (s) | τrec (s) | τres (s) | τrec (s) | τres (s) | τrec (s) | τres (s) | τrec (s) |
| CH4 | 300 | 350 | 140 | 109 | 137 | 41 | 130 | 22 |
| CO | 290 | 279 | 160 | 58 | 158 | 33 | 160 | 11 |
| NO2 | >600 | 142 | 200 | 27 | 204 | 22 | 235 | 16 |
| ZnO Material | Operating Temp. (°C) | Gas (Concentration) | Response/Sensitivity ΔR/R | Refs. |
|---|---|---|---|---|
| NO2 gas (ppm) | ||||
| Nanorods | 200 | 1.0 | 0.3 | [55] |
| 350 | 10 | 130.0 | [56] | |
| Nanowires | 300 | 2 | 18.7 | [57] |
| Nanobelt | 350 | 10 | 0.81 | [58] |
| Nanoneedle | 200 | 200 | 0.64 | [59] |
| Nanoparticles | 200 | 100 | 0.37 | [60] |
| Nanotetrapods | 300 | 20 | 20.0 | [61] |
| Thin film | 450 | 200 | 90.0 | [62] |
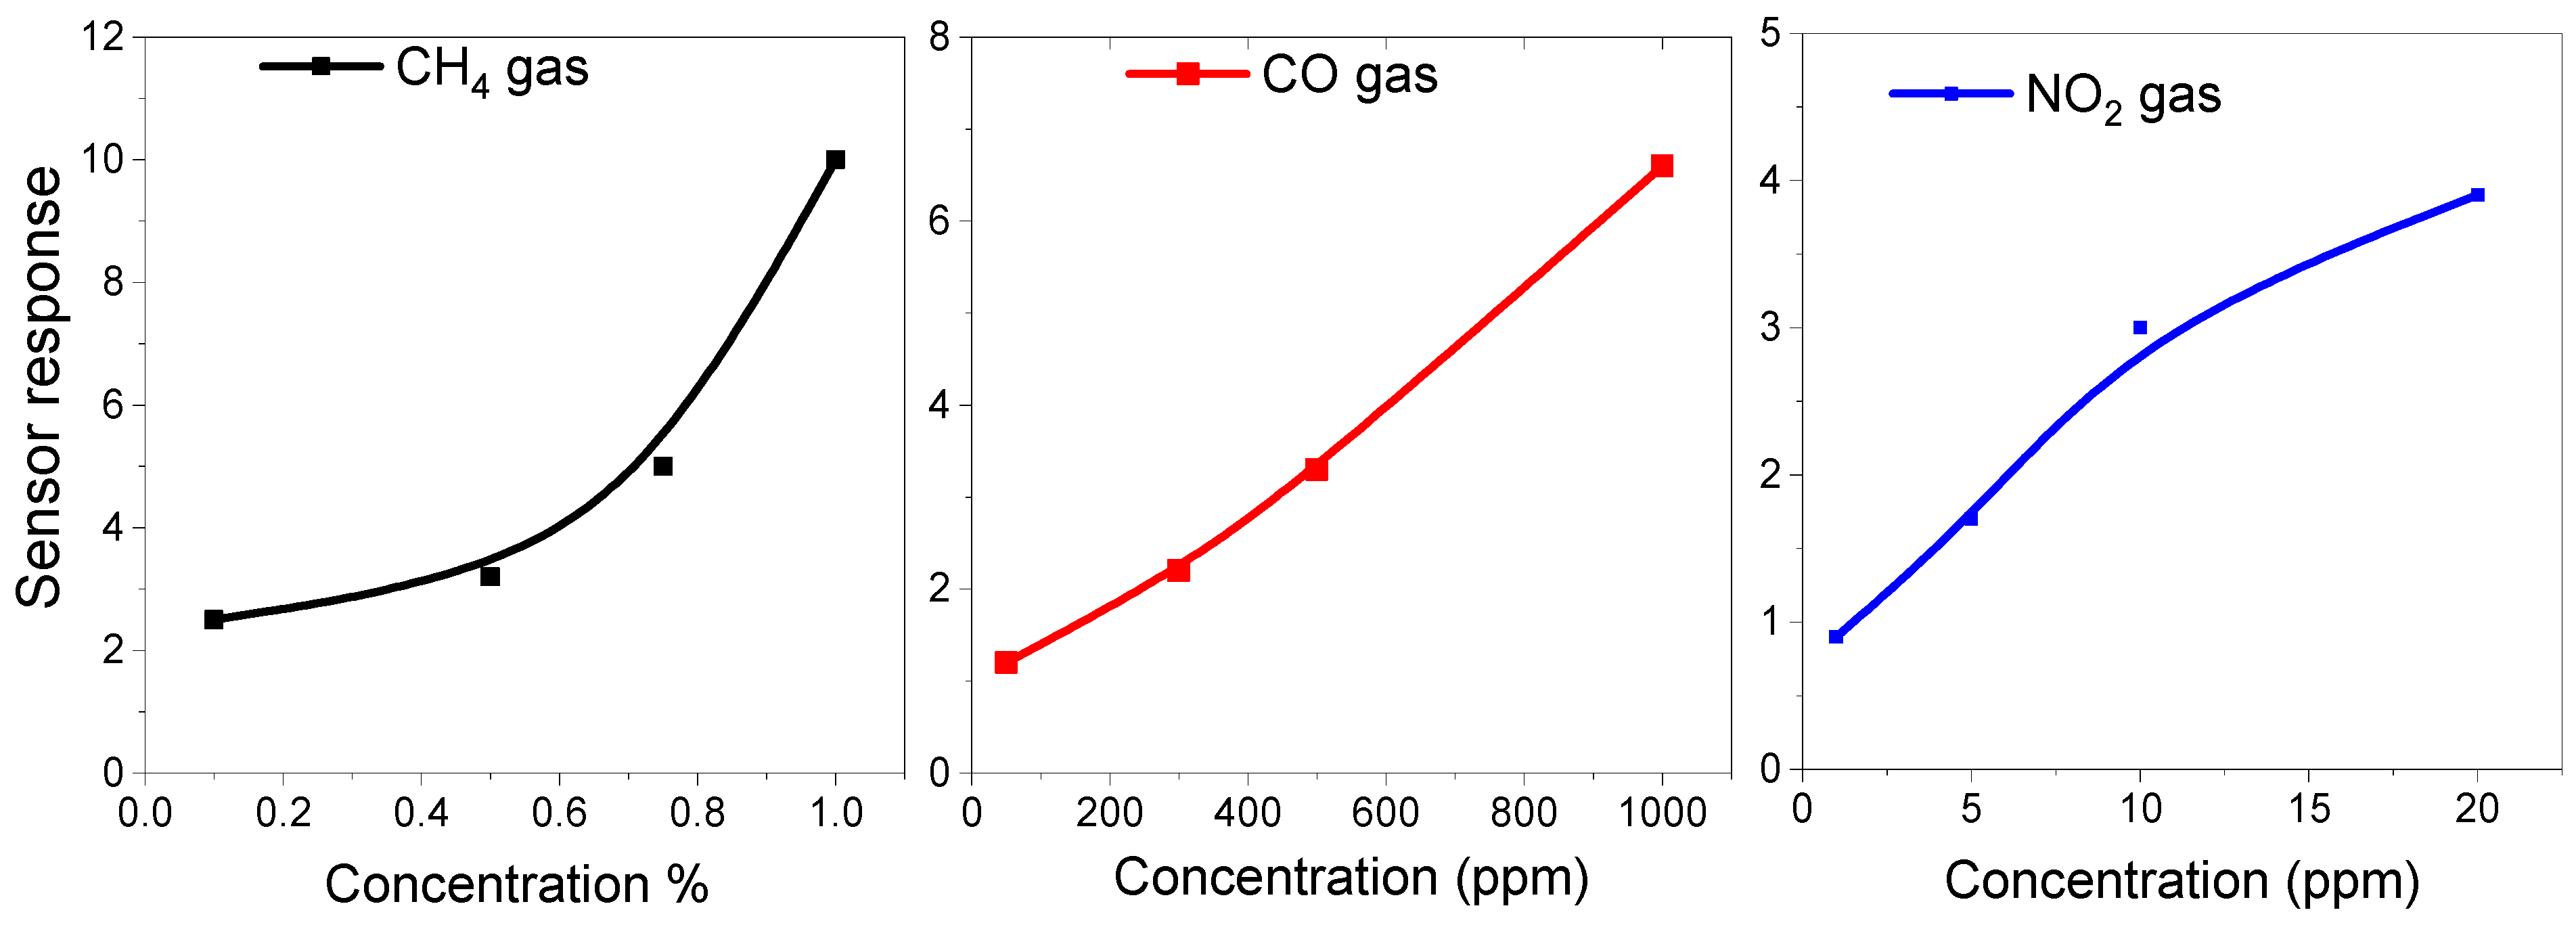
| Nanoparticles | 300 | 5 | 1.9 | Present work |
| 1 | 0.9 | |||
| 5 | 1.7 | |||
| 10 | 3 | |||
| 20 | 3.9 | |||
| CO gas (ppm) | ||||
| Thin film | 450 | 200 | 88.0 | [62] |
| Nanoparticles | 350 | 250 | 7.0 | [63] |
| Nanoflowers | 300 | 200 | 8.0 | [64] |
| Nanorods | 300 | 100 | 49.0 | [65] |
| Nanoparticles | 110 | 100 | 0.3 | [66] |
| Nanotubes | RT | 6 | 0.18 | [67] |
| Nanoparticles | 250 | 80 | 2.8 | [50] |
| Microspheres | 150 | 100 | 14 | [68] |
| Nanoparticles | 200 | 1000 | 10.6 | Present work |
| 300 | 50 | 1.2 | ||
| 300 | 2.2 | |||
| 500 | 3.3 | |||
| 1000 | 6.6 | |||
| CH4 gas (%) | ||||
| Microstructure | 314 | 0.5 | 1.8 | [69] |
| Nanocrystals | 250 | 1.0 | 0.87 | [70] |
| Nanowalls | 300 | 0.3 | 8.1 | [71] |
| Thin film | 350 | 1.0 | 0.6 | [72] |
| Microspheres | 200 | 0.5 | 7.0 | [68] |
| Nanoparticles | 250 | 1 | 14 | Present work |
| 300 | 0.1 | 2.5 | ||
| 0.5 | 3.2 | |||
| 0.75 | 5 | |||
| 1 | 10 | |||
Disclaimer/Publisher’s Note: The statements, opinions and data contained in all publications are solely those of the individual author(s) and contributor(s) and not of MDPI and/or the editor(s). MDPI and/or the editor(s) disclaim responsibility for any injury to people or property resulting from any ideas, methods, instructions or products referred to in the content. |
© 2024 by the authors. Licensee MDPI, Basel, Switzerland. This article is an open access article distributed under the terms and conditions of the Creative Commons Attribution (CC BY) license (https://creativecommons.org/licenses/by/4.0/).
Share and Cite
Khan, M.W.A.; Shaalan, N.M.; Ahmed, F.; Sherwani, S.; Aljaafari, A.; Alsukaibi, A.K.D.; Alenezi, K.M.; Al-Motair, K. Gas Sensing Performance of Zinc Oxide Nanoparticles Fabricated via Ochradenus baccatus Leaf. Chemosensors 2024, 12, 28. https://doi.org/10.3390/chemosensors12020028
Khan MWA, Shaalan NM, Ahmed F, Sherwani S, Aljaafari A, Alsukaibi AKD, Alenezi KM, Al-Motair K. Gas Sensing Performance of Zinc Oxide Nanoparticles Fabricated via Ochradenus baccatus Leaf. Chemosensors. 2024; 12(2):28. https://doi.org/10.3390/chemosensors12020028
Chicago/Turabian StyleKhan, Mohd Wajid Ali, Nagih M. Shaalan, Faheem Ahmed, Subuhi Sherwani, Abdullah Aljaafari, Abdulmohsen K. D. Alsukaibi, Khalaf M. Alenezi, and Khalid Al-Motair. 2024. "Gas Sensing Performance of Zinc Oxide Nanoparticles Fabricated via Ochradenus baccatus Leaf" Chemosensors 12, no. 2: 28. https://doi.org/10.3390/chemosensors12020028
APA StyleKhan, M. W. A., Shaalan, N. M., Ahmed, F., Sherwani, S., Aljaafari, A., Alsukaibi, A. K. D., Alenezi, K. M., & Al-Motair, K. (2024). Gas Sensing Performance of Zinc Oxide Nanoparticles Fabricated via Ochradenus baccatus Leaf. Chemosensors, 12(2), 28. https://doi.org/10.3390/chemosensors12020028