Review

The Art of Fluorescence Imaging with Chemical Sensors: The Next Decade 2012–2022

by
Michael Schäferling
* and
Vladimir Ondrus
Laboratory for Photonic Materials, Department of Chemical Engineering, FH Münster University of Applied Sciences, Stegerwaldstr. 39, 48565 Steinfurt, Germany
*
Author to whom correspondence should be addressed.
Chemosensors 2024, 12(3), 31; https://doi.org/10.3390/chemosensors12030031
Submission received: 28 November 2023 / Revised: 8 February 2024 / Accepted: 16 February 2024 / Published: 23 February 2024
(This article belongs to the Special Issue Fluorescent Probe for Sensing and Bioimaging)

Abstract

:
Imaging methods by the means of optical sensors are applied in diverse scientific areas such as medical research and diagnostics, aerodynamics, environmental analysis, or marine research. After a general introduction to the field, this review is focused on works published between 2012 and 2022. The covered topics include planar sensors (optrodes), nanoprobes, and sensitive coatings. Advanced sensor materials combined with imaging technologies enable the visualization of parameters which exhibit no intrinsic color or fluorescence, such as oxygen, pH, CO2, H2O2, Ca2+, or temperature. The progress on the development of multiple sensors and methods for referenced signal read out is also highlighted, as is the recent progress in device design and application formats using model systems in the lab or methods for measurements’ in the field.

1. Introduction

Fluorescence imaging in combination with optical chemical sensors has become a powerful analytical tool that enables the visualization and quantification of chemical species within a sample or on sample surfaces. By the use of fluorescent sensor parameters which exhibit no intrinsic color or fluorescence, e.g., oxygen, pH, CO2, and H2O2, various metal cations or temperature can be imaged. This topic was extensively reviewed last time in 2012 [1]. Therefore, it is well-founded to now summarize the progress in this highly interdisciplinary field over the past ten years.
The chemical sensors considered in this review contain two basic components connected in series: a chemical or molecular recognition system (receptor or molecular probe) and a physicochemical transducer [2]. Photoluminescent probes can synergize the molecular recognition system with the signal transduction mechanism in one molecule. They have the advantage that they can be delivered directly into the sample, even in living tissue or cells, and detected by remote sensing and imaging methods from outside. The selectivity and sensitivity of the response can be optimized by the encapsulation of the dyes in polymer nanoparticles, which paves the way for a target-specific nanosensors [3]. In addition, inorganic luminescent nanoparticles based on gold, carbon, semiconductor quantum dots, or photon upconversion crystals were modified to obtain nanosensors for various applications [4].
This review updates the state of the art in photoluminescence (fluorescence or phosphorescence) sensing and imaging, discussing the developments in diverse scientific areas, particularly medical and pharmaceutical research, aerodynamics, material science, and marine research. Optical imaging in this context mainly involves fluorescence microscopy, fluorescence scanning systems, and the application of planar optrodes in combination with CMOS or CCD cameras. The main focus of this overview is set on the integration of sensitive fluorescent probes into sensor materials, as well as on multiple sensors and methods for referenced signal read out. It covers the work published in the past ten years (2012–2022) and is, after discussing some general aspects, structured according to different fields of application.
The first part of the overlook will highlight planar sensors, which are often termed as planar opt(r)odes. Koren and Zieger reviewed the use of such optrodes in chemical imaging [5]. Thereafter, the use of fluorescent nanoparticles in biomedical imaging techniques will be highlighted. The second main topic will be environmental analysis and marine research, and the third will be aerodynamics using pressure and temperature-sensitive paints. Because of the large extent of the work published in this context, this review will be restricted to photoluminescent sensor materials, i.e., planar optrodes and nano- or microparticles, and sensor coatings, whose applicability has been demonstrated by the means of imaging methods. The development of new molecular probes is only considered if they have been applied in this manner. Fiber optic sensors are not included. The same is the case for nano thermometry used in bioimaging, which was reviewed recently [6]. The integration of optical chemical sensors into microfluidic systems is a new emerging approach which has aroused high interest [7]. However, this topic would exceed the scope of this article and will be reviewed separately.

2. General Aspects and Imaging Systems

Fluorescent sensor materials frequently consist of a polymer binder including indicator dyes, which should be permeable to the analyte. Alternatively, polymeric nanoprobes can be applied to imaging analysis. Simple fluorescence imaging systems consist of a light source, usually an array of light-emitting diodes (LEDs), a set of optical filters and beam splitters (dichroic mirrors) separating excitation light from luminescent light, a camera (CCD or CMOS), and a computer-aided control unit for the optoelectronic system with software for image processing. Scanner systems are equipped with several lasers, a movable x/y stage, and a photomultiplier tube (PMT) as a detector [1].
In the ideal case, a fluorescent sensor responds reversibly and fast (within a few seconds to few minutes) to changing analyte concentrations, which enables the visualization of the distribution of an analyte in a sample with a high spatial and temporal resolution. In fact, some sensors are capable of responding in the microsecond range, particularly in the case of oxygen- or temperature-sensitive probes used for instationary pressure and temperature measurements on surfaces. As the excitation of the fluorophores and fluorescence imaging can be performed in a remote way, optrodes or nanoprobes can be applied in a nondestructive way with a low impact on the sample. This paves the way for tracking chemical species in living systems.
The imaging of fluorescent probes and sensors is an important method in the field of chemical imaging, but photobleaching, light scatter, autofluorescence of the sample, and inhomogeneous illumination and unsteadiness of the light source can falsify the results. Hence, referenced methods are preferred in fluorescence sensor technology because they enable the elimination of these interferences. Referencing can be based on ratiometric measurements, e.g., by the addition of reference dyes or the application of dual wavelength (2-λ) probes [8].
Intensity-based imaging is, therefore, usually carried out in a ratiometric manner, where the signals from the probe and reference are separated by optical filters. Fluorescence lifetime imaging (FLIM) is another highly valuable internally referenced technique. Methods for lifetime determination can be classified into time domain and frequency domain techniques and have been reviewed several times [1,8,9,10]. FLIM is the preferred technique to obtain robust and referenced quantitative data, and many camera systems use time domain measurements. However, it was demonstrated in a comparative study that frequency-domain-based camera systems are a valuable alternative for the read out of chemical sensors by testing different sensors with different indicator dyes for O2 and pH imaging in environmental samples [11].
It is noticeable that digital color cameras with RGB pixels have been applied more and more as alternatives to scientific CCD or CMOS cameras for 2D sensor read outs. A comparative study revealed that RGB cameras can be used for certain sensor applications. However, a quantitative evaluation of a typical oxygen sensor based on PtTFPP in polystyrene showed only a limited analytical sensitivity compared to luminescence lifetime imaging and ratiometric imaging utilizing a CCD camera [12].
Hakonen et al. compared intensity-, ratiometric-, and hue-based quantification in chemical imaging [13]. HSV (Hue, Saturation, Value) is a commonly used cylindrical color space in digital imaging. They used the fluorescent pH-sensitive dye di-hydroxypyrene-di-sulphonate, which was immobilized to quaternary ammonium functionalized ion exchange microparticles. These were dispersed in aqueous solutions between pH 5 and 10 and imaged with a simple digital camera and a CMOS color camera. It was demonstrated that hue quantification is superior to ratiometric- and intensity-based methods regarding accuracy and precision.
In hyperspectral imaging, the recorded luminescence signal is divided into a high number of spectral bands, giving complete spectral information from every pixel of the camera. These collect information as a set of images, each consisting of a narrow wavelength range. Single images can be combined to form a three-dimensional hyperspectral cube of data. Hence, the chemical imaging of multiple luminescent indicator dyes can be processed by hyperspectral imaging in combination with the signal deconvolution of overlapping emission spectra [14]. By the means of a least-squares fit, the percent contribution of the different indicator dyes compared to the total measured signal can be determined. A sensor for O2 was evaluated as a proof of concept, which was composed of red-emitting Pd(II)/Pt(II) porphyrins and NIR-emitting Pd(II)/Pt(II) benzoporphyrins. It showed a broad dynamic range from 0 to 950 hPa using a hyperspectral camera (470–900 nm) with a four-channel RGB-NIR system. Macrolex Fluorescence Yellow (MFY 10GN) was added as a reference dye. The sensor foils were prepared by the immobilization of the dyes in polystyrene. The used hyperspectral camera can record up to 150 spectral bands in a wavelength range from 470 to 900 nm by moving a filter plate in front of the camera chip.

3. Biomedical Imaging and Tissue Engineering

Oxygen, pH, CO2, and some metal cations such Ca2+, Mg2+, and K+ are the most important analytes which are targeted by fluorescent chemical sensors. Almost all living organisms utilize oxygen for energy generation and respiration. Since pO2 is significantly reduced in tumorous tissue, the imaging of oxygen distribution by the means of optical sensors is a useful tool in cancer research. Generally, hypoxia is a pathological condition in which different regions of the body can suffer from an insufficient oxygen supply at the tissue level, which can be connected to various diseases. Decreased pO2 or an imbalance between oxygen supply and demand may lead to pathological states and, ultimately, death of the cell and the whole organism. Therefore, there is a high demand for imaging sensors for pO2 in biomedical research and diagnostics. Wang and Wolfbeis summarized the field of optical oxygen sensors extensively in 2014 [15]. Papkovsky and Dmitriev highlighted the phosphorescence-quenching mechanisms and biomedical applications of typical oxygen-sensitive fluorophores [16]. They discussed applications of oxygen sensors to enzymatic assays for the analysis of the respiration of mammalian and microbial cells, small organisms, and plants and for the monitoring of oxygenation in cell cultures and 3D models of live tissue. The same authors also compared the applicability of oxygen-sensitive molecular probes for cellular imaging concerning their brightness, staining efficiency, toxicity, photostability, cell specificity, and sensing performance [17].
In diseased tissue, the pH is also reduced, whereas it is increased in wound skin. Therefore, photoluminescent methods for imaging of pH are a valuable tool in medical research and diagnostics [18], as pH impacts the structure and function of all biologically active macromolecules, particularly proteins. Many cellular dysfunctions are characterized by a pathological acidic pH [19], including cancer [20] and Alzheimer’s disease [21]. Cellular compartments such as endosomes or lysosomes are also characterized by a reduced pH between 6 and 4 [22]. The monitoring of pH changes can help to reveal cellular internalization processes such as phagocytosis [23], endocytosis [24], or receptor-mediated internalization [25].
The pKa value of the indicator determines the working range of a luminescent pH sensor. The relevant interval for intracellular measurements is between pH 7.4 and 4.5, which includes the typical pH ranges in cytosol (pH 7.40–6.80) and cellular compartments such as endosomes (pH 6.0–4.4) and lysosomes (pH 5.0–4.5). The pH of the extracellular matrix varies between 7.45 and 7.35. Hence, an optimal pH sensor shows a high signal change within a narrow pH range to achieve the maximal analytical sensitivity. Optical pH sensors were reviewed by Wencel et al., with a general look at pH indicators and suitable polymer matrices [26]. A more specialized article was focused on the application of pH-sensitive nanoprobes, including organic polymer and inorganic crystalline materials for intracellular imaging [18].

3.1. Planar Optrodes

Detailed discussions on the sensor chemistry, fabrication, and mode of operation of planar optrodes can be found in the literature [1]. Groundbreaking reports on the use of planar optrodes for biomolecular imaging include the monitoring of oxygen supply in malignant melanomas [27] and the study of wound healing processes with the help of 2D pH sensors [28]. These techniques were consequently exploited in various studies on the oxygen supply to tissues and tumor hypoxia, e.g., for the imaging of the tumor microenvironment in preclinical models. These were reviewed by Boss et al. [29].

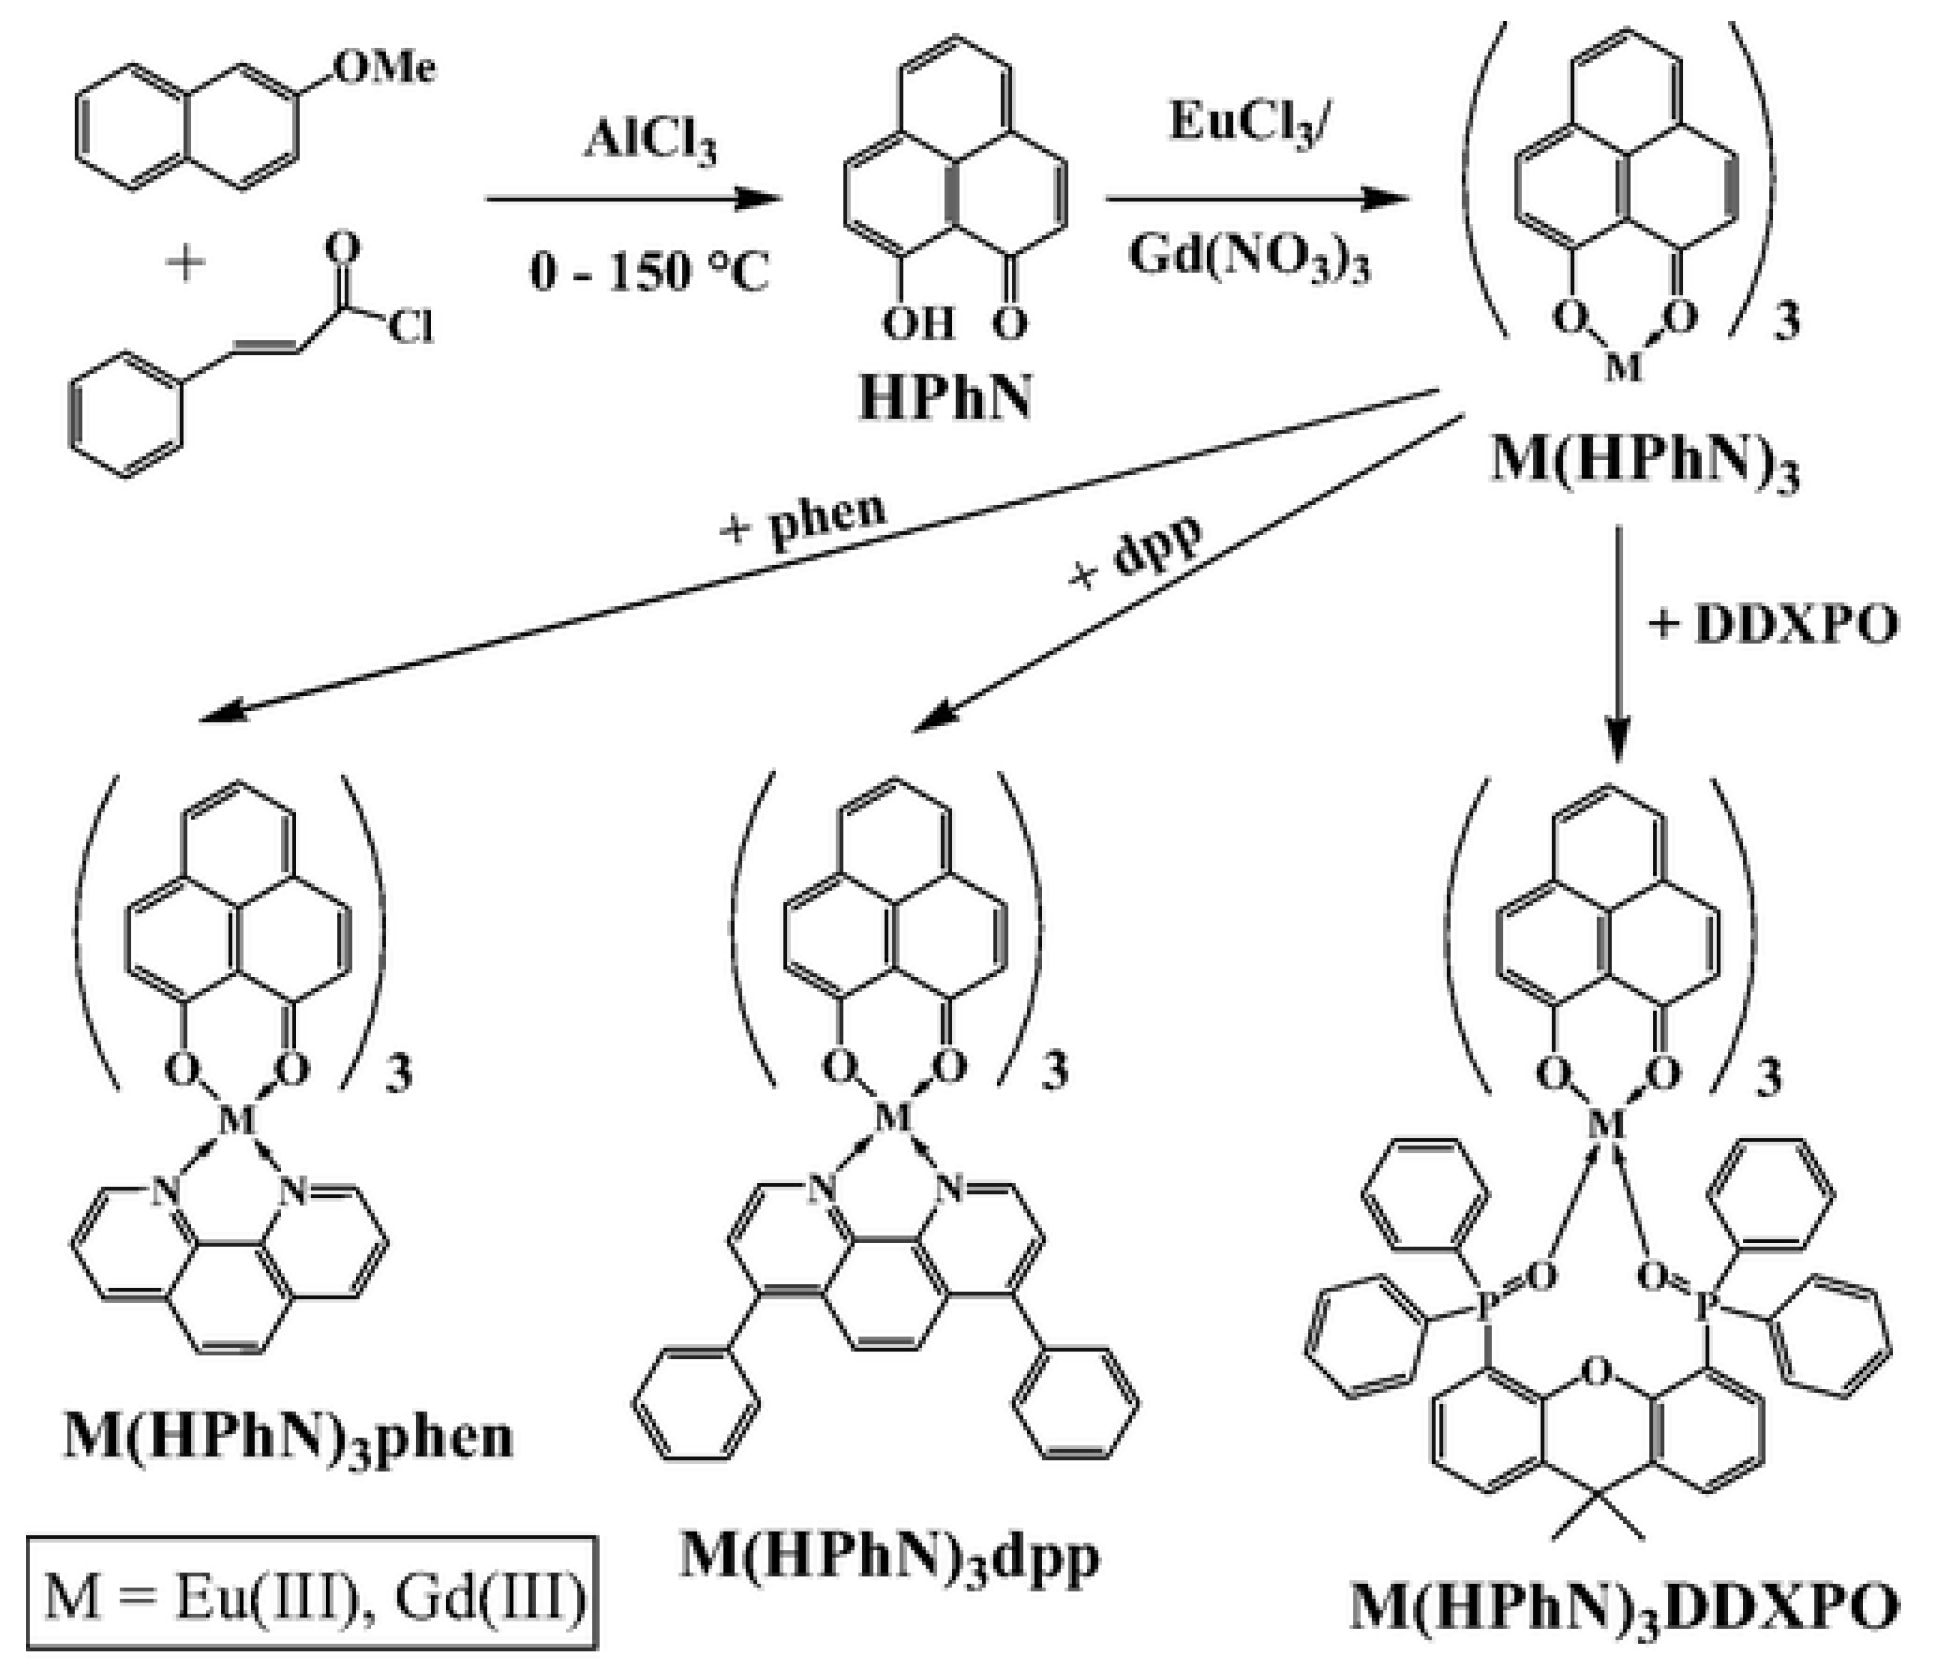
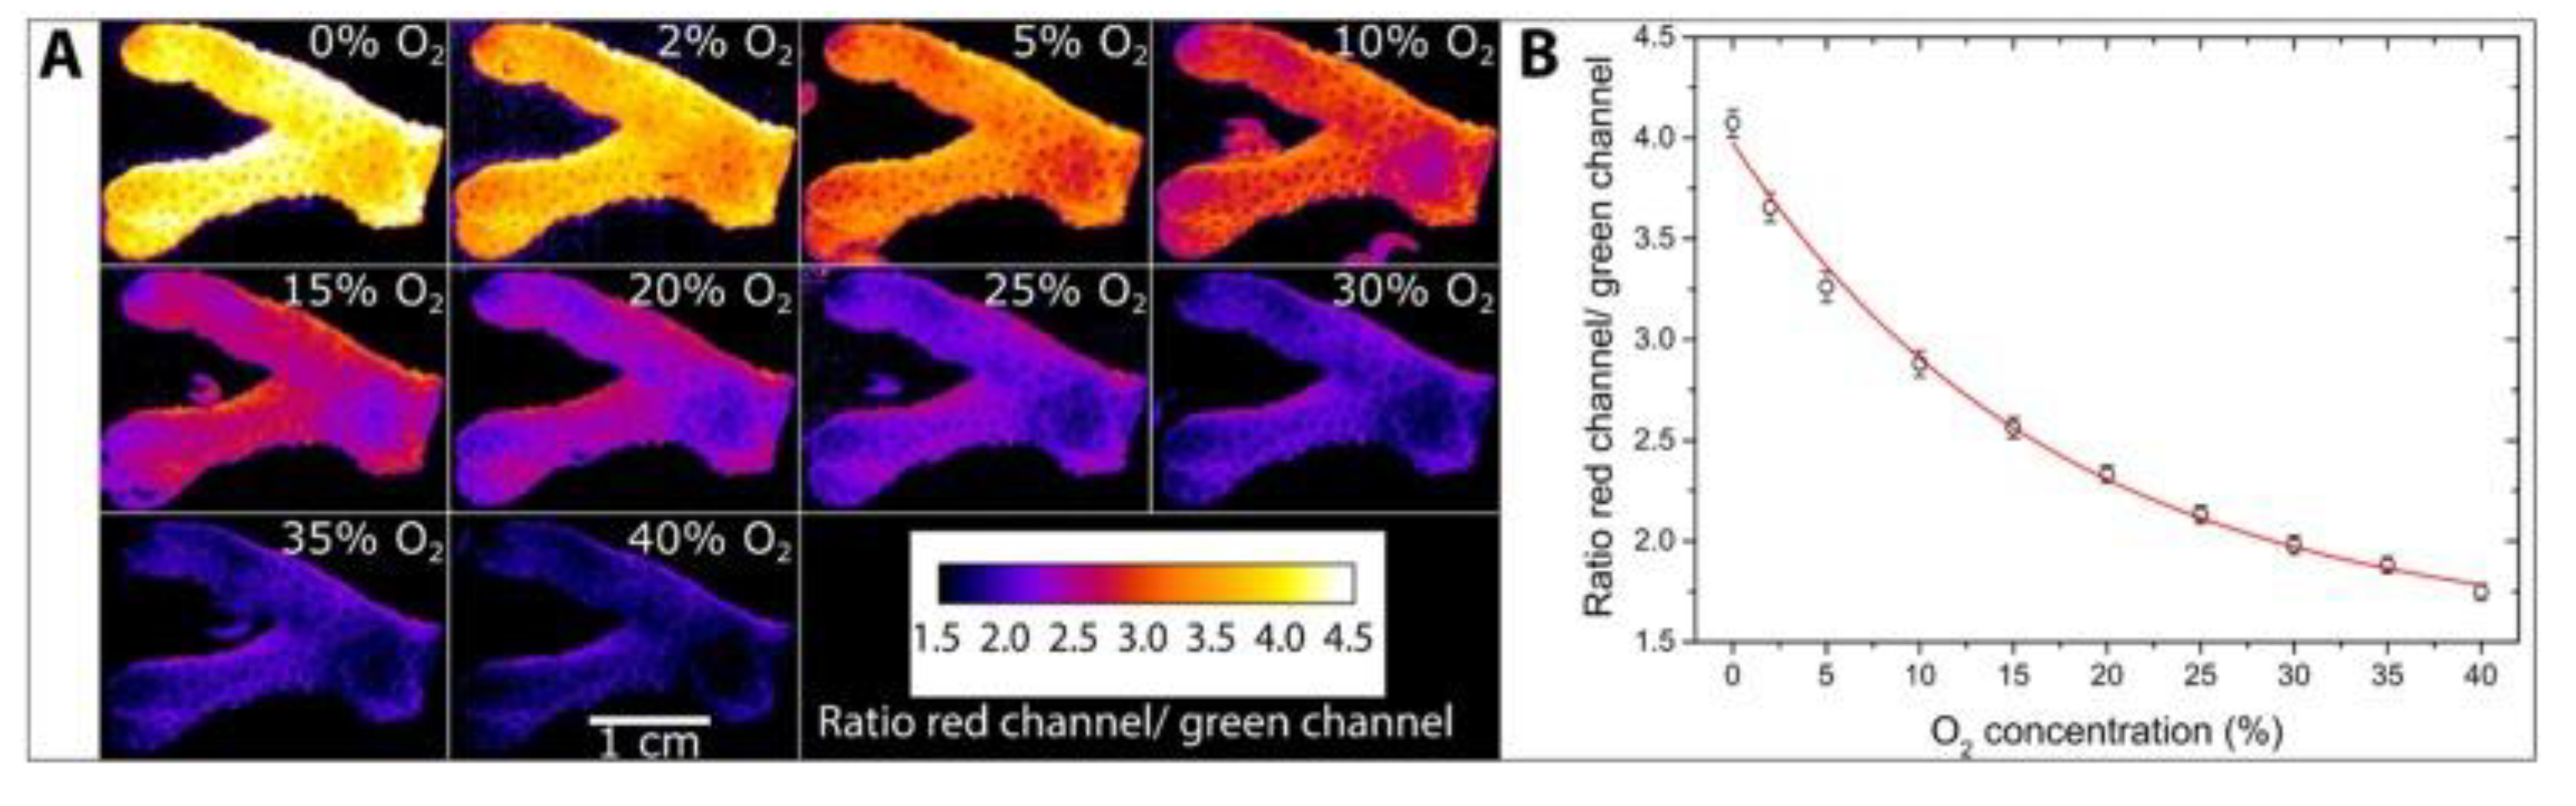
3.1.1. Oxygen Sensors

Widely used probes for optical oxygen sensors are transition metal complexes, whose phosphorescence is strongly quenched by oxygen. Prominent examples are ruthenium or iridium complexes and platinum or palladium porphyrins. Due to the strong quenching, which is affected by temperature, the sensor matrix in which the dyes are incorporated, and other environmental factors, it is difficult to compare the performances of the probes regarding quantum yields, brightness, and sensitivity. Generally, from the Stern–Volmer equation, it can be deduced that, the longer the phosphorescence lifetime of the probe, the higher the extent of oxygen quenching. The probes mentioned above have lifetimes in the microsecond range. The spectroscopic properties of the widely used oxygen sensitive probes can be found in reference [15].
However, the development of new oxygen-sensitive probes with specific features is in permanent progress. Borisov et al. synthesized and characterized a series of europium(III) and gadolinium(III) complexes bearing 8-hydroxyphenalenone as antenna chromophors as oxygen-sensitive dyes with the capability for trace oxygen sensing [30]. Their chemical structures are depicted in Figure 1. The quantum yields were around 20% for the europium(III) complexes and 50% for the gadolinium(III) dyes. The latter showed lifetimes higher than 1 ms. Both complex types could be excited at 460 nm and showed the typical sharp red emission lines of europium(III) or phosphorescence emissions of gadolinium(III) from 540 to 600 nm. Planar optrodes were prepared by incorporating the complexes in polystyrene. The emission of Eu(III) complexes matched the spectral sensitivity of the red channel of a digital RGB camera. Therefore, ratiometric imaging was performed with a consumer digital camera. In order to obtain a system for ratiometric read out, a coumarin dye was added as a reference, which emits in the green part of the spectrum. Both dyes can be excited with a blue LED.
Commercialized oxygen sensor foils in combination with a USB-handheld fluorescence microscope (VisiSens system from PreSens, Regensburg, Germany) were applied to discover vessel thrombosis in free flaps. In this study, microvascular flaps were transplanted into patients requiring tissue reconstruction after tumor surgery or because of chronic wounds. The sensor set up contained an oxygen reservoir which was consumed by the tissue corresponding to the perfusion status of the flap [31]. A similar system was used for ratiometric luminescence 2D in vivo imaging and the monitoring of mouse skin oxygenation [32]. Ratiometric luminescence imaging was carried out by the means of a sensor foil with the red-emitting oxygen-sensitive phosphorescent dye platinum(II)-5,10,15,20-tetrakis-(2,3,4,5,6-pentafluorphenyl)-porphyrin (PtTFPP) and N-(5-carboxy-pentyl)-4-piperidino-1,8-naphthalimide as a green-emitting reference dye. The read out can be performed by fluorescence lifetime imaging (Figure 2) or ratiometric imaging with a color RGB camera, which were integrated in portable sensor device. This technology can help to understand the local regulation of skin tissue oxygenation in various disease conditions. Using the same approach, the gut tissue oxygen levels in a model of Salmonella enterocoliti were measured [33]. The gut tissue oxygen levels dropped significantly during infection. From the data, it was concluded that the hypoxia-induced impairment of antimicrobial activity and Salmonella virulence cooperate to allow for enhanced Salmonella replication in monocytic phagocytes/macrophages.
Microporous polystyrene-based scaffolds stained with PtTFPP were used to image O2 gradients within 3D cell cultures [34]. The system was optimized for the imaging of O2 in diverse cultured cells, including cancer cells, multicellular aggregates, and also in rat brain slices. It was shown that the impregnated scaffolds could indicate tissue oxygenation at different depths and cell densities, changes in respiration activity, and responses to drug treatment. It was concluded that scaffolds with integrated oxygen sensors allowed for better control of the conditions in 3D tissue cultures.
Planar optrodes were also used to investigate how high-velocity fluid jets and sprays disrupt anoxic niches in dental biofilms which create anoxic microenvironments. The dissolved oxygen concentration at the base of these in vitro biofilms was measured using a planar optrode consisting of platinum octaethylporphyrin (PtOEP) as an oxygen-sensitive dye, a coumarin dye (Bu3Coum) acting as an antenna, and TiO2 nanoparticles, both to increase the brightness of the porphyrin, embedded in polystyrene. The sensing layer was cast on a polyethylene terephthalate sheet. It was demonstrated that a sufficient amount of biofilm was removed by high-velocity microsprays to disrupt the anoxic region at the biofilm–surface interface [35].
Meanwhile, cell culturing and tissue engineering became the most targeted application areas for planar oxygen optrodes. Again, imaging systems with the corresponding biocompatible and sterilizable planar luminescent sensor foils for oxygen and pH have been developed and commercialized. For example, bone tissue engineering utilizing biomaterial scaffolds and human mesenchymal stem cells is a promising approach for the treatment of bone defects. Cell density and oxygen supply affect the quality of the engineered tissue. Thus, imaging oxygen sensors were integrated to monitor the oxygen distribution in 3D scaffolds to study cell-seeding strategies [36]. In another study, the level of locally dissolved oxygen within 3D cell-loaded collagen I gels was analyzed in vitro by applying optical sensor foil technique [37]. It was demonstrated that five weeks were required for establishing an equilibrium of the in vitro oxygen concentration.
The influence of transport phenomena and culture parameters on cell growth was investigated using a perfused bioreactor with a macroporous scaffold [38]. Sensor foils were integrated into the bioreactor and imaged with a camera unit. The experimental set up is shown in Figure 3. The concentrations of oxygen, glucose, and lactate were measured and compared with cell viability and growth. The fluid dynamics and mass transport of nutrients in the perfused reactor were studied by a numerical model. The experimental and numerical results indicated that the cell metabolic activity in scaffolds cultured under perfusion was 30% greater than scaffolds cultured under static conditions. Optical sensor foils are therefore suitable for measuring the 3D oxygen gradients formed during cell culturing. Oxygen optrodes were also attached to 3D-printed ramps [39]. These were placed inside the wells of a culture plate before cell seeding. The oxygen gradient observed after 96 h showed lower oxygen concentrations closer to the bottom of the well compared to that of lower-cell-density cultures. The oxygen concentration near the cell layer was lower compared the incubator atmosphere. Accordingly, the oxygen consumption rate of the cells could be calculated.
Deygas et al. showed that epithelial cells from various tissues migrate with a high directionality towards oxygen (aerotaxis) to escape hypoxia [40]. Simultaneously, a gradient of reactive oxygen species (ROS) develops, and antioxidants dampen the aerotaxis. It was concluded that aerotaxis is a property of higher eukaryotic cells, proceeding from the conversion of oxygen into ROS. Cell respiration under confinement rapidly generates hypoxia and an oxygen gradient at the periphery of the cell cluster, which was visualized by measurements of oxygen levels using the Visisens detector unit.

3.1.2. Sensors for pH, Carbon Dioxide, and Ions

The integration of theranostic sensors provides tremendous potential to monitor the healing of acute and chronic wounds, because extracellular pH is precisely regulated and potentially important in signaling within wounds due to its diverse cellular effects. Imaging studies on wound healing using pH sensors were extensively reviewed by Dargaville et al. [41].
Commonly used pH-sensitive dyes bear carboxylic acid groups or amine groups, which can be deprotonated or protonated, respectively, depending on the pH. In every case, the protonated and deprotonated forms display different absorption spectra and one of the two forms is charged. Thus, the polarity of the dye changes significantly if it is switched from the neutral to the charged form. This makes the incorporation of pH indicators into polymeric binding matrices challenging and often requires the addition of lipophilic counterions. A pH sensor film free of background signals and autofluorescence was prepared from upconversion phosphor microparticles (UCPs) and a pH indicator (Neutral Red) in a polyurethane matrix [42]. The ratiometric sensor response was achieved because Neutral Red absorbed only the green emission of the UCPs, while their red emission was unaffected and acted as an inert reference signal. The excitation of the UCPs could be carried out with a 980 nm laser diode. Both emission peaks of the applied UCPs matched the red and green color channels of standard RGB digital cameras. The fundamentals of upconversion luminescence will be discussed in Section 3.2.3.
Dalfen et al. prepared fluorescent diazaoxatriangulenium dyes which are suitable as pH indicators for lifetime-based pH sensing [43]. The dyes were modified with phenolic-receptor groups which induced fluorescence quenching via a photoinduced electron transfer (PET) mechanism. The chromophores were substituted to ensure a response in the relevant pH range. The dyes featured high quantum yields (∼60%), a high photostability, and long fluorescence lifetimes (17–20 ns), which makes them suitable for self-referenced lifetime imaging. The three synthesized dyes had absorption maxima around 560 nm and emission maxima around 590 nm. The general chemical structure of the dyes and the PET effect are displayed in Figure 4. Planar optrodes were prepared by the immobilization of the dyes in a polyurethane hydrogel, which showed pH-dependent fluorescence lifetime behavior.
Sensor films that can be directly sprayed on skin or tissue surfaces are a valuable further development. For referenced pH imaging in wounds, the signal of the pH indicator fluorescein isothiocyanate was recorded with the green channel, and that of Ru(dpp)3 [ruthenium(II)-tris-(4,7-diphenyl-1,10-phenanthroline)] as a reference dye was stored in the red channel of a digital RGB camera [44]. The images were processed by rationing both luminescence intensities. The indicator dye was incorporated in microparticles of aminoethyl cellulose, and the reference dyes in polyacrylonitrile. Both particles were embedded in Traumasept wound gel as a sprayable binding matrix for film formation. Other thermogelating, biocompatible, and water-sprayable polymer hosts for the formation of sensor films that can be used for the imaging of pH, oxygen, or temperature are Poloxamer or Pluronic [45]. These are blockcoplymers of ethylene oxide and propylene oxide. The same mixture of pH-sensitive dye and reference dye in a polyurethane hydrogel was used to study the impact of age and body site on the skin surface pH of women in vivo. It was shown that skin surface pH slightly increases with age, but is independent of body sites. In this case, time domain dual lifetime referencing was used for a referenced read out of the sensor films [46].
Microenvironments which are similar to poorly vascularized tumors can be produced by paper-based cultures. These are useful platforms for the preparation of 3D tissue-like structures and generating chemical gradients. Using culture platforms which contain pH-sensing optrodes, high-spatial- and temporal-resolution maps of pH gradients in paper-based cultures can be assessed [47]. The sensor is composed of suspended microparticles containing pH-sensitive fluorescein dyes and pH-insensitive reference dyes (diphenyl anthracene) in a polyurethane hydrogel (Figure 5). The films showed a pKa around 7.61 and are applicable in a pH range including normal and tumorigenic tissues. Thus, the spatiotemporal development of pH gradients in tumor models could be analyzed. An autonomous set up for pH sensing on-site was achieved by embedding probes and reference dyes in hydrogel spots on a plastic strip.
A series of pH-responsive fluorescent probes based on boron–dipyrromethene (BODIPY) was designed, which covered the entire pH range from 0 to 14. An optical readout can be performed with simple devices using a smartphone camera and Android application software. The USB port drives the integrated LED for excitation [48]. The combination of dye-coated sensor stripes and mobile read out devices enables autonomous operation on-site or in the field. BODIPY dyes are generally characterized by their high fluorescence quantum yields (>0.9) and brightness. The attachment of phenol receptors renders BODIPY dyes pH sensitive, induced by fluorescence quenching in the phenolate form. It is assumed that the fluorescence emission of the deprotonated dye is switched off by photoinduced electron transfer (PET). The dyes have absorption maxima around 520 nm and emission maxima at 530 nm, which can be excited efficiently at a wavelength of 495 nm. Staudinger et al. presented NIR aza-BODIPY dyes with pH-sensitive hydroxyl groups working in the neutral to highly alkaline range [49]. Such dyes can be immobilized in ethyl cellulose along with tetraoctylammonium hydrogen carbonate as a lipophilic cation for the preparation of carbon dioxide sensors, which can resolve ambient CO2 levels with an LOD of 0.009 hPa [50]. The fluorescence is quenched in the deprotonated phenolate form. An extension of the π system of the BODIPY moiety with phenyl substituents results in a bathochromic shift in the absorption maximum from 505–510 nm to 635. The emission maxima are shifted from 516–522 nm to 646 nm, respectively. A further extension of the π system with 3-chloro-4-methoxyphenyl substituents results in an additional bathochromic shift of about 30 nm.
Another family of new pH-sensitive probes is based on 1,4-diketopyrrolo-[3,4-c]pyrroles (DPPs). Two different sensing mechanisms can be exploited. In the first case, at a high pH (>9), a change in absorption and fluorescence spectra takes place due to the deprotonation of the nitrogen atoms. In the second case, a phenolic group is introduced. Highly effective quenching at a near-neutral pH occurs due to PET in the deprotonated phenolate form (Figure 6). The fluorescence can be excited at 540 nm and has an emission maximum of 610 nm. Immobilized in hydrogels, they can also be used for pH sensing and imaging. It was demonstrated that a ratiometric sensor can be prepared which is suitable for RGB camera read outs [51]. Commercially available DPP pigments were modified with sulfonamide groups and embedded into ethyl cellulose for the preparation of fluorescent carbon dioxide sensors [52]. The DPP pigments exhibited quantum yields close to one. The absorption and emission spectra of the deprotonated form were bathochromically shifted by more than 100 nm compared to the neutral form, which had absorption maxima between 496 and 550 nm and emission maxima of 564–587 nm. The DPP ‘Pigment Orange 73’ was modified with a tert-butyl benzyl group. This indicator dye was embedded in ethyl cellulose and showed pH-dependent dual absorption and emission properties for the protonated and deprotonated form, and is therefore applicable to ratiometric fluorescence intensity measurements matching the response of the green and red channels of an RGB camera [53].
Pederson et al. constructed a sensor for nitrate anions based on the coextraction principle [54]. This is generally a valuable alternative for ion sensing, combining an ionophore and a fluorescent pH indicator in a sensor layer. In this case, tridodecylmethylammonium (TDMA) chloride and 1-hydroxypyrene-tris-3,6,8-octadecylsulfonamide (HPTS-TOA) were integrated in a polyurethane hydrogel matrix. If TDMA cations bind nitrate anions diffusing from the sample solution into the sensor membrane, electroneutrality has to be maintained. This is achieved by the coextraction of a proton from H2O molecules, which results in the protonation of the pH indicator HPTS-TOA. Additionally, the coumarin dye Macrolex Fluoreszenzgelb 10GN was added to the sensor film as an internal reference. The response is linear to nitrate concentrations from 1 mM to 50 mM with a fast response time of less than 10 s. The optrode was successfully applied to track the nitrate plume in a flow cell. Imaging was performed by ratiometric RGB analysis.
As can be concluded from these examples, planar oprtode technology is now mainly limited to imaging oxygen, pH, or carbon dioxide distributions. Only very few examples have been reported for other target analytes. Kumar et al. prepared an optode for the determination of Zn2+ ions in water and pharmaceutical samples [55]. The fluorescent probe tetra butyl 2,20-bisbipyridine-5,50-diylbis(methylene) diphosphonate worked as chelator for Zn2+. Complex formation was accompanied by a strong fluorescence increase (chelation enhanced fluorescence). The optrode was fabricated by incorporating the probe with dioctyl phthalate as a plasticizer and sodium tetraphenyl borate as an anionic additive in a poly(vinyl chloride) membrane. The bipyridine-bisphosphonate probe was also applied to monitor Zn2+ in HeLa cells with an optical fluorescence microscope. The UV emission maximum around 350 nm is clearly a drawback of this probe when exposed to living systems.

3.1.3. Multiple Sensors
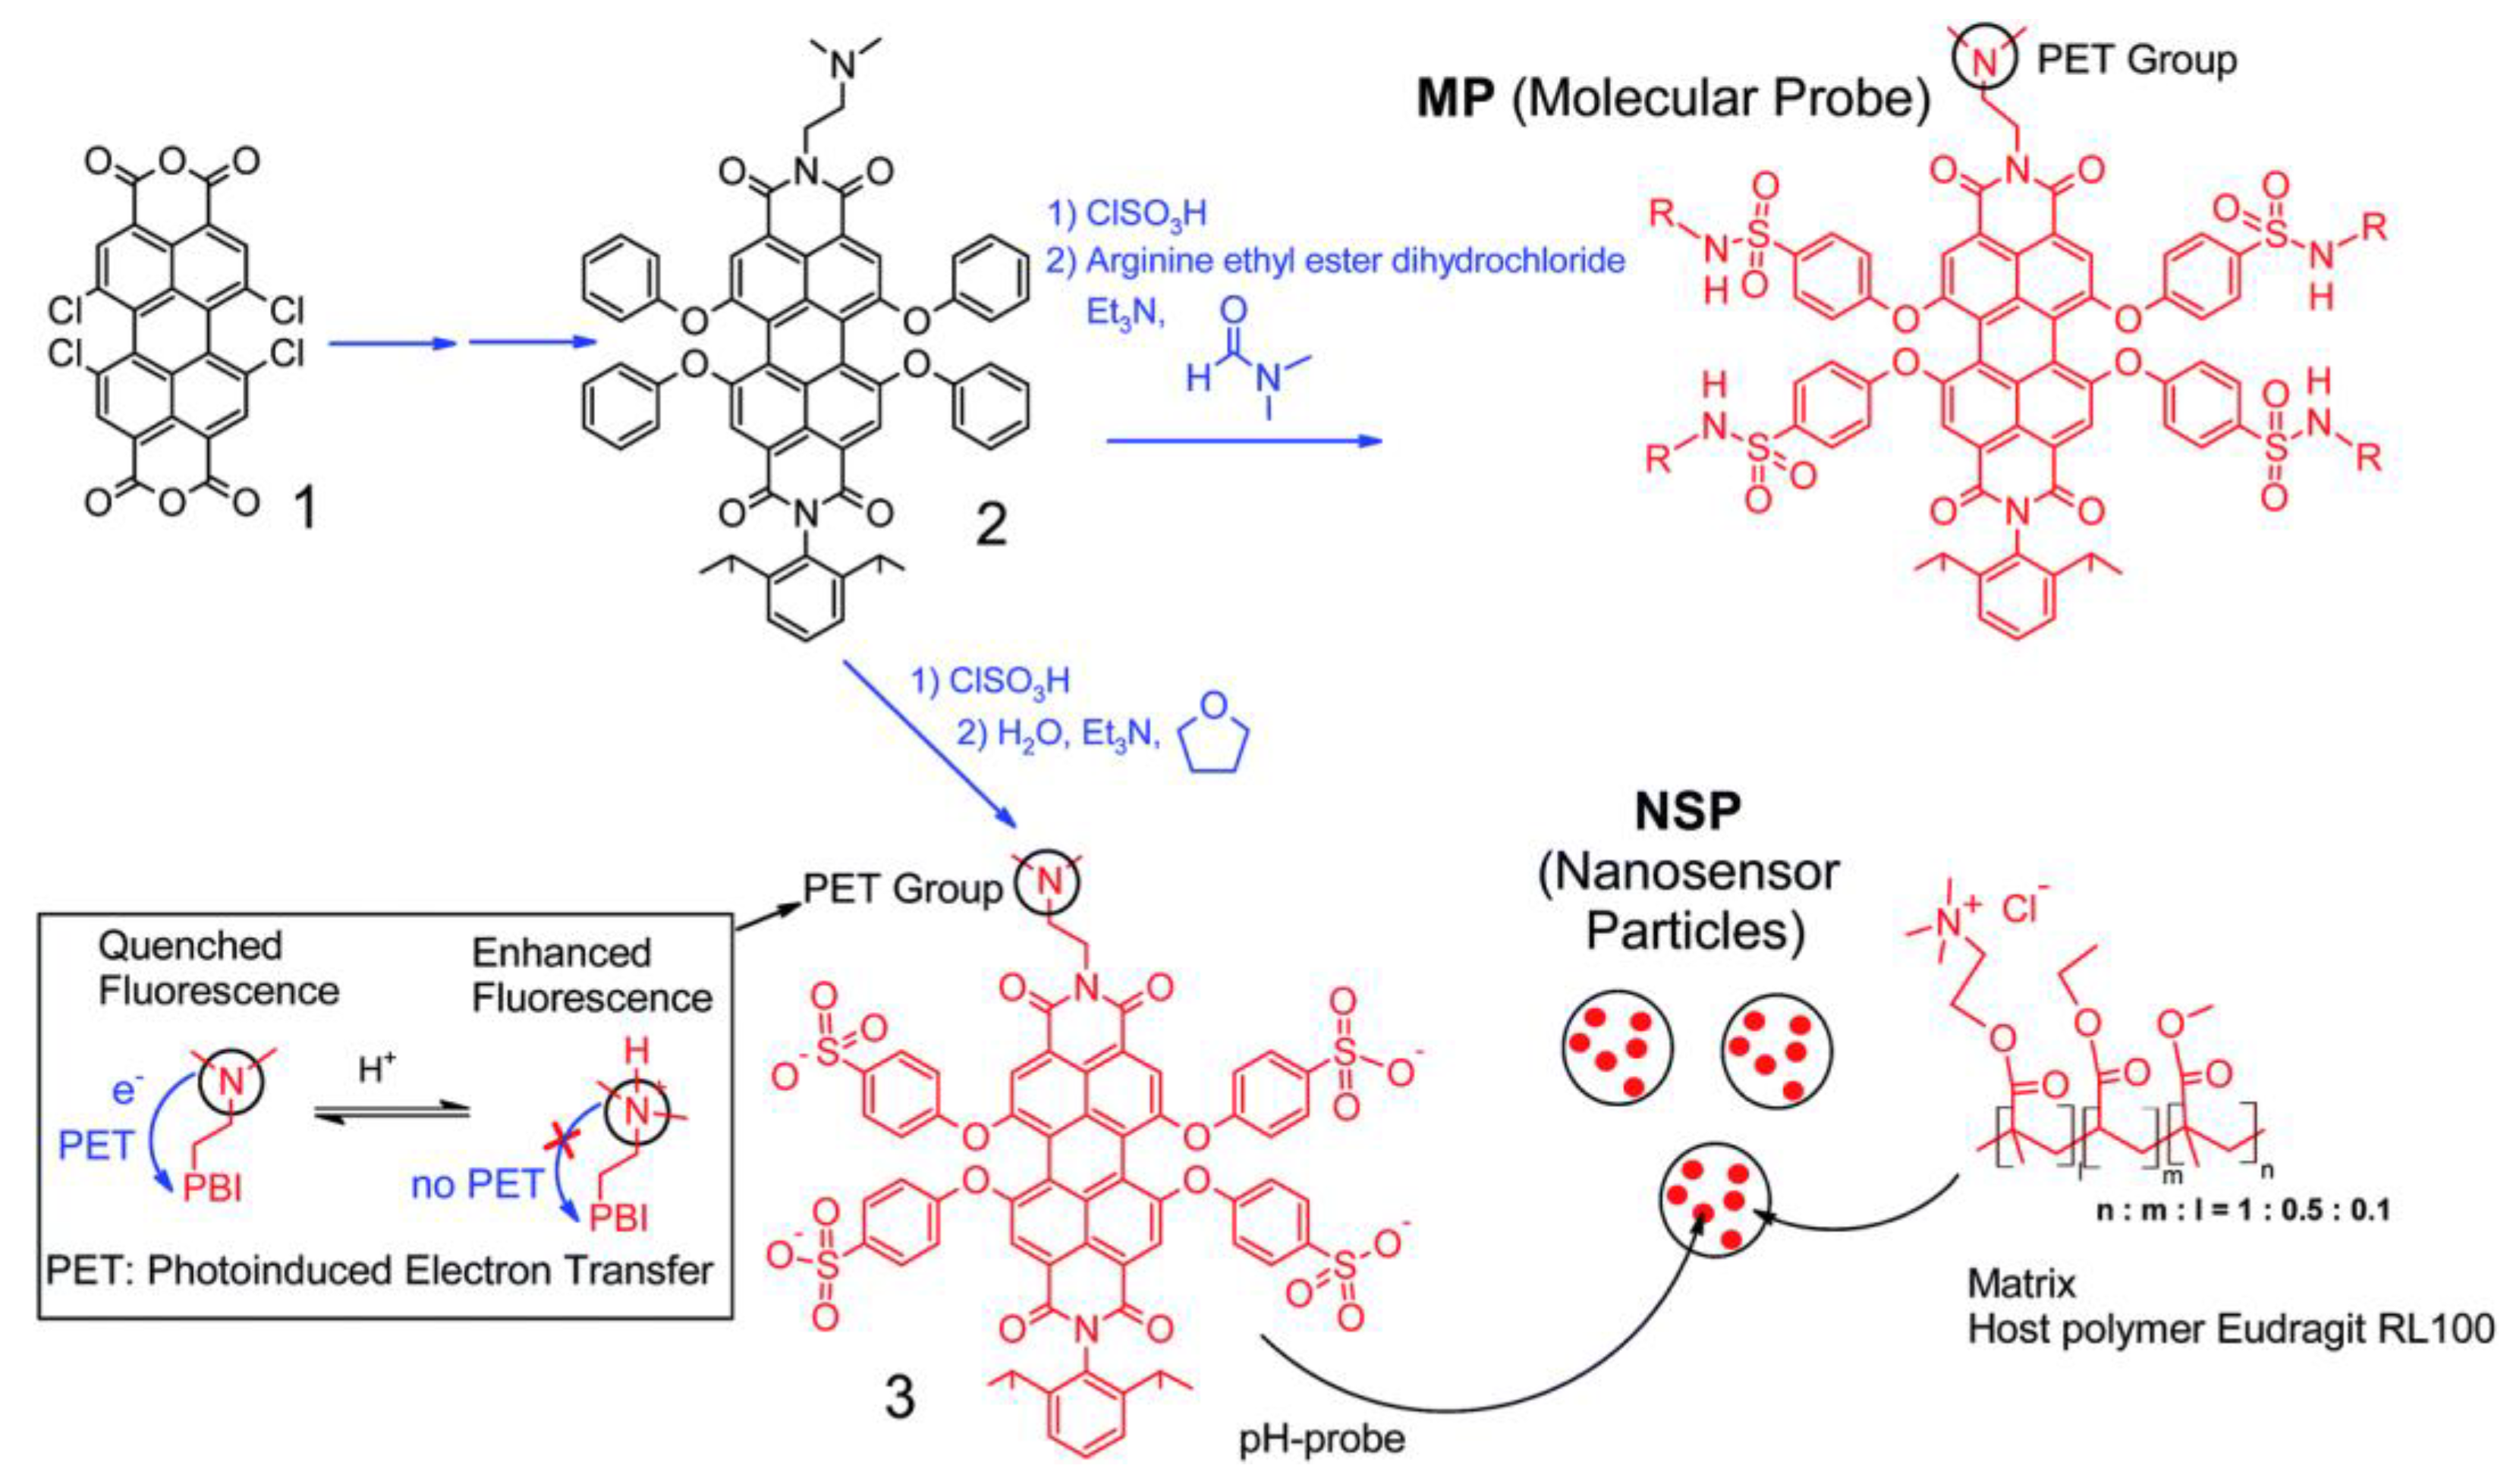
The interest in the development of multiple sensors has been increased in recent years. These enable access to complementary chemical information within one measurement, e.g., changes in pO2 and pH in biological systems. The parallel detection of diverse analytes is a promising approach for clinical chemistry, because it would reduce the time for diagnostic indications and increase the information content. Because optrodes can transmit multiple pieces of information from each reading point of the sensing layer, they are highly interesting for imaging methods. This represents a unique feature, because fluorescent signals can be separated spectrally or with the help of time-resolved imaging methods. Various dual sensors for oxygen and temperature, pH and oxygen, or pH and temperature have been described [1], as has a triple sensor material for all the three parameters [56]. Even a quadruple planar luminescent sensor was presented for the simultaneous monitoring of oxygen, carbon dioxide, pH, and temperature [57].
Schreml et al. reported a biocompatible sensor foil for the dual imaging of extracellular pH and oxygenation in vivo [58]. They used time-resolved fluorescence imaging methods such as time domain dual lifetime referencing and luminescence lifetime imaging to visualize pH and oxygen simultaneously. Centripetally increasing pH gradients on human chronic wound surfaces were discovered using the dual sensors. It was demonstrated that pH gradients are pivotal regulators of cell proliferation and migration, and disrupt epidermal barrier repair and wound closure. Parallel oxygen imaging also revealed hypoxia. This sensor combined the established oxygen-sensitive probe palladium(II)-meso-tetraphenyltetrabenzoporphyrin in poly(styrene-co-acrylonitrile) microparticles with pH-responsive fluorescein-isothiocyanate covalently bound to aminoethylcellulose microparticles. Commercialized 2D imaging systems with the corresponding biocompatible planar luminescent sensor foils were used to determine the pH and oxygen in non-healing wounds after radiotherapy (Figure 7). It was shown that there were significant differences in pH and oxygen saturation between non-irradiated skin and irradiated skin. Radiogenic wounds exhibited the highest pH values and had a poor oxygen saturation [59].
These examples show that the use of planar optrodes in the medical field is a valuable tool in basic research, clinical studies, and theranostics. Portable sensor devices can be designed for point-of-care use. However, to date, applications are limited to studies on skin cancer or wound healing and the monitoring of pO2 and pH changes. However, approaches using cell-membrane-permeable molecular probes or nanoparticles which can directly be dispersed in cells or tissues are much more versatile for molecular imaging with respect to their utility and the addressed analytes.

3.2. Nanoprobes

The attachment of dyes to nanoparticles (NPs) can lead to an improved cell permeability, protection from interferences, and higher brightness compared to individual molecular probes. This paves the way for more robust intracellular applications in combination with fluorescence microscopy. This chapter summarizes the approaches to the design, fabrication, and application of polymeric and inorganic nanoprobes for molecular sensing and imaging. These should also exhibit a high photostability, low cytotoxicity, and highly sensitive response to changes in analyte concentrations. The response should match the practical relevant working range. These aspects are of a particularly high interest for probe design:
-
the capability for trace analysis
-
NIR excitation
-
a broad dynamic range
-
improved chemical robustness and photostability
Generally, only noncharged and lipophilic molecules can pass the cell membrane directly by a passive pathway. Active uptake by endocytosis is possible in the case of larger particles with a maximum size of 200–300 nm.
Nanoprobes for chemical sensing consist of dye-doped silica, polymer particles, or those from inorganic materials such as metals, semiconductors, or lanthanide-doped crystals. The state of the art of pH-sensitive nanoprobes was extensively reviewed [18]. Wang et al. summarized the application of functionalized silica nanoparticles to imaging on the cellular and small animal level [60]. Fluorescence cell imaging with fluoroionophore-functionalized NPs was recently reviewed by Du et al. They highlighted approaches for ion-selective nanoprobes for biologically relevant ions such as Na+, K+, Ca2+, and Cl, based on polymer and quantum dot particles [61]. This overview on nanoprobes for biomedical imaging cannot claim to be comprehensive due to the multitude of research articles published in this field in the past years. Every subchapter in this section could constitute a separate full review article. Therefore, numerous review articles on fluorescent NPs are referenced in this section.

3.2.1. Silica Nanoparticles

Generally, functionalized silica (SiO2) nanoparticles (Si-NPs) doped with fluorescent dyes are widely used flexible platforms for developing fluorescence imaging techniques for living cells or the whole body of small animals. A large variety of dyes can be incorporated inside the silica matrix either noncovalently or covalently or be attached covalently to the particle surface. These form the basis for multiplex labeled particles, which support ratiometric sensing in living systems. The silica matrix protects dyes from quenching and chemical degrading and enhances the fluorescence intensities, photostability, and biocompatibility of molecular probes. Fluorescent dyes can be encapsulated into nanosilica matrices via a modified Stöber synthesis or by the water-in-oil microemulsion technique [62]. Multifunctional fluorescent sensors based on silica nanomaterials can be achieved with core–shell structures, e.g., from Fe3O4@SiO2, providing nanoprobes with magnetic properties. Such core–shell hybrid systems for metal ion sensing were reviewed by Chatterjee et al. [63].
Examples of mesoporous silica nanoparticles for chemical sensing were recently reviewed by Parra et al. [64]. They highlighted methods for the loading of particles with fluorescent dyes and their surface modification by grafting methods or co-condensation with functionalized trialkoxysilanes. Numerous applications are shown, including the detection of cations, anions, radical oxygen species, gases, drugs, mycotoxins, and biogenic thiols. Chen et al. studied the influence of the surface charge of mesoporous silica nanoparticles on their cell uptake and intracellular distribution [65]. They localized the particles by measuring the local pH value of the particles in HeLa cells with confocal laser scanning microscopy, and found that positively charged NPs were located in higher pH regions in the cytosol and negatively charged NPs were trapped in acidic endosomes. The ratiometric sensor was obtained utilizing fluorescein isothiocyanate (FITC) as a pH-sensitive dye and tetramethyl rhodamine isothiocyanate (TRITC) as a reference. A broad-range pH sensor with a sensitive range between pH 4.5 and 8.5 was synthesized by loading FITC and rhodamine B isothiocyanate (RITC) as a reference into hollow mesoporous silica NPs [66]. It was assumed that the broad surface curvature distribution affected the apparent pKa values of the FITC dye. Confocal ratiometric images of loaded HeLa cells demonstrated that broad-range nanoprobes can differentiate between local pHs in various environments, e.g., in the medium (pH  =  7.2), cytosol (pH ~ 7), and the endosome–lysosome pathway (pH  =  4.0–5.5).
Negatively charged silica nanoparticles were used as carriers for a multiple sensor for the identification of heavy metal ions. The nanoprobe was achieved by absorbing three different positively charged fluorophores on the surface of the particles. The fluorophores acted as chelators for different heavy metal ions such as Hg2+, Zn2+, Cd2+, Pb2+, and Cr3+ [67].
1,8-naphtyl-imide and a rhodamine B derivative were covalently linked to silica mesoporous nanoparticles for the determination of biothiols. The dual-fluorophore system generated a distinct recognition pattern which enabled the discrimination of the four biothiols H2S, cysteine, homocysteine, and glutathione [68].
Nanohybrid probes consisting of a peroxynitrite-responsive phosphorescent cyclometalated iridium(III) complex embedded in mesoporous silica nanoparticles were applied to the visualization of peroxynitrite in vitro (in RAW 264.7 cells) and for the high-contrast imaging of endogenous peroxynitrite in vivo (living zebrafish and mouse) [69]. A nonreactive iridium(III) complex acted as a reference. Ratiometric photoluminescence imaging was used to map peroxynitrite in vitro and time-resolved photoluminescence imaging for in vivo measurements. The sensitive iridium complex bore ligands with phenylboronate groups as a recognition site for peroxynitrite. These reacted with peroxynitrite-generating phenolic groups, resulting in a quenching of the phosphorescence of the responsive iridium complex due to PET (Figure 8), which has an emission maximum at 474 nm with a dynamic range of 1–10 µM of peroxynitrite.

3.2.2. Polymer Nanoparticles

The first polymer-based NPs for intracellular measurements were developed by the group of Kopelman. They prepared NPs for pH detection using fluorescein as a sensitive dye and sulforhodamine 101 as a reference entrapped in a polyacrylamide matrix [70]. They created the term “PEBBLE” (probes encapsulated by biologically localized embedding) for such types of nanosensors used in biological environments. Different types of polymer matrices can be used for the fabrication of the particles. The selection depends on the polarity of the incorporated dye and the nature of the analyte, i.e., if ions, neutral molecules, or gases should be detected. Polymer materials such as polystyrene, polyethylene glycol, or polyacrylamide are suitable for in vivo imaging applications, as are polyelectrolytes such as polyacrylic acid and derivatives, or amphiphilic micelle-forming block-copolymers. Methods and materials for nanoparticle synthesis, dye loading, and surface functionalization have been reviewed several times [4,18,71,72].
Srivastava et al. prepared a set of blue-red-green-emissive pH sensors from polystyrene NPs, immobilizing two spectrally distinguishable pH-sensitive dyes with different pKa values for the measurement of proton concentration in a very broad range [73]. The particle cores were stained with a rhodamine dye responsive to acidic pH values, and a pH-inert quinoline fluorophore as a reference, followed by the covalent attachment of a fluorescein dye to the particle surface that responds to neutral and basic pH values with a green fluorescence. The multicolor sensor particles can monitor acidic pH values, which makes them suitable for lysosomal tracking. Their applicability was demonstrated by cellular uptake studies, utilizing widefield microscopy and confocal fluorescence microscopy by visualizing different compartments of the endosomal–lysosomal uptake pathway.
A high efficiency for cellular uptake can be achieved with polyelectrolytes as a polymer matrix, particularly with cationic hydrogels. Conjugates of perylene bisimide (PBI) and oligo-guanidine in cationic hydrogel nanoparticles were designed for sensing the intracellular pH in live cell FLIM [74]. Mammalian cells and neurosphere cell models were used to evaluate their performance by confocal FLIM-TCSPC. The lifetime of the encapsulated probes dropped from 3.86 ns at pH 4.4 to 2.86 ns at pH 8.0. in mouse embryonic fibroblast cells. The pH response of the perylene-bisimide probes was due to PET (Figure 9). The encapsulation of the probe into a polymer matrix is required to avoid interferences from the microenvironment. The PBI probe was excited at 540 nm and showed emission between 565 and 605 nm. Another cell-penetrating phosphorescent nanosensor material was developed, in which the oxygen-sensitive dye PtTFPP and poly(9,9-dioctyl-fluorene), which acts both as Förster resonance energy transfer donor and two-photon antennae for the excitation of PtTFPP, were embedded in biocompatible commercially available cationic hydrogel nanoparticles with trimethylammoniumethyl groups. The nanoprobes can be used for the high-resolution imaging of cellular O2 in different detection modalities, including ratiometric intensity and phosphorescence lifetime-based sensing under one-photon and two-photon excitation conditions [75].
These nanoprobes were commercialized and subsequently used to perform the high-resolution 2D and 3D mapping of O2 in spheroid structures by live cell fluorescence imaging [76]. Micrometer-sized cellular spheroids are useful models of mammalian tissue for studies of cell proliferation, differentiation, replacement therapies, and drug action. Oxygenation was studied on different live cell imaging platforms, including widefield and confocal phosphorescence lifetime imaging microscopy. A similar FRET system consisting of substituted conjugated polymers polyfluorene or poly(fluorene-alt-benzothiadiazole) acting both as an antenna and as a fluorescent reference and covalently bound PtTFPP or PtTPTBPF was used with one- and two-photon excitation. Their cell-staining properties could be modulated with positively and negatively charged groups grafted to the backbone. These tunable properties make the conjugated-polymer-based phosphorescent nanoparticles a versatile tool for quantitative O2 imaging with a broad range of cell and 3D tissue models. The uptake of the particles in Balb/c mice was studied by in vivo imaging [77]. A FRET system with a reference/antennae dye poly(9,9-diheptylfluorene-alt-9,9-di-p-tolyl-9H-fluorene) and PtPFPP encapsulated in negatively charged poly(methyl methacrylate-co-methacrylic acid)-based nanoparticles was used to probe neural cells and tissues [78]. The particles were internalized by endocytosis, which resulted in the efficient staining of primary neurons, astrocytes, and PC12 cells and multi-cellular aggregates. Local O2 levels were monitored on a time-resolved fluorescence plate reader and a phosphorescence lifetime microscope.
Hyperbranched polymers have also received much attention in the past years. With a large number of end groups, they can be easily functionalized with various functional groups, being an ideal platform for the construction of nanosensors with different functions. Materials like branched polyamines or conjugated polymers are frequently used. Bao et al. designed a hyperbranched polylactide structure which was functionalized with naphthalimide fluorophores as a pH-sensitive dye and a reference dye for ratiometric pH sensing [79]. The 1,8-naphthalimide-based dyes showed aggregation-induced emission activity. The fluorescent polymer nanoparticles accumulated in acidic organelles of living cells by the endocytosis process, and the quantitative analysis of intracellular pH values was successfully demonstrated in HeLa cells by confocal fluorescence microscopy. Due to the protonation of the naphthalimide fluorophore by decreasing the pH values from 8.1 to 5.0, the intramolecular PET process was inhibited (Figure 10). Therefore, the fluorescence emissions of the dye at 525 nm increased when excited with a UV lamp at 365 nm.
The imaging of the real-time fluxes of K+ ions in live cells was demonstrated by Müller et al. [80]. They prepared a deep-red fluorescent nanosensor based on a BODIPY fluoroionophore which was sensitive for K+ and encapsulated in cationic polymer NPs, as illustrated in Figure 11. These displayed a strong efficiency in the staining of a broad spectrum of cell models, such as primary neurons and intestinal organoids, and showed improved brightness and photostability compared to the free dye. The nanoprobes were applicable to FLIM and a proof-of-concept study was carried out with cultured neural cells, rat brain slices, and by in vivo brain imaging.
A different approach for the imaging of intracellular K+ concentrations used micelles with a size of 60 nm formed by Pluronic polymers, which were stabilized by the polymerization of acrylic monomers located in the cores of the micelles. A chromoionophore based on a modified crown ether was integrated into the core. By the binding of K+, the chromoionophore was deprotonated, resulting in a shift in the absorption maximum from 660 nm to 540 nm. The probe showed emission at 660 nm when excited at 540 nm. The surface of the micelles was partially modified with primary amine groups, which were utilized for the covalent attachment of a reference dye (NIR-797) for ratiometric fluorescence imaging. The nanosensor enabled potassium sensing in the range from 20 mM to 1 M. It can be used as dual mode sensor, because it is also applicable to photoacoustic imaging [81].
Another nanosensor for K+ fabricated from PVC particles formed by nanoemulsion consists of potassium ionophore III and a quencher (blueberry-C6-ester-652), which is deprotonated if K+ binds to the ionophore according to a coextraction mechanism. The quencher shows strong absorbance at 665 nm after deprotonation and quenches the fluorescence of the integrated dye 1,1′-dioctadecyl-3,3,3′,3′-tetramethylindodicarbocyanine. Regrettably, imaging applications were not demonstrated in this work [82].
Calcium-selective nanospheres were prepared by the incorporation of calix[4]arene-functionalized Bodipy (λex/em = 480/516 nm) or 9-(diethylamino)-5-[(2-octyldecyl)imino]benzo[a]phenoxazine (λex/em = 645/673 nm) as chromoionophores in micellar structures formed by Pluronic F127. Additionally, sodium tetrakis[3.5-bis(trifluoromethylphenyl)borate was added to the nanospheres as an ion exchanger [83]. The two different particles showed limits of detection for Ca2+ of 1 µM and 10 µM, respectively. These were loaded into HeLa cells and imaged by confocal laser scanning microscopy to continuously monitor the fluctuations in intracellular Ca2+ concentration. The nanospheres were retained inside the cells for 24 h, which exhibited the feasibility of long-term ion monitoring.

3.2.3. Inorganic Nanomaterials

A broad variety of inorganic materials such as quantum dots, carbon dots, gold, silver, platinum oxide, iron oxide, and zirconium oxide have been used for the development of nanoprobes for chemical sensing [84]. Most examples in the literature aim for the imaging of intracellular pH [18].

Quantum Dots

Spherical semiconductor nanocrystals are known as quantum dots (QDs). They have typical core sizes between 2 and 10 nm and can be coated with biocompatible surfaces [85,86,87]. The quantum confinement effect determines the optical and electronical properties, because the energy gap between the valence and conduction band increases with a decreasing size. Commercially available QDs are frequently composed of CdSe, and can be synthesized in different particle sizes to yield luminescence emissions over the entire visible range. The luminescent core is passivated by the epitaxial growth of a thin surface-coating layer, which consists of a material with a higher band gap, e.g., ZnS or CdS. This leads to a significant increase in their quantum yields. Other merits of core–shell crystals are their narrow emission spectra and their insensitivity toward photobleaching and luminescence quenching by environmental interferences.
Freeman and Willner [88] reviewed strategies for the chemical modification of QDs for sensing low-molecular-weight substrates, metal ions, anions, and gases. These include the functionalization of QDs with ionophores and the modification of QDs with substrate-specific ligands or receptor units. Other mechanisms that can be used for analyte detection are analyte-stimulated aggregation or Förster resonance energy transfer (FRET). Quantum-dot-based sensors find use in the detection of ions, organic compounds (e.g., proteins, sugars, and volatile substances), bacteria, and viruses [89].
CdSe/ZnS quantum dot NPs were capped with mercaptopropionic acid for the sensing of intracellular pH. The fluorescence lifetime of this functionalized particles changes from 8.7 ns at pH < 5 to 15.4 ns at pH > 8. Their applicability was demonstrated by FLIM in MC3T3-E1 cells [90].

Metal Nanoparticles

Marin et al. designed a ratiometric nanosensor which consisted of a thiolated anthracene molecule as a fluorescent PET-based pH indicator and a thiolated rhodamine. Both dyes were immobilized on the surface of gold NPs with a 3.6 nm diameter. They can be excited at 364 nm. The dyes had a reverse response because the fluorescence of the anthracene-based PET probe was turned on at an acidic pH, while the fluorescence of the rhodamine dye decreased with an increasing acidity. This is ideal for a ratiometric read out, which was performed by the means of confocal fluorescence imaging with incubated CHO cells [91].
A further dual-emission probe for pH determination is based on agglomerates of bovine serum albumin (BSA) and Ce/Au nanoclusters, which were prepared from cerium(IV) and gold(III) ions in the presence of BSA under alkaline conditions. The clusters emit a pH-dependent fluorescence at 410 and an inert fluorescence at 650 nm, used as a reference upon excitation at 325 nm. The ratiometric response covers a range from pH 5.5 to 9.0. The nanoclusters were located mainly in the cytosol of loaded HeLa cells [92].

Nanocarbons

Carbon nanodots (CDs) are carbon materials forming quasi-spherical NPs with sizes below 10 nm. They display size- and excitation-wavelength-dependent photoluminescence, a tunable fluorescence emission, and are highly biocompatible. CDs bear carboxylic acid moieties at their surface, which makes them easily dispersible in water and suitable for functionalization with organic, polymeric, inorganic, or biological molecules [93]. Their simple synthesis routes, cheap starting materials, and chemical stability are promising for the fabrication of nanosensors [94], for theranostics and bioimaging [95,96], and for optoelectronics [97].
Amino-coated CDs can be prepared by heating citric acid in glycerol in the presence of 4,7,10-trioxa-1,13-tridecanediamine as a surface coating agent. FITC and RBITC as a sensitive dye and reference, respectively, were covalently bound to the surfaces of these particles (Figure 12). The dual-labeled CDs enabled ratiometric pH determination with a working range from pH 5.2 to 8.2. Intracellular pH calibration was carried out in HeLa cells by the addition of nigericin. A fluorescence imaging analysis revealed that the CDs were distributed overall in the HeLa cells [98]. Alternatively, the photoluminescence of CDs can be used as a reference. In this case, the pH value can be determined by measuring the fluorescence intensity ratio of FITC, which was conjugated to the CD surface (emission at 524 nm) to that of the CD emission at 470 nm using a single excitation mode (405 nm). The FITC-CDs conjugates were introduced into HeLa cells via endocytosis. Ratiometric confocal images showed that the nanoprobes were located in lysosomes, indicating a pH of 5.1 [99].
A two-photon fluorescent probe was designed by Kong et al. [100]. The surfaces of CDs were covalently modified with 4′-(aminomethylphenyl)-2,2′:6′,2″-terpyridine, which acts as a receptor for protons. The nanoprobe exhibits fluorescence emission by two-photon excitation at a wavelength of 800 nm. If the pH changes from 8.5 to 6.0, its broad luminescence band between 440 and 650 nm increases. The sensing of pH was demonstrated in living human lung cancer A549 cells, mouse LLC-MK2 cells, and in vivo in tumor tissues (>100 μm depth) generated by implanting tumor cells in nude mice. Two-photon microscopy was applied. Chen et al. reported on a dual emissive CD co-doped with sulfur and nitrogen, showing an increasing fluorescence emission with an increasing pH. The nanoprobes were used for the fluorescence imaging of pH in living cells [101].
Single-walled carbon nanotubes (SWCNs) are another promising type of material for biomedical imaging, because they exhibit a fluorescent signal in the NIR spectral region, where there is minimal interference from biological media. Iverson et al. modified SWCNs with a polyethylene glycol ligated copolymer [102]. They prepared NIR-fluorescent SWCN sensors for intravenous injection into mice for the selective detection of local nitric oxide. The nanotubes were localized within the liver, and it was possible to follow the transient inflammation using nitric oxide as a marker and signaling molecule.
Dopamine-sensitive nanosensors based on SWCNTs have been developed for two-photon excitation. DNA-wrapped SWCNs are capable of the molecular recognition of dopamine, as indicated by a twofold fluorescence increase in fluorescence (Figure 13). The SWCNs were excited with a 1560 nm femtosecond pulsed erbium laser. The nanoprobes were imaged in a scattering intralipid brain-mimetic tissue phantom at a 2 mm depth [103]. The same group derived dopamine nanosensors by the noncovalent conjugation of SWCNTs to single-strand oligonucleotides. Utilizing the NIR fluorescent emission of the nanosensors in the 1000–1300 nm window, they were able to detect dopamine transmission in ex vivo brain slices in the presence of dopamine receptor agonists using electrical and optogenetic stimulation methods [104].

Photon Upconversion Nanosensors

Upconversion luminescence (UCL) is free of autofluorescence background and, therefore, is particularly suited for measurements in complex biological samples and for cellular or in vivo imaging [105]. Its NIR excitation minimizes the photodamage of tissue and enables a high penetration depth. Photon upconversion can be achieved in inorganic crystalline materials doped with lanthanide ions. Thereby, higher-energy emission is generated from low-energy excitation radiation [106]. A high upconversion efficiency can be obtained with hexagonal nanocrystals of NaYF4 as a host matrix which are doped with Yb3+ and Er3+. These exhibit two sharp luminescence emission bands in the green (~550 nm) and red (~660 nm) spectral range upon 980 nm excitation. Alternatively, Yb3+- and Tm3+-doped nanocrystals are frequently used. Both compositions are applied to sensing and bioimaging applications because of their superior brightness compared to other host materials [107]. The basis of upconversion luminescence and its use in fluorescent sensors, particularly in combination with energy transfer systems, the advantages of core–shell systems, and methods for surface functionalization are discussed in numerous articles [108,109,110] and do not need to be repeated here.
A multitude of pH nanosensors have been established by linking UCNPs with pH-sensitive probes. These absorb at least one of the two UC emissions. The pH is measured following the change in absolute luminescence intensity or ratiometric intensity changes in dual emission modes. Resonance energy transfer or the simple reabsorption of UCL by an inner filter effect are discussed as processes for the sensitization of the dye molecules [111]. This general probe design was used for the sensing and imaging of intracellular pH. The covalent conjugation of the red-emitting pH indicator pHrodo Red to aminosilane-coated UCNPs resulted in a pH-sensitive nanoprobe with an almost linear response in the range from pH 3.0 to 7.0. The ratiometric signal was generated by an energy transfer from Yb,Er-doped nanocrystals to the fluorogenic indicator dye or by reabsorption; the sensitizing mechanism was not clear. A referenced read out can be achieved by measuring the ratio of the green UCL emission (550 nm) as a reference and the sensitized red emission of the indicator (590 nm), which rises with a decreasing pH. The probe was used for pH imaging inside living cells and their compartments using a laser scanning luminescence microscope equipped with a 980 nm excitation source, showing efficient internalization by HeLa cells [112].
This system was further improved by using a polyethyleneimine (PEI) coating for the nanoparticles and the covalent attachment of pHrodo Red, leading to a more efficient energy transfer. The highly branched PEI is a polycationic macromolecule which is able to facilitate cellular uptake. After internalization, the PEI-coated nanoprobes were distributed across different cellular compartments and were applied as probes to study compartmentalization, compartment acidification, and the processing of endocytosed material (Figure 14). Cytoplasmic, endosomal, and lysosomal particle populations could be distinguished. Intracellular pH response was demonstrated by treatment with Nigericin, leading to a total loss of lysosomal compartments and a significant pH change in endosomal compartments [113].
In another study, PEI-coated UCNPs were modified with the pH-sensitive anthraquinone dyes Calcium Red and Alizarin Red S. It was demonstrated that the green emission band of the UCNPs was quenched by a pH-dependent inner filter effect of the dyes and not by a resonance energy transfer effect [114]. PEI-coated UCNPs conjugated to the pH indicator pHAb were used to evaluate upconversion resonance energy transfer efficiency and the corresponding Förster distance, which were calculated to be 25 to 30% and 2.56 nm, respectively. Human neuroblastoma SH-SY5Y cells were equilibrated with nigericin H+/K+ ionophore, which equalized the intra- and extracellular pH. These were loaded with the nanoprobes, which exhibited a ratiometric pH response with an apparent pKa of ~5.1. The UCNP-pHAb composites were found to be colocalized with the lysosome marker LysoBrite. The drug inhibitors chlorpromazine and nystatin, which interfere with clathrin-mediated endocytosis and caveolae-mediated endocytosis, were applied to elucidate the mechanism of nanoparticle uptake into the cell [115].
In a related approach, a ratiometric sensor was prepared from NaYF4:Yb3+,Tm3+ UCNPs and pH-sensitive BODIPY dyes embedded into a polyurethane hydrogel shell. As the blue emission of NaYF4:Yb3+,Tm3+ overlapped with the absorption of the pH-sensitive dye, its fluorescence could be switched on upon protonation in an acidic environment, which led to the interruption of PET. The fluorescence of the dye was excited by a reabsorption mechanism. The utility of the nanoprobes was assessed by monitoring the time-dependent pH changes of a suspension of E. coli-metabolizing d-glucose [116].
Core–shell nanosensors for the detection of hypoxia were designed by Liu et al. [117]. UCNPs served as the core and hollow mesoporous silica as the shell. The phosphorescent oxygen indicator [Ru(dpp)3]2+Cl2 was immobilized in the shell, whereas the core provided the excitation light for the ruthenium complex by UCL under 980 nm exposure (Figure 15). The fluorescence of the nanosensors increased under hypoxic conditions. In vivo experiments were carried out with living U87MG cells and zebrafish embryos. In a related approach, an iridium(III) complex was covalently linked to a mesoporous silica-coated core–shell UCNP [118]. The lifetime of the oxygen-sensitive long-lived phosphorescence of the complex was reduced from 4.0 to 0.8 μs when the environment changed from hypoxic to normoxic conditions. This can be visualized via phosphorescence lifetime imaging microscopy. Oxygen levels were monitored in HeLa cells.
Oxygen nanosensors were alternatively prepared by a coating of NaYF4:Yb3+,Tm3+ with PtTFPP in a polystyrene matrix [119]. The excitation of PtTFPP with a 980 nm laser and upconversion energy transfer could be achieved with a high efficiency. The sensor was implanted under the skin of a chicken, and it was demonstrated that the photoluminescence intensity was amplified more than 12 times by employing the 980 nm laser instead of 410 nm laser light. It was concluded that this paves the way for the development of implantable oxygen nanosensor platforms.
Yolk–shell-structured upconversion nanoparticles have been developed for the determination of cysteine/homocysteine [120]. UCNPs were used as the core and mesoporous silica was used to accommodate a colorimetric chemodosimeter for cysteine/ homocysteine in the hollow cavities. 8-oxo-8H-acenaphtho[1,2-b]pyrrole-9-carbonitrile was used as a colorimetric dye which could turn on and off the green UCL by resonance energy transfer, because it showed a broad absorption band with two peaks at 544 and 572 nm after reacting with cysteine. Cellular experiments carried out with laser-scanning UCL demonstrated that the dye-loaded UCNPs could serve as an intracellular nanoprobe to detect cysteine/homocysteine.
UCNPs modified with a pyrogallic acid–titanium(IV) complex were applied for the capturing and real-time quantification of fluoride anions. Due to the strong interaction between Ti4+ and F, which decomposed the complex, the resonance energy transfer between the particle and complex was weakened and UCL recovered. Both in vitro and in vivo imaging experiments with nude mice demonstrated a highly sensitive UCL response to F and therapeutic efficiency [121]. A merocyanine dye adsorbed into a mesoporous SiO2 shell of NaYF4:Yb, Er,Tm nanocrystals was used to synthesize a ratiometric UCL probe for the selective detection of hydrogen sulfide anions (HS) in living HeLa cells. The sensing mechanism is illustrated in Figure 16. It was based on the inhibition of the energy transfer from the UCNP core to the merocyanine units, leading to an increase in the green UCL emission after reacting with HS. The red UCL emission served as a reference [122].
A ratiometric UCL sensor for the detection of Hg2+ in an aqueous solution with a high selectivity, sensitivity, and a limit of detection of 1.95 ppb was prepared by the binding of a ruthenium bipyridine complex to the surface of UCNPs. Adducts of Hg2+ with the ruthenium complex underwent a change in absorption maximum, which inhibited the energy transfer from the UCNP to the complex. Hence, the green UCL increased in the presence of Hg2+.The nanoprobe was capable of monitoring changes in the distribution of Hg2+ in living cells by confocal fluorescence microscopy [123].
Rhodamine B-labeled phospholipids were bound on the surface of NaYF4:Yb,Er UCNPS. This led to RET from the UCF emission at 540 nm to rhodamine B. The nanoprobes were applied to monitor the activity of the enzyme phospholipase D (PLD) in living MCF-10A cells. The enzyme hydrolyzed the phosphodiester bond of the phospholipid and cleaved rhodamine B apart from the UCNP surface. This led to an interruption of RET. Using the second UCL emission at 655 nm, which was not affected, as an internal standard, the nanoprobe could be used for the ratiometric detection of PLD [124].
The nanosensors summarized in this chapter were mostly evaluated in live cells. Probes capable of NIR excitation and emission are particularly promising for the in vivo imaging of small animals. However, due to the limited transmission of UV and visible light through biological tissue, the use of fluorescence imaging is rather confined compared to other molecular imaging techniques. On the other hand, these do not provide a chemical sensing function. Thus, whenever information on the temporal and spatial distribution of certain analytes is required, these types of nanoprobes are indispensable aids. To date, only polymeric NPs for oxygen determination have been commercialized. All other approaches are in the development stage. It can hardly be foreseen which materials and sensor designs will find acceptance by researchers in the biomedical field and for broader applications. Particularly, the utilization of UCNP sensors requires non-standard instrumentation with NIR excitation and their luminescence intensities are weak compared to other materials. The general characteristics of the nanomaterials used for chemical sensing are summarized in Table 1.

4. Environmental Monitoring and Marine Research

Planar optrodes are useful tools in marine research, particularly in marine microbiology. The acidification of sea water due to the global increase in atmospheric CO2 is a major problem for calcifying organisms such as shellfish and corals at the sea bottom. Seasonal changes in oxygen concentration and pH are further objects of systematic scientific studies. Oxygen penetration into sediments and its dynamics or oxygen consumption due to the degradation of organic matter can be also monitored with fluorescence imaging methods [1].

4.1. Planar Optrodes

Imaging methods are mainly applied at sediment–water interfaces. Changes in the chemical composition in the depth of sediments are considered as relatively steady. However, the activities of benthic organisms can generate heterogeneities and complex 3D transport and reaction patterns over millimeter to meter scales in surficial sediments. The state of the art in 2D imaging techniques using planar optrodes to investigate biogeochemical processes in heterogeneous sediments and soils was reviewed by Li et al. [125]. Scholz et al. reviewed different methods for mapping chemical gradients around seagrass roots, including planar-optrode-based techniques for O2 and pH imaging [126]. Optrodes together with other techniques for sensing pCO2 in seawater were summarized 2016 by Clarke et al. [127].

4.1.1. Oxygen Sensors

Studying the impact of temperature and irradiance on benthic microalgal communities is one specific aspect of major interest. For this purpose, the effects of temperature and light on oxygen production and photosynthesis were studied by the 2D imaging of O2 and recording chlorophyll A fluorescence [128]. It was shown that irradiance increased pore-water O2 concentration, sediment net O2 production, and gross photosynthesis. Increasing temperatures stimulated the consumption of O2 more than photosynthesis. Thus, the community becomes more heterotrophic at elevated temperatures. The authors concluded that the imaging approach demonstrates a great potential for studying environmental effects on photosynthetic activity and O2 turnover in complex phototrophic benthic communities. The optrode was prepared from an iridium(III) complex (Ir(CS)2acac) with polystyrene as a polymer binder. The sensors were integrated in a flume with two fiber optic faceplates as windows containing sediments and a read out with a CCD camera.
PtTFPP combined with a coumarin dye Macrolex® fluorescent yellow 10GN as an antenna was dissolved in a polystyrene matrix, and the resulting oxygen sensor membrane was coated onto glass inserts. These were fitted into the front window of an incubation box to study the spatiotemporal dynamics of the reaction of manure solids with soil. Phosphorus release, oxygen consumption, and greenhouse gas emissions were recorded after the addition of organic fertilizers to soil [129]. The experimental set up of the incubation box is shown in Figure 17. Planar optrodes of the same composition were utilized to map the O2 micro-distribution around Vallisneria spiralis roots. The availability of O2 in the sediment–root interface is critical for the survival of macrophytes. Long-term imaging results were gathered during a 36-day period [130]. The O2 dynamics under different environmental conditions were also mapped in the rhizosphere of L. hexandra. The results obtained with planar optrodes were compared to DGT-LA-ICP-MS (laser ablation inductively coupled plasma mass spectrometry) to investigate the mobilization mechanisms of trace metals triggered by radial oxygen loss and rhizosphere acidification. It was demonstrated that, with an increasing light intensity, air humidity, or atmospheric CO2 concentrations, the O2 concentrations and oxidized areas in the rhizosphere were significantly reduced [131]. Li et al. investigated the O2 distribution and dynamics in the rhizosphere of Phragmites australis, and their impact on nutrient removal in sediments [132].
The results from chemical imaging were compared with nitrogen porewater measurements to assess the extent of plant-induced changes in soil redox dynamics. These determine the spatio-temporal patterns in porewater O2 and pH, which influence nitrogen biogeochemical cycling during dosed applications of nitrogen-rich artificial wastewater. Imaging using planar optrodes revealed O2 fluxes to anoxic sediments via radial oxygen loss from Typha latifolia roots [133].
Commercial oxygen optrodes were used to study the spatial organization of bacterial populations. This is of importance, because the activity of microbes in soil is spatially inhomogenous, which influences biogeochemical processes. The sensors were placed in pore networks in soil and at a peripheral port. The generation of oxygen gradients was verified by the means of fluorescence imaging using the VisiSens system [134].

4.1.2. Sensors for pH

A sensor system for 2D pH imaging in alkaline sediments and water was presented by Han et al. They prepared a dual luminophore sensor with the pH sensitive dye chlorophenyliminopropenyl aniline, which can be excited at 550 nm and emits red light with a maximum of 590 nm, and Macrolex® fluorescence yellow 10 GN (emission at 502 nm) as a reference, embedded in PVC [135]. Referenced imaging was performed with an RGB camera. The dynamic range of the sensor was between pH 7.5 and 10.5. Images were recorded in natural freshwater sediments and water associated with the photosynthesis of Vallisneria spiral species (Figure 18).
Chemical imaging techniques can be also used to study dynamic pH and CO2 distributions in the area of plant roots. These are the main drivers of processes in the rhizosphere. Planar optrodes were used in different set ups to monitor plant-root–soil interactions. Continuous and real-time measurements of the pH and CO2 dynamics around roots and nodules of different plants were carried out. Again, the commercially available VisiSens system was used (see above) in combination with commercially available planar optodes for pH and CO2 [136].

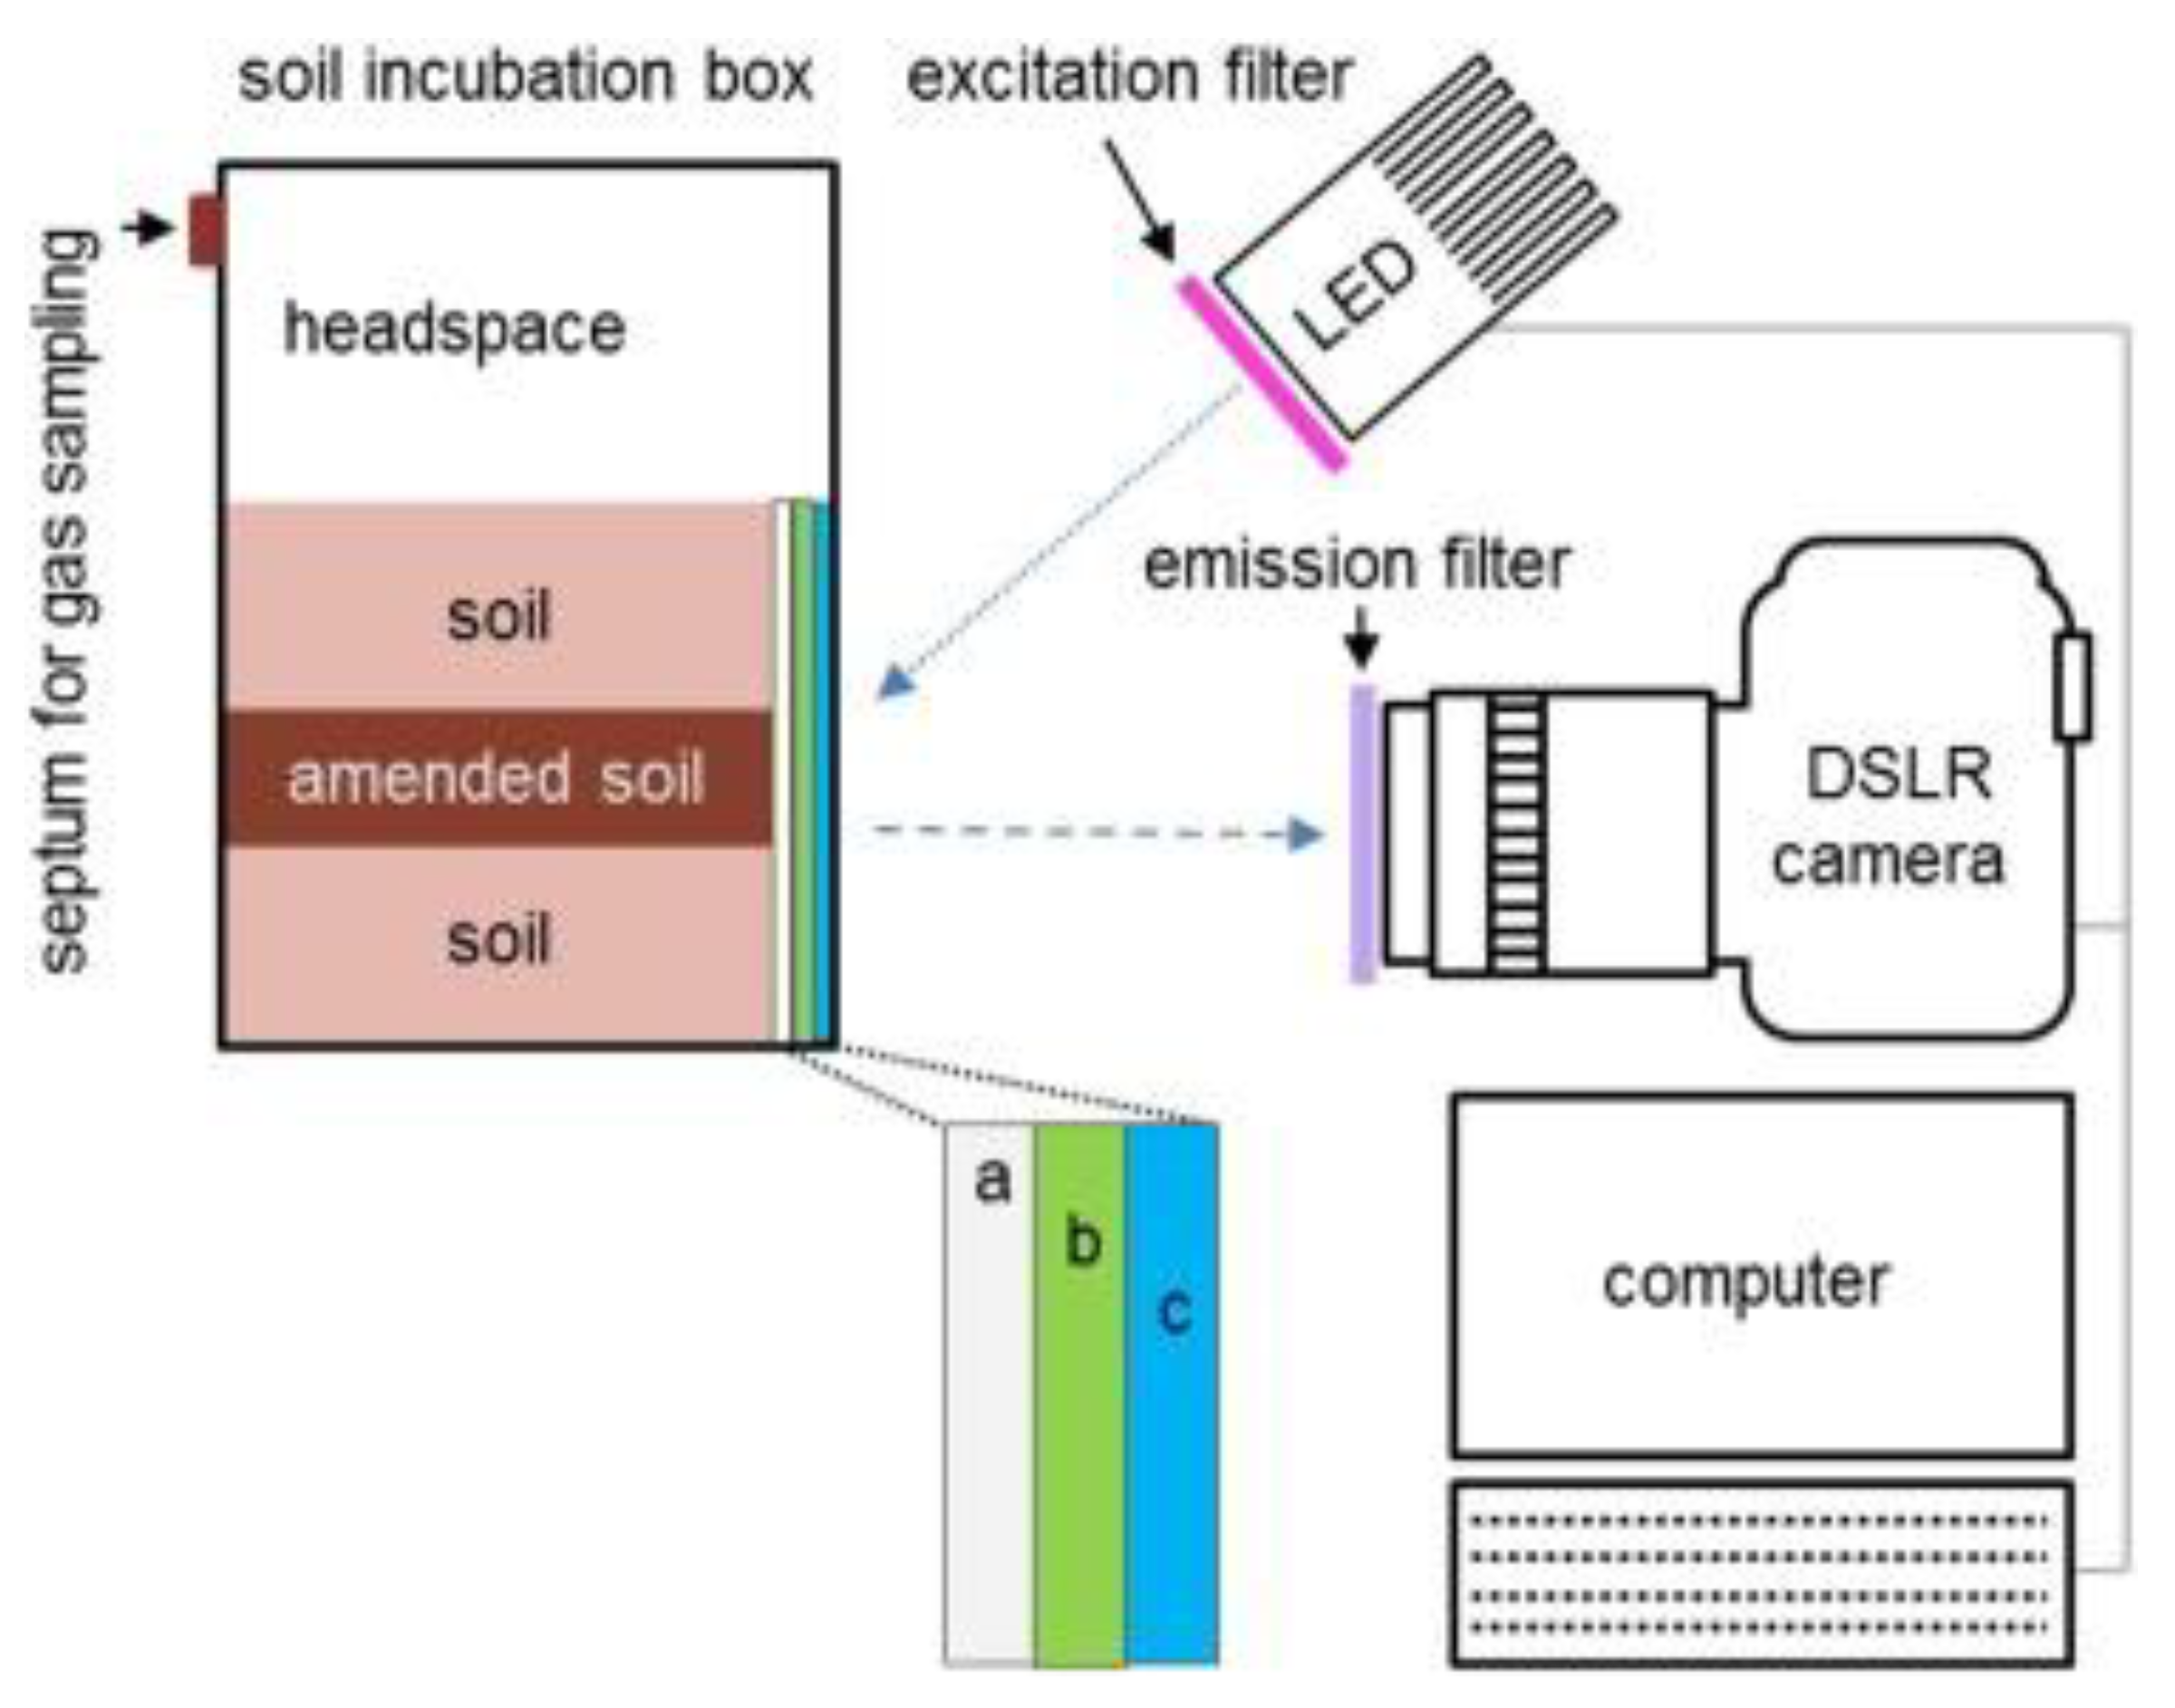
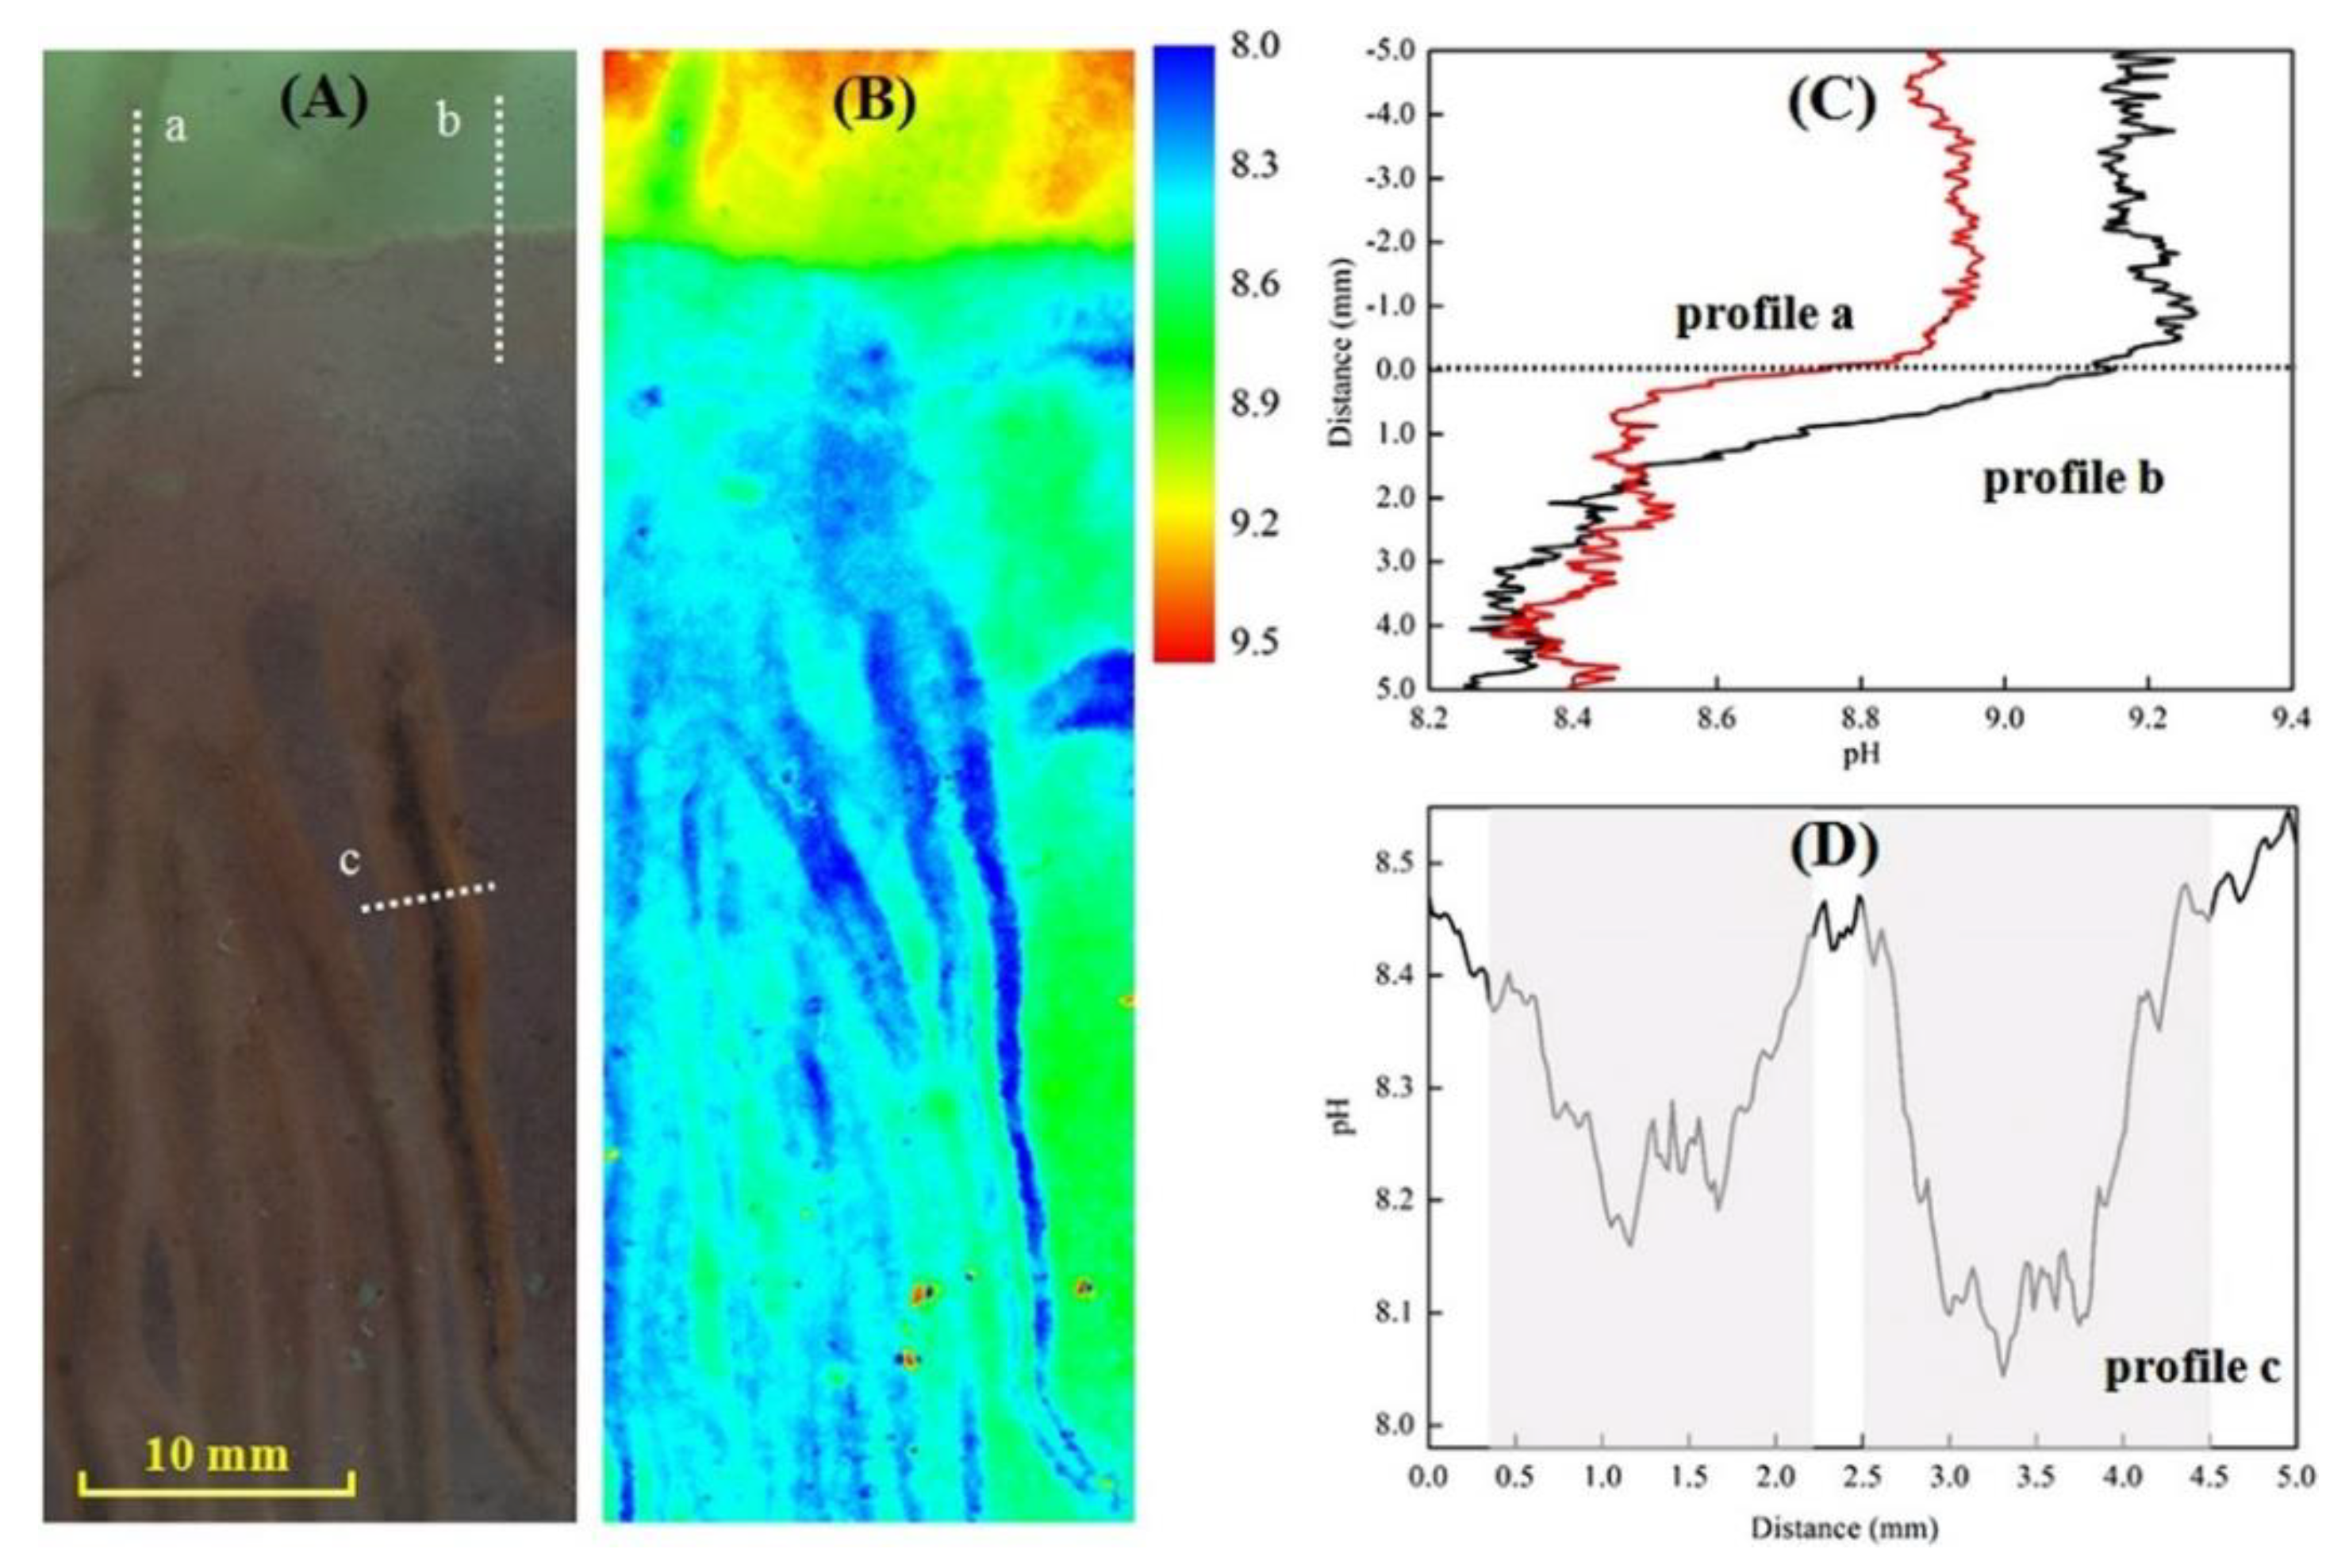
4.1.3. Multiple Sensor Systems

A multilayer planar optrode system for oxygen and pH imaging was built by embedding Platinum(II)octaethylporphyrin as an oxygen indicator and quantum dots as a reference in polystyrene, with a second layer consisting of the pH indicator 5-hexadecanoylamino-fluorescein in a Hydromed D4 matrix. An optical isolation layer containing carbon black in Hydromed D4 was coated on the top. All indicator and reference dyes could be excited by a 405 nm LED, while their emissions matched the red, green, and blue channels of a 3CCD camera. The set up was used to analyze the pH and oxygen dynamics of the seawater under the influence of rain drops [137].
The spatial O2 and CO2 distribution around the roots of Lobelia under light and dark conditions was studied by integrating the commercially available VisiSens sensor foils for both parameters inside the walls of a rhizobox [138]. Koop-Jakobsen et al. used the same system for taking high-resolution 2D-images of the O2, pH, and CO2 distributions around roots of the intertidal salt-marsh plant Spartina anglica during alternating light–dark cycles by ratiometric fluorescence imaging. They demonstrated that the roots affected O2, pH, and CO2 dynamics, resulting in distinct gradients of these parameters in the rhizosphere [139]. The sensor foils were placed in direct contact with the roots and sediment.
The most important chemical parameters associated with emissions from soil, NH3, O2, and pH microenvironments were analyzed with a triple optrode approach. A newly developed optrode for NH3 with a limit of detection of 2.11 ppm and a large dynamic range up was fabricated by the immobilization of the fluorescent pH indicator Oxazine 170 perchlorate and an inert reference dye (Macrolex yellow) in a polyurethane hydrogel (Figure 19) [140]. The NH3 optrode can be excited with a 470 nm LED, and fluorescence images were obtained using a 530 nm longpass filter. All three optrodes were integrated into an experimental set up within a thin soil layer which was sandwiched between two glass plates equipped with optrodes (Figure 20). Two NH3 optrodes were placed on one side and the O2 and pH optrodes on the other side, with a read out with ratiometric fluorescence imaging.
A new dual sensor system for the simultaneous imaging of O2 and pH with low cross-talk was developed by Moßhammer et al. They combined an O2-sensitive europium complex [30] with a near-infrared emitting pH indicator based on BODIPY and an inert reference coumarin dye for ratiometric imaging. The sensor foil also contained diamant powder as a signal enhancer. The sensors were calibrated in transparent flow chambers and tested in photosynthetic microbial mats [141].
The simultaneous sensing of pH and O2 was used for the evaluation of bioactive cement [142]. It contains bacteria which are capable of inducing CaCO3 precipitation for the self-healing of cracks in concrete structures before leaking occurs. The pH is an important parameter determining the biocompatibility of concretes and cements. A ratiometric imaging system using pH-sensitive optrodes was developed to characterize the pH of porewater within the cracks of submerged hydrated oil and gas well cement. Again, the ratiometric optode for oxygen sensing consisted of PtTFPP and Macrolex fluorescence yellow as a reference dye, dispersed in polystyrene. The pH-sensitive optrode was composed of an aza-BODIPY dye with NIR emission and a high pKa suited for measurements in highly alkaline concrete, and a green-emitting coumarin derivative as a reference dye in Hydromed D4 polymer. The authors showed that the pH was significantly reduced from pH > 11 to below 10 with an increasing fly ash content as well as hydration time. The bacterial activity was measured using the oxygen optrodes.
Similar to medical applications, the use of planar optrodes is restricted to very specific problems and conditions, e.g., for measurements in sediments or in the rhizosphere. Imaging systems have been designed that can be used on-site in marine environments or under laboratory conditions integrated in small basins or incubation boxes.

4.2. Micro- and Nanoparticles
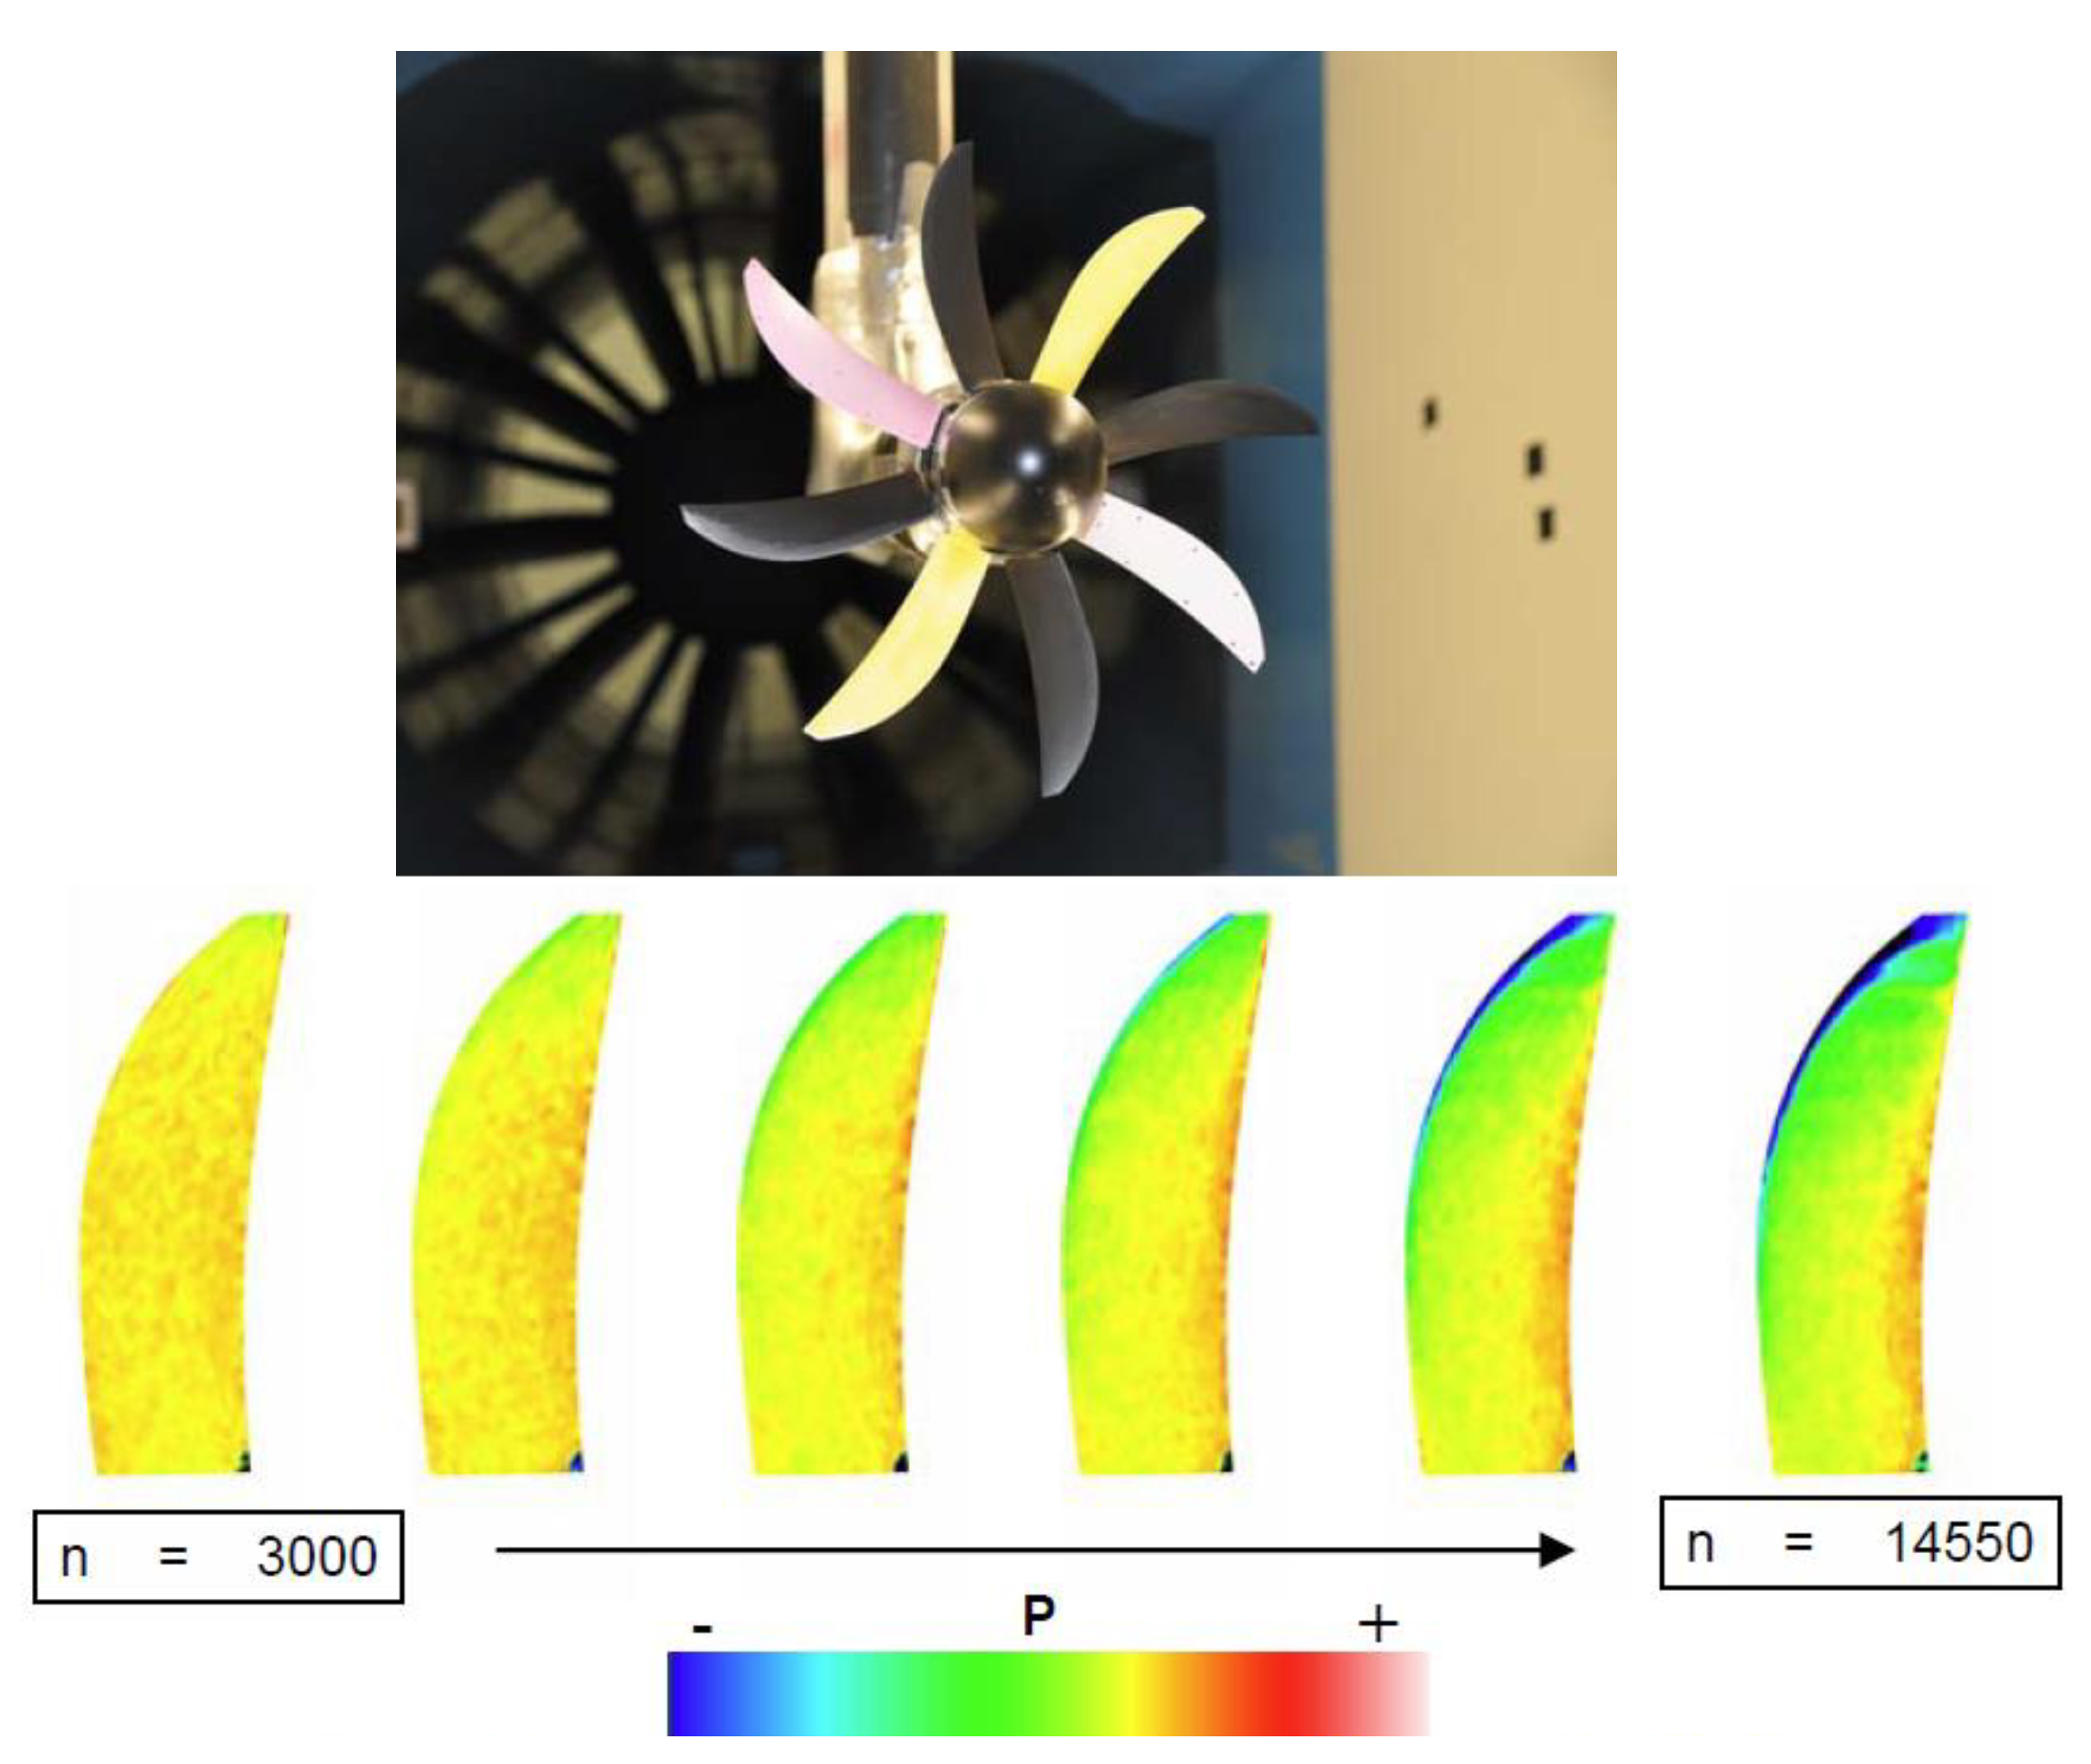
Koren et al. developed an approach to overcome the typical limitations of optrodes [143]. They studied the O2 dynamics on the surface of living corals by sensor nanoparticles that were spray-painted on the corals by a conventional airbrush. The nanosensors consisted of PtTFPP in a styrene-maleic anhydride copolymer. The dye Macrolex® fluorescence yellow 10GN was integrated as a reference. Imaging was performed with a ratiometric RGB camera set up, using the red channel for oxygen sensing and the green channel as a reference. Ratiometric images at different oxygen levels and the resulting calibration plot are displayed in Figure 21. The same type of particles was applied to visualize the O2 dynamics around the roots of seagrasses. In the experimental set up, the below-ground tissue of the seagrass was embedded in an artificial sediment containing the O2-sensitive nanoparticles. Images were recorded with a digital SLR camera and a 405 nm multichip LED, which was mounted perpendicular to the transparent chamber wall [144].
The spatio-temporal distribution and dynamics of O2 at biologically active surfaces with complex surface topography were quantified with oxygen-sensitive magnetic microparticles with a diameter of around 100 µm. These were prepared from a styrene-maleic acid anhydride copolymer containing the NIR-emitting luminophore platinum (II) meso-tetra(4-fluorophenyl)-tetrabenzoporphyrin [145]. The particles were magnetized by the addition of lipophilic magnetite nanoparticles and titanium dioxide nanoparticles. The particles were distributed across the surface tissue of the scleractinian coral Caulastrea furcata and fixed with a magnet. Their luminescence response was recorded with a fluorescence lifetime imaging system. Thus, the lateral surface heterogeneity of the O2 microenvironment across coral polyps exposed to flow could be mapped. Studying the steady-state O2 concentrations under constant light and O2 dynamics during experimental light–dark shifts enabled the identification of zones of different photosynthetic activities.

5. Aerodynamics

Quantitative measurements of surface pressure and temperature are essential tforo studying the aerodynamics and heat transfer processes of vehicles, airplanes, or turbines and rotors in wind tunnel tests. Pressure data are required to determine the distribution of aerodynamic loads for the design of flight vehicles, while temperature data are used to estimate the heat transfer on the surface. Pressure and temperature measurements provide important information on flow phenomena such as shock, flow separation, and turbulent–laminar boundary-layer transitions. Accurate pressure and temperature data play a key role in the validation and verification of computational fluid dynamics (CFD) codes. Fluorescent sensors for measuring surface pressure and temperature follow luminescence quenching mechanisms.
Pressure-sensitive paints (PSP) and temperature-sensitive paints (TSP) offer, compared with conventional techniques, an unsurpassed capability for non-contact, full-field measurements of surface pressure and temperature on complex aerodynamic models by imaging methods. They provide a high spatial resolution and lower costs, and are, therefore, a powerful tool for experimental aerodynamicists. The luminescent probes (often called “active dyes”) in PSPs or TSPs are incorporated into a suitable polymer binder and coated on model surfaces. Fluorescent probes and polymer binder are dissolved in a solvent and the resulting paint is sprayed or brushed on the model surface. After the evaporation of the solvent, a solid polymer coating hardens on the surface [146].

5.1. Pressure-Sensitive Paints

A typical PSP consists of luminescent molecules which are quenched by oxygen and are embedded in an oxygen-permeable polymer coating. For the selection of the polymer binder for the formation of the PSP, physical and mechanical properties such as oxygen permeability, temperature effects, humidity effects, adhesion to the substrate, mechanical stability, photodegradation, and glass transition temperature have to be considered. Porphyrins, ruthenium complexes, and organic molecules like pyrene derivatives are commonly used as active dyes for pressure sensors.
Since 2000, PtTFPP has been the most widely used luminescent dye for the preparation of PSP for various measurement methods [147]. PtTFPP as the luminophore affords a high frequency response and pressure sensitivity, but has a long lifetime [148]. Kameda et al. [149] developed a PSP to measure the time-varying surface pressure in aerodynamic testing. They applied PtTFPP adsorbed on silica nanoparticles in a dispersion which led to a porous sensor layer with a good pressure sensitivity, photostability, and response time less than 0.1 ms, although it exhibited substantial temperature sensitivity (ca. 1.5%/°C).
PtTFPP was also adopted as a pressure-sensitive luminophore for the development of a pressure-sensitive channel chip for micro gas flows [150]. Micro channels were fabricated by a poly(dimethyl siloxane) (PDMS) micro-molding technique. Based on polytetrafluorethylene (PTFE) particles and PtTFPP, a super-hydrophobic porous pressure-sensitive paint (hydrophobic PSP) was developed [151]. PtTFPP in a silicate sol–gel polymer [152] was used for the investigation of a Scramjet Inlet-Isolator.
Obata et al. [153,154] synthesized three poly(methyl methacrylates) substituted with CF3 groups and studied their oxygen permeability for application to PSPs. They found that PSPs composed of a fluorinated polymer and PtTFPP had similar characteristics to FIB as a polymer binder (FIB = poly(1,1,1,3,3,3-hexafluoroisopropyl-co-2,2,3,3,4,4,4-heptafluorobutyl methacrylate)). Huang et al. applied PtTFPP in PDMS for the quantitative visualization of asymmetric gas flow in constricted microchannels [155]. Some research groups developed polymerizable PSPs, in which Pt-porphyrin was covalently bound to different types of polymers [156,157,158]. Usually, the porphyrin is linked to a monomer, e.g., a methacrylate, and then copolymerized with a second monomer.
Polymer-ceramic (PC)-PSPs in combination with PtTFPP have been intensively studied in the last 10 years. PC-PSP is a sprayable form of an unsteady (time-resolved) PSP that can be applied on an aerodynamic model before testing. It consists of a polymer/ceramic basecoat (SiO2, TiO2), which is first applied on the model as a thin layer and subsequently used to host the luminophore molecules [159,160,161,162,163,164,165,166,167,168,169,170]. Since PC-PSPs usually consist of TiO2 particles which show photocatalytic activity, the luminescent intensity will decrease over time. Matsuda et al. [171] fabricated a PSP in which polystyrene particles with a diameter of 1 μm replaced TiO2 particles. They investigated the pressure and temperature sensitivity, response time, and photostability of the paint. A novel formulation of sprayable fast-responding PSPs was developed by Peng et al. They used mesoporous, hollow SiO2 particles as hosts for PtTFPP. These were formed from nano-scale particles by Van der Waals forces and chemical bonds, providing a favorable environment for luminophore deposition. The resulting highly porous structures enable fast oxygen diffusion within the PSP binder, which leads to a response time of 50 μs [165,172]. The enhancement of the luminescent output of PSPs was achieved by adding silver nanostructures into a standard formulation by taking advantage of the metal-enhanced fluorescent effect [173,174].
Furthermore, PtTFPP, in combination with the highly O2-permeable polymer poly[1-(trimethylsilyl)-1-propyne] (PTMSP), is an excellent luminescent sensor for measurements under cryogenic conditions, which enable testing models at near-full-scale Reynolds numbers. With such paints, pressure distributions due to complex shock structures can be visualized near the leading edge region (Figure 22) [175,176,177,178]. Ruthenium-based PSPs have a shorter lifetime compared to PtTFPP-based PSPs, and both are suitable for intensity- and lifetime-based measurements using digital cameras. This is why tris-(4,7′- diphenyl-1,10-phenanthroline) ruthenium (II) is often applied in a porous binder like anodised aluminium (AA) [179,180,181], ceramic polymers [182,183,184,185], or other highly porous substrates such as thin-layer chromatography plates [186] to achieve fast-response PSPs required, e.g., for the measurement of transient shock phenomena.
In recent years, pyrene derivatives such as pyrene sulfonic acid have also been used for fast-response measurements on anodized aluminium. They were used as luminophores to describe the temperature-cancellation methods of pressure-sensitive paints [187]. Sakaue et al. [188] compared the response time scales of two groups of AA-PSPs, one with organic luminophores (all of them are pyrene acids) and the other one including metal complex luminophores. Yomo et al. investigated different formulations of pyrene-based AA pressure-sensitive paints for supersonic phenomena [189].
An ultrafast PSP for shock compression spectroscopy was developed by Banishev et al. [190]. This consists of rhodamine 6G (R6G) in PMMA and was studied during nanosecond GPa shock compressions. The response times of the sensor were in the range of 10 ns. The effect of pressure on the luminescence of a series of trifluoromethyl substituted europium(III) complexes was also studied [191]. The complexes included pyridine derivatives as auxiliary ligands and showed the highest sensitivity to pressure when they were incorporated into a silicone polymer matrix containing toluene. The sensitivity was around 50%/bar at atmospheric pressure, which is comparable to the sensitivity of a PtOEP sensor in a similar silicone polymer. For pressure sensing in liquids, a pressure sensor based on highly compressible polydimethylsiloxane foam particles embedding fluorescent Nile Red molecules was proposed [192].
A self-referenced PSP was prepared from siloxane precursors by the copolymerization of silane-functionalized carbon dots (acting as a reference) with a silane-modified ruthenium complex as the sensitive probe forming a dual-luminophore paint [193].
It is evident that PtTFPP is the most frequently used dye for PSP formulations because of its superior photochemical stability, followed by PtOEP and ruthenium complexes. All newly developed and tested PSP formulations are summarized in Table 2.
It should be mentioned that many research works use commercially available sensors for pressure sensing and imaging, even for glucose sensing [194,195,196,197,198], which are not discussed here further.

5.2. Temperature-Sensitive Paints

TSPs are polymer-based coatings in which temperature-sensitive luminescent molecules are immobilized. The quantum efficiency of luminescence decreases with an increasing temperature due to thermal quenching. The relation between luminescent intensity and absolute temperature can be written as an Arrhenius-type equation [146]. Accuracies of 0.2–0.8 K can be achieved with TSPs, depending on the temperature sensitivity of dyes. The TSP technique provides a non-contact thermal imaging method with a high spatial, temporal, and temperature resolution. TSP materials developed along with PSPs are relatively new compared to thermographic phosphors and thermochromic liquid crystals.
Since the 1980s, when Kolodner and Tyson [199,200,201] used a europium complex in a polymer binder to measure the surface temperature distribution of an operating integrated circuit, many different metal–organic molecules have been tested as temperature-sensitive dyes. Hasegawa and Kitagawa summarized the characteristic emissions of lanthanide ions and the temperature dependency of the luminescence of lanthanide complexes, coordination polymers (and metal–organic frameworks (MOFs), and detection systems for thermo-sensing [202].
Tris(4,4,4-trifluoro-1-(2-thienyl)-1,3-butanediono)europium(III) (EuTTA) is one of the most employed temperature-sensitive luminescent molecules. It was used for a patternable temperature-sensitive paint (PTSP) by its integration in a photoresist as matrix, which can be photolithographically patterned [203]. The dye was also applied for surface and fluid temperature measurements of a microchannel [204], for thermal imaging microdevice evaluation [205], and for the determination of the relationship between skin friction and the surface optical flow (SOF) in viscous flows [206]. Egami et al. systematically studied the effects of different structures of acrylic polymers on the temperature and pressure sensitivity and luminescent intensity of EuTTA-based TSPs [207], while Wang et al. investigated the thermal quenching behavior of TSPs composed of (EuTTA) and Eu-phenanthrene complex (Eu-2) in polystyrene (PS), polymethylmethacrylate (PMMA), and epoxy resin (EP) [208].
Ondrus et al. presented a series Eu complexes with 1,3-di(thienyl)-propane-1,3-diones as ligands and measured their luminescence properties in different polymers. These TSPs exhibited an exceptionally high temperature sensitivity in a range from −35 °C to 100 °C, low pressure sensitivity, and good photostability [209]. This luminescent lanthanide complex was thereupon used for the detection of boundary layer transitions [210,211,212,213,214], for skin-friction-based measurements [215,216], and for experiments under water [217,218].
The next important group of luminescent molecules for temperature sensing consists of ruthenium complexes. They can be used for measurements under ambient temperature, for measurements under cryogenic conditions, or for preparing of transient TSPs. The latter is the drawback of europium-complex-based probes, because their long luminescence lifetimes of several hundred microseconds are not appropriate for recording and resolving fast-changing flow phenomena. Ozawa et al. developed a fast-response TSP for studying unsteady aerothermodynamic phenomena on a shock-tube wall, based on (Ru(phen)3, which has a short luminescence lifetime of less than 1 μs [219,220,221]. Bitter et al. demonstrated the application of a modified Ru(phen)-based ultra-fast TSP on a CNT heating layer for unsteady temperature and heat flux measurements in subsonic flows [222]. Ruthenium terpyridine chloride (Ru(trpy)Cl2) is used very often for measurements under cryogenic conditions [223]. Klein et al. tested TSPs based on ruthenium complexes with different terpyridine ligands in several polymers, which can be used in cryogenic wind tunnels [224]. They found that the temperature sensitivity of these compounds depended on the structure of the ligands and the character of the counter ion, and could be increased to 2–4%/K at 130 K. The temperature sensitivities of the complexes at cryogenic conditions are displayed in Figure 23.
Egami et al. [225] extended the measurement range of a TSP from cryogenic temperature to room temperature by combining Ru(trpy) with europium complexes. This two-component cryogenic TSP enabled a dynamic temperature range from 100 to 320 K. The two luminophores required two different illumination sources, which is difficult to implement in a facility with limited optical access. Nevertheless, the 2C-cryoTSP was validated in a cryogenic Ludwieg tube (DNW-KRG) and the influence of surface roughness on crossflow instability was demonstrated. Figure 24 shows the detection of a boundary layer transition. The light and dark parts on the model surface represent the turbulent and laminar regions, respectively. The upper part with the smoothest surface has the largest laminar area and the lower part with the roughest surface has the smallest laminar area.
For the same purpose, an alternative formulation was prepared using the two ruthenium complexes Ru(trpy)2 and Ru(bpy)3 [226]. The ruthenium terpyridine complex Ru(trpy) showed good temperature sensitivity down to 100 K, but its luminescence was highly quenched at ambient temperatures. This was countervailed by the addition of Ru(bpy), which showed a strong temperature response under ambient conditions. The two dyes had the same excitation and emission wavelengths and could be embedded in the same polymer. This combination yielded a working range of 173–313 K. Claucherty and Sakaue developed three different AA systems (AA-TSP) for optical temperature sensing. A CdSe/ZnS quantum-dot (QD) based AA-TSP [227], a rhodamine-B-based sensor for surface temperature measurement from 150 to 500 K [228], and a phenol-formaldehyde resin which showed an intrinsic fluorescence around 550 nm when excited at 468 nm [229].
A luminescent Tb(III) complex with a hexafluoro acetylacetone (hfa) ligand showed a characteristic back energy transfer, which led to a high temperature sensitivity and potential application as a thermosensitive paint [230]. Tb(hfa)3(tppo)2 was coated on an aluminum surface using silicon grease/n-hexane as a matrix to visualize the icing processes of supercooled water [231].
It can be concluded that europium-di(thienyl)-propane-1,3-dione complexes represent probes with the highest temperature sensitivities under ambient conditions, showing sharp emission bands around 615 nm, whereas ruthenium complexes such as Ru(trpy)2 are applied under cryogenic conditions, also showing red emission. Quantum dots, rhodamine B, terbium complexes, and polymers with intrinsic fluorescence are also promising candidates for TSPs.

5.3. Dual Paints

Dual two color (or “binary”) PSP/TSPs are usually prepared by combining a pressure- and a temperature-sensitive dye in one polymer matrix. The dyes can be additionally encapsulated in polymer nano- or microparticles to reduce interference and improve stability. The signals can be separated spectrally by optical filters or by time-resolved luminescence detection [1]. Iijima and Sakaue [232] applied PtTFPP as a pressure-sensitive probe for the preparation of a two-color PSP using the luminescent polymer poly[1-(trimethylsilyl)phenyl-2-phenylacetylene] as the temperature-sensitive component and a binder simultaneously. A novel dual luminescent sensor, which consists of discrete dot arrays of pressure- and temperature-sensitive parts, was developed for precise pressure measurements on solid surfaces. The dual sensor array was fabricated by inkjet-printing with PtTFPP as a PSP and ZnS–AgInS2 as a TSP [233].
PtTFPP can be used—depending on the polymer binder—as a pressure and temperature sensor simultaneously. Klein et al. [234] measured the pressure distribution on the surface of a high-speed rotating propeller using luminescence lifetime imaging (Figure 25). The pressure sensor consisted of PtTFPP in an O2-permeable polystyrene binder, and the temperature sensor was also PtTFPP anchored in an O2-non-permeable polyurethane finish.
Research work is also focused on read out techniques. Fischer et al. presented a fluorescent material for the simultaneous RGB imaging of pressure and temperature [235]. The emission of PtTFPP as an oxygen indicator matches the red channel of an RGB color camera, while the emission of a platinum complex as a temperature indicator matches the green channel. 9,10-diphenylanthracene was integrated as a reference dye which emits in the blue channel. A combined PSP/TSP system was developed for simultaneous measurements using a monochrome camera. The patterned system consisted of an array of PSP dots (PtTFPP in polymer-ceramic binder) on top of a TSP layer (Ru(dpp)3 in clearcoat) [236]. For temperature compensation, which is required for accurate pressure measurements, Ru(phen)3, whose lifetime is in the order of µs, was added as a temperature indicator to a PSP composed of PtTFPP in poly(TMSP). The luminescence lifetime of the porphyrin is about one order of magnitude larger than that of Ru(phen)3, thus, simultaneous measurements can be carried out using lifetime-based methods [237]. PtTFPP in a porous polymer/ceramic binder served also as a PSP for unsteady measurement on a helicopter blade. The temperature correction was made by coating a second rotor blade with a TSP based on Ru(bpy)3 [238].

6. Conclusions and Outlook

This overview on imaging with the help of chemical sensors cannot claim to be complete and it is not intended to be. Rather, the aim was to convey an impression on the versatility of materials, sensor designs and mechanisms, and signal processing methods which are used for fluorescence imaging and their highly different fields of application. The development of sensor materials and read out techniques is an interdisciplinary challenge, combining organic and inorganic chemistry, material science, spectroscopy, and the implementation of advanced methods for signal separation, computing, data and image analysis, and device engineering. On the other hand, only a small selection of fluorescent probes has actually been deployed to date in optical sensors. Examples are confined to transition metal and lanthanide complexes for oxygen (Table 3) and temperature sensing, fluorescent indicators for pH (Table 4), and some fluoroionophores for the detection of metal ions (Ca2+, Mg2+, K+, and Na+), although the literature is full of newly synthesized and tested molecular probes for the recognition of chemical species.
Generally, optical sensors for imaging purposes have distinct advantages, as light propagates through air and transparent materials. This paves the way for the design of remote sensors which can be placed inside (bio)reactors, interfaces, microfluidic systems, cells, or biological tissues. In combination with imaging methods, a high density of sensor spots can be achieved, leading to a microscopic resolution. Monitoring the local and temporal changes in chemical species in a complex sample matrix gives new insights into dynamic processes, e.g., in biological systems, industrial processes, or flows on surfaces.
Particularly, the visualization of dynamic processes is a distinguished feature of fluorescent sensors. However, it has to be admitted that the use of optrodes in medical, environmental, or marine research and analysis is only feasible at or across interfaces such as skin or sediments. The administration of nanoprobes which can permeate into cells, tissues, or organs clearly provides a broader range of applications. As visible light is strongly absorbed by biological tissue, the development of NIR probes is of high interest and importance. This provides the opportunity to apply such nanoprobes to in vivo imaging and further progress can be expected in this field.
A successful implementation in sensor systems requires the selectivity and reliability of the signal response, insensitivity to interferences, and reversibility in real samples. Thus, optrodes or nanoprobes have to be designed to work in situ, i.e., in the field, in seawater and sediments, in the hospital, under the harsh conditions in wind tunnels, and not only in the lab. which is often darkened to achieve highly sensitive imaging results. Otherwise, these techniques will remain restricted to very specific tasks and experimental conditions. Application in the field is often a major problem, although measurements in marine sediments in deep sea have been successfully carried out using sensor foils and an imaging set up integrated in lander systems [1]. Nevertheless, planar optrode measurements in rhizospheres have to be conducted ex situ and require the transplantation of plant samples into rhizoboxes for experimental studies [138].
On the other hand, sensitive coatings used for the imaging of pressure and temperature distributions on surfaces for aerodynamic tests in wind tunnels have become indispensable tools in aerodynamic research and fluid mechanics. Permanent progress has been made regarding instationary fast-responding cryogenic or binary paints.
The mapping of analytes with optrodes can be combined with other analytical methods, e.g., with localized methods giving additional information on their distribution or for multianalyte determination, which is often important to understand the interactions in biological systems [5]. Therefore, it is still worth searching for improved molecular probes, nanoprobes, and materials that are suitable for fluorescence sensing in real-world conditions. Particularly interesting for biomedical sensing and imaging would be reversible and specific probes for H2O2, biophosphates such as ATP, or glucose and its metabolites. Accordingly, there is a high interest in the design and synthesis of probes for the imaging of ATP [239], glucose and other carbohydrates [240,241], and reactive oxygen species such as H2O2 or peroxynitrite [242,243,244,245,246]. Dyes, nanoprobes, and fluorescent proteins for the imaging of intracellular temperature [247,248] or multifunctional probes for the detection of reactive oxygen species, reactive sulfur species, and harmful ions [249] are also in focus. Finally, metal–organic frameworks (MOFs) represent another sensor material type which is promising for optical imaging [250,251,252,253], and due to their porous structure, have a high potential for the sensing of gas molecules and volatile organic compounds. Lanthanide or transition metal complexes act as luminescent building blocks.

Funding

This research received no external funding.

Conflicts of Interest

The authors declare no conflict of interest.

References

  1. Schäferling, M. The art of fluorescence imaging with chemical sensors. Angew. Chem. Int. Ed. Engl. 2012, 51, 3532–3554. [Google Scholar] [CrossRef]
  2. Thevenot, D.R.; Tóth, K.; Durst, R.A.; Wilson, G.S. Electrochemical biosensors: Recommended definitions and classification. Pure Appl. Chem. 1999, 71, 2333–2348. [Google Scholar] [CrossRef]
  3. He, J.; Li, C.; Ding, L.; Huang, Y.; Yin, X.; Zhang, J.; Zhang, J.; Yao, C.; Liang, M.; Pirraco, R.P.; et al. Tumor targeting strategies of smart fluorescent nanoparticles and their applications in cancer diagnosis and treatfigurement. Adv. Mater. 2019, 31, 1902409. [Google Scholar] [CrossRef]
  4. Schäferling, M.; Resch-Genger, U. Luminescent nanoparticles for chemical sensing and Imaging. In Reviews in Fluorescence 2016; Geddes, C., Ed.; Springer: Berlin/Heidelberg, Germany, 2017; pp. 71–109. [Google Scholar] [CrossRef]
  5. Koren, K.; Zieger, S.E. Optode Based Chemical Imaging—Possibilities, Challenges, and New Avenues in Multidimensional Optical Sensing. ACS Sens. 2021, 6, 1671–1680. [Google Scholar] [CrossRef] [PubMed]
  6. Quintanilla, M.; Henriksen-Lacey, M.; Renero-Lecuna, C.; Liz-Marzán, L.M. Challenges for optical nanothermometry in biological environments. Chem. Soc. Rev. 2022, 51, 4223–4242. [Google Scholar] [CrossRef] [PubMed]
  7. Pfeiffer, S.A.; Nagl, S. Microfluidic platforms employing integrated fluorescent or luminescent chemical sensors: A review of methods, scope and applications. Methods Appl. Fluoresc. 2015, 3, 034003. [Google Scholar] [CrossRef] [PubMed]
  8. Schäferling, M.; Dürkop, A. Intrinsically Referenced Fluorimetric Sensing and Detection Schemes: Methods, Advantages and Applications. In Standardization and Quality Assurance in Fluorescence Measurement; Resch-Genger, U., Ed.; Springer: Berlin/Heidelberg, Germany, 2008; pp. 373–413. [Google Scholar]
  9. Bambot, S.B.; Lakowicz, J.R.; Rao, G. Potential applications of lifetime-based, phase-modulation fluorimetry in bioprocess and clinical monitoring. Trends Biotechnol. 1995, 13, 106–115. [Google Scholar] [CrossRef] [PubMed]
  10. Berezin, M.Y.; Achilefu, S. Fluorescence lifetime measurements and biological imaging. Chem. Rev. 2010, 110, 2641–2684. [Google Scholar] [CrossRef] [PubMed]
  11. Koren, K.; Moßhammer, M.; Scholz, V.V.; Borisov, S.M.; Holst, G.; Kühl, M. Luminescence Lifetime Imaging of Chemical Sensors: A Comparison between Time-Domain and Frequency-Domain Based Camera Systems. Anal. Chem. 2019, 91, 3233–3238. [Google Scholar] [CrossRef] [PubMed]
  12. Meier, R.J.; Fischer, L.H.; Wolfbeis, O.S.; Schäferling, M. Referenced luminescent sensing and imaging with digital color cameras: A comparative study. Sens. Actuators B 2013, 177, 500–506. [Google Scholar] [CrossRef]
  13. Hakonen, A.; Beves, J.E.; Strömberg, N. Digital Colour Tone for Fluorescence Sensing: A Direct Comparison of Intensity, Ratiometric and Hue Based Quantification. Analyst 2014, 139, 3524–3527. [Google Scholar] [CrossRef]
  14. Zieger, S.E.; Mosshammer, M.; Kuhl, M.; Koren, K. Hyperspectral Luminescence Imaging in Combination with Signal Deconvolution Enables Reliable Multi-Indicator-Based Chemical Sensing. ACS Sens. 2021, 6, 183–191. [Google Scholar] [CrossRef]
  15. Wang, X.-D.; Wolfbeis, O.S. Optical methods for sensing and imaging oxygen: Materials, spectroscopies and applications. Chem. Soc. Rev. 2014, 43, 3666–3761. [Google Scholar] [CrossRef] [PubMed]
  16. Papkovsky, D.B.; Dmitriev, R.I. Biological detection by optical oxygen sensing. Chem. Soc. Rev. 2013, 42, 8700–8732. [Google Scholar] [CrossRef] [PubMed]
  17. Dmitriev, R.I.; Papkovsky, D.B. Intracellular probes for imaging oxygen concentration: How good are they? Methods Appl. Fluoresc. 2015, 3, 034001. [Google Scholar] [CrossRef] [PubMed]
  18. Schäferling, M. Nanoparticle-based luminescent probes for intracellular sensing and imaging of pH. WIREs Nanomed. Nanobiotechnol. 2016, 8, 378–413. [Google Scholar] [CrossRef] [PubMed]
  19. Lagadic-Gossmann, D.; Huc, L.; Lecureur, V. Alterations of Intracellular pH Homeostasis in Apoptosis: Origins and Roles. Cell Death Diff. 2004, 11, 953–961. [Google Scholar] [CrossRef] [PubMed]
  20. Webb, B.A.; Chimenti, M.; Jacobson, M.P.; Barber, D.L. Dysregulated pH: A Perfect Storm for Cancer Progression. Nat. Rev. Cancer 2011, 11, 671–677. [Google Scholar] [CrossRef] [PubMed]
  21. Davies, T.A.; Fine, R.E.; Johnson, R.J.; Levesque, C.A.; Rathbun, W.H.; Seetoo, K.F.; Smith, S.J.; Strohmeier, G.; Volicer, L.; Delva, L.; et al. Non-age Related Differences in Thrombin Responses by Platelets from Male Patients with Advanced Alzheimer′s Disease. Biochem. Biophys. Res. Commun. 1993, 194, 537–543. [Google Scholar] [CrossRef] [PubMed]
  22. Casey, J.R.; Grinstein, S.; Orlowski, J. Sensors and Regulators of Intracellular pH. Nat. Rev. Mol. Cell. Biol. 2010, 11, 50–61. [Google Scholar] [CrossRef]
  23. Miksa, M.; Komura, H.; Wu, R.; Shah, K.G.; Wang, P. A Novel Method to Determine the Engulfment of Apoptotic Cells by Macrophages Using pHrodo Succinimidyl Ester. J. Immunol. Methods 2009, 342, 71–77. [Google Scholar] [CrossRef] [PubMed]
  24. Lakadamyali, M.; Rust, M.J.; Babcock, H.P.; Zhuang, X. Visualizing Infection of Individual Influenza Viruses. Proc. Natl. Acad. Sci. USA 2003, 100, 9280–9285. [Google Scholar] [CrossRef] [PubMed]
  25. Adie, E.J.; Kalinka, S.; Smith, L.; Francis, M.J.; Marenghi, A.; Cooper, M.E.; Briggs, M.; Michael, N.P.; Milligan, G.; Game, S. A pH-Sensitive Fluor, CypHer 5, Used to Monitor Agonist-Induced G Protein-Coupled Receptor Internalization in Live Cells. BioTechniques 2002, 33, 1152–1156. [Google Scholar] [CrossRef]
  26. Wencel, D.; Abel, T.; McDonagh, C. Optical Chemical pH Sensors. Anal. Chem. 2014, 86, 15–29. [Google Scholar] [CrossRef] [PubMed]
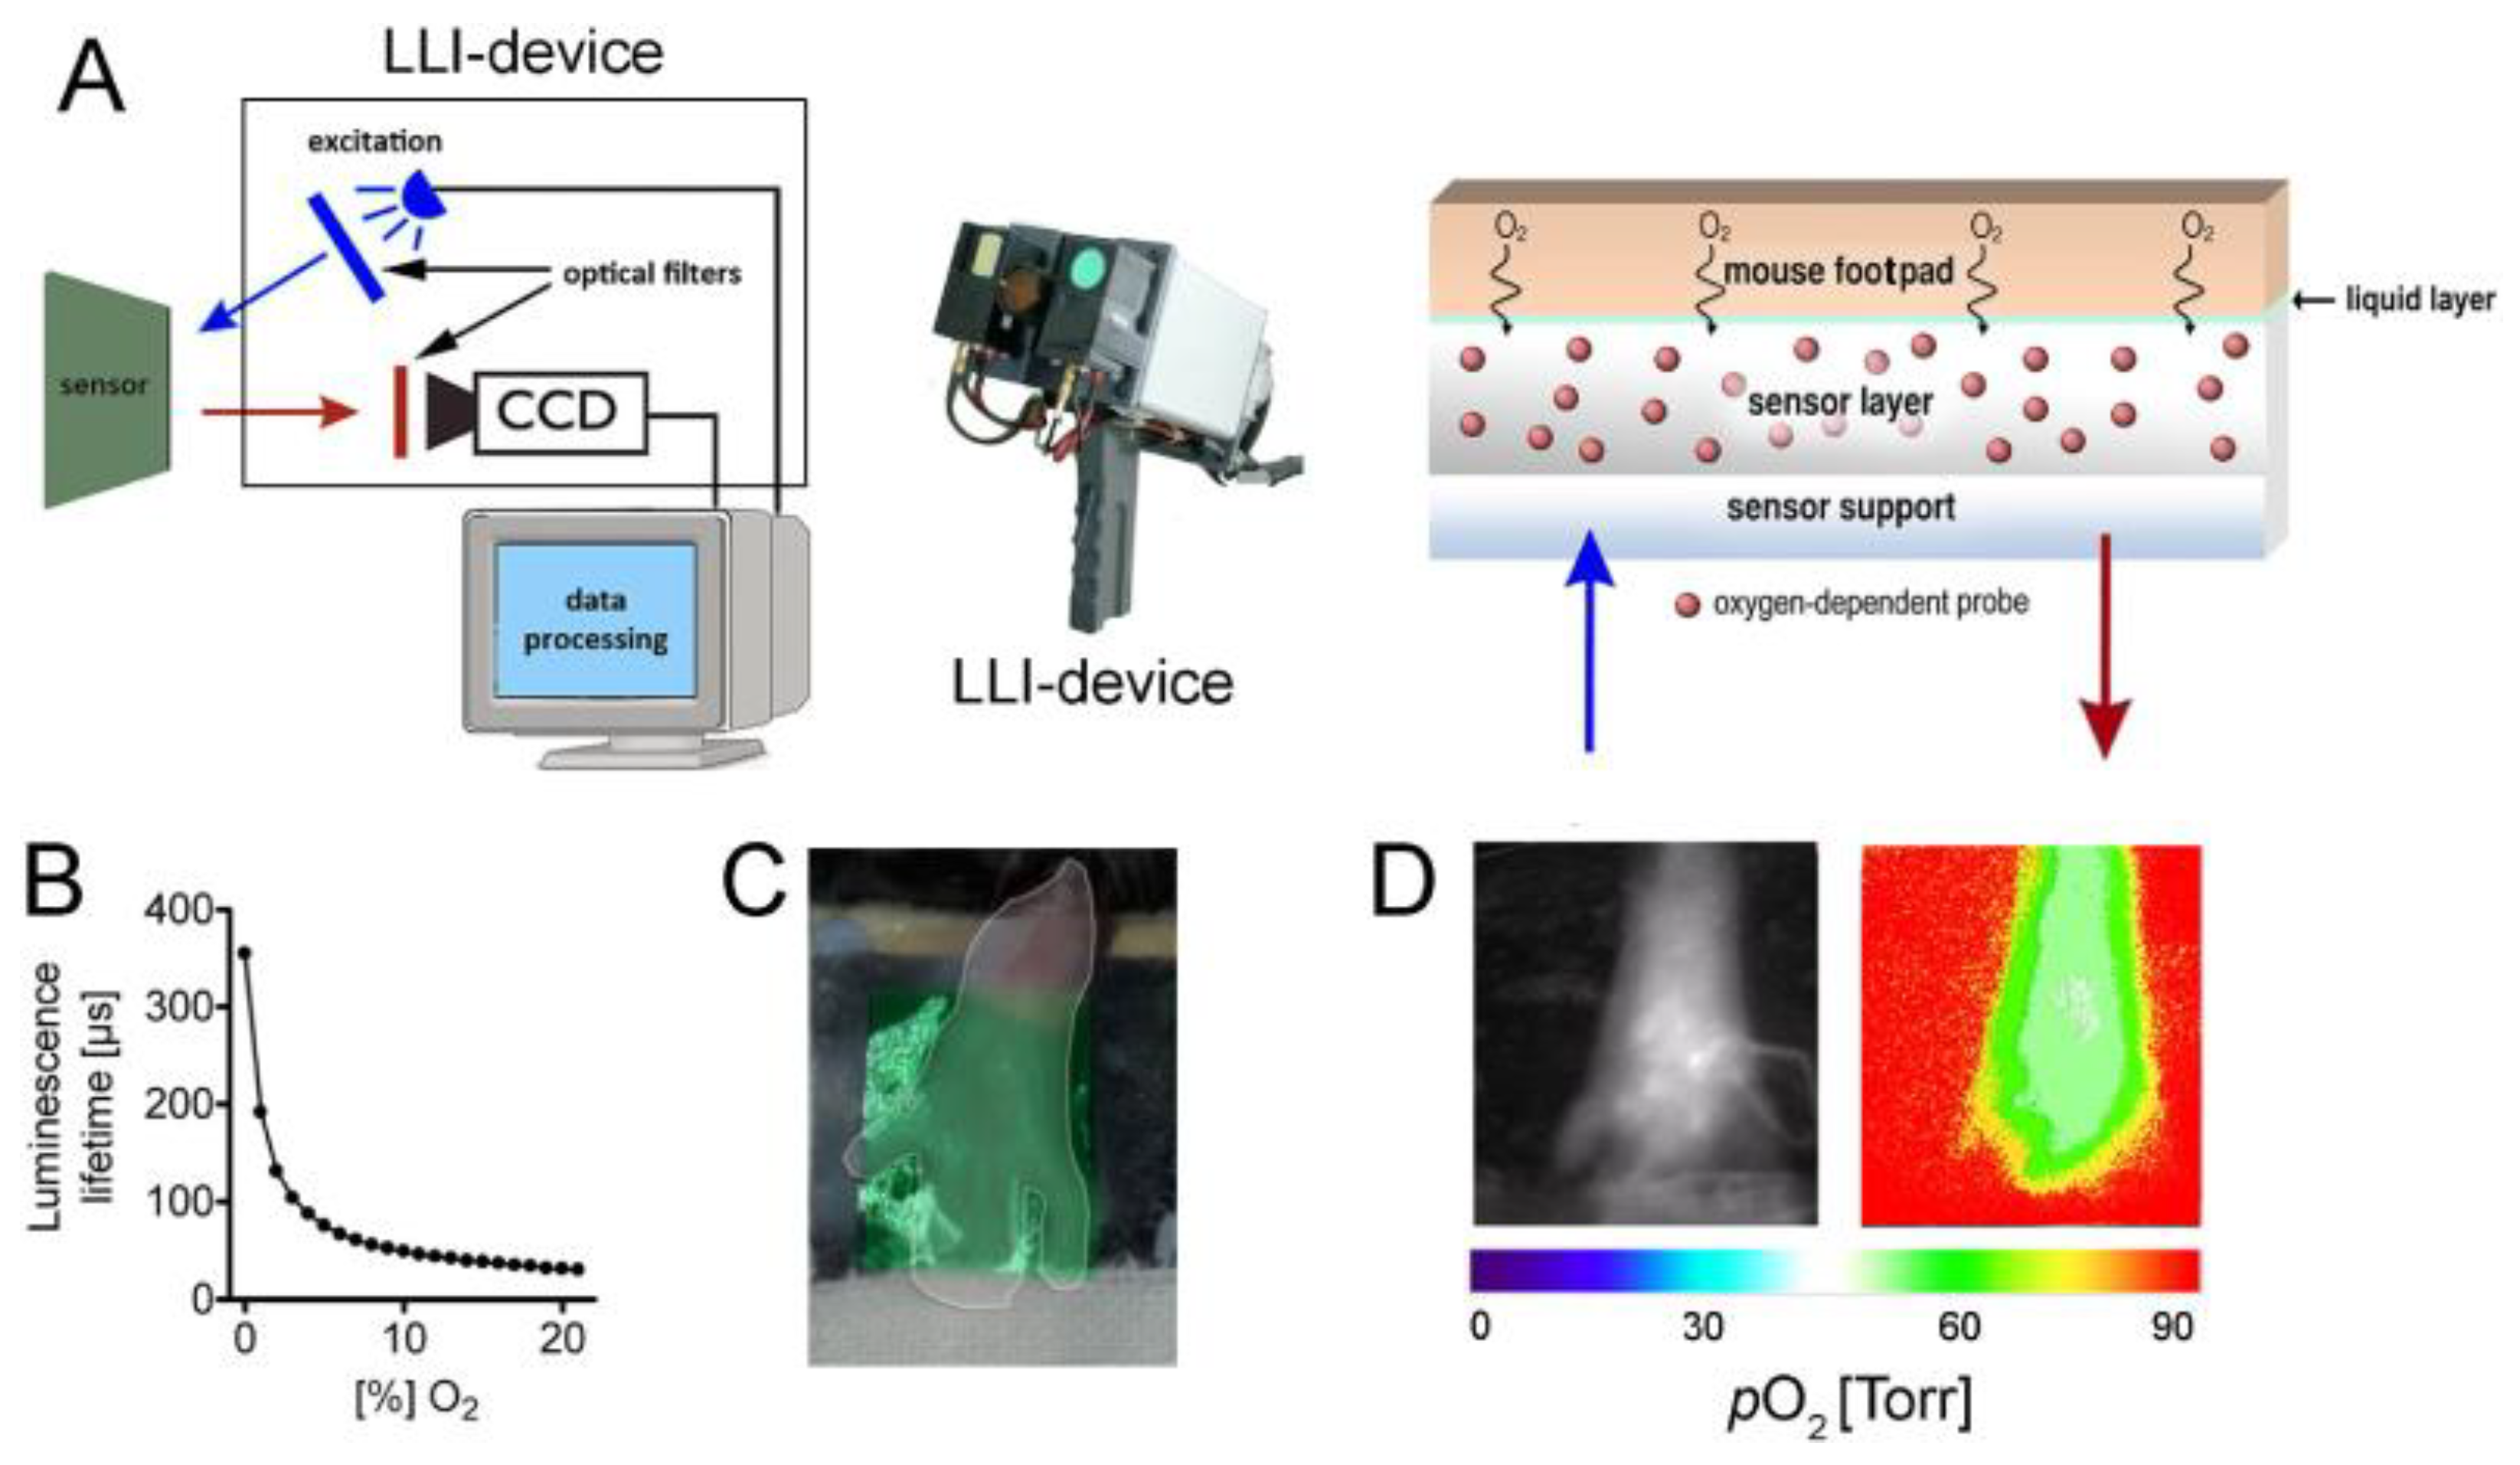
  27. Babilas, P.; Liebsch, G.; Schacht, V.; Klimant, I.; Wolfbeis, O.S.; Szeimies, R.-M.; Abels, C. In Vivo Phosphorescence Imaging of pO2 Using Planar Oxygen Sensors. Microcirculation 2005, 12, 477–487. [Google Scholar] [CrossRef] [PubMed]
  28. Schreml, S.; Meier, R.J.; Wolfbeis, O.S.; Landthaler, M.; Szeimies, R.-M.; Babilas, P. 2D Luminescence Imaging of pH in Vivo. Proc. Natl. Acad. Sci. USA 2011, 108, 2432–2437. [Google Scholar] [CrossRef] [PubMed]
  29. Boss, M.K.; Palmer, G.; Dewhirst, M. Imaging the Hypoxic Tumor Microenvironment in Preclinical Models. In Hypoxia and Cancer. Cancer Drug Discovery and Development; Melillo, G., Ed.; Springer: New York, NY, USA, 2014; pp. 157–178. [Google Scholar] [CrossRef]
  30. Borisov, S.M.; Fischer, R.; Saf, R.; Klimant, I. Exceptional Oxygen Sensing Properties of New Blue Light-Excitable Highly Luminescent Europium(III) and Gadolinium(III) Complexes. Adv. Funct. Mater. 2014, 24, 6548–6560. [Google Scholar] [CrossRef]
  31. Meier, J.K.; Prantl, L.; Müller, S.; Moralis, A.; Liebsch, G.; Gosau, M. Simple, Fast and Reliable Perfusion Monitoring of Microvascular Flaps. Clin. Hemorheol. Microcirc. 2012, 50, 13–24. [Google Scholar] [CrossRef]
  32. Hofmann, J.; Meier, R.J.; Mahnke, A.; Schatz, V.; Brackmann, F.; Trollmann, R.; Bogdan, C.; Liebsch, G.; Wang, X.D.; Wolfbeis, O.S.; et al. Ratiometric Luminescence 2D In Vivo Imaging and Monitoring of Mouse Skin Oxygenation. Methods Appl. Fluoresc. 2013, 1, 045002. [Google Scholar] [CrossRef]
  33. Jennewein, J.; Matuszak, J.; Walter, S.; Felmy, B.; Gendera, K.; Schatz, V.; Nowottny, M.; Liebsch, G.; Hensel, M.; Hardt, W.D.; et al. Low-Oxygen Tensions Found in Salmonella-Infected Gut Tissue Boost Salmonella Replication in Macrophages by Impairing Antimicrobial Activity and Augmenting Salmonella Virulence. Cell Microbiol. 2015, 17, 1833–1847. [Google Scholar] [CrossRef]
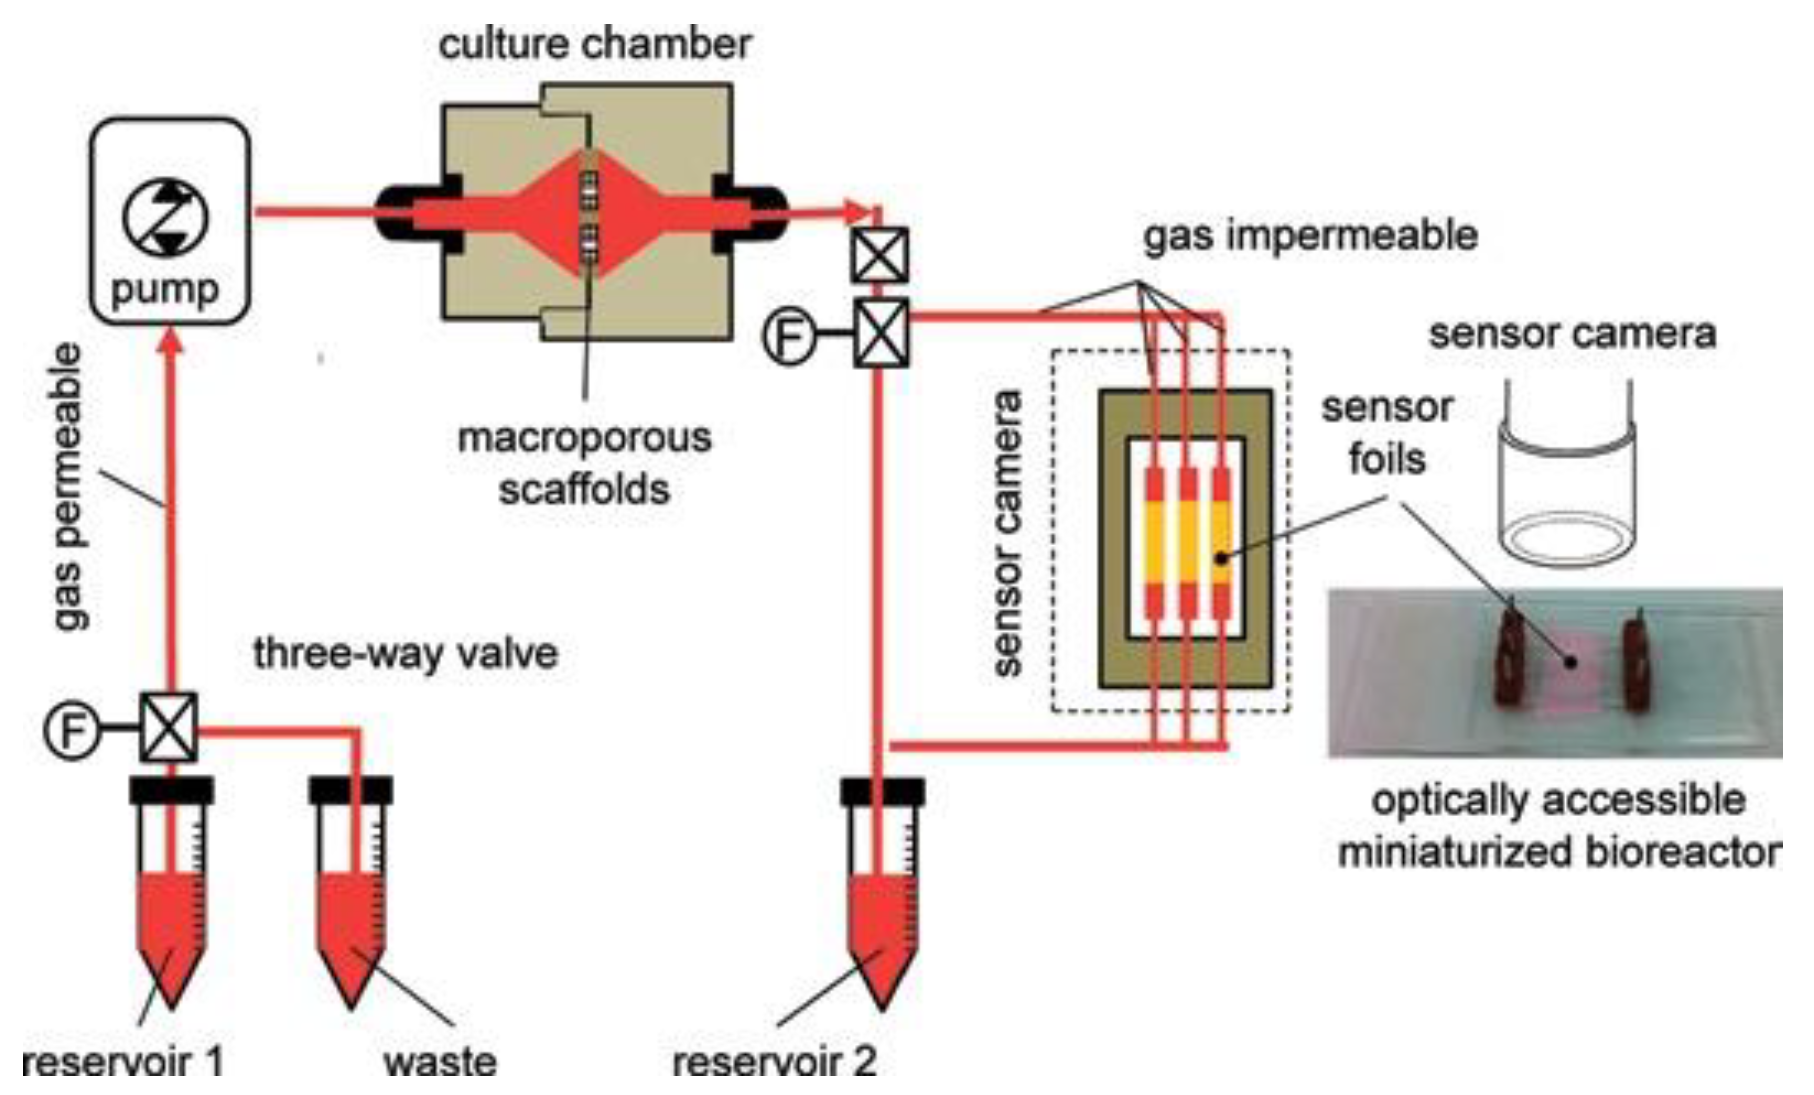
  34. Jenkins, J.; Dmitriev, R.I.; Morten, K.; McDermott, K.W.; Papkovsky, D.B. Oxygen-Sensing Scaffolds for 3-Dimensional Cell and Tissue Culture. Acta Biomater. 2015, 16, 126–135. [Google Scholar] [CrossRef]
  35. Khosravi, Y.; Kandukuri, R.D.P.; Palmer, S.R.; Gloag, E.S.; Borisov, S.M.; Starke, E.M.; Ward, M.T.; Kumar, P.; de Beer, D.; Stoodle, A.C.P. Use of an Oxygen Planar Optode to Assess the Effect of High Velocity Microsprays on Oxygen Penetration in a Human Dental Biofilms In-Vitro. BMC Oral Health 2020, 20, 230. [Google Scholar] [CrossRef]
  36. Westphal, I.; Jedelhauser, C.; Liebsch, G.; Wilhelmi, A.; Aszodi, A.; Schieker, M. Oxygen Mapping: Probing a Novel Seeding Strategy for Bone Tissue Engineering. Biotechnol. Bioeng. 2017, 114, 894–902. [Google Scholar] [CrossRef] [PubMed]
  37. Wolff, P.; Heimann, L.; Liebsch, G.; Meier, R.J.; Gutbrod, M.; van Griensven, M.; Balmayor, E.R. Oxygen-Distribution within 3-D Collagen I Hydrogels for Bone Tissue Engineering. Mat. Sci. Eng. C 2019, 95, 422–427. [Google Scholar] [CrossRef] [PubMed]
  38. Eghbali, H.; Nava, M.M.; Leonardi, G.; Mohebbi-Kalhori, D.; Sebastiano, R.; Samimi, A.; Raimondi, M.T. An Experimental-Numerical Investigation on the Effects of Macroporous Scaffold Geometry on Cell Culture Parameters. Int. J. Artif. Organs. 2017, 40, 185–195. [Google Scholar] [CrossRef] [PubMed]
  39. Peniche Silva, C.J.; Liebsch, G.; Meier, R.J.; Gutbrod, M.S.; Balmayor, E.R.; van Griensven, M. A New Non-Invasive Technique for Measuring 3D-Oxygen Gradients in Wells During Mammalian Cell Culture. Front. Bioeng. Biotechnol. 2020, 8, 595. [Google Scholar] [CrossRef] [PubMed]
  40. Deygas, M.; Gadet, R.; Gillet, G.; Rimokh, R.; Gonzalo, P.; Mikaelian, I. Redox Regulation of EGFR Steers Migration of Hypoxic Mammary Cells towards Oxygen. Nat. Commun. 2018, 9, 4545. [Google Scholar] [CrossRef]
  41. Dargaville, R.; Farrugia, B.L.; Broadbent, J.A.; Pace, S.; Upton, Z.; Voelcker, N.H. Sensors and imaging for wound healing: A review. Biosens. Bioelectronics. 2013, 41, 30–42. [Google Scholar] [CrossRef] [PubMed]
  42. Meier, R.J.; Simbürger, J.M.B.; Soukka, T.; Schäferling, M. Background-free referenced luminescence sensing and imaging of pH using upconverting phosphors and color camera read-out. Anal. Chem. 2014, 86, 5535–5540. [Google Scholar] [CrossRef]
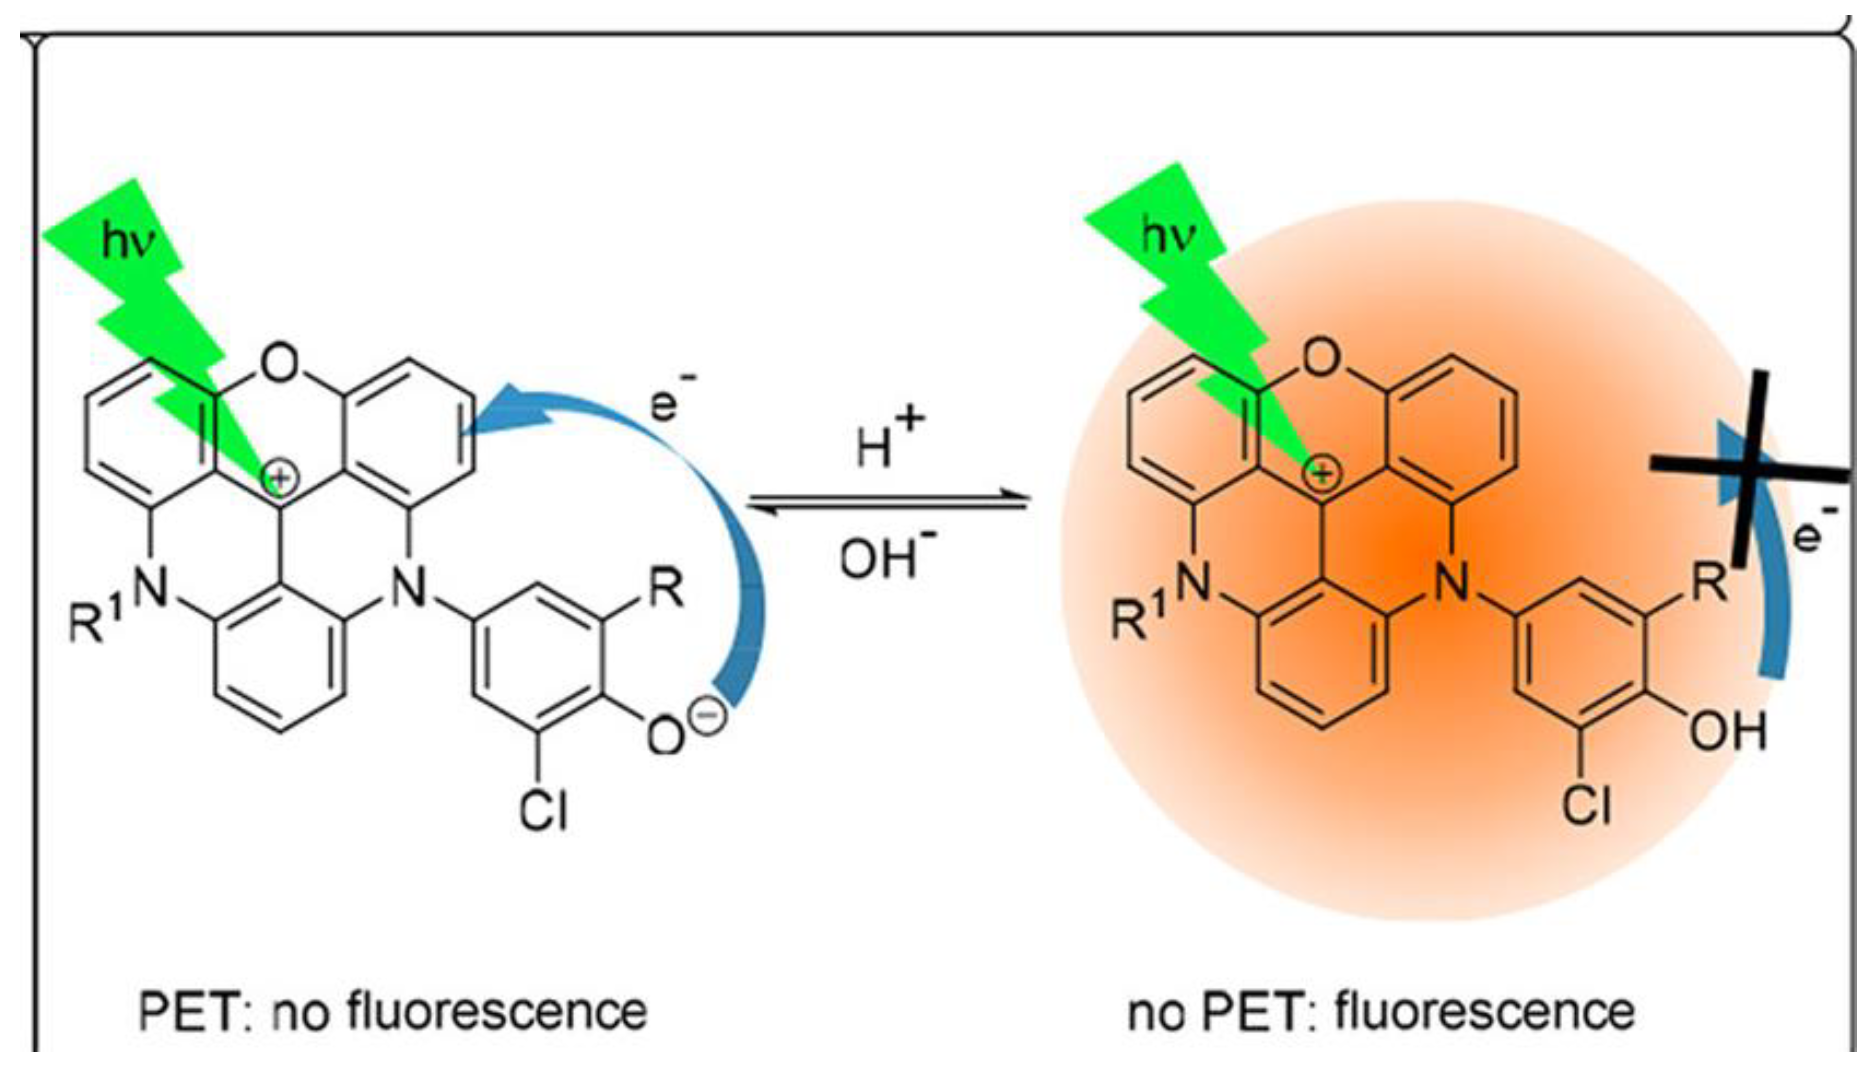
  43. Dalfen, I.; Dmitriev, R.I.; Holst, G.; Klimant, I.; Borisov, S.M. Background-free fluorescence-decay-time sensing and imaging of pH with highly photostable diazaoxotriangulenium dyes. Anal. Chem. 2019, 91, 808–816. [Google Scholar] [CrossRef]
  44. Schreml, S.; Meier, R.J.; Weiß, K.T.; Cattani, J.; Flittner, D.; Gehmert, S.; Wolfbeis, O.S.; Landthaler, M.; Babilas, P. A sprayable luminescent pH sensor and its use for wound imagingin vivo. Exp. Dermatol. 2012, 21, 948–976. [Google Scholar] [CrossRef] [PubMed]
  45. Wang, X.D.; Meier, R.J.; Schmittlein, C.; Schreml, S.; Schäferling, M.; Wolfbeis, O.S. A water-sprayable, thermogelating and biocompatible polymer host for use in fluorescent chemical sensing and imaging of oxygen, pH values and temperature. Sens. Actuators B 2015, 221, 37–44. [Google Scholar] [CrossRef]
  46. Schreml, S.; Zeller, V.; Meier, R.J.; Korting, H.C.; Behm, B.; Landthaler, M.; Babilas, P. Impact of Age and Body Site on Adult Female Skin Surface pH. Dermatology 2012, 224, 66–71. [Google Scholar] [CrossRef] [PubMed]
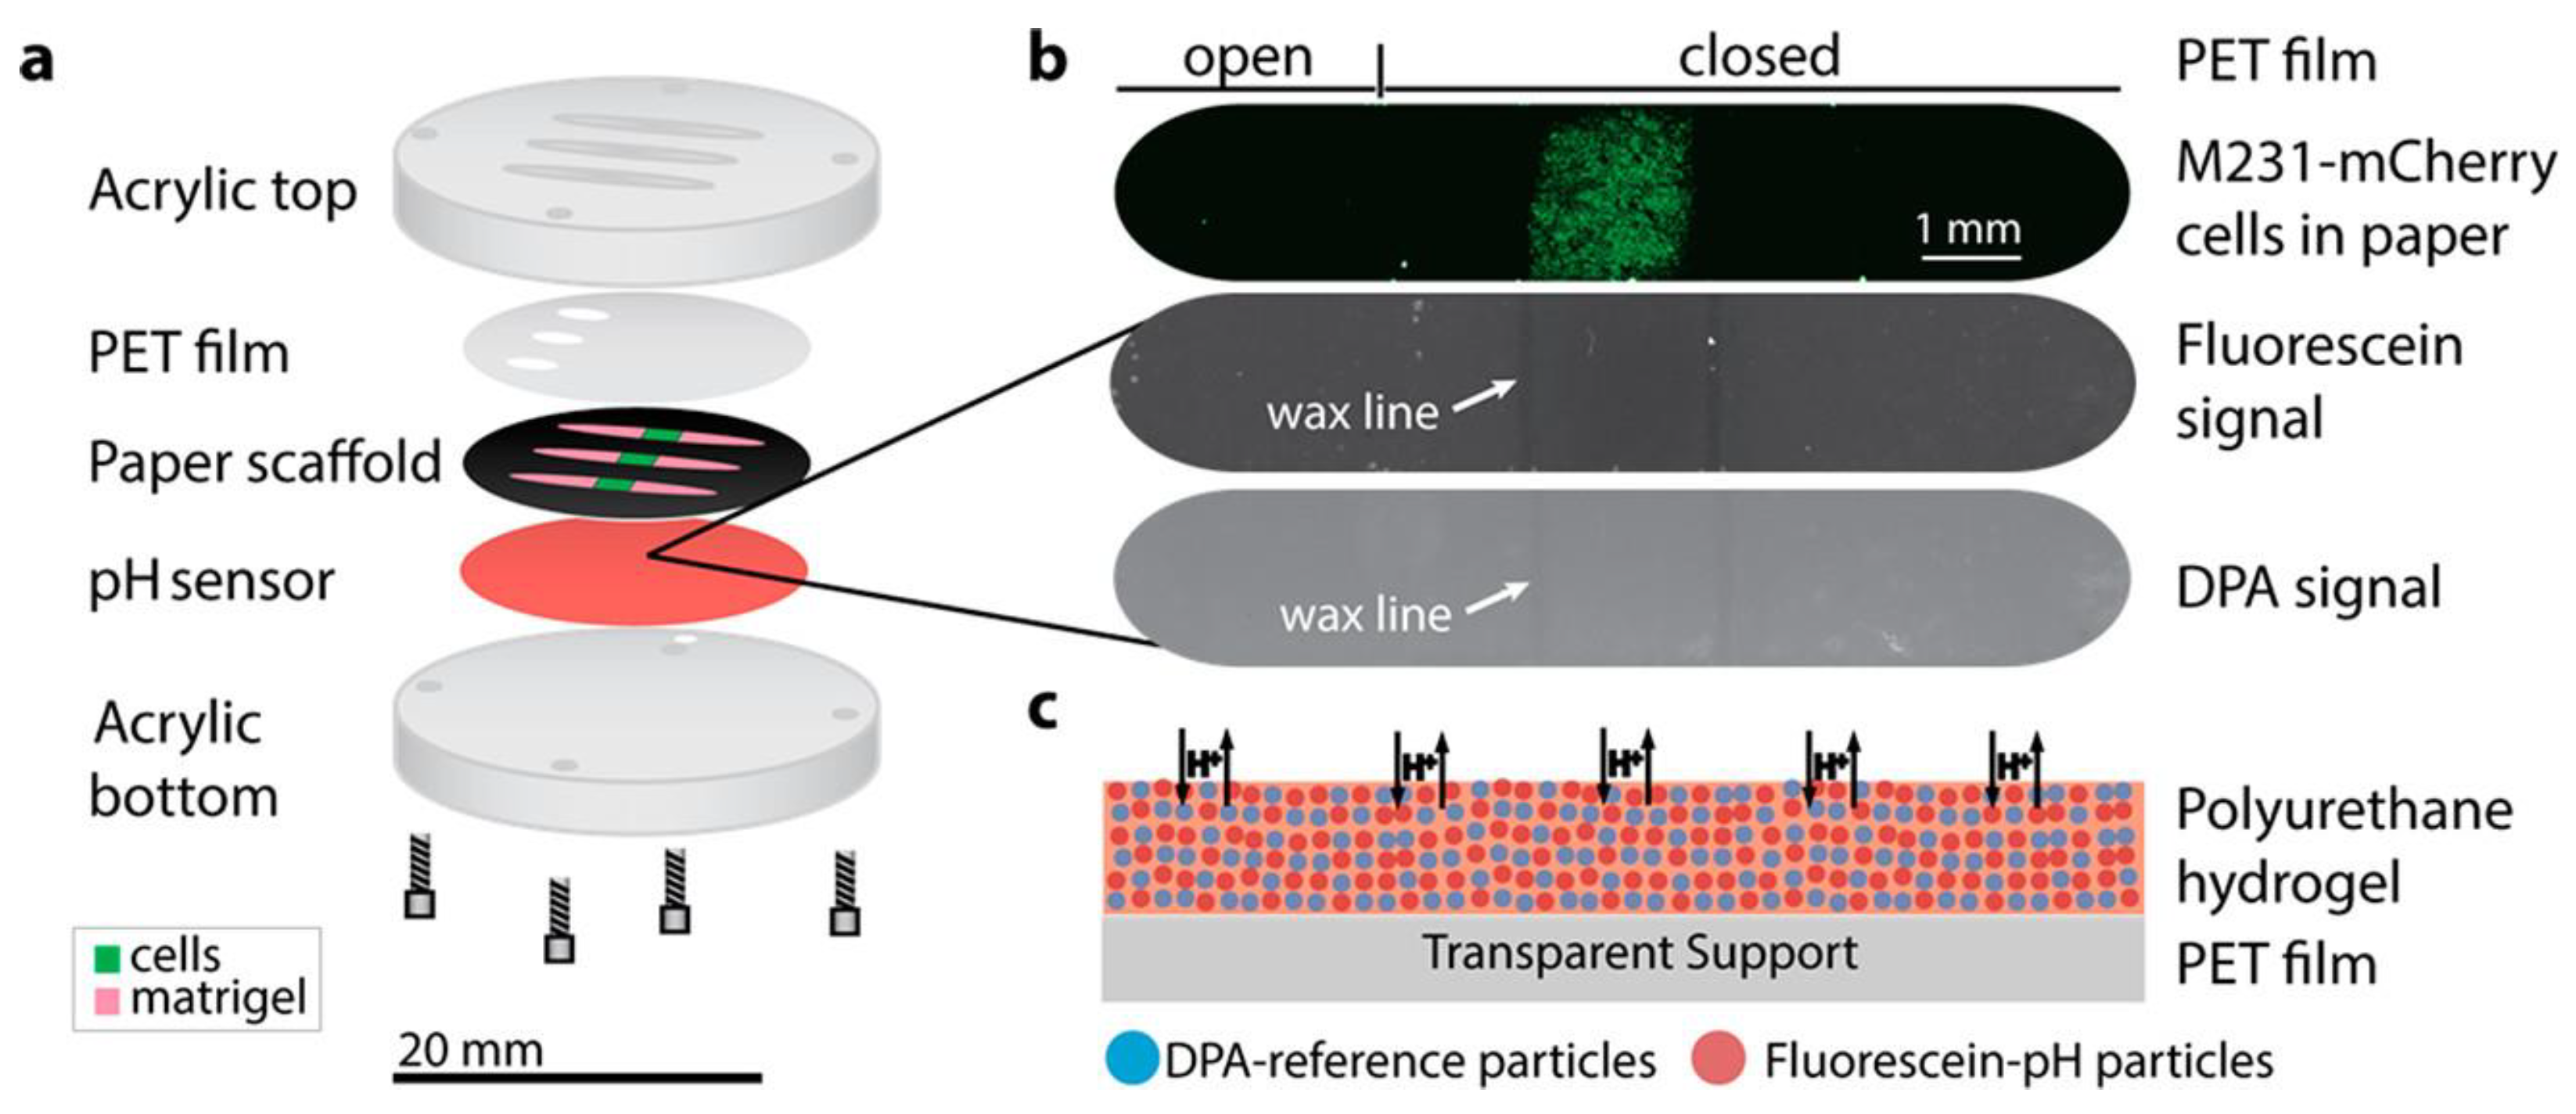
  47. Kenney, R.M.; Boyce, M.W.; Whitman, N.A.; Kromhout, B.P.; Lockett, M.R. A pH-Sensing Optode for Mapping Spatiotemporal Gradients in 3D Paper-Based Cell Cultures. Anal. Chem. 2018, 90, 2376–2383. [Google Scholar] [CrossRef] [PubMed]
  48. Gotor, R.; Ashokkumar, P.; Hecht, M.; Keil, K.; Rurack, K. Optical pH Sensor Covering the Range from pH 0–14 Compatible with Mobile-Device Readout and Based on a Set of Rationally Designed Indicator Dyes. Anal. Chem. 2017, 89, 8437–8444. [Google Scholar] [CrossRef] [PubMed]
  49. Staudinger, C.; Breininger, J.; Klimant, I.; Borisov, S.M. Near-Infrared Fluorescent Aza-BODIPY Dyes for Sensing and Imaging of pH from the Neutral to Highly Alkaline Range. Analyst 2019, 144, 2393–2402. [Google Scholar] [CrossRef] [PubMed]
  50. Pfeifer, D.; Russegger, A.; Klimant, I.; Borisov, S.M. Green to Red Emitting BODIPY Dyes for Fluorescent Sensing and Imaging of Carbon Dioxide. Sens. Actuators B 2020, 304, 127312. [Google Scholar] [CrossRef]
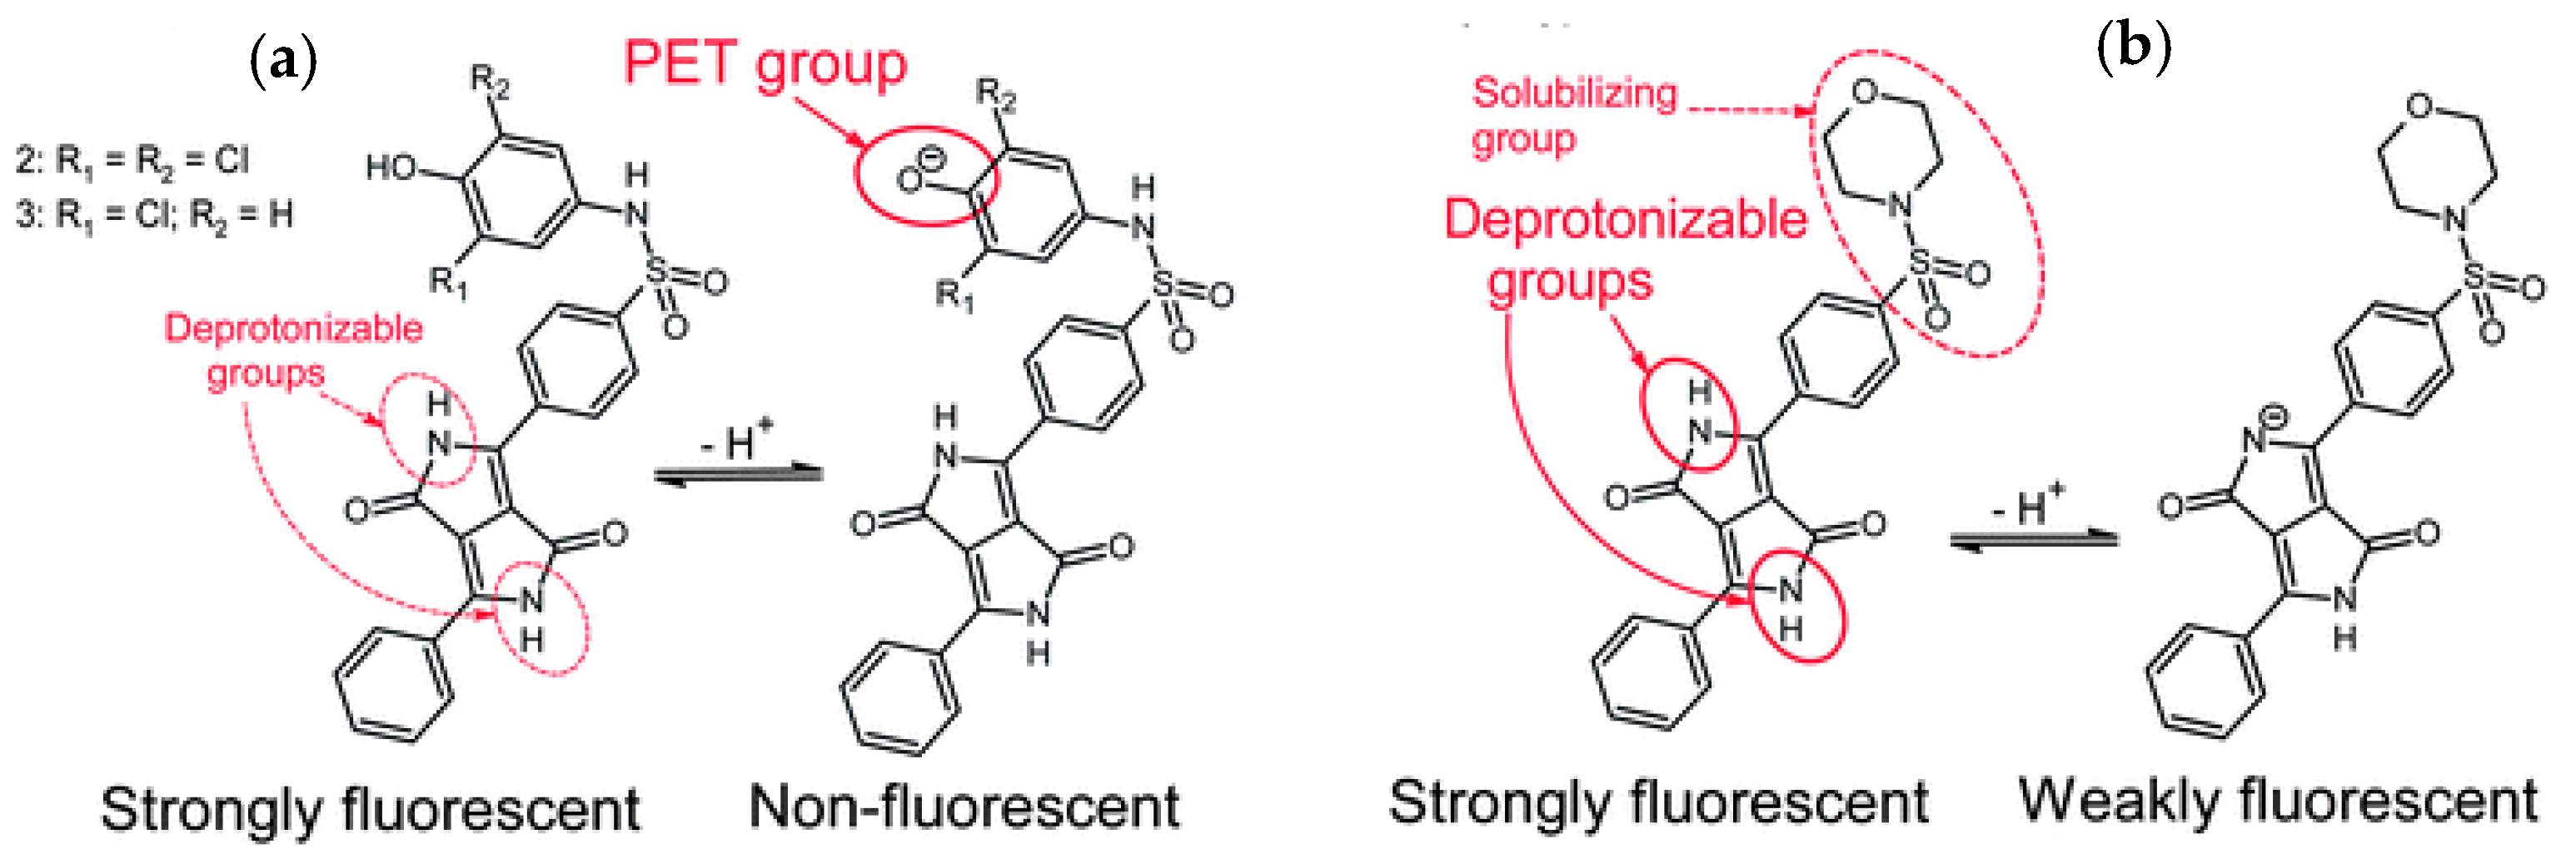
  51. Aigner, D.; Ungerbock, B.; Mayr, T.; Saf, R.; Klimant, I.; Borisov, S.M. Fluorescent Materials for pH Sensing and Imaging Based on Novel 1,4-Diketopyrrolo-[3,4-c]pyrrole Dyes. J. Mater. Chem. C 2013, 1, 5685–5693. [Google Scholar] [CrossRef]
  52. Schutting, S.; Borisov, S.M.; Klimant, I. Diketo-Pyrrolo-Pyrrole Dyes as New Colorimetric and Fluorescent pH Indicators for Optical Carbon Dioxide Sensors. Anal. Chem. 2013, 85, 3271–3279. [Google Scholar] [CrossRef]
  53. Schutting, S.; Klimant, I.; de Beer, D.; Borisov, S.M. New Highly Fluorescent pH Indicator for Ratiometric RGB Imaging of pCO2. Methods Appl. Fluoresc. 2014, 2, 024001. [Google Scholar] [CrossRef]
  54. Pedersen, L.L.; Dechesne, A.; Smets, B.F. A Nitrate Sensitive Planar Optode; Performance and Interferences. Talanta 2015, 144, 933–937. [Google Scholar] [CrossRef]
  55. Kumar, R.S.; Ashok Kumar, S.K.; Vijayakrishna, K.; Sivaramakrishna, A.; Paira, P.; Brahmmananada Rao, C.V.S.; Sivaraman, N.; Sahoo, S.K. Bipyridine Bisphosphonate-Based Fluorescent Optical Sensor and Optode for Selective Detection of Zn2+ Ions and its Applications. N. J. Chem. 2018, 42, 8494–8502. [Google Scholar] [CrossRef]
  56. Stich, M.I.J.; Schäferling, M.; Wolfbeis, O.S. Multicolor Fluorescent and Permeation-Selective Microbeads Enable Simultaneous Sensing of pH, Oxygen, and Temperature. Adv. Mater. 2009, 21, 2216–2220. [Google Scholar] [CrossRef]
  57. Borisov, S.M.; Seifner, R.; Klimant, I. A Novel Planar Optical Sensor for Simultaneous Monitoring of Oxygen, Carbon Dioxide, pH and Temperature. Anal. Bioanal. Chem. 2011, 400, 2463–2474. [Google Scholar] [CrossRef] [PubMed]
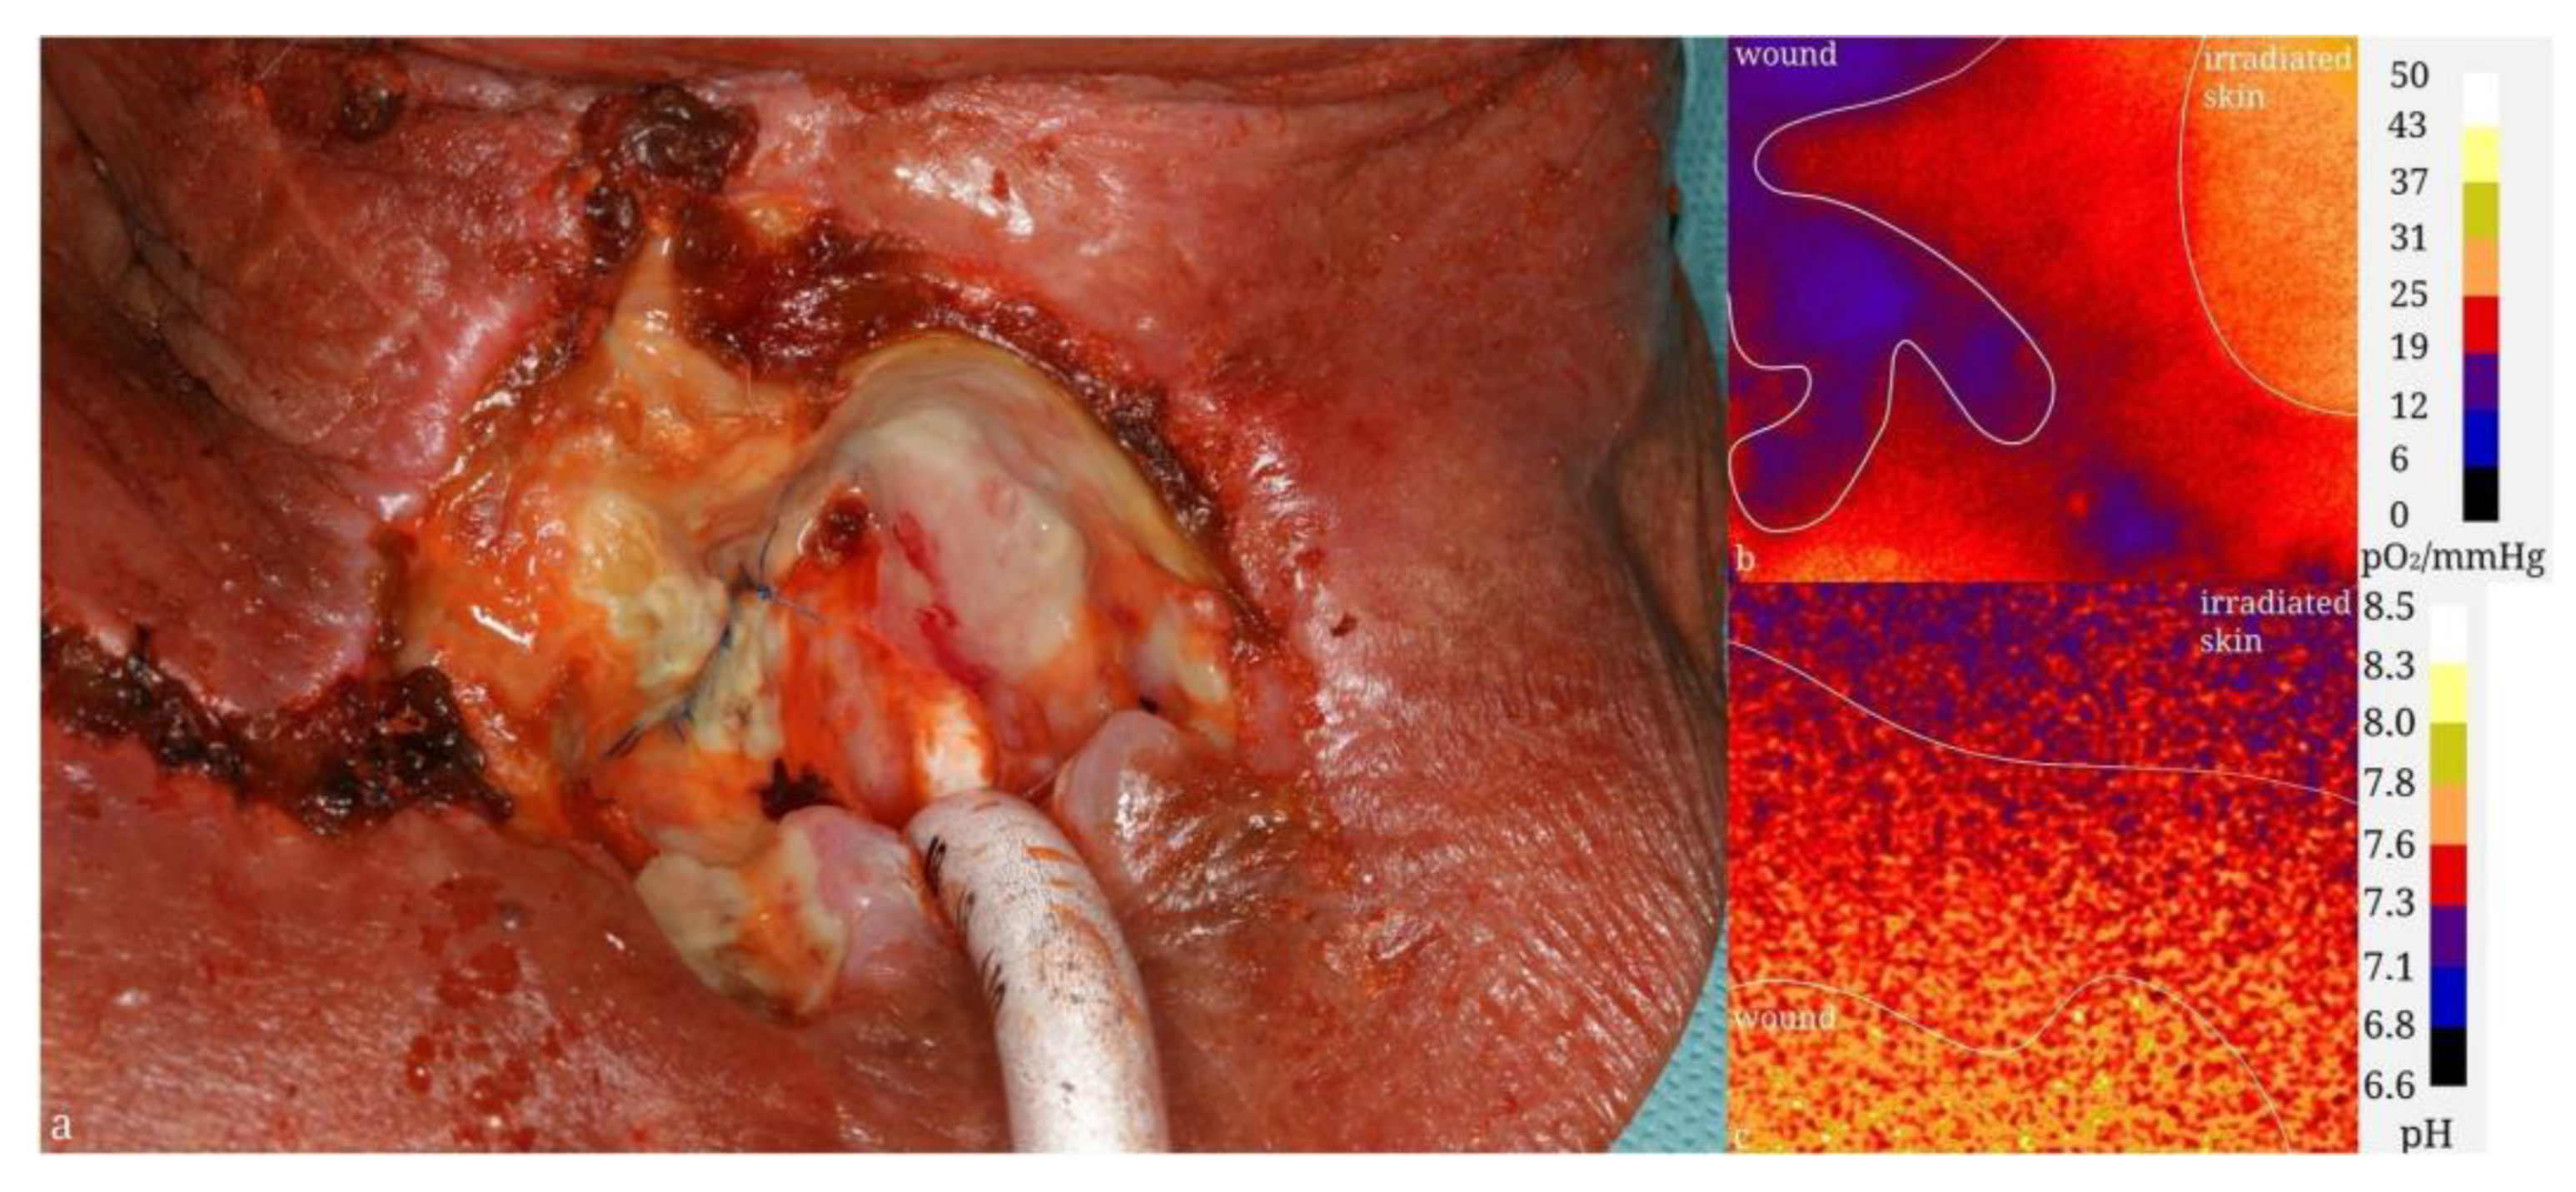
  58. Schreml, S.; Meier, R.J.; Kirschbaum, M.; Kong, S.C.; Gehmert, S.; Felthaus, O.; Küchler, S.; Sharpe, J.R.; Wöltje, K.; Weiß, K.T.; et al. Luminescent Dual Sensors Reveal Extracellular pH-Gradients and Hypoxia on Chronic Wounds That Disrupt Epidermal Repair. Theranostics 2014, 4, 721–735. [Google Scholar] [CrossRef] [PubMed]
  59. Auerswald, S.; Schreml, S.; Meier, R.J.; Blancke Soares, A.; Niyazi, M.; Marschner, S.; Belka, C.; Canis, M.; Haubner, F. Wound Monitoring of pH and Oxygen in Patients after Radiation Therapy. Radiat. Oncol. 2019, 14, 199. [Google Scholar] [CrossRef] [PubMed]
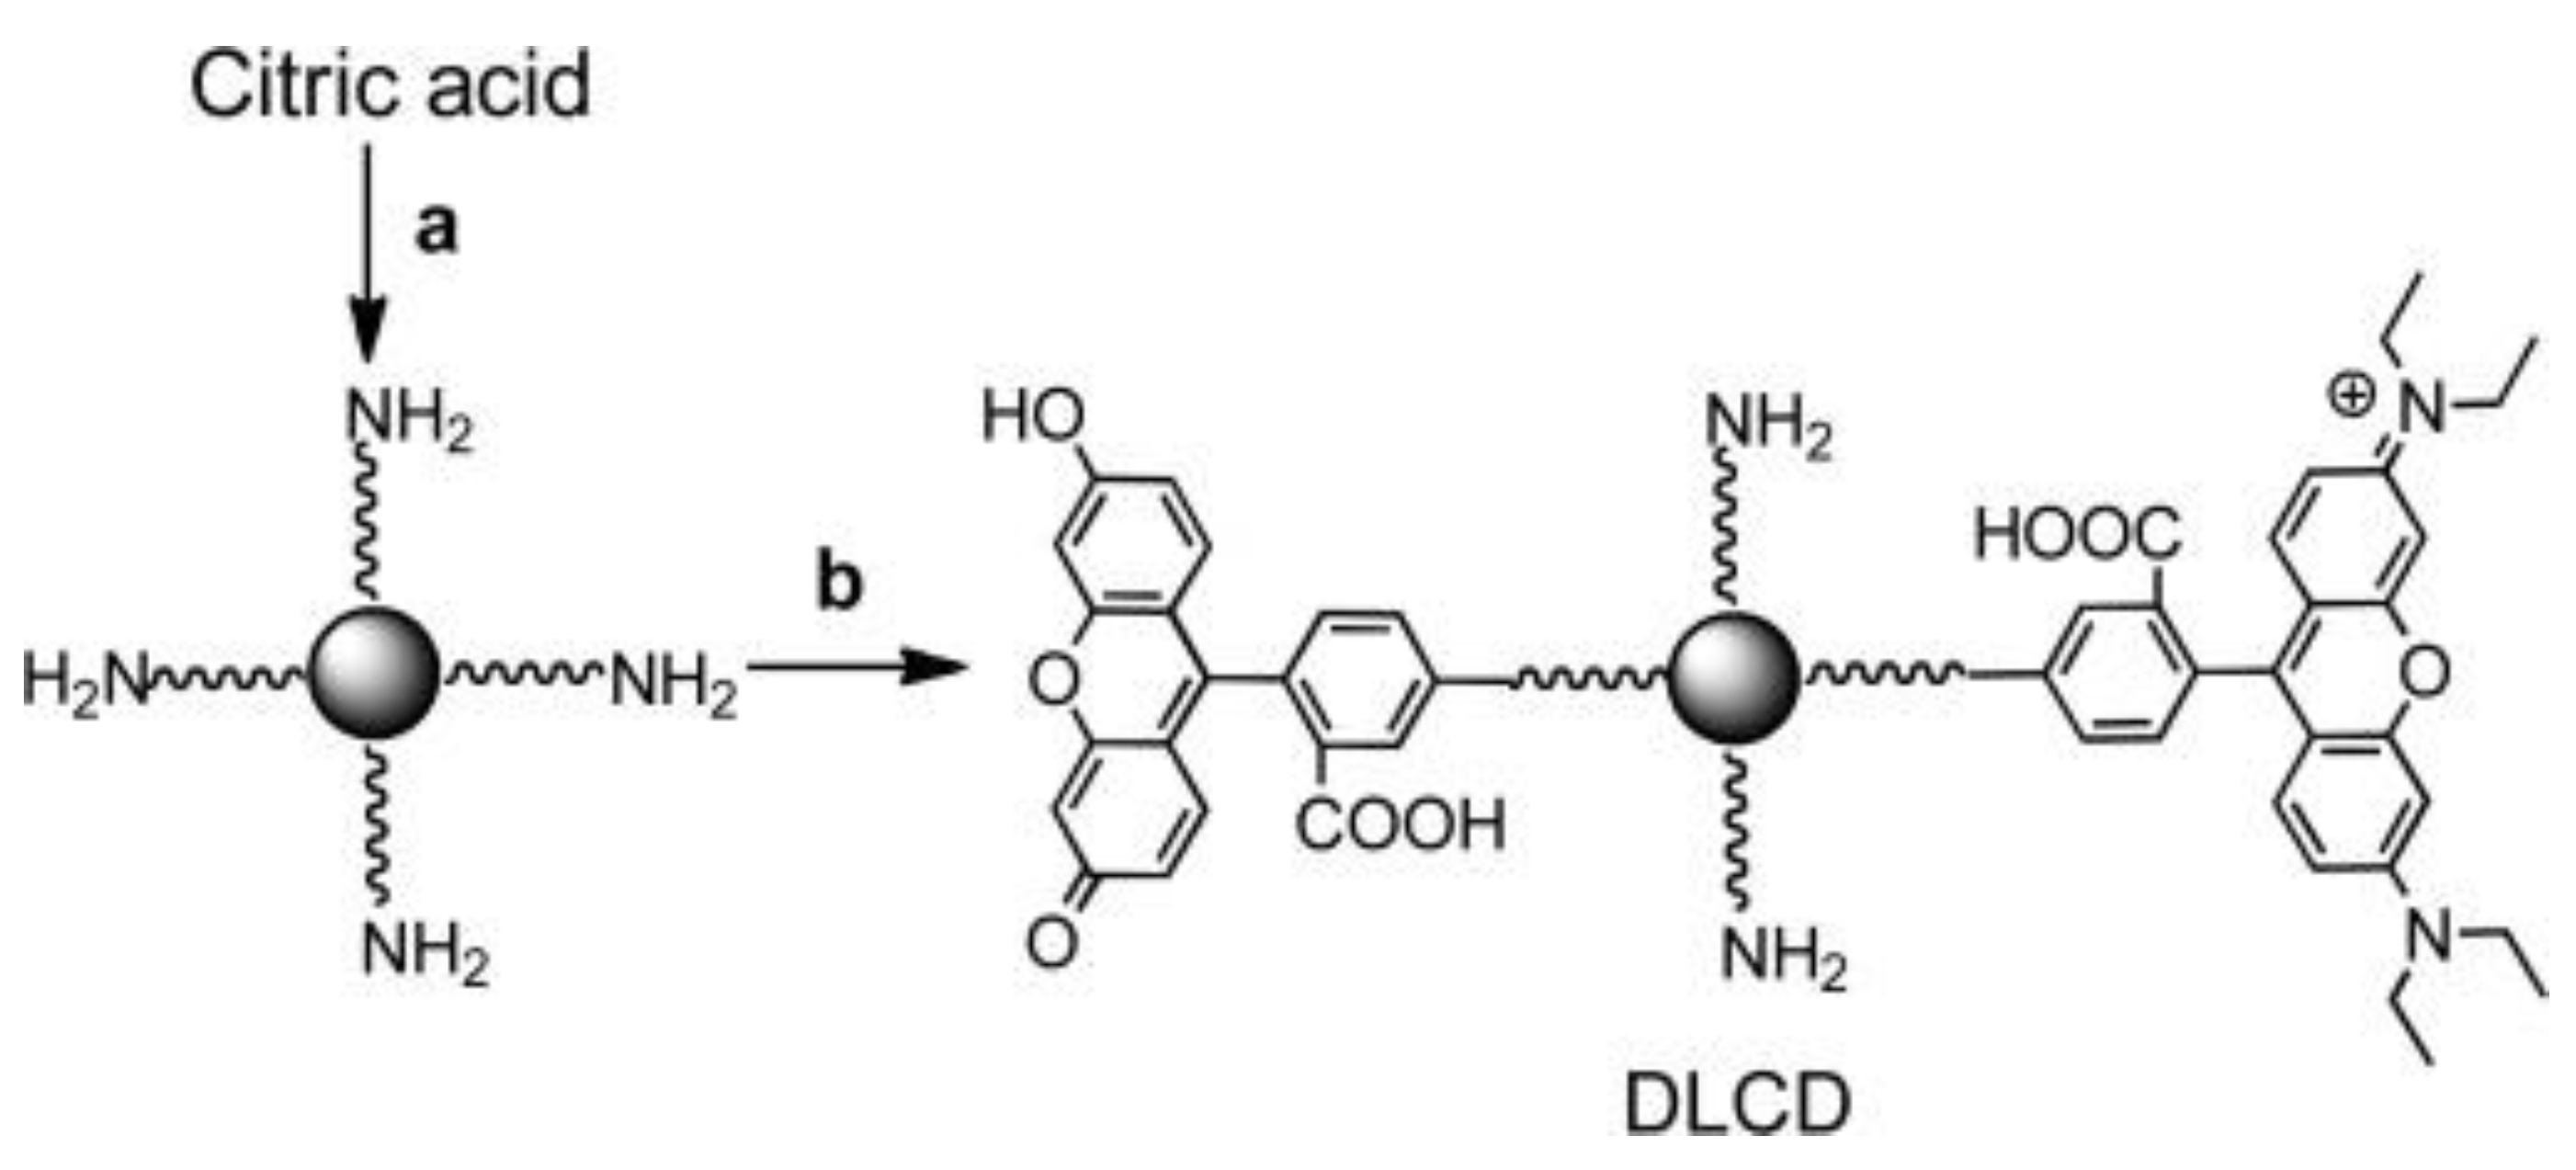
  60. Wang, K.; He, X.; Yang, X.; Shi, H. Functionalized Silica Nanoparticles: A Platform for Fluorescence Imaging at the Cell and Small Animal Levels. Acc. Chem. Res. 2013, 46, 1367–1376. [Google Scholar] [CrossRef]
  61. Du, X.; Li, N.; Chen, O.; Wu, Z.; Zhai, J.; Xie, X. Perspective on Fluorescence Cell Imaging with Ionophore-Based Ion-Selective Nanooptodes. Biomicrofluidics 2022, 16, 031301. [Google Scholar] [CrossRef] [PubMed]
  62. Bonacchi, S.; Genovese, D.; Juris, R.; Montalti, M.; Prodi, L.; Rampazzo, E.; Zaccheroni, N. Luminescent Silica Nanoparticles: Extending the Frontiers of Brightness. Angew. Chem. Int. Ed. 2011, 50, 4056–4066. [Google Scholar] [CrossRef]
  63. Chatterjee, S.; Li, X.-S.; Liang, F.; Yang, Y.-W. Design of Multifunctional Fluorescent Hybrid Materials Based on SiO2 Materials and Core–Shell Fe3O4@SiO2 Nanoparticles for Metal Ion Sensing. Small 2019, 15, 1904569. [Google Scholar] [CrossRef]
  64. Parra, M.; Gil, S.; Gaviña, P.; Costero, A.M. Mesoporous Silica Nanoparticles in Chemical Detection: From Small Species to Large Bio-Molecules. Sensors 2022, 22, 261. [Google Scholar] [CrossRef]
  65. Chen, Y.P.; Chen, H.A.; Hung, Y.; Chien, F.C.; Chen, P.; Mou, C.Y. Surface Charge Effect in Intracellular Localization of Mesoporous Silica Nanoparticles as Probed by Fluorescent Ratiometric pH Imaging. RSC Adv. 2012, 2, 968–973. [Google Scholar] [CrossRef]
  66. Tsou, C.J.; Chu, C.-Y.; Hung, Y.; Mou, C.Y. A Broad Range Fluorescent pH Sensor Based on Hollow Mesoporous Silica Nanoparticles, Utilising the Surface Curvature Effect. J. Mater. Chem. B 2013, 1, 5557–5563. [Google Scholar] [CrossRef] [PubMed]
  67. Peng, J.; Li, J.; Xu, W.; Wang, L.; Su, D.; Teoh, C.L.; Chang, Y.T. Silica Nanoparticle-Enhanced Fluorescent Sensor Array for Heavy Metal Ions Detection in Colloid Solution. Anal. Chem. 2018, 90, 1628–1634. [Google Scholar] [CrossRef]
  68. Gao, Z.; Wang, Z.; Qiao, M.; Peng, H.; Ding, L.; Fang, Y. Mesoporous Silica Nanoparticles-Based Fluorescent Mini Sensor Array with Dual Emission for Discrimination of Biothiols. Colloids Surf. A 2020, 606, 125433. [Google Scholar] [CrossRef]
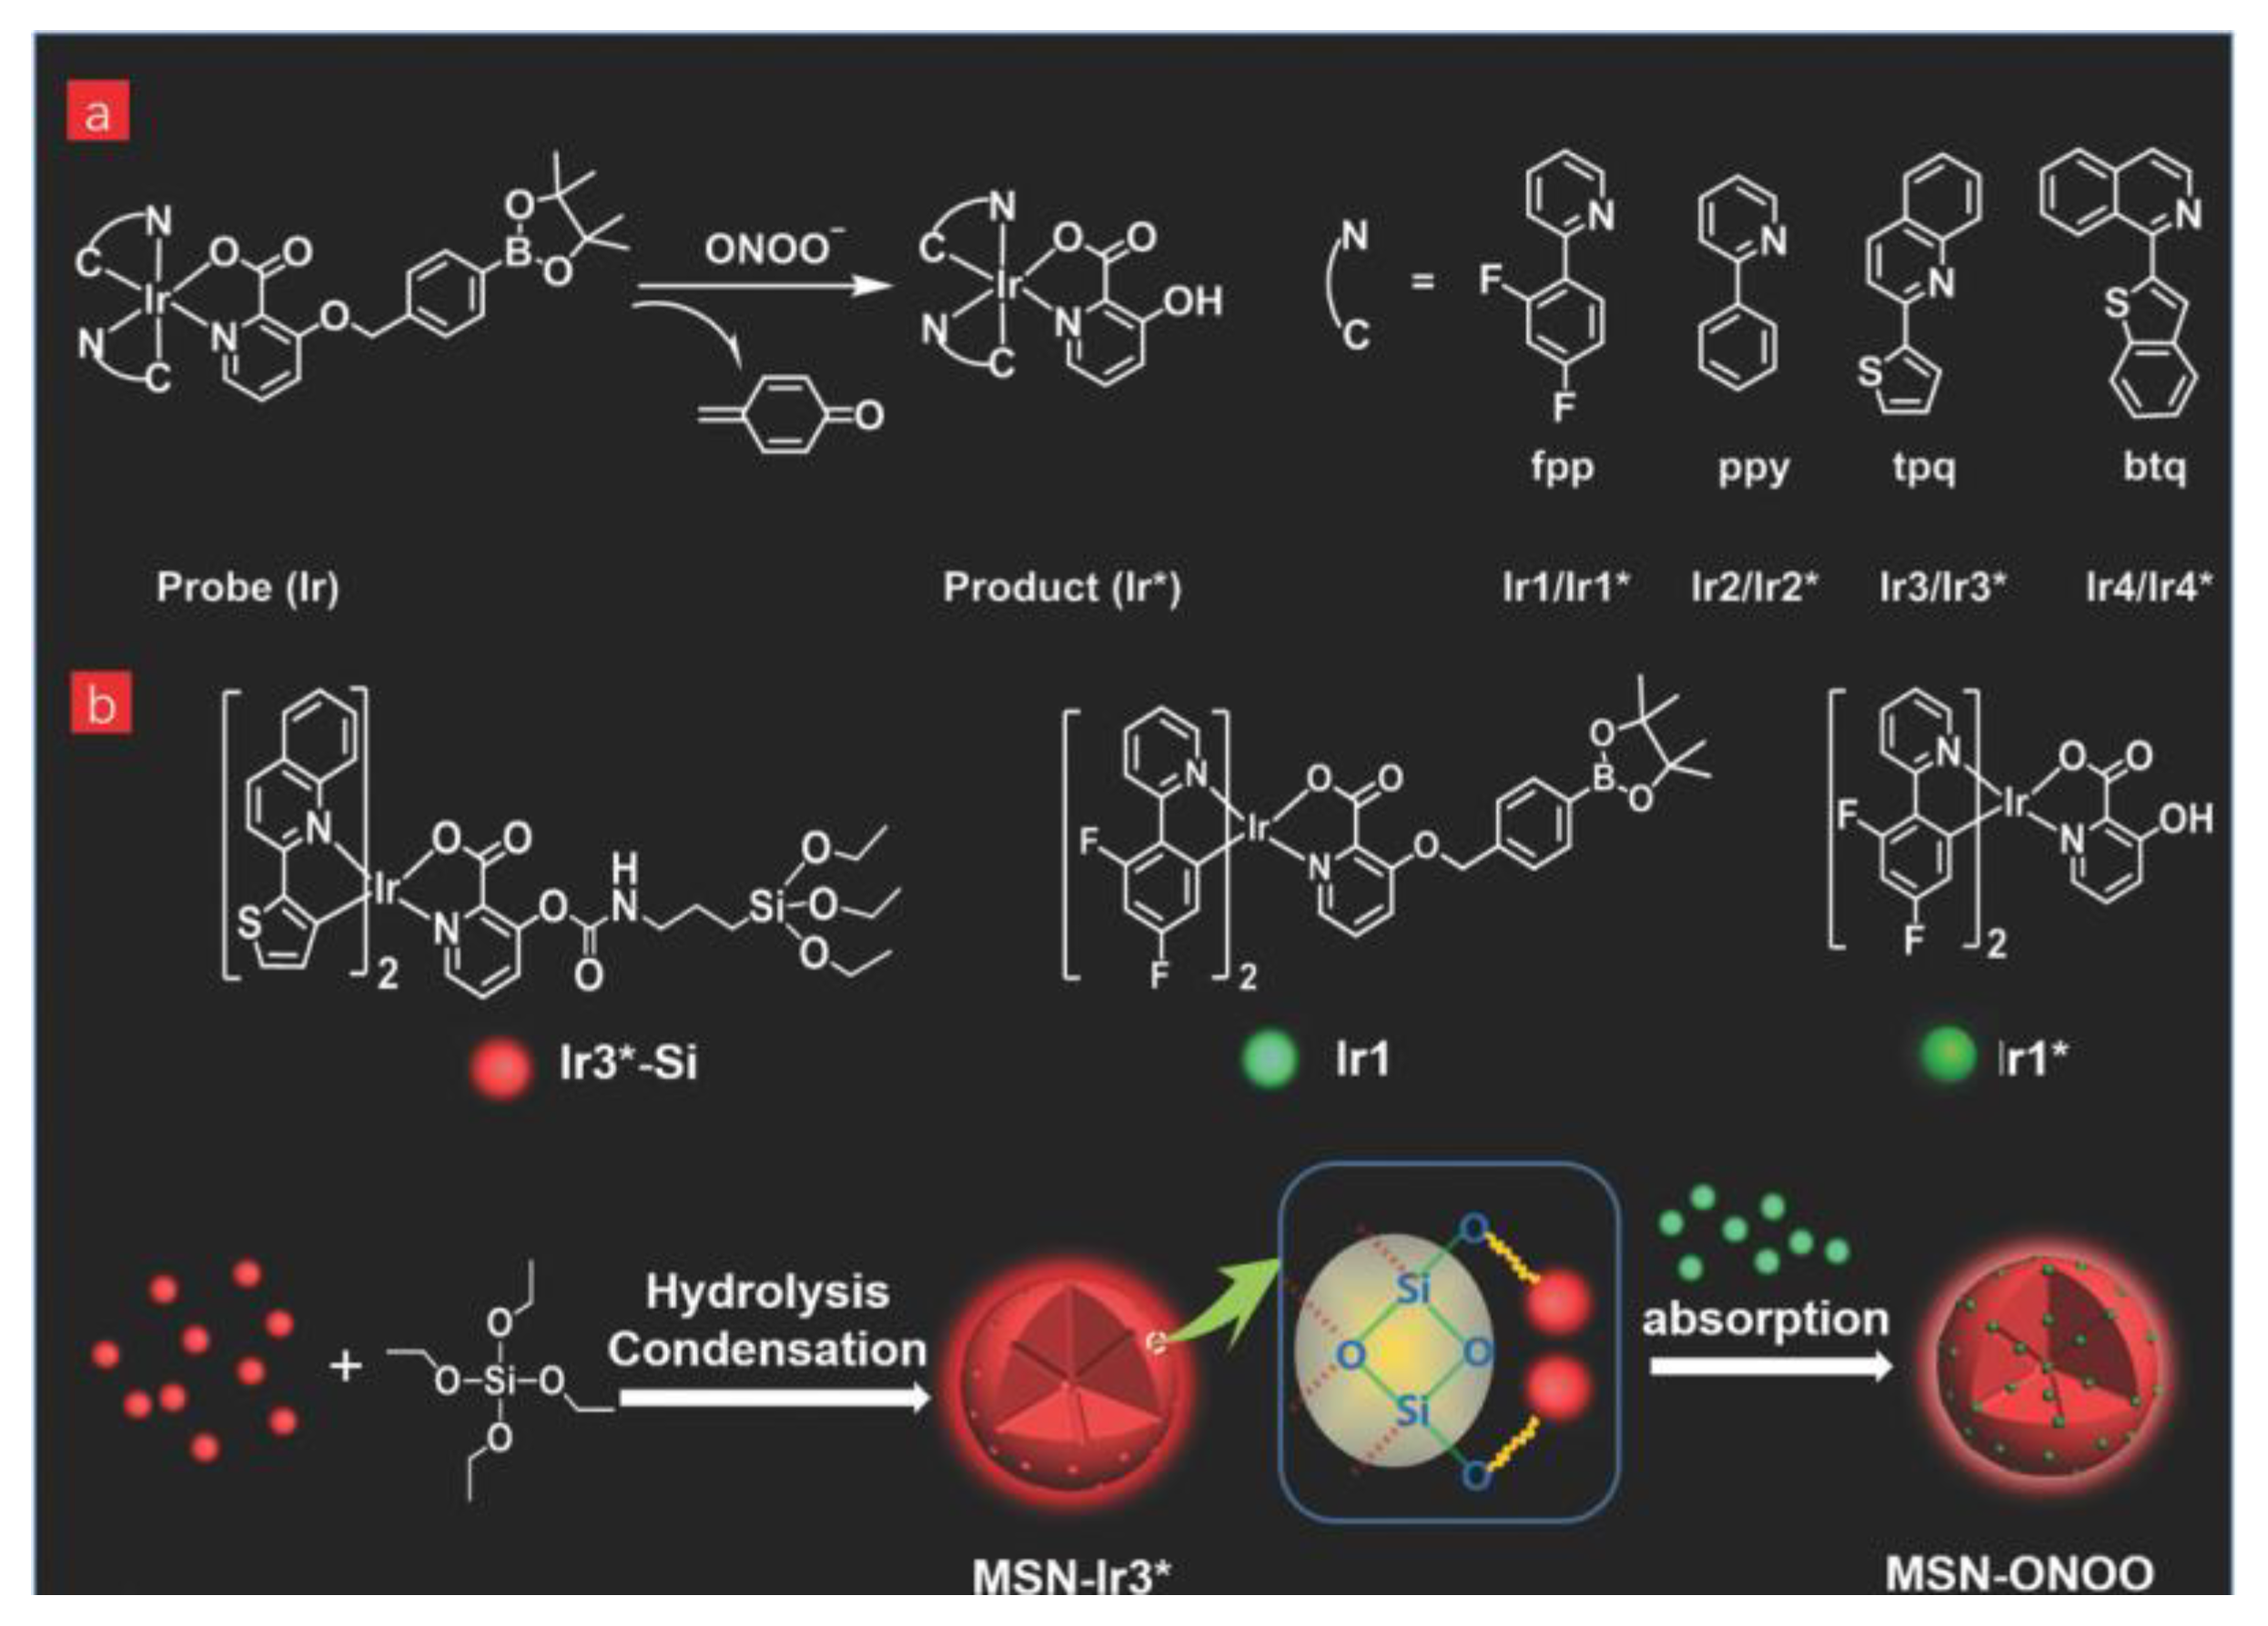
  69. Chen, Z.; Yan, P.; Zou, L.; Zhao, M.; Jiang, J.; Liu, S.; Zhang, K.Y.; Huang, W.; Zhao, Q. Using Ultrafast Responsive Phosphorescent Nanoprobe to Visualize Elevated Peroxynitrite In Vitro and In Vivo via Ratiometric and Time-Resolved Photoluminescence Imaging. Adv. Healthc. Mater. 2018, 7, 1800309. [Google Scholar] [CrossRef] [PubMed]
  70. Clark, H.A.; Hoyer, M.; Philbert, M.A.; Kopelman, R. Optical Nanosensors for Chemical Analysis Inside Single Living Cells. 1. Fabrication, Characterization, and Methods for Intracellular Delivery of PEBBLE Sensors. Anal. Chem. 1999, 71, 4831–4836. [Google Scholar] [CrossRef] [PubMed]
  71. Ong, S.Y.; Zhang, C.; Dong, X.; Yao, S.Q. Recent Advances in Polymeric Nanoparticles for Enhanced Fluorescence and Photoacoustic Imaging. Angew. Chem. Int. Ed. 2021, 60, 17797–17809. [Google Scholar] [CrossRef]
  72. Canfarotta, F.; Whitcombe, M.J.; Piletsky, S.A. Polymeric Nanoparticles for Optical Sensing. Biotechnol. Adv. 2013, 31, 1585–1599. [Google Scholar] [CrossRef] [PubMed]
  73. Srivastava, P.; Tavernaro, I.; Genger, C.; Welker, P.; Hübner, O.; Resch-Genger, U. Multicolor Polystyrene Nanosensors for the Monitoring of Acidic, Neutral, and Basic pH Values and Cellular Uptake Studies. Anal. Chem. 2022, 94, 9656–9664. [Google Scholar] [CrossRef]
  74. Aigner, D.; Dmitriev, R.I.; Borisov, S.M.; Papkovsky, D.B.; Klimant, I. pH-Sensitive Perylene Bisimide Probes for Live Cell Fluorescence Lifetime Imaging. J. Mater. Chem. B 2014, 2, 6792–6801. [Google Scholar] [CrossRef] [PubMed]
  75. Kondrashina, A.V.; Dmitriev, R.I.; Borisov, S.M.; Klimant, I.; O’Brien, I.; Nolan, Y.M.; Zhdanov, A.V.; Papkovsky, D.B. A Phosphorescent Nanoparticle-Based Probe for Sensing and Imaging of (Intra)Cellular Oxygen in Multiple Detection Modalities. Adv. Funct. Mater. 2012, 22, 4931–4939. [Google Scholar] [CrossRef]
  76. Dmitriev, R.I.; Zhdanov, A.V.; Nolan, Y.M.; Papkovsky, D.B. Imaging of Neurosphere Oxygenation with Phosphorescent Probes. Biomaterials 2013, 34, 9307–9317. [Google Scholar] [CrossRef]
  77. Dmitriev, R.I.; Borisov, S.M.; Düssmann, H.; Sun, S.; Müller, B.J.; Prehn, J.; Baklaushev, V.P.; Klimant, I.; Papkovsky, D.B. Versatile Conjugated Polymer Nanoparticles for High-Resolution O2 Imaging in Cells and 3D Tissue Models. ACS Nano 2015, 9, 5275–5288. [Google Scholar] [CrossRef]
  78. Dmitriev, R.I.; Borisov, S.M.; Kondrashina, A.V.; Pakan, J.M.P.; Anilkumar, U.; Prehn, J.H.M.; Zhdanov, A.V.; McDermott, K.W.; Klimant, I.; Papkovsky, D.B. Imaging Oxygen in Neural Cell and Tissue Models by Means of Anionic Cell-Permeable Phosphorescent Nanoparticles. Cell. Mol. Life Sci. 2015, 72, 367–381. [Google Scholar] [CrossRef]
  79. Bao, Y.; De Keersmaecker, H.; Corneillie, S.; Yu, F.; Mizuno, H.; Zhang, G.; Hofkens, J.; Mendrek, B.; Kowalczuk, A.; Smet, M. Tunable Ratiometric Fluorescence Sensing of Intracellular pH by Aggregation-Induced Emission-Active Hyperbranched Polymer Nanoparticles. Chem. Mater. 2015, 27, 3450–3455. [Google Scholar] [CrossRef]
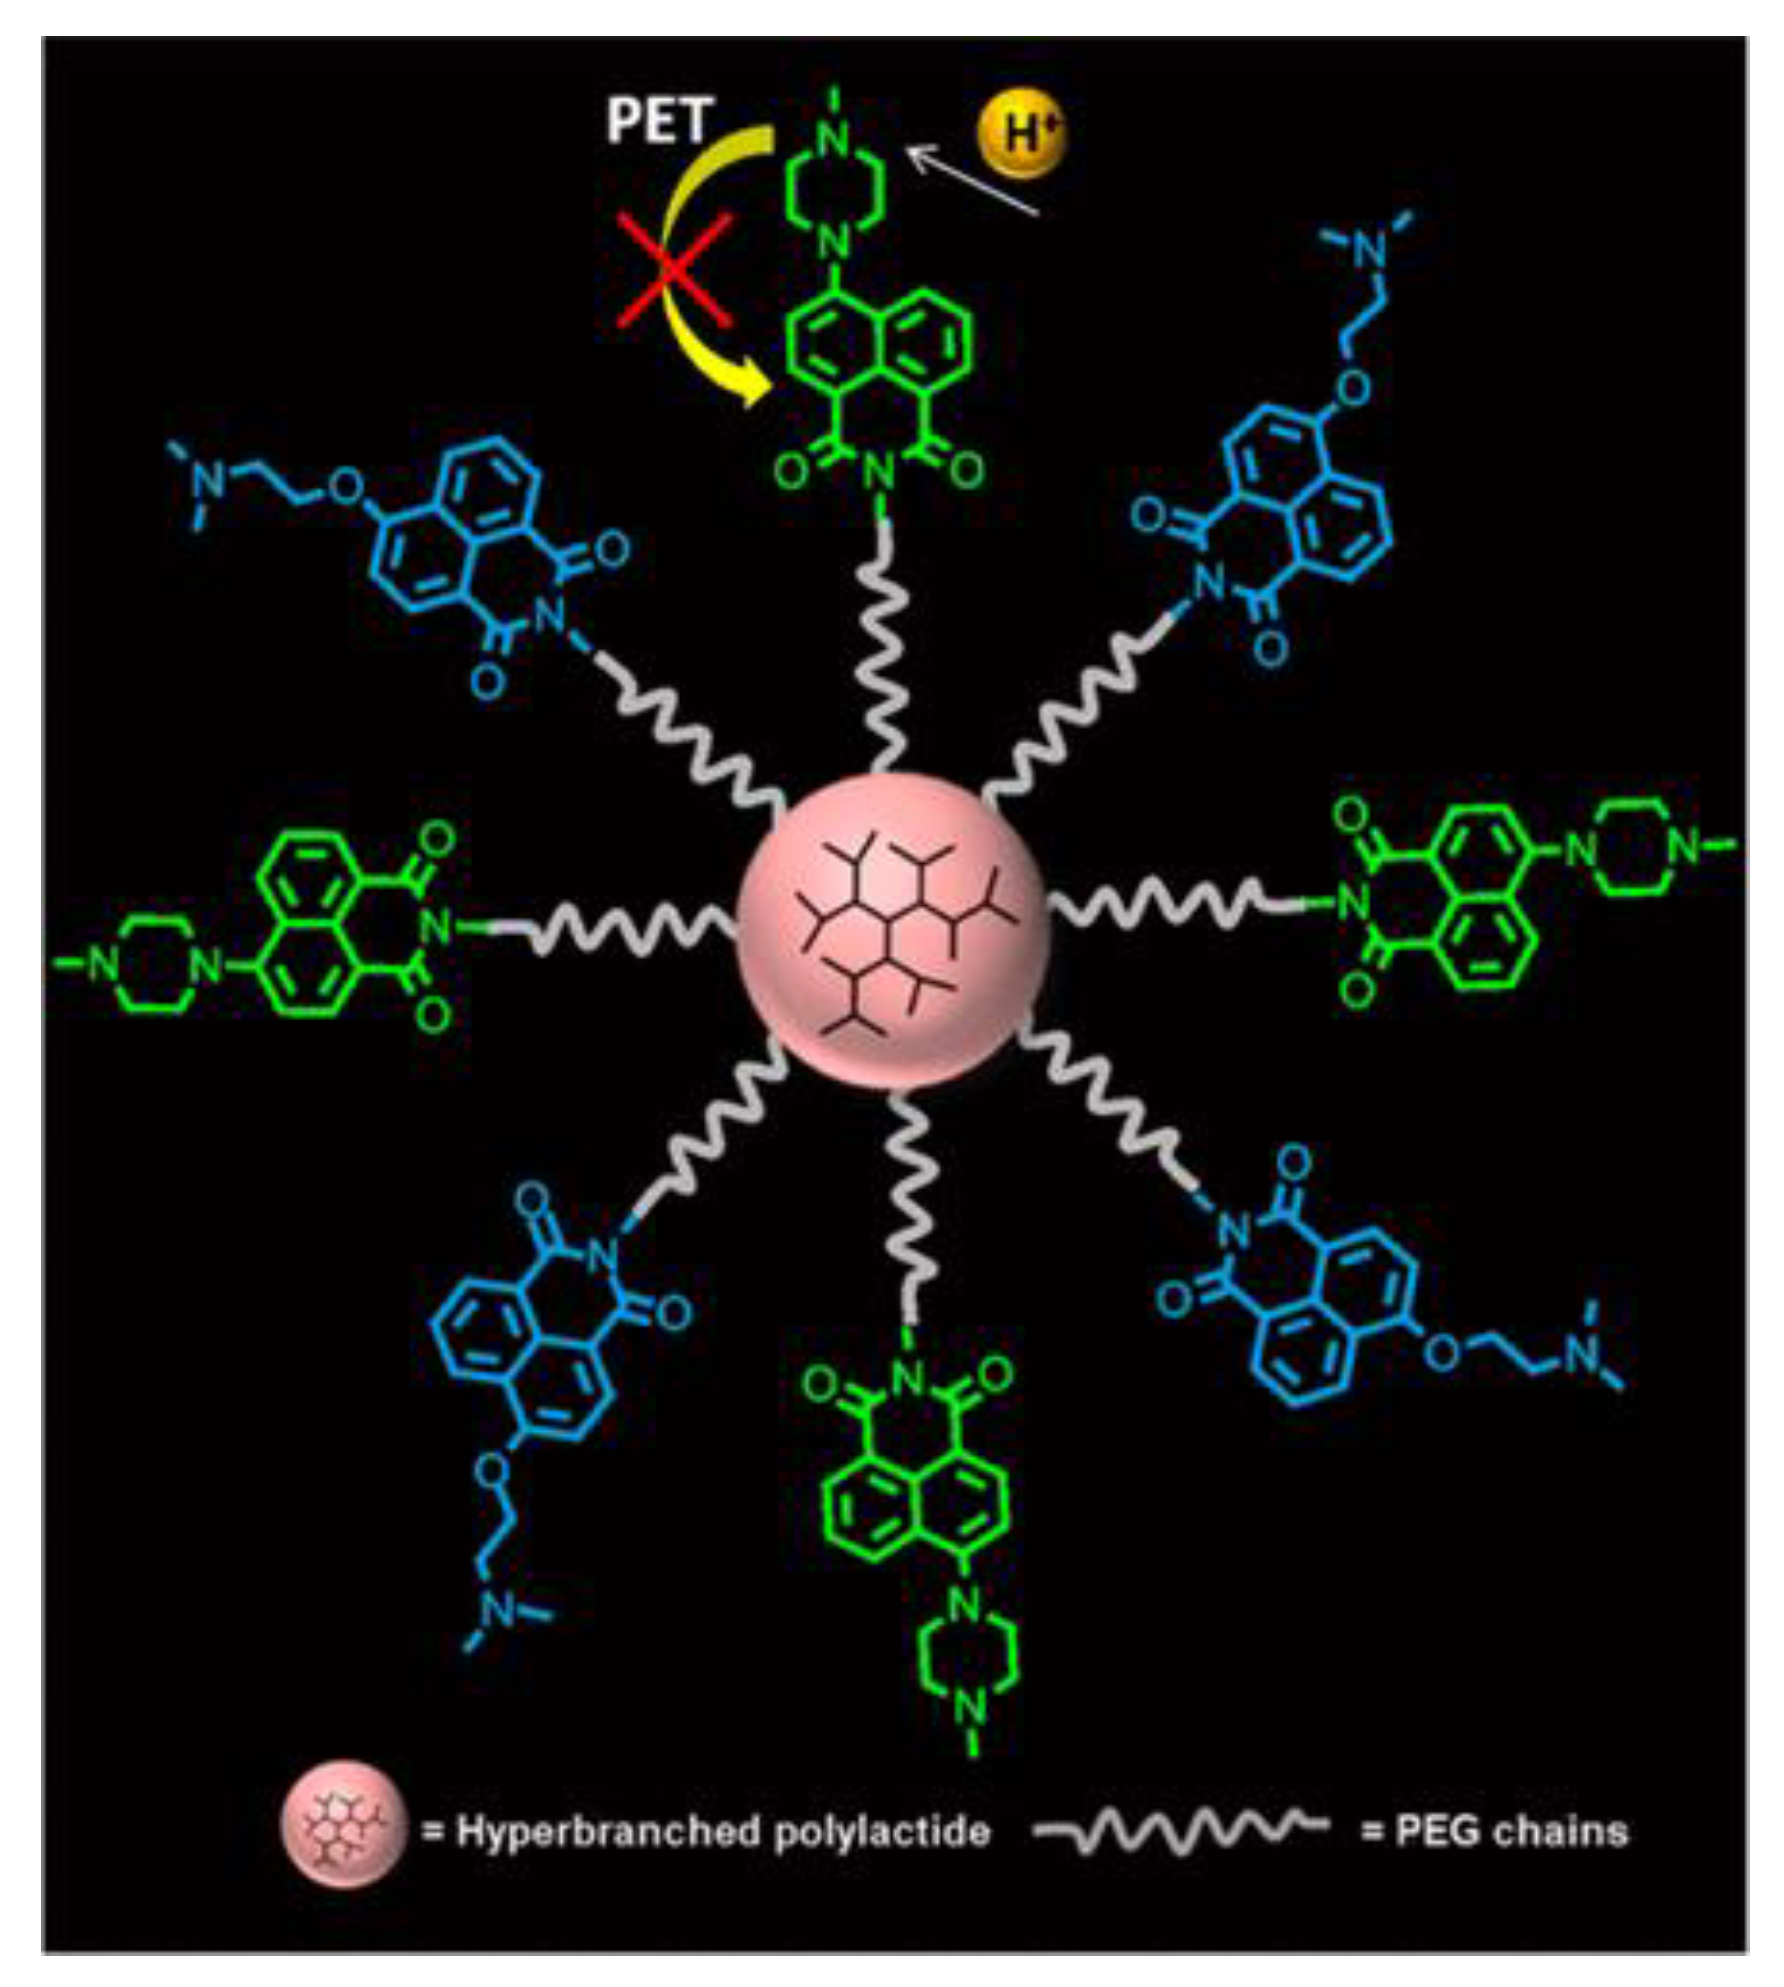
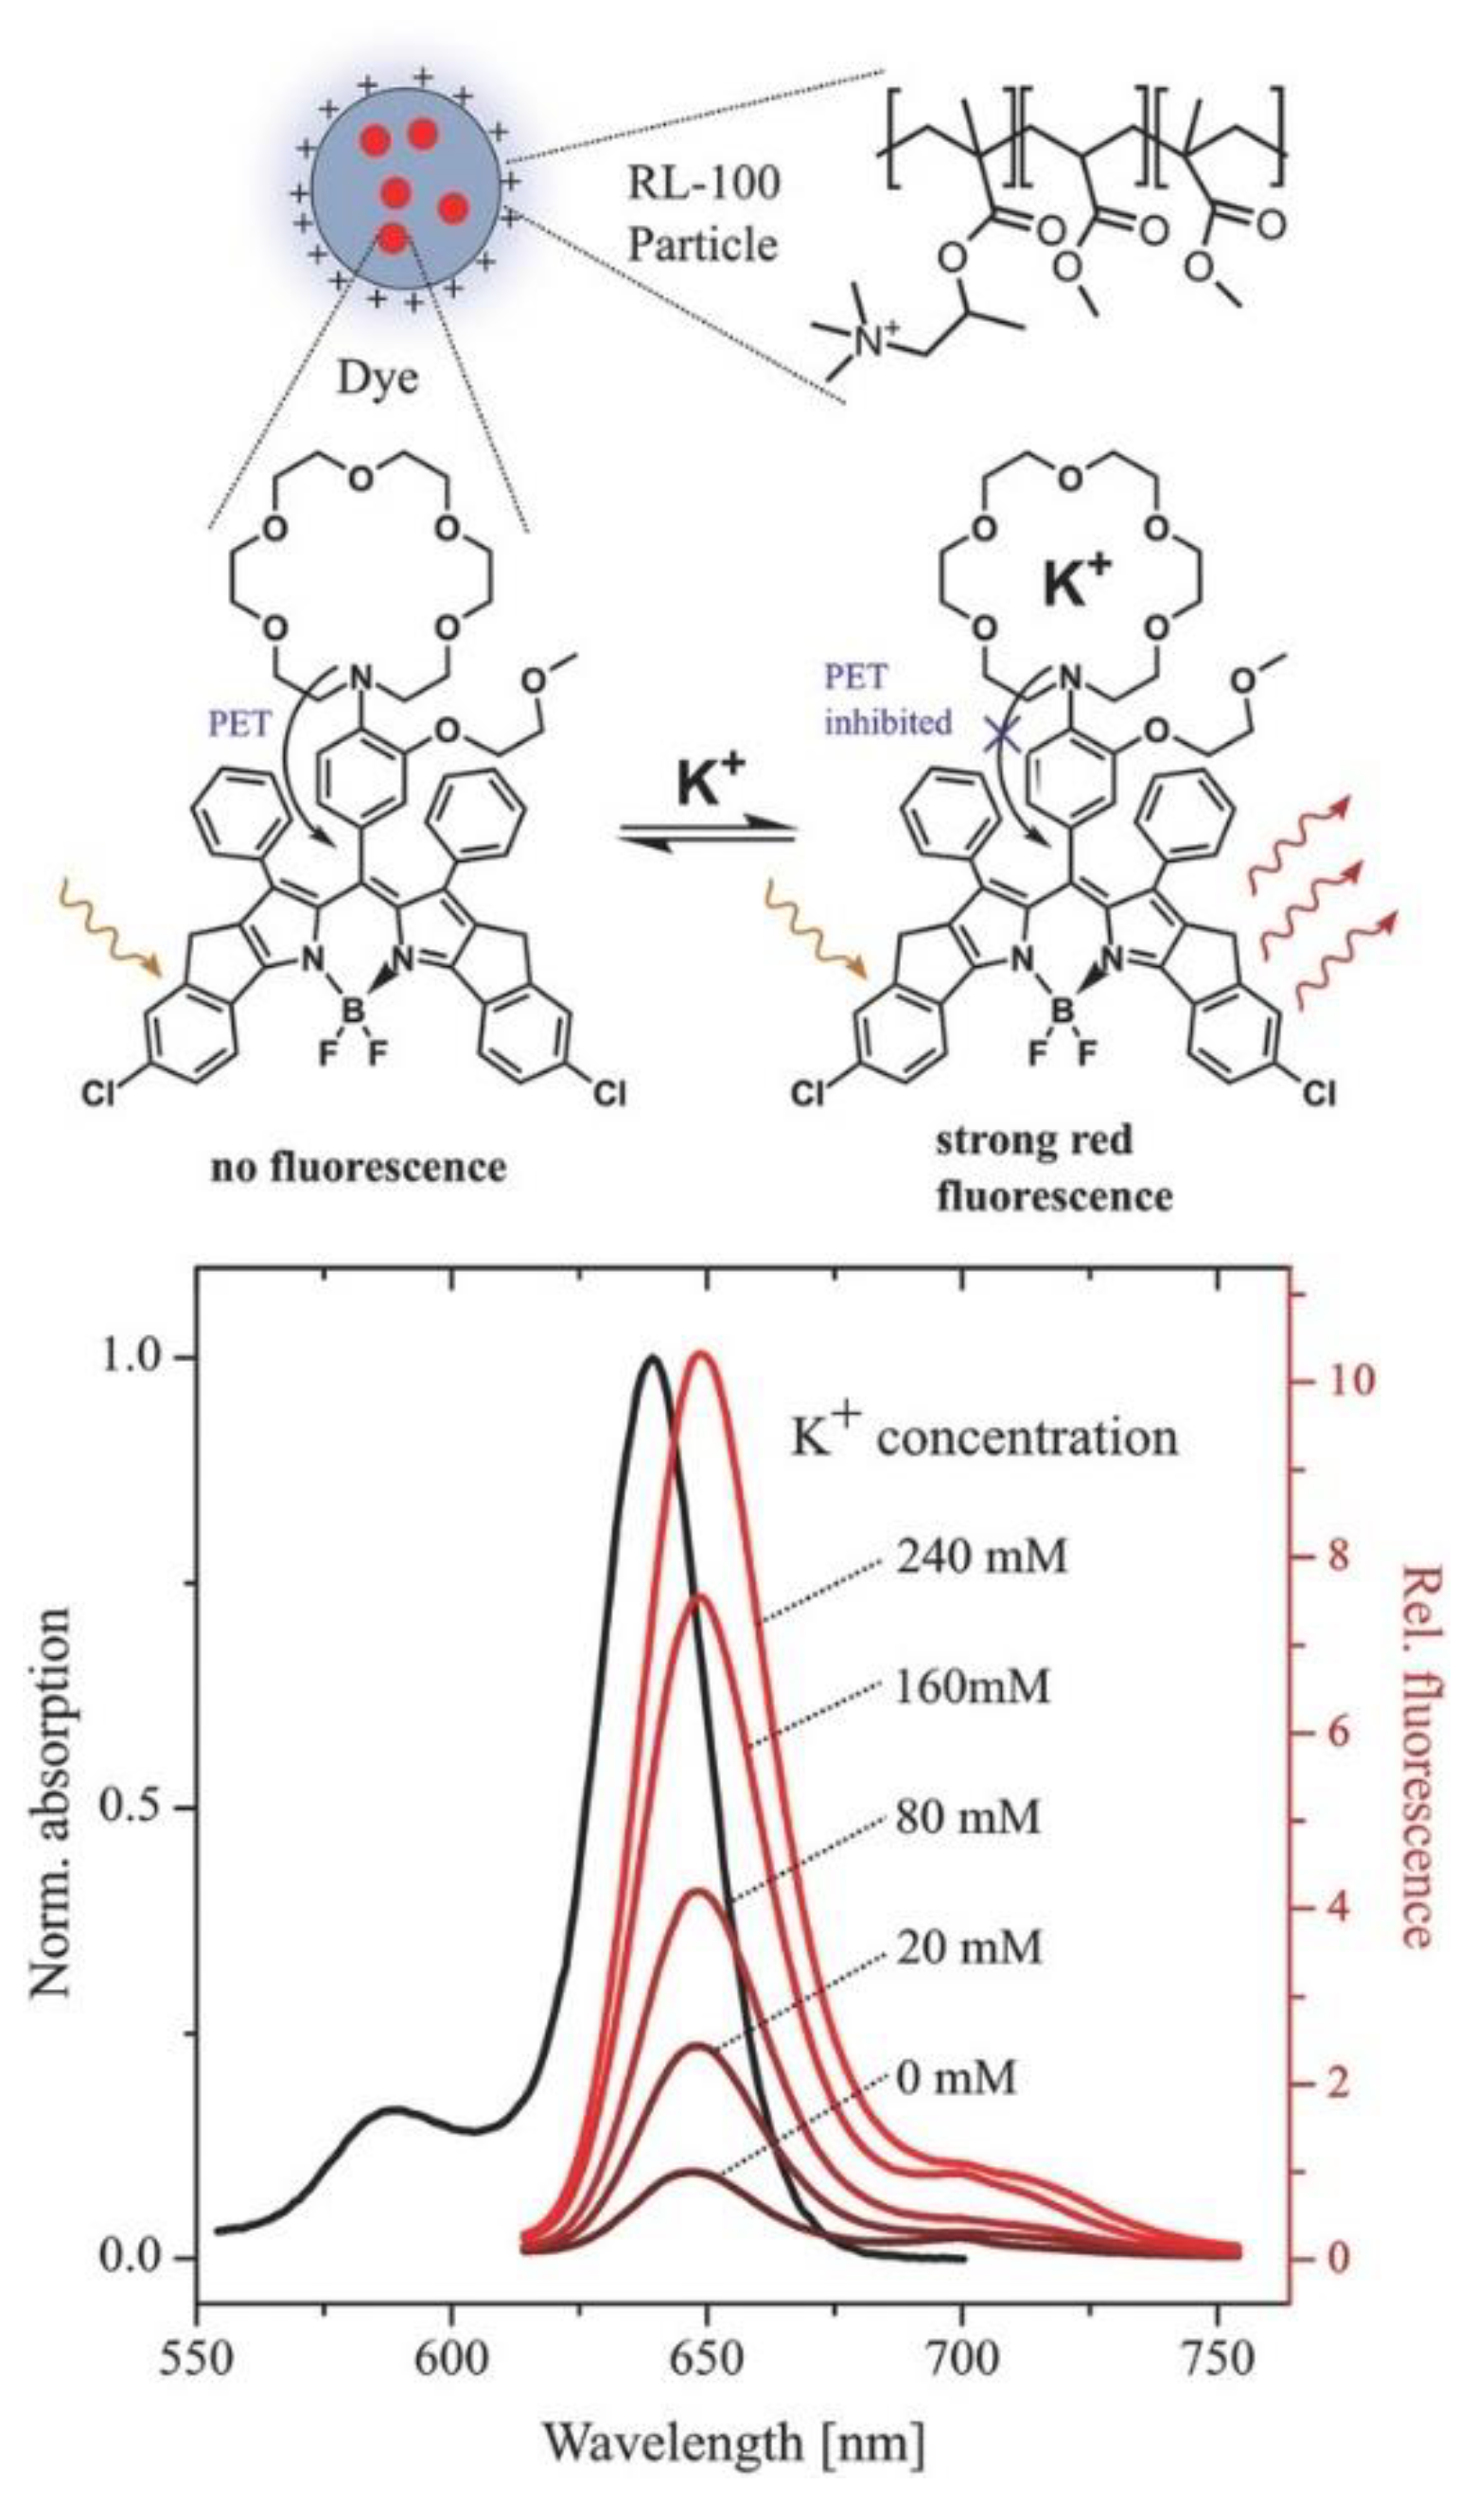
  80. Müller, B.J.; Zhdanov, A.V.; Borisov, S.M.; Foley, T.; Okkelman, I.A.; Tsytsarev, V.; Tang, Q.; Erzurumlu, R.S.; Chen, Y.; Zhang, H.; et al. Nanoparticle-Based Fluoroionophore for Analysis of Potassium Ion Dynamics in 3D Tissue Models and In Vivo. Adv. Funct. Mater. 2018, 28, 1704598. [Google Scholar] [CrossRef]
  81. Lee, C.H.; Folz, J.; Zhang, W.; Jo, J.; Tan, J.W.Y.; Wang, X.; Kopelman, R. Ion-Selective Nanosensor for Photoacoustic and Fluorescence Imaging of Potassium. Anal. Chem. 2017, 89, 7943–7949. [Google Scholar] [CrossRef]
  82. Sahari, A.; Ruckh, T.T.; Hutchings, R.; Clark, H.A. Development of an Optical Nanosensor Incorporating a pH-Sensitive Quencher Dye for Potassium Imaging. Anal. Chem. 2015, 87, 10684–10687. [Google Scholar] [CrossRef]
  83. Yang, C.; Qin, Y.; Jiang, D.; Chen, H.-Y. Continuous Fluorescence Imaging of Intracellular Calcium by Use of Ion-Selective Nanospheres with Adjustable Spectra. ACS Appl. Mater. Interfaces 2016, 8, 19892–19898. [Google Scholar] [CrossRef] [PubMed]
  84. Sapsford, K.E.; Algar, W.R.; Berti, L.; Boeneman Gemmill, K.; Casey, B.J.; Oh, E.; Stewart, M.H.; Medintz, I.L. Functionalizing Nanoparticles with Biological Molecules: Developing Chemistries that Facilitate Nanotechnology. Chem. Rev. 2013, 113, 1904–2074. [Google Scholar] [CrossRef]
  85. Alivisatos, P. The Use of Nanocrystals in Biological Detection. Nat. Biotechnol. 2004, 22, 47–52. [Google Scholar] [CrossRef] [PubMed]
  86. Smith, A.M.; Nie, S. Chemical Analysis and Cellular Imaging with quantum Dots. Analyst 2004, 129, 672–677. [Google Scholar] [CrossRef]
  87. Michalet, X.; Pinaud, F.F.; Bentolila, L.A.; Tsay, J.M.; Doose, S.; Li, J.J.; Sundaresan, G.; Wu, A.M.; Gambhir, S.S.; Weiss, S. Quantum Dots for Live Cells, in vivo Imaging, and Diagnostics. Science 2005, 307, 538–544. [Google Scholar] [CrossRef] [PubMed]
  88. Freeman, R.; Willner, I. Optical Molecular Sensing with Semiconductor Quantum Dots (QDs). Chem. Soc. Rev. 2012, 41, 4067–4085. [Google Scholar] [CrossRef]
  89. Lesiak, A.; Drzozga, K.; Cabaj, J.; Banski, M.; Malecha, K.; Podhorodecki, A. Optical Sensors Based on II-VI Quantum Dots. Nanomaterials 2019, 9, 192. [Google Scholar] [CrossRef] [PubMed]
  90. Orte, A.; Alvarez-Pez, J.M.; Ruedas-Rama, M.J. Fluorescence Lifetime Imaging Microscopy for the Detection of Intracellular pH with Quantum Dot Nanosensors. ACS Nano 2013, 7, 6387–6395. [Google Scholar] [CrossRef]
  91. Marín, M.J.; Galindo, F.; Thomas, P.; Russell, D.A. Localized Intracellular pH Measurement Using a Ratiometric Photoinduced Electron-Transfer-Based Nanosensor. Angew. Chem. Int. Ed. 2012, 51, 9657–9661. [Google Scholar] [CrossRef]
  92. Chen, Y.N.; Chen, P.C.; Wang, C.W.; Lin, Y.S.; Ou, C.M.; Ho, L.C.; Chang, H.T. One-Pot Synthesis of Fluorescent BSA–Ce/Au Nanoclusters as Ratiometric pH Probes. Chem. Commun. 2014, 50, 8571–8574. [Google Scholar] [CrossRef]
  93. Baker, S.N.; Baker, G.A. Luminescent Carbon Nanodots: Emergent Nanolights. Angew. Chem. Int. Ed. 2010, 49, 6726–6744. [Google Scholar] [CrossRef]
  94. Molaei, M.J. Principles, Mechanisms, and Application of Carbon Quantum Dots in Sensors: A Review. Anal. Methods 2020, 12, 1266–1287. [Google Scholar] [CrossRef]
  95. Panwar, N.; Soehartono, A.M.; Chan, K.K.; Zeng, S.; Xu, G.; Qu, J.; Coquet, P.; Yong, K.T.; Chen, X. Nanocarbons for Biology and Medicine: Sensing, Imaging, and Drug Delivery. Chem. Rev. 2019, 119, 9559–9656. [Google Scholar] [CrossRef] [PubMed]
  96. Wang, B.; Cai, H.; Waterhouse, G.I.N.; Qu, X.; Yang, B.; Lu, S. Carbon Dots in Bioimaging, Biosensing and Therapeutics: A Comprehensive Review. Small Sci. 2022, 2, 2200012. [Google Scholar] [CrossRef]
  97. Yuan, T.; Meng, T.; He, P.; Shi, Y.; Li, Y.; Li, X.; Fan, L.; Yang, S. Carbon Quantum Dots: An Emerging Material for Optoelectronic Applications. J. Mater. Chem. C 2019, 7, 6820–6835. [Google Scholar] [CrossRef]
  98. Shi, W.; Li, X.; Ma, H. A Tunable Ratiometric pH Sensor Based on Carbon Nanodots for the Quantitative Measurement of the Intracellular pH of Whole Cells. Angew. Chem. Int. Ed. 2012, 51, 6432–6435. [Google Scholar] [CrossRef] [PubMed]
  99. Nie, H.; Li, M.; Li, Q.; Liang, S.; Tan, Y.; Sheng, L.; Shi, W.; Zhang, S.X.A. Carbon Dots with Continuously Tunable Full-Color Emission and their Application in Ratiometric pH sensing. Chem. Mater. 2014, 26, 3104–3112. [Google Scholar] [CrossRef]
  100. Kong, B.; Zhu, A.; Ding, C.; Zhao, X.; Li, B.; Tian, Y. Carbon Dot-Based Inorganic–Organic Nanosystem for Two-Photon Imaging and Biosensing of pH Variation in Living Cells and Tissues. Adv. Mater. 2012, 24, 5844–5848. [Google Scholar] [CrossRef] [PubMed]
  101. Chen, X.-P.; Zhuang, Y.-F.; Lin, J.W.; Chen, J.H.; Han, Z.-Z. Synthesis of N,S Co-Doped Carbon Dots for Fluorescence Detection of Fe3+ Ions and Intracellular pH Imaging. Chin. J. Anal. Chem. 2022, 50, 100151. [Google Scholar] [CrossRef]
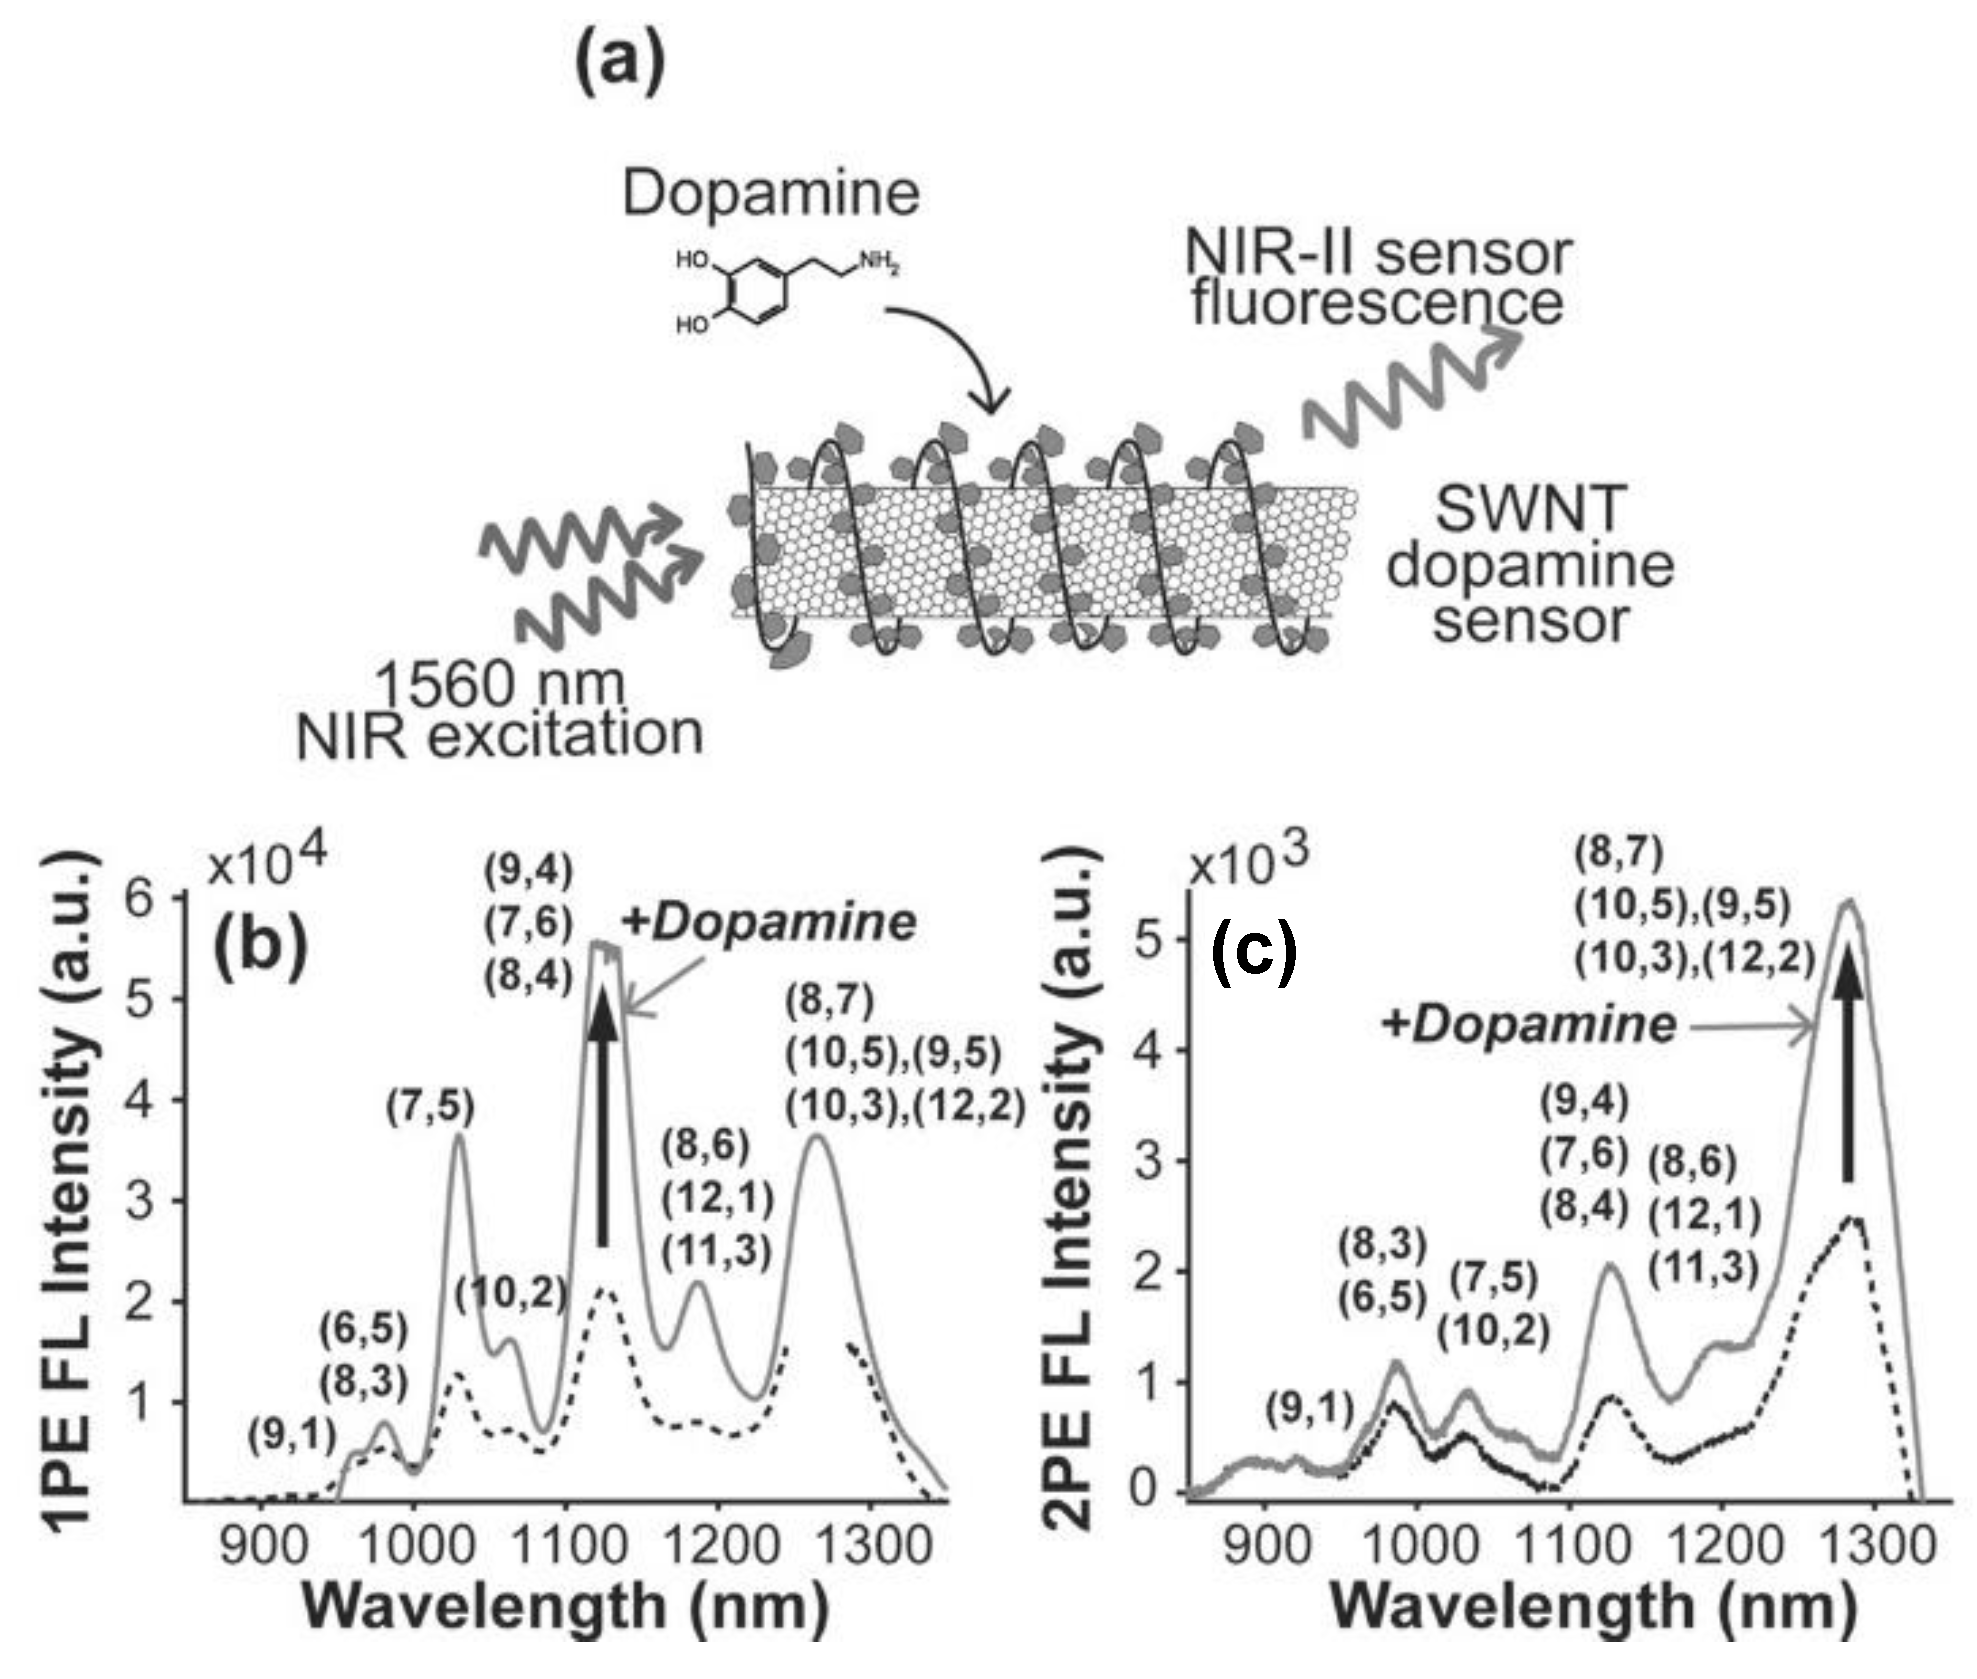
  102. Iverson, N.M.; Barone, P.W.; Shandell, M.; Trudel, L.J.; Sen, S.; Sen, F.; Ivanov, V.; Atolia, E.; Farias, E.; McNicholas, T.P.; et al. In vivo Biosensing via Tissue-Localizable Near-Infrared-Fluorescent Single-Walled Carbon Nanotubes. Nat. Nanotechn. 2013, 8, 873–880. [Google Scholar] [CrossRef]
  103. Del Bonis-O’Donnell, J.T.; Page, R.H.; Beyene, A.G.; Tindall, E.G.; McFarlane, I.R.; Landry, M.P. Dual Near-Infrared Two-Photon Microscopy for Deep-Tissue Dopamine Nanosensor Imaging. Adv. Funct. Mater. 2017, 27, 1702112. [Google Scholar] [CrossRef]
  104. Beyene, A.G.; Delevich, K.; Del Bonis-O’Donnell, J.T.; Piekarski, D.J.; Lin, W.C.; Wren Thomas, A.; Yang, S.J.; Kosillo, P.; Yang, D.; Prounis, G.S.; et al. Imaging Striatal Dopamine Release Using a Nongenetically Encoded Near Infrared Fluorescent Catecholamine Nanosensor. Sci. Adv. 2019, 5, eaaw3108. [Google Scholar] [CrossRef]
  105. Liu, Q.; Feng, W.; Yang, T.; Yi, T.; Li, F. Upconversion Luminescence Imaging of Cells and Small Animals. Nat. Protoc. 2013, 8, 2033–2044. [Google Scholar] [CrossRef]
  106. Auzel, F. Upconversion and Anti-Stokes Processes with f and d Ions in Solids. Chem. Rev. 2004, 104, 139–174. [Google Scholar] [CrossRef] [PubMed]
  107. Cao, T.; Yang, T.; Gao, Y.; Yang, Y.; Hu, H.; Li, F. Water-Soluble NaYF4:Yb/Er Upconversion Nanophosphors: Synthesis, Characteristics and Application in Bioimaging. Inorg. Chem. Commun. 2010, 13, 92–394. [Google Scholar] [CrossRef]
  108. Hao, S.; Chen, G.; Yang, C. Sensing Using Rare-Earth-Doped Upconversion Nanoparticles. Theranostics 2013, 3, 331–345. [Google Scholar] [CrossRef] [PubMed]
  109. Andresen, E.; Resch-Genger, U.; Schäferling, M. Surface Modifications for Photon-Upconversion-Based Energy-Transfer Nanoprobes. Langmuir 2019, 35, 5093–5113. [Google Scholar] [CrossRef] [PubMed]
  110. Chen, X.; Peng, D.; Ju, Q.; Wang, F. Photon Upconversion in Core–Shell Nanoparticles. Chem. Soc. Rev. 2015, 44, 1318–1330. [Google Scholar] [CrossRef] [PubMed]
  111. Mahata, M.K.; Bae, H.; Lee, K.T. Upconversion Luminescence Sensitized pH Nanoprobes. Molecules 2017, 22, 2064. [Google Scholar] [CrossRef] [PubMed]
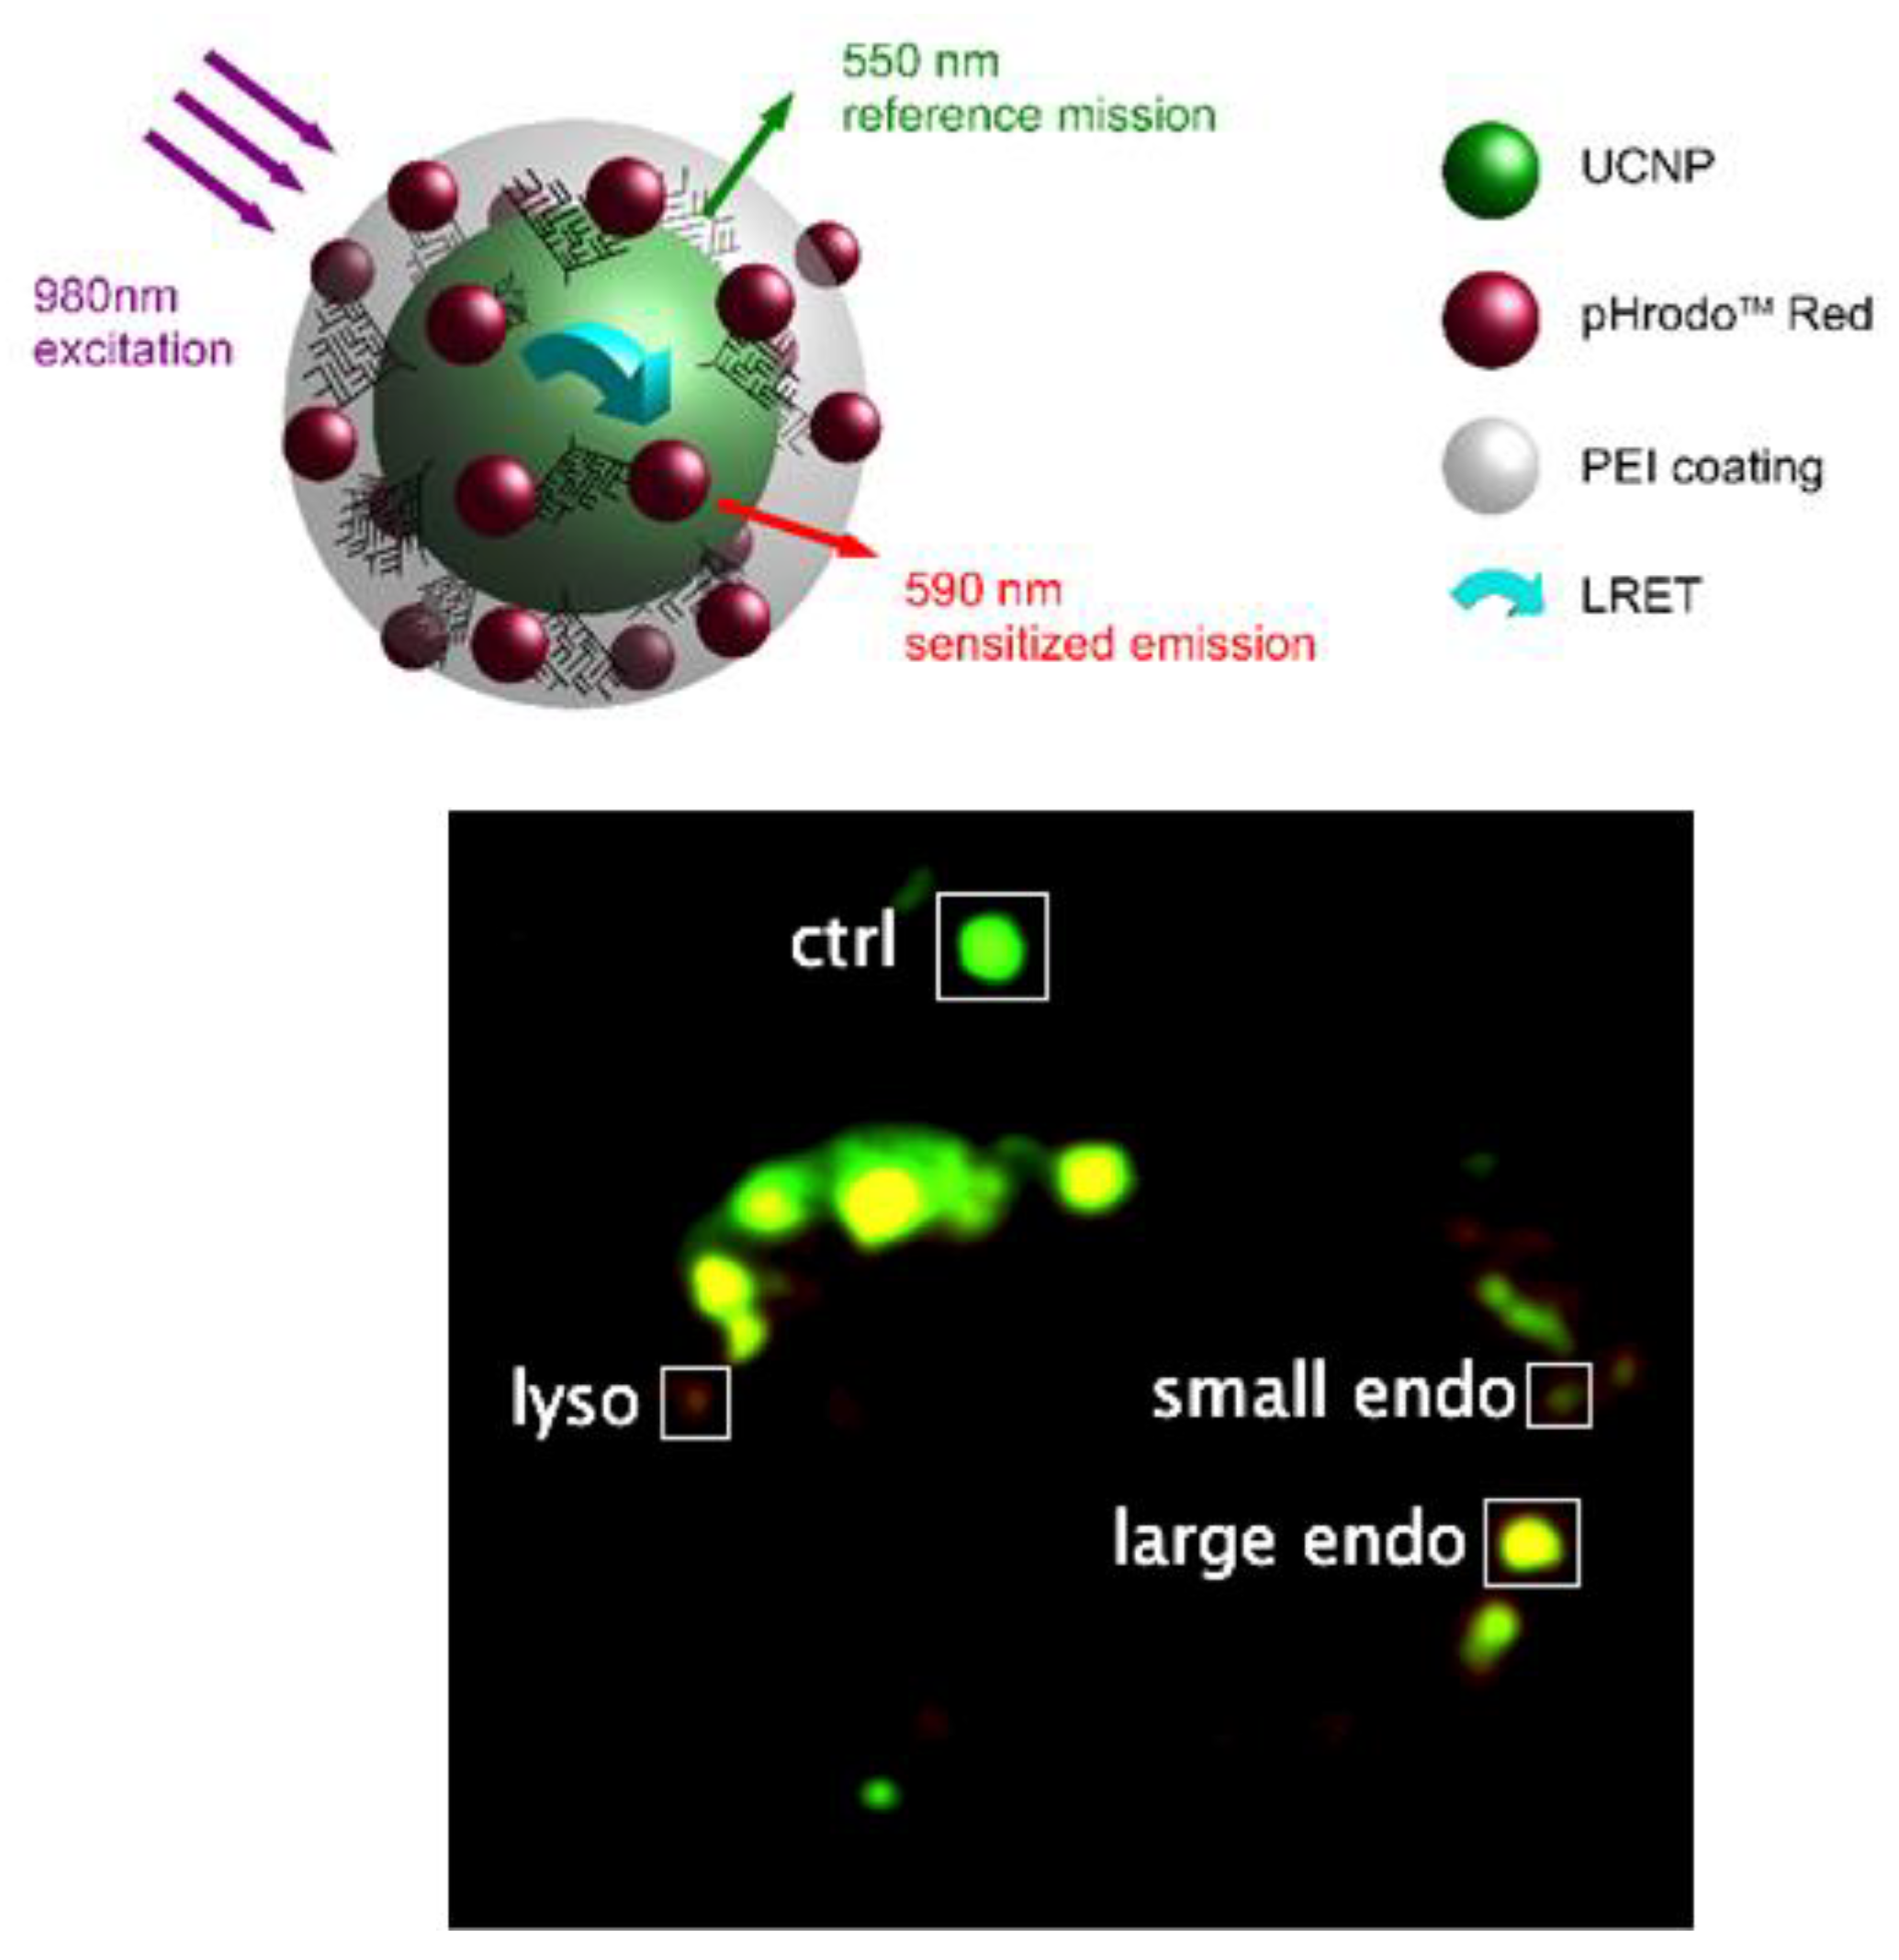
  112. Arppe, R.; Näreoja, T.; Nylund, S.; Mattsson, L.; Koho, S.; Rosenholm, J.M.; Soukka, T.; Schäferling, M. Photon Upconversion Sensitized Nanoprobes for Sensing and Imaging of pH. Nanoscale 2014, 6, 6837–6843. [Google Scholar] [CrossRef] [PubMed]
  113. Nareoja, T.; Deguchi, T.; Christ, S.; Peltomaa, R.; Prabhakar, N.; Fazeli, E.; Perala, N.; Rosenholm, J.M.; Arppe, R.; Soukka, T.; et al. Ratiometric Sensing and Imaging of Intracellular pH Using Polyethylenimine-Coated Photon Upconversion Nanoprobes. Anal. Chem. 2017, 89, 1501–1508. [Google Scholar] [CrossRef]
  114. Tsai, E.S.; Himmelstoß, S.F.; Wiesholler, L.M.; Hirsch, T.; Hall, E.A.H. Upconversion Nanoparticles for Sensing pH. Analyst 2019, 144, 5547–5557. [Google Scholar] [CrossRef]
  115. Tsai, E.S.; Joud, F.; Wiesholler, L.M.; Hirsch, T.; Hall, E.A.H. Upconversion Nanoparticles as Intracellular pH Messengers. Anal. Bioanal. Chem. 2020, 412, 6567–6581. [Google Scholar] [CrossRef]
  116. Radunz, S.; Andresen, E.; Wurth, C.; Koerdt, A.; Tschiche, H.R.; Resch-Genger, U. Simple Self-Referenced Luminescent pH Sensors Based on Upconversion Nanocrystals and pH-Sensitive Fluorescent BODIPY Dyes. Anal. Chem. 2019, 91, 7756–7764. [Google Scholar] [CrossRef]
  117. Liu, J.; Liu, Y.; Bu, W.; Bu, J.; Sun, Y.; Du, J.; Shi, J. Ultrasensitive Nanosensors Based on Upconversion Nanoparticles for Selective Hypoxia Imaging in Vivo upon Near-Infrared Excitation. J. Am. Chem. Soc. 2014, 136, 9701–9709. [Google Scholar] [CrossRef]
  118. Lv, W.; Yang, T.; Yu, Q.; Zhao, Q.; Zhang, K.Y.; Liang, H.; Liu, S.; Lio, F.; Huang, W. A Phosphorescent Iridium(III) Complex-Modified Nanoprobe for Hypoxia Bioimaging via Time-Resolved Luminescence Microscopy. Adv. Sci. 2015, 2, 201500107. [Google Scholar] [CrossRef]
  119. Heydari, E.; Amir Ahmadi, J.; Ghazyani, N.; Bai, G.; Zare-Behtash, H.; Majles Ara, M.H. Dual-Mode Nanophotonic Upconversion Oxygen Sensors. Nanoscale 2022, 14, 13362–13372. [Google Scholar] [CrossRef]
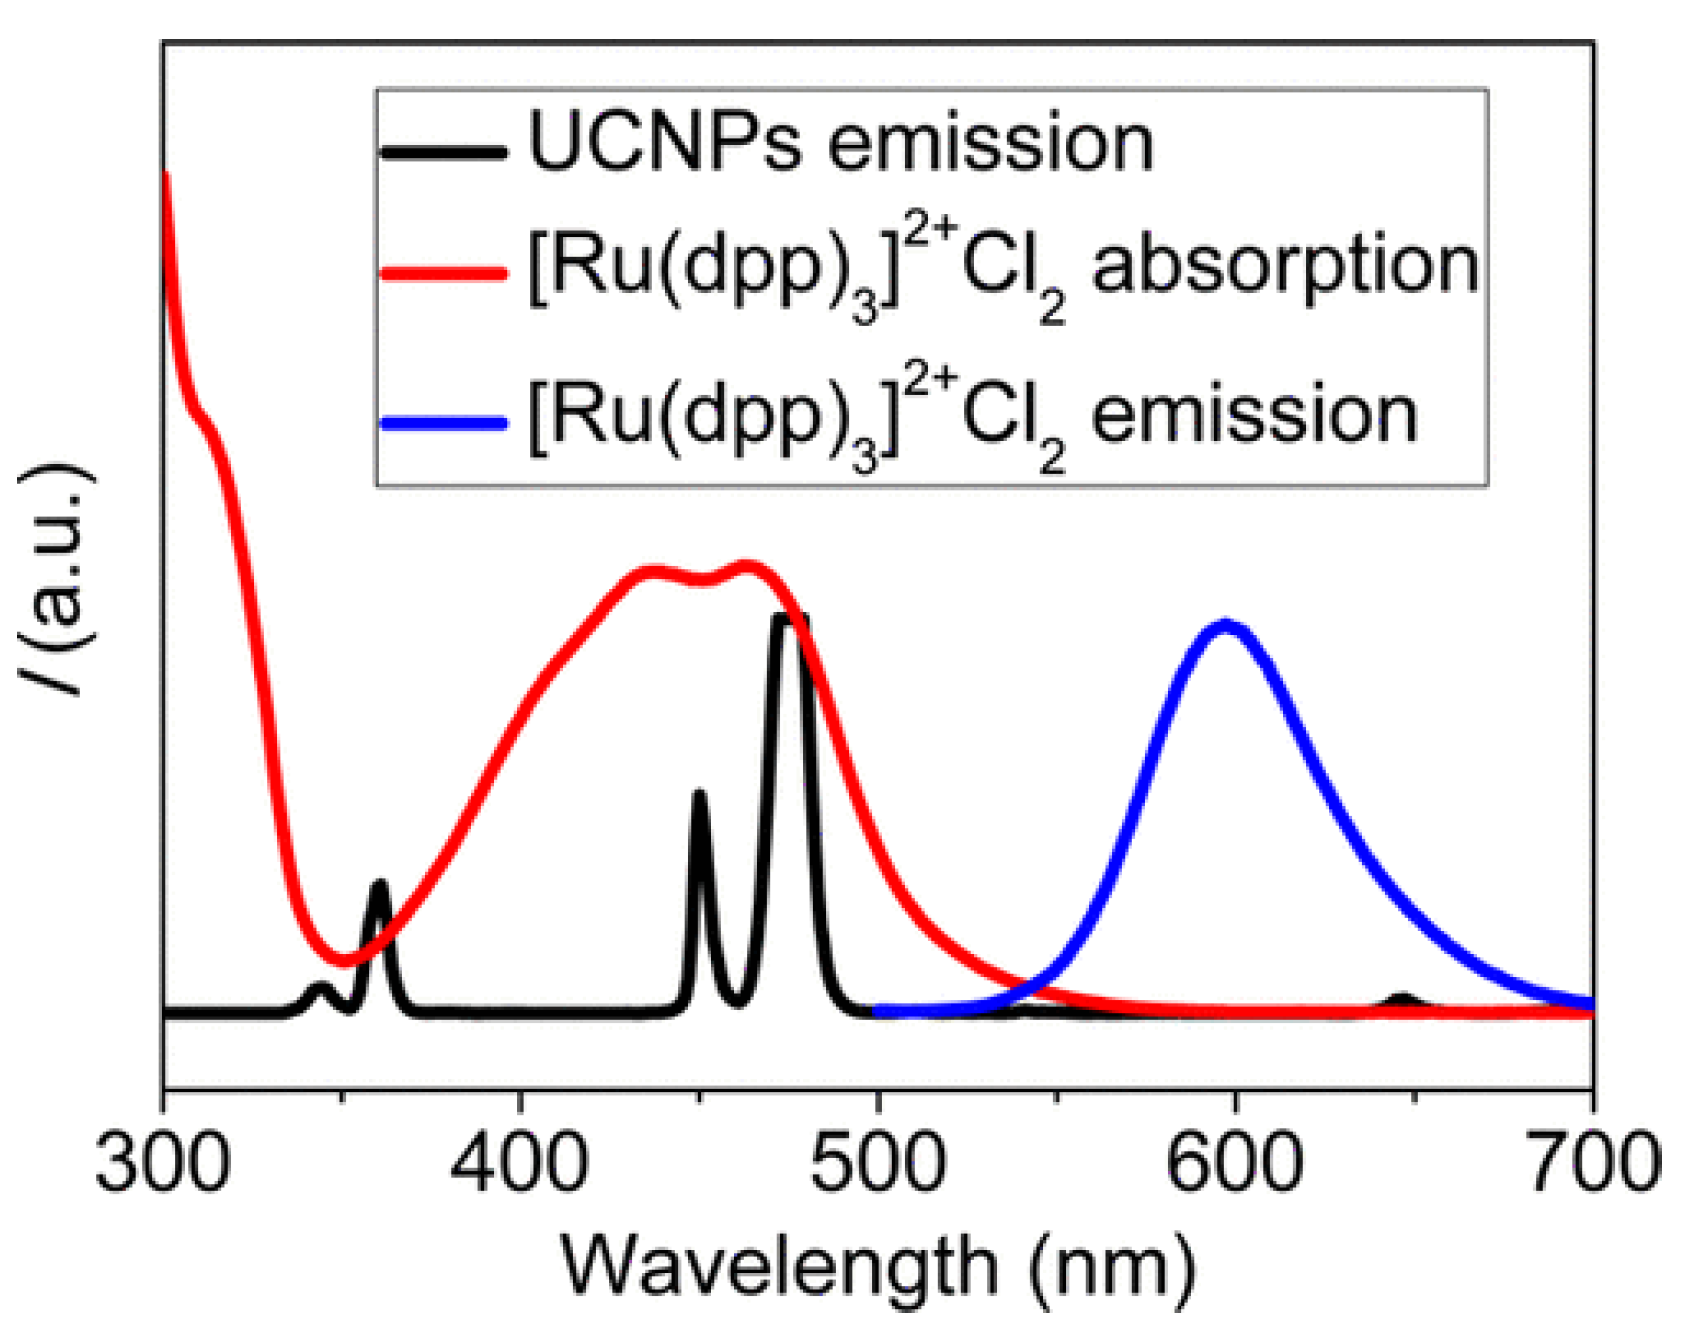
  120. Zhao, L.; Peng, J.; Chen, M.; Liu, Y.; Yao, L.; Feng, W.; Li, F. Yolk–Shell Upconversion Nanocomposites for LRET Sensing of Cysteine/Homocysteine. ACS Appl. Mater. Interfaces 2014, 6, 11190–11197. [Google Scholar] [CrossRef]
  121. Liu, Y.; Jiang, A.; Jia, Q.; Zhai, X.; Liu, L.; Ma, L.; Zhou, J. Rationally Designed Upconversion Nanoprobe for Simultaneous Highly Sensitive Ratiometric Detection of Fuoride Ions and Fluorosis Theranostics. Chem. Sci. 2018, 9, 5242–5525. [Google Scholar] [CrossRef] [PubMed]
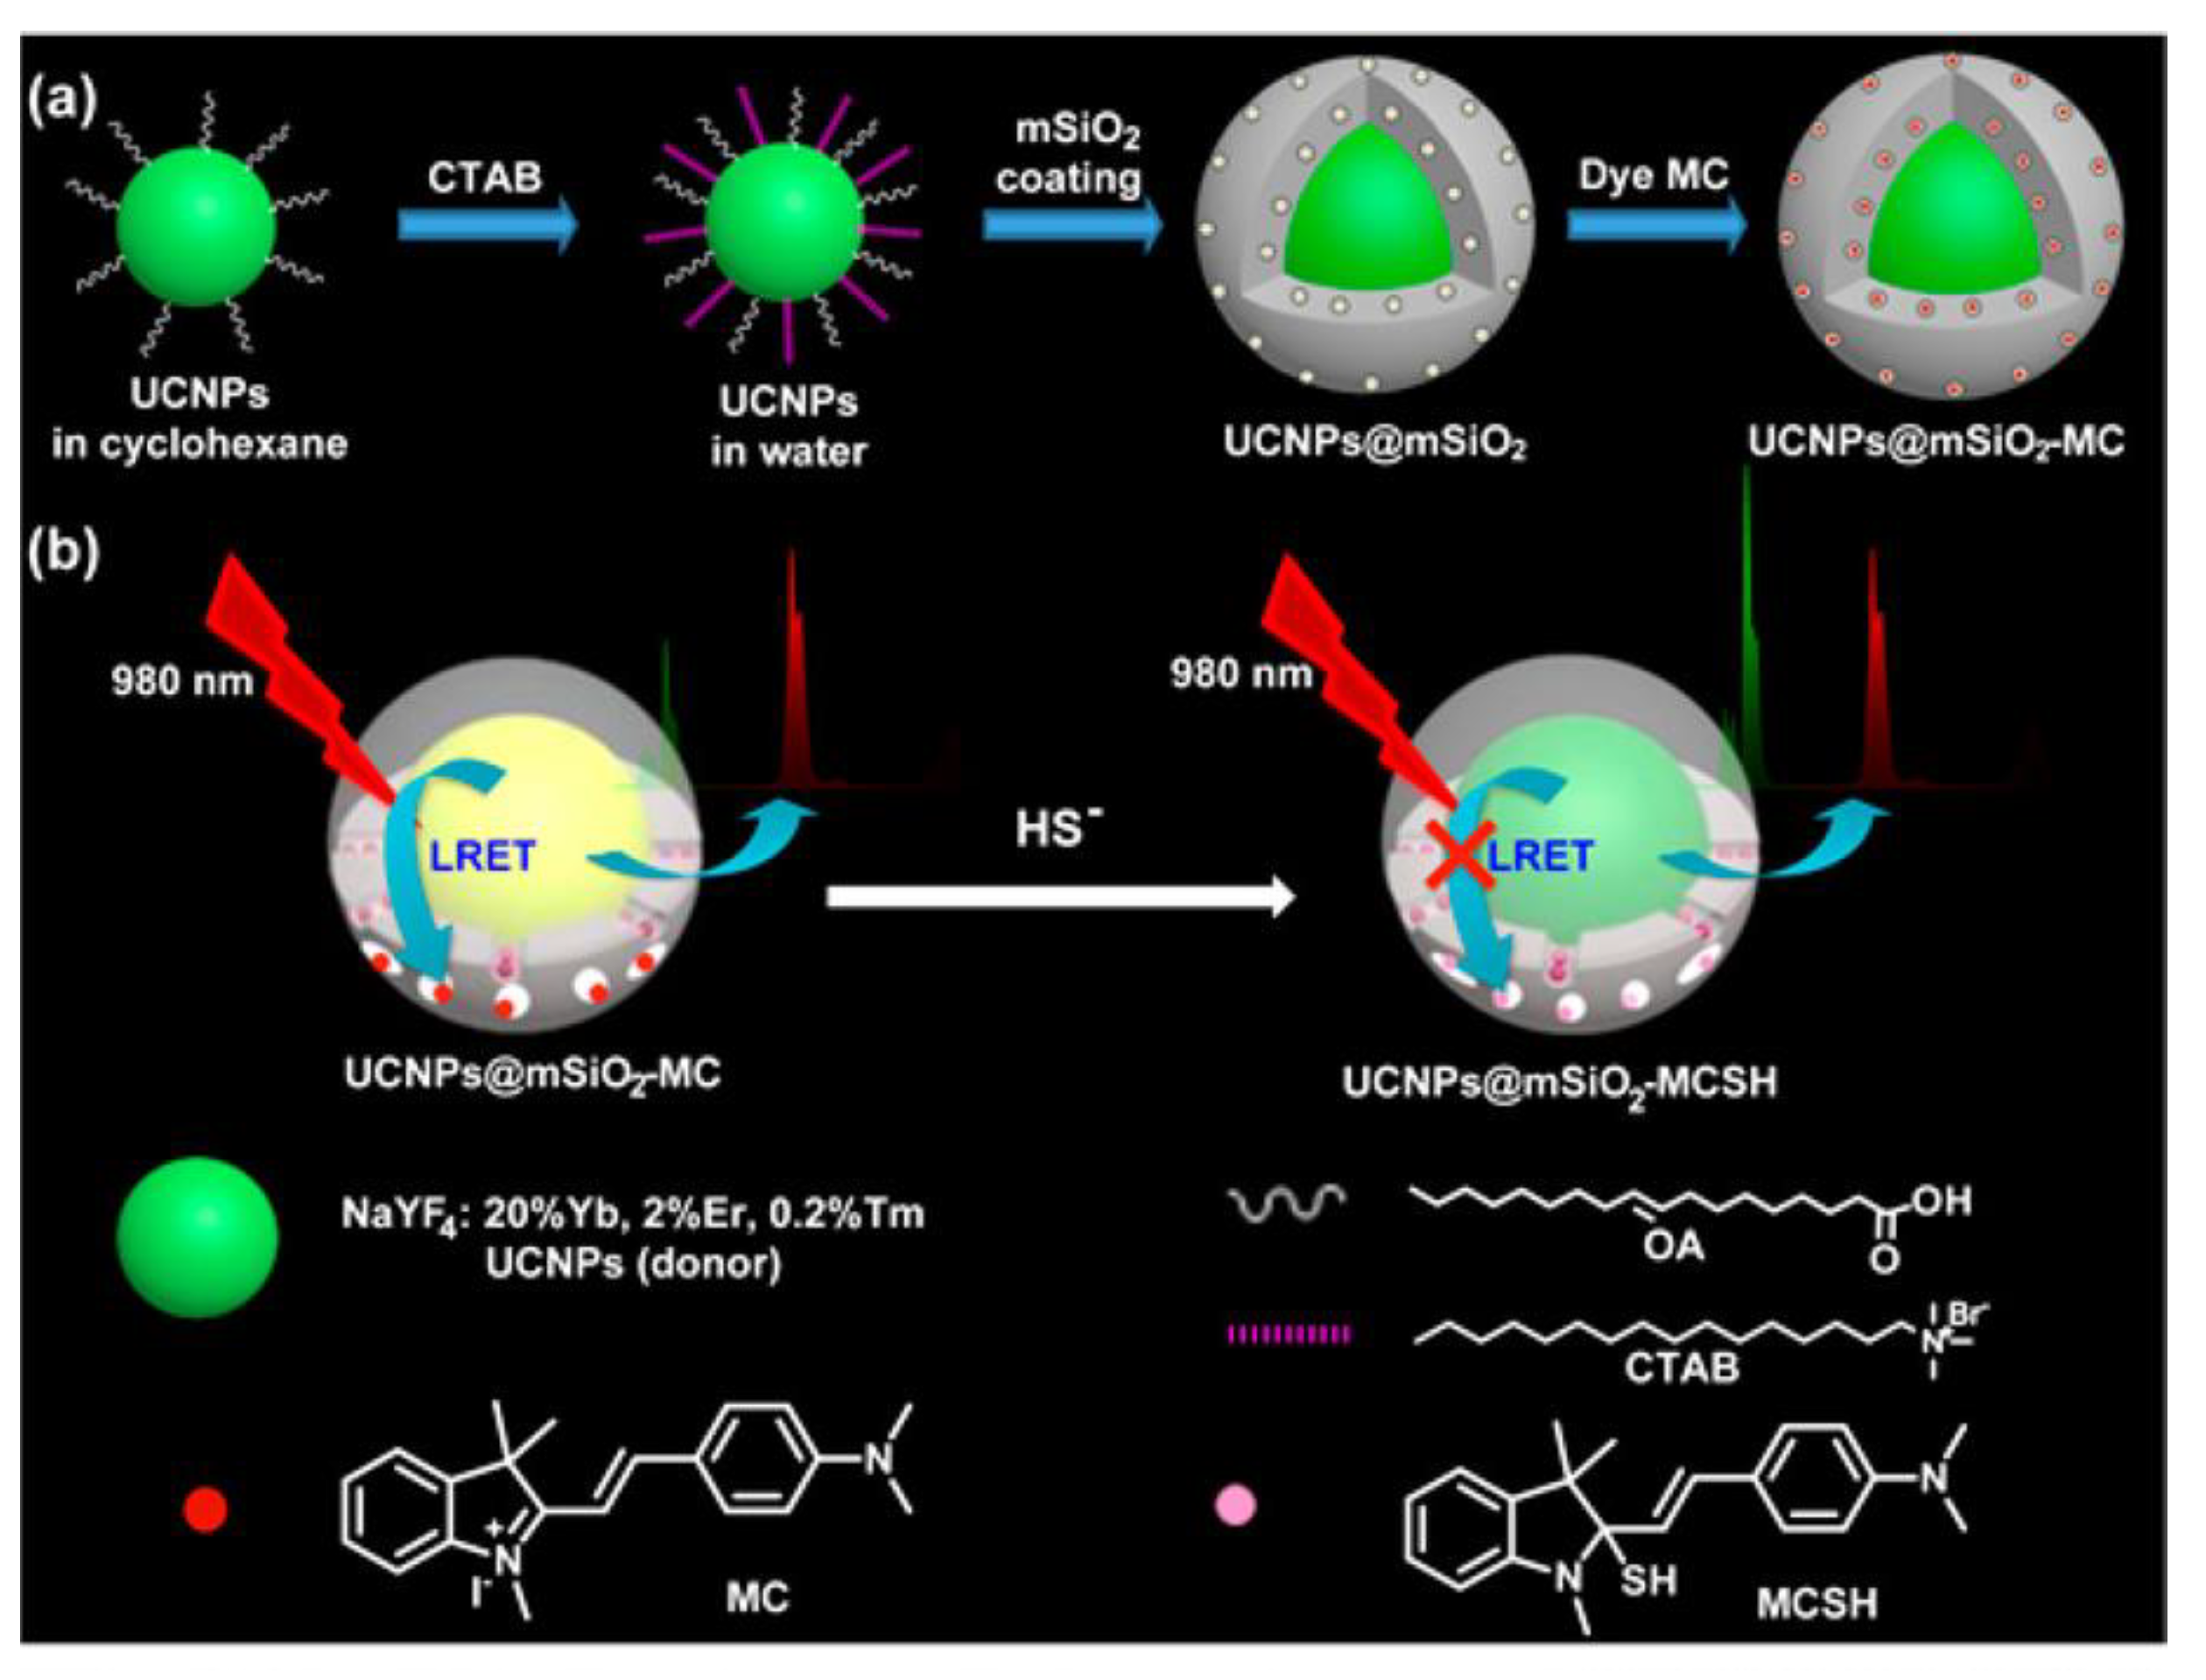
  122. Liu, S.; Zhang, L.; Yang, T.; Yang, H.; Zhang, K.Y.; Zhao, X.; Lv, W.; Yu, Q.; Zhang, X.; Zhao, Q.; et al. Development of Upconversion Luminescent Probe for Ratiometric Sensing and Bioimaging of Hydrogen Sulfide. ACS Appl. Mater. Interfaces 2014, 6, 11013–11017. [Google Scholar] [CrossRef] [PubMed]
  123. Liu, Q.; Peng, J.; Sun, L.; Li, F. High-Efficiency Upconversion Luminescent Sensing and Bioimaging of Hg(II) by Chromophoric Ruthenium Complex-Assembled Nanophosphors. ACS Nano 2011, 5, 8040–8048. [Google Scholar] [CrossRef] [PubMed]
  124. Cen, Y.; Wu, Y.-M.; Kong, X.-J.; Wu, S.; Yu, R.-Q.; Chu, X. Phospholipid-Modified Upconversion Nanoprobe for Ratiometric Fluorescence Detection and Imaging of Phospholipase D in Cell Lysate and in Living Cells. Anal. Chem. 2014, 86, 7119–7127. [Google Scholar] [CrossRef]
  125. Li, C.; Ding, S.; Yang, L.; Zhu, Q.; Chen, M.; Tsang, D.C.W.; Cai, G.; Feng, C.; Wang, Y.; Zhang, C. Planar optode: A two-dimensional imaging technique for studying spatial-temporal dynamics of solutes in sediment and soil. Earth Sci. Rev. 2019, 197, 102916. [Google Scholar] [CrossRef]
  126. Scholz, V.V.; Brodersen, K.E.; Kühl, M.; Koren, K. Resolving Chemical Gradients Around Seagrass Roots—A Review of Available Methods. Front. Mar. Sci. 2021, 8, 771382. [Google Scholar] [CrossRef]
  127. Clarke, J.S.; Achterberg, E.P.; Connelly, D.P.; Schuster, U.; Mowlem, M. Developments in Marine pCO2 Measurement Technology; Ttowards Sustained in situ Observations. TrAC 2017, 88, 53–61. [Google Scholar] [CrossRef]
  128. Hancke, K.; Sorell, B.K.; Lund-Hansen, L.C.; Larsen, M.; Hancke, T.; Glud, R.N. Effects of Temperature and Irradiance on a Benthic Microalgal Community: A Combined Two-Dimensional Oxygen and Fluorescence Imaging Approach. Limnol. Oceanogr. 2014, 59, 1599–1611. [Google Scholar] [CrossRef]
  129. Christel, W.; Zhu, K.; Hoefer, C.; Kreuzeder, A.; Santner, J.; Bruun, S.; Magid, J.; Jensen, L.S. Spatiotemporal Dynamics of Phosphorus Release, Oxygen Consumption and Greenhouse Gas Emissions after Localised Soil Amendment with Organic Fertilisers. Sci. Total Environ. 2016, 554–555, 119–129. [Google Scholar] [CrossRef] [PubMed]
  130. Han, C.; Ren, J.; Tang, H.; Xu, D.; Xie, X. Quantitative Imaging of Radial Oxygen Loss from Valisneria spiralis Roots with a Fluorescent Planar Optode. Sci. Total Environ. 2016, 569–570, 1232–1240. [Google Scholar] [CrossRef]
  131. He, Y.; Ding, N.; Yu, G.; Sunahara, G.I.; Lin, H.; Zhang, X.; Ullah, H.; Liu, J. High-Resolution Imaging of O2 Dynamics and Metal Solubilization in the Rhizosphere of the Hyperaccumulator Leersia hexandra Swartz. J. Hazard. Mater. 2023, 455, 131580. [Google Scholar] [CrossRef]
  132. Li, C.; Ding, S.; Ma, X.; Chen, M.; Zhong, Z.; Zhang, Y.; Ren, M.; Zhang, M.; Yang, L.; Rong, N.; et al. O2 Distribution and Dynamics in the Rhizosphere of Phragmites Australis, and Implications for Nutrient Removal in Sediments. Environ. Pollut. 2021, 287, 117193. [Google Scholar] [CrossRef]
  133. Nyer, S.C.; Volkenborn, N.; Aller, R.C.; Graffam, M.; Zhu, Q.; Price, R.E. Nitrogen Transformations in Constructed Wetlands: A Closer Look at Plant-Soil Interactions Using Chemical Imaging. Sci. Total Environ. 2022, 816, 151560. [Google Scholar] [CrossRef]
  134. Borer, B.; Tecon, R.; Or, D. Spatial Organization of Bacterial Populations in Response to Oxygen and Carbon Counter-gradients in Pore Networks. Nat. Commun. 2018, 9, 769. [Google Scholar] [CrossRef] [PubMed]
  135. Han, C.; Yao, L.; Xu, D.; Xi, X.; Zhang, C. High-Resolution Imaging of pH in Alkaline Sediments and Water Based on a New Rapid Response Fluorescent Planar Optode. Sci. Rep. 2016, 6, 26417. [Google Scholar] [CrossRef] [PubMed]
  136. Blossfeld, S.; Schreiber, C.M.; Liebsch, G.; Kuhn, A.J.; Hinsinger, P. Quantitative Imaging of Rhizosphere pH and CO2 Dynamics with Planar Optodes. Ann. Bot. 2013, 112, 267–276. [Google Scholar] [CrossRef] [PubMed]
  137. Jiang, Z.; Yu, X.; Hao, Y. Design and Fabrication of a Ratiometric Planar Optode for Simultaneous Imaging of pH and Oxygen. Sensors 2017, 17, 1316. [Google Scholar] [CrossRef] [PubMed]
  138. Lenzewski, N.; Mueller, P.; Meier, R.J.; Liebsch, G.; Jensen, K.; Koop-Jakobsen, K. Dynamics of Oxygen and Carbon Dioxide in Rhizospheres of Lobelia dortmanna—A Planar Optode Study of Belowground Gas Exchange Between Plants and Sediment. N. Phytol. 2018, 218, 131–141. [Google Scholar] [CrossRef] [PubMed]
  139. Koop-Jakobsen, K.; Mueller, P.; Meier, R.J.; Liebsch, G.; Jensen, K. Plant-Sediment Interactions in Salt Marshes—An Optode Imaging Study of O2, pH, and CO2 Gradients in the Rhizosphere. Front. Plant Sci. 2018, 9, 541. [Google Scholar] [CrossRef]
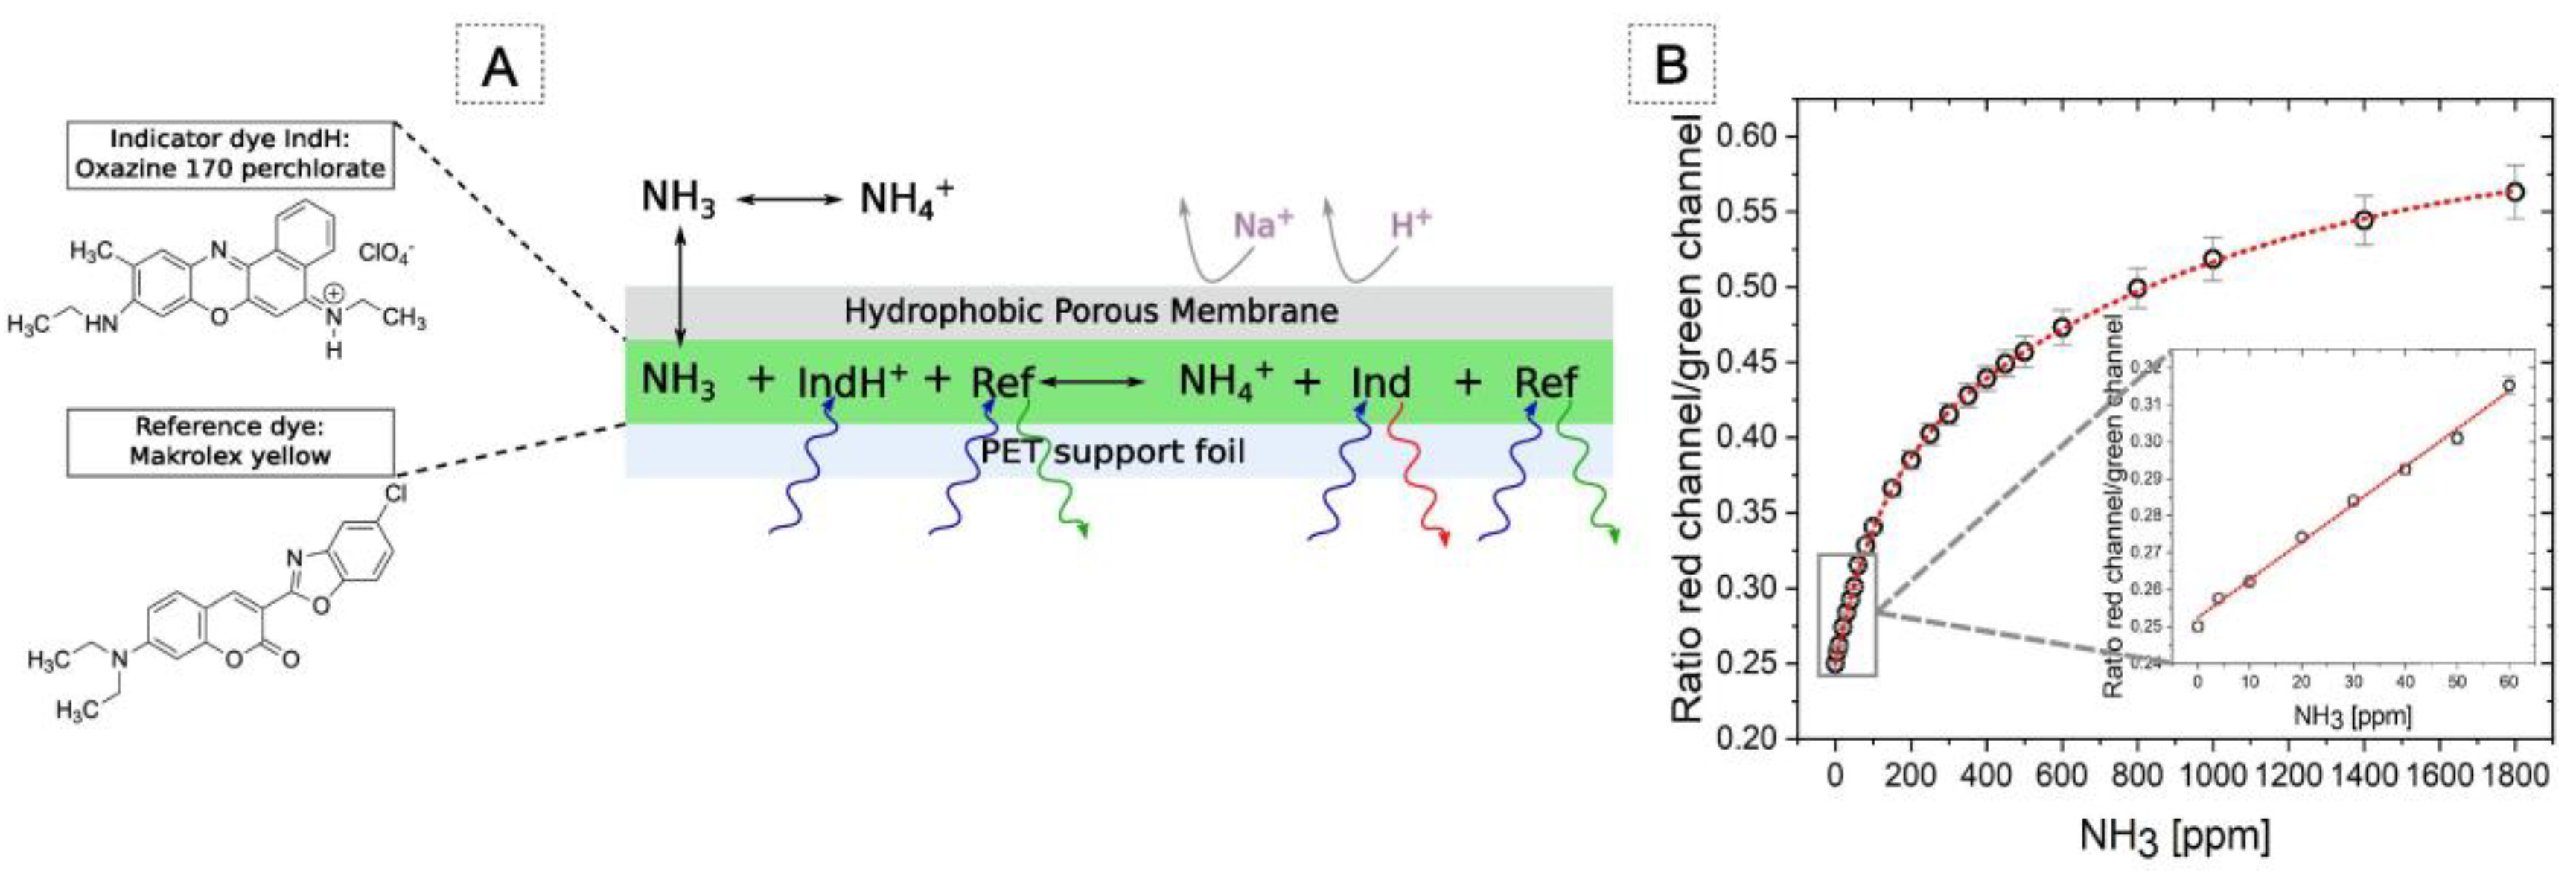
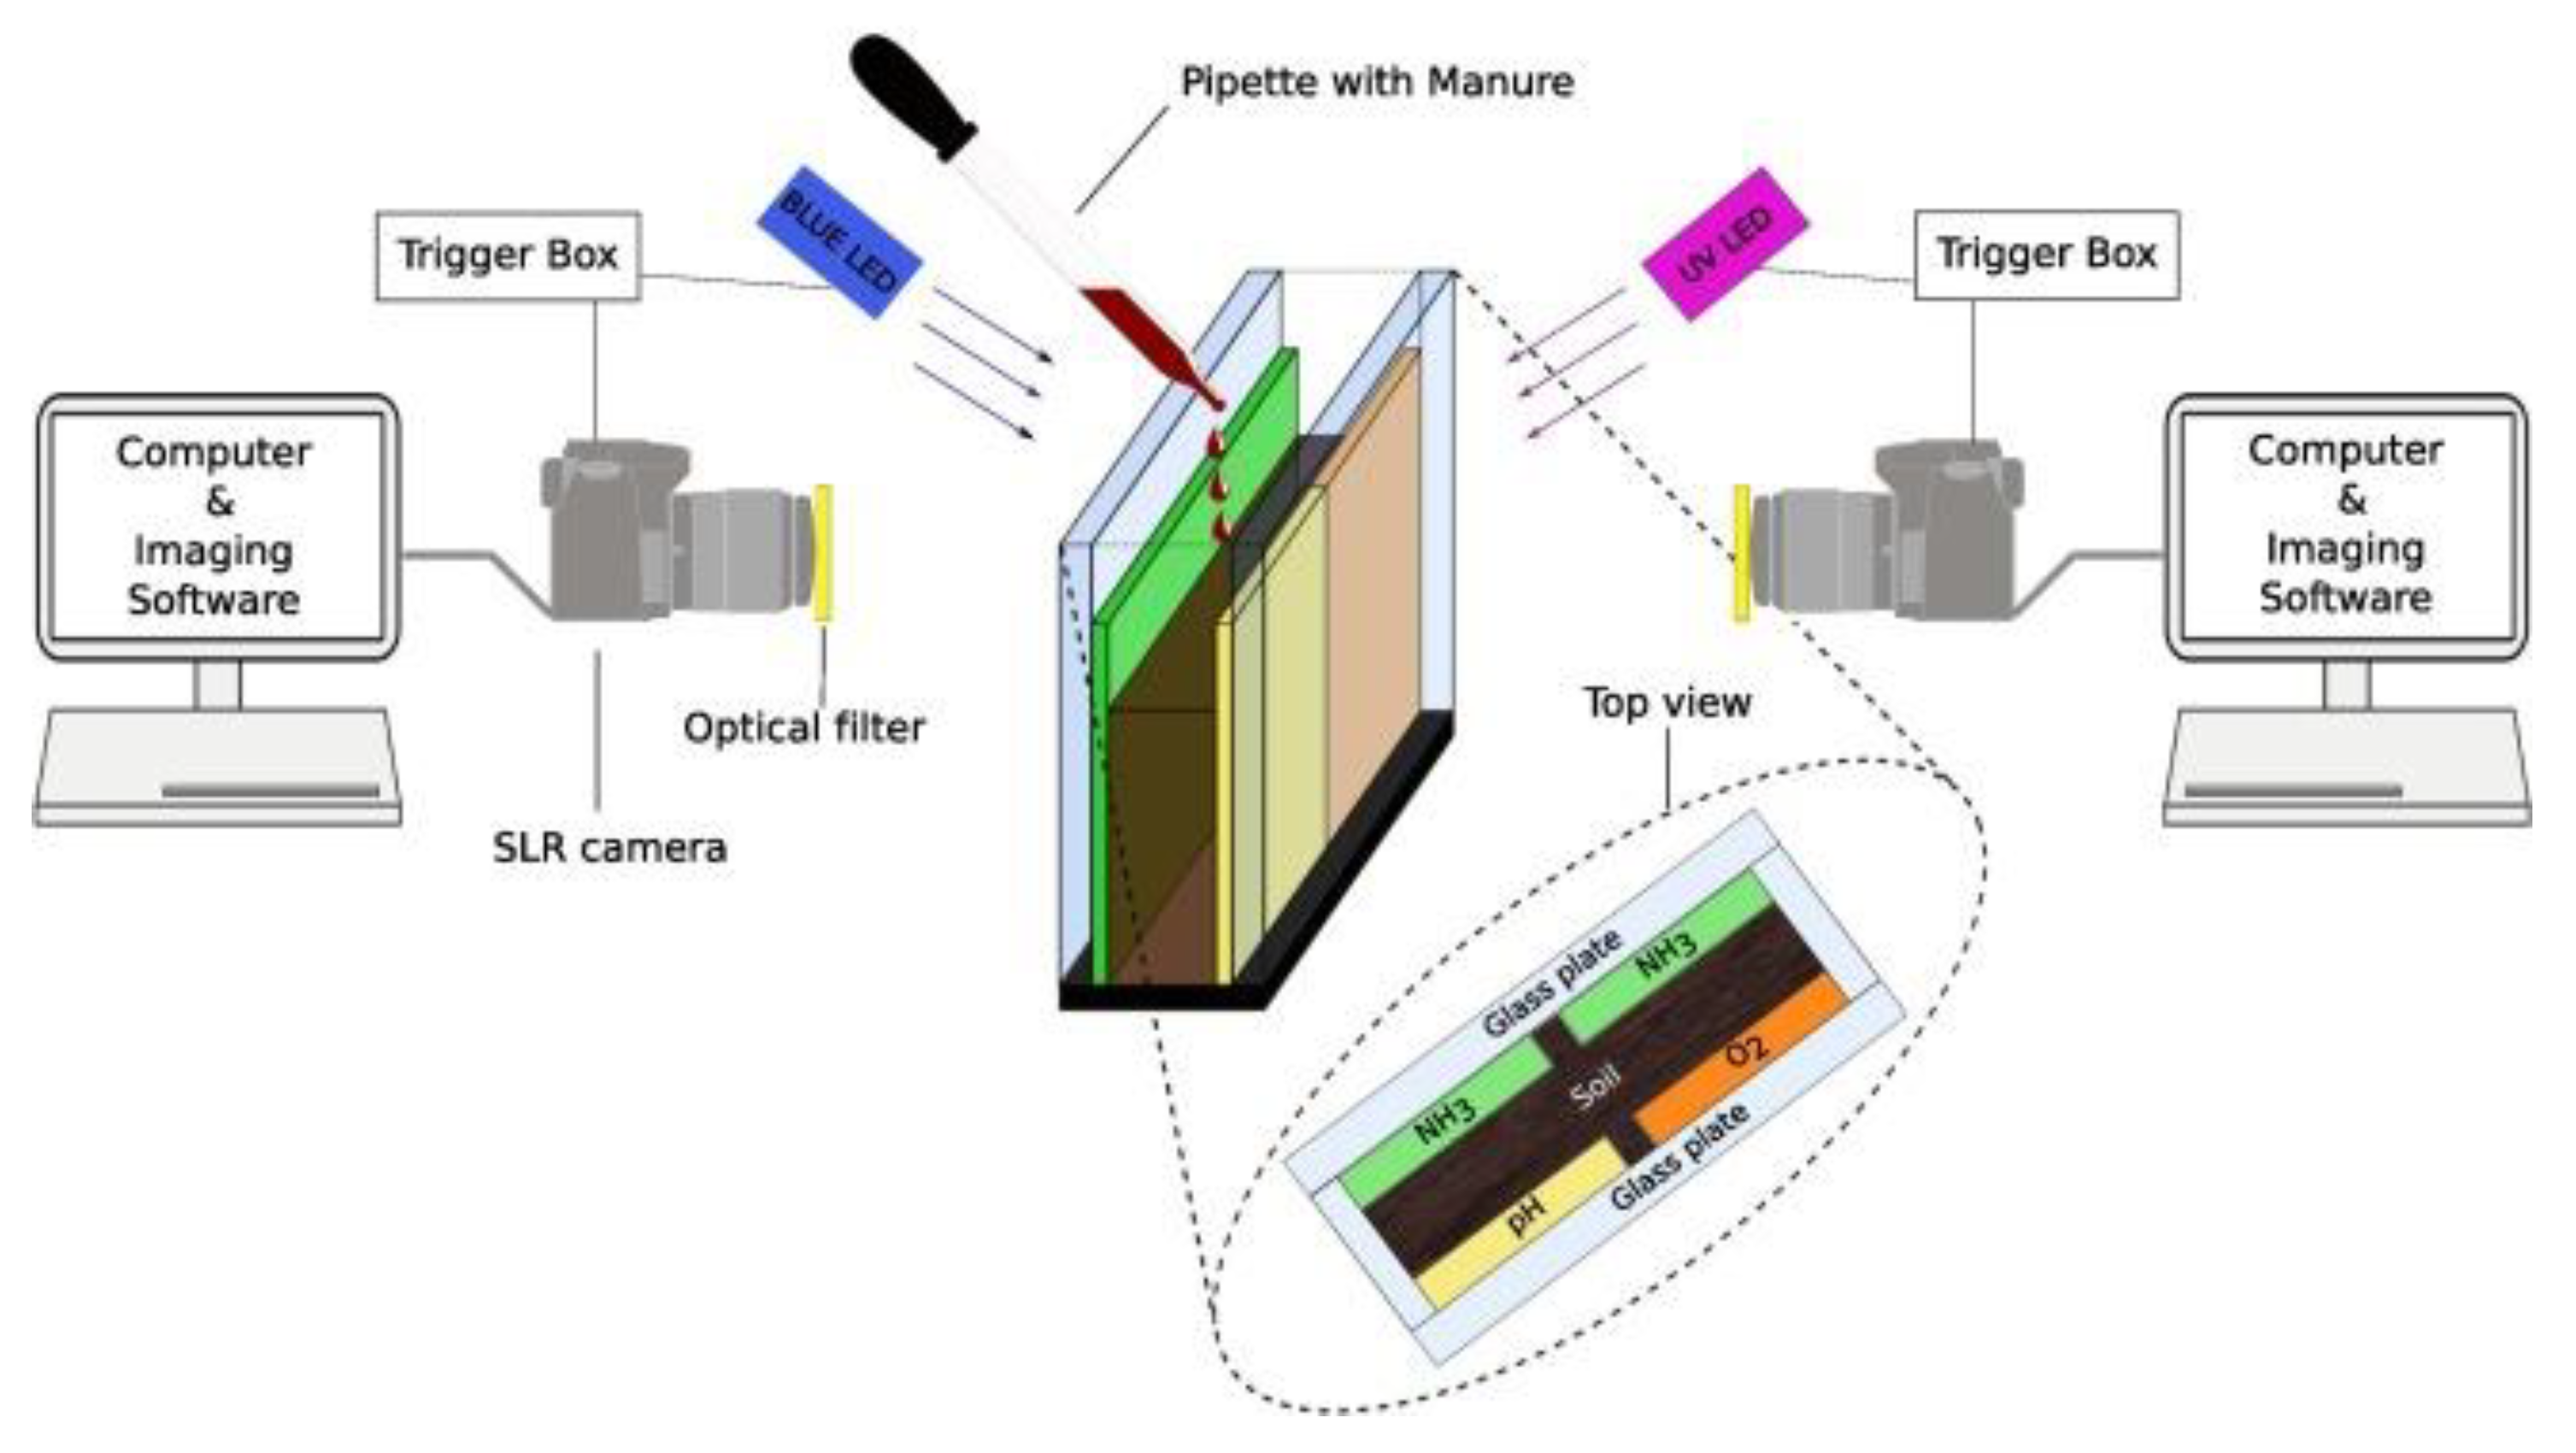
  140. Merl, T.; Koren, K. Visualizing NH3 Emission and the Local O2 and pH Microenvironment of Soil Upon Manure Application Using Optical Sensors. Environ. Int. 2020, 144, 106080. [Google Scholar] [CrossRef]
  141. Moßhammer, M.; Strobl, M.; Kühl, M.; Klimant, I.; Borisov, S.M.; Koren, K. Design and Application of Optical Sensor for Simultaneous Imaging of pH and Dissolved O2 with Low Cross Talk. ACS Sens. 2016, 1, 681–687. [Google Scholar] [CrossRef]
  142. Nielsen, S.D.; Paegle, I.; Borisov, S.M.; Kjeldsen, K.U.; Røy, H.; Skibsted, J.; Koren, K. Optical Sensing of pH and O2 in the Evaluation of Bioactive Self Healing Cement. ACS Omega 2019, 4, 20237–20243. [Google Scholar] [CrossRef] [PubMed]
  143. Koren, K.; Jakobsen, S.L.; Kühl, M. In-vivo Imaging of O2 Dynamics on Coral Surfaces Spray-Painted with Sensor Nanoparticles. Sens. Actuators B Chem. 2016, 237, 1095–1101. [Google Scholar] [CrossRef]
  144. Koren, K.; Brodersen, K.E.; Jakobsen, S.L.; Kühl, M. Optical Sensor Nanoparticles in Artificial Sediments–A New Tool to Visualize O2 Dynamics around the Rhizome and Roots of Seagrasses. Environ. Sci. Technol. 2015, 49, 2286–2292. [Google Scholar] [CrossRef] [PubMed]
  145. Fabricius-Dyg, J.; Mistlberger, G.; Staal, M.; Borisov, S.M.; Klimant, I.; Kühl, M. Imaging of Surface O2 Dynamics in Corals with Magnetic Micro Optode Particles. Mar. Biol. 2012, 159, 1621–1631. [Google Scholar] [CrossRef]
  146. Liu, T.; Sullivan, J.P.; Asai, K.; Klein, C.; Egami, Y. Pressure and Temperature Sensitive Paints, 2nd ed.; Experiment Fluid Mechanics; Springer: Berlin/Heidelberg, Germany, 2021. [Google Scholar]
  147. Puklin, E.; Carlson, B.; Gouin, S.; Costin, C.; Green, E.; Ponomarev, S.; Tanji, H.; Gouterman, M. Ideality of Pressure-Sensitive Paint. I. Platinum tetra(pentafluorophenyl) porphine in Fuoroacrylic Polymer. J. Appl. Polym. Sci. 2000, 77, 2795–2804. [Google Scholar] [CrossRef]
  148. Juliano, T.J.; Disotell, K.J.; Gregory, J.W.; Crafton, J.; Fonov, S. Motion-Deblurred, Fast-Response Pressure-Sensitive Paint on a Rotor in Forward Flight. Meas. Sci. Technol. 2012, 23, 045303/1–045303/11. [Google Scholar] [CrossRef]
  149. Kameda, M.; Seki, H.; Makoshi, T.; Amao, Y.; Nakakita, K. Fast-Response Pressure Sensor Based on a Dye-Adsorbed Silica Nanoparticle Film. Sens. Actuators B 2012, 171–172, 343–349. [Google Scholar] [CrossRef]
  150. Matsuda, Y.; Yamaguchi, H.; Niimi, T. Development of Pressure-Sensitive Channel Chip for Micro Gas Flows. J. Phys. Conf. Ser. 2012, 362, 012036/1–012036/6. [Google Scholar] [CrossRef]
  151. Sakaue, H.; Kodama, H.; Morita, K.; Ishikawa, H. Super-Hydrophobic Porous Pressure-Sensitive Paint for Global Unsteady Flow Measurements. Sens. Actuators B 2013, 185, 154–158. [Google Scholar] [CrossRef]
  152. Idris, A.C.; Saad, M.R.; Zare-Behtash, H.; Kontis, K. Luminescent Measurement Systems for the Investigation of a Scramjet Inlet-Isolator. Sensors 2014, 14, 6606–6632. [Google Scholar] [CrossRef]
  153. Obata, M.; Asato, R.; Mitsuo, K.; Hirohara, S. Radical Polymerization of Trifluoromethyl-Substituted Methyl Methacrylates and their Application for Use in Pressure-Sensitive Paint. J. Polym. Sci. Part A Polym. Chem. 2014, 52, 963–972. [Google Scholar] [CrossRef]
  154. Obata, M.; Asato, R.; Hirohara, S.; Mitsuo, K. Effect of Polymer Matrix on the Performance of Pressure-Sensitive Paint Comprising 5,10,15,20-tetrakis(pentafluorophenyl)porphinato platinum(II) and poly(1,1,1,3,3,3-hexafluoroisopropyl-co-tert-butyl methacrylates). J. Appl. Polym. Sci. 2016, 133, 43316. [Google Scholar] [CrossRef]
  155. Huang, C.-Y.; Chen, Y.-H.; Wan, S.-A.; Wang, Y.-C. Quantitative Visualization of Asymmetric Gas Flow in Constricted Microchannels by Using Pressure-Sensitive Paint. J. Micromech. Microengin 2016, 26, 105002/1–105002/9. [Google Scholar] [CrossRef]
  156. Akram, M.; Mei, Z.; Shi, J.; Wen, J.; Khalid, H.; Jiang, J.; Tian, Y.; Tian, Y. Electrospun Nanofibers and Spin Coated Films Prepared from Side-Chain Copolymers with Chemically Bounded Platinum (II) porphyrin Moieties for Oxygen Sensing and Pressure Sensitive Paints. Talanta 2018, 188, 124–134. [Google Scholar] [CrossRef]
  157. Shi, J.; Zhou, Y.; Jiang, J.; Pan, T.; Mei, Z.; Wen, J.; Yang, C.; Wang, Z.; Tian, Y. Multi-arm Polymers Prepared by Atom Transfer Rradical Polymerization (ATRP) and their Electrospun Films as Oxygen Sensors and Pressure Sensitive Paints. Eur. Polym. J. 2019, 112, 214–221. [Google Scholar] [CrossRef]
  158. Shi, J.; Wei, C.; Deng, M.; Liang, L.; Tian, Y. Synthesis of Fluorinated Copolymers and their Applications as Pressure-Responsive Materials. J. Appl. Polym. Sci. 2023, 140, e53969. [Google Scholar] [CrossRef]
  159. Pandey, A.; Gregory, J.W. Step Response Characteristics of Polymer/Ceramic Pressure-Sensitive Paint. Sensors 2015, 15, 22304–22324. [Google Scholar] [CrossRef]
  160. Ali, M.Y.; Pandey, A.; Gregory, J.W. Dynamic Mode Decomposition of Fast Pressure Sensitive Paint Data. Sensors 2016, 16, 862. [Google Scholar] [CrossRef]
  161. Peng, D.; Wang, S.; Liu, Y. Fast PSP Measurements of Wall-Pressure Fluctuation in Low-Speed Flows: Improvements Using Proper Orthogonal Decomposition. Exp. Fluids 2016, 57, 45. [Google Scholar] [CrossRef]
  162. Khojasteh, A.R.; Wang, S.F.; Peng, D.; Yavuzkurt, S.; Liu, Y. Structure Analysis of Adiabatic Film Cooling Effectiveness in the Near Field of a Single Inclined Jet: Measurement Using Fast-Response Pressure-Sensitive Paint. Int. J. Heat Mass Transf. 2017, 110, 629–642. [Google Scholar] [CrossRef]
  163. Wu, J.; Bitter, M.; Cai, G.; He, B.; Kaehler, C. Investigation on Aerodynamic Force Effect of Vacuum Plumes Using Pressure-Sensitive Paint Technique and CFD-DSMC Solution. Sci. China Technol. Sci. 2017, 60, 1058–1067. [Google Scholar] [CrossRef]
  164. Sugioka, Y.; Arakida, K.; Kasai, M.; Nonomura, T.; Asai, K.; Egami, Y.; Nakakita, K. Evaluation of the Characteristics and Coating Film Structure of Polymer/Ceramic Pressure-Sensitive Paint. Sensors 2018, 18, 4041. [Google Scholar] [CrossRef]
  165. Peng, D.; Gu, F.; Li, Y.; Liu, Y. A Novel Sprayable Fast-Responding Pressure-Sensitive Paint Based on Mesoporous Silicone Dioxide Particles. Sens. Actuators A 2018, 279, 390–398. [Google Scholar] [CrossRef]
  166. Egami, Y.; Konishi, S.; Sato, Y.; Matsuda, Y. Effects of Solvents for Luminophore on Dynamic and Static Characteristics of Sprayable Polymer/Ceramic Pressure-Sensitive Paint. Sens. Actuators A 2019, 286, 188–194. [Google Scholar] [CrossRef]
  167. Kasai, M.; Sasaki, D.; Nagata, T.; Nonomura, T.; Asai, K. Frequency Response of Pressure-Sensitive Paints under Low-Pressure Conditions. Sensors 2021, 21, 3187. [Google Scholar] [CrossRef]
  168. Egami, Y.; Yamazaki, Y.; Hori, N.; Sugioka, Y.; Nakakita, K. Investigation of Factors Causing Nonuniformity in Luminescence Lifetime of Fast-Responding Pressure-Sensitive Paints. Sensors 2021, 21, 6076. [Google Scholar] [CrossRef]
  169. Li, Y.; Dong, Z.; Liang, L.; Liu, Y.; Peng, D. Simultaneous 3D Surface Profile and Pressure Measurement Using Phase-Shift Profilometry and Pressure-Sensitive Paint. Rev. Sci. Instrum. 2021, 92, 035107. [Google Scholar] [CrossRef]
  170. Kasai, M.; Suzuki, A.; Egami, Y.; Nonomura, T.; Asai, K. A Platinum-Based Fast-Response Pressure-Sensitive Paint Containing Hydrophobic Titanium Dioxide. Sens. Actuators A 2023, 350, 114140. [Google Scholar] [CrossRef]
  171. Matsuda, Y.; Uchida, K.; Egami, Y.; Yamaguchi, H.; Niimi, T. Polymer-Particle Pressure Sensitive Paint with High Photostability. Sensors 2016, 16, 550. [Google Scholar] [CrossRef]
  172. Peng, D.; Zhong, Z.; Gu, F.; Zhou, W.; Qi, F.; Liu, Y. Pressure-Sensitive Paint with Imprinted Pattern for Full-Field Endoscopic Measurement Using a Colour Camera. Sens. Actuators A 2019, 290, 28–35. [Google Scholar] [CrossRef]
  173. Peak, S.M.; Watkins, A.N. Addition of Silica-Coated Ag Nanoparticles to Enhance Luminescence Intensity of Pressure-Sensitive Paints. ACS Appl. Nano Mater. 2020, 3, 9813–9821. [Google Scholar] [CrossRef]
  174. Zhou, B.; Gu, F.; Liu, Y.; Peng, D. Signal Enhancement of Pressure-Sensitive Film Based on Localized Surface Plasmon Resonance. Sensors 2021, 21, 7627. [Google Scholar] [CrossRef]
  175. Yorita, D.; Klein, C.; Henne, U.; Ondrus, V.; Beifuss, U.; Hensch, A.-K.; Guntermann, P.; Quest, J. Application of Lifetime-based Pressure-Sensitive Paint Technique to Cryogenic Wind Tunnel Tests. In Proceedings of the 54th AIAA Aerospace Sciences Meeting, San Diego, CA, USA, 4–8 January 2016. [Google Scholar] [CrossRef]
  176. Yorita, D.; Klein, C.; Henne, U.; Ondrus, V.; Beifuss, U.; Hensch, A.-K.; Longo, R.; Guntermann, P.; Quest, J. Successful Application of Cryogenic Pressure Sensitive Paint Technique at ETW. In Proceedings of the 2018 AIAA Aerospace Sciences Meeting, Kissimmee, FL, USA, 8–12 January 2018. [Google Scholar] [CrossRef]
  177. Klein, C.; Yorita, D.; Henne, U.; Kleindienst, T.; Koch, S.; Ondrus, V. Unsteady Pressure Measurements by means of PSP in Cryogenic Conditions. In Proceedings of the AIAA SciTech 2020 Forum, Orlando, FL, USA, 6–10 January 2020. [Google Scholar] [CrossRef]
  178. Klein, C.; Yorita, D.; Henne, U.; Kleindienst, T.; Ondrus, V. Time-Resolved Pressure Measurements by Means of PSP in Cryogenic Conditions. In Proceedings of the AIAA SciTech 2022 Forum, San Diego, CA, USA, 3–7 January 2022. [Google Scholar] [CrossRef]
  179. Yang, L.; Erdem, E.; Zare-Behtash, H.; Kontis, K. Application of AA-PSP to Hypersonic Flows: The Double Ramp Model. Sens. Actuators B 2012, 161, 100–107. [Google Scholar] [CrossRef]
  180. Kameda, M.; Yoshida, M.; Sekiya, T.; Nakakita, K. Humidity Effects in the Response of a Porous Pressure-Sensitive Paint. Sens. Actuators B 2015, 208, 399–405. [Google Scholar] [CrossRef]
  181. Peng, D.; Chen, J.; Jiao, L.; Liu, Y. A Fast-Responding Semi-Transparent Pressure-Sensitive Paint Based on Through-Hole Anodized Aluminum Oxide Membrane. Sens. Actuators A 2018, 274, 10–18. [Google Scholar] [CrossRef]
  182. Sakaue, H.; Hayashi, T.; Ishikawa, H. Luminophore Application Study of Polymer-Ceramic Pressure-Sensitive Paint. Sensors 2013, 13, 7053–7064. [Google Scholar] [CrossRef]
  183. Hayashi, T.; Houpt, A.W.; Leonov, S.B.; Sakaue, H. Motion-Capturing Pressure-Sensitive Paint Method Under Transient Illumination by Plasma Source. J. Phys. D Appl. Phys. 2019, 52, 324005. [Google Scholar] [CrossRef]
  184. Egami, Y.; Hasegawa, A.; Matsuda, Y.; Ikami, T.; Nagai, H. Ruthenium-Based Fast-Responding Pressure-Sensitive Paint for Measuring Small Pressure Fluctuation in Low-Speed Flow Field. Meas. Sci. Technol. 2021, 32, 024003. [Google Scholar] [CrossRef]
  185. Huang, C.-Y.; Lin, Y.-F.; Huang, Y.-X.; Chung, K.-M. Pressure-Sensitive Paint Measurements with Temperature Correction on the Wing of AGARD-B Under Transonic Flow Conditions. Meas. Sci. Technol. 2021, 32, 094001. [Google Scholar] [CrossRef]
  186. Quinn, M.K.; Kontis, K. Pressure-Sensitive Paint Measurements of Transient Shock Phenomena. Sensors 2013, 13, 4404–4427. [Google Scholar] [CrossRef]
  187. Sakaue, H.; Kuriki, T.; Miyazaki, T. A Temperature-Cancellation Method of Pressure-Sensitive Paint on Porous Anodic Alumina Using 1-Pyrenesulfonic Acid. J. Lumin. 2012, 132, 256–260. [Google Scholar] [CrossRef]
  188. Sakaue, H.; Morita, K.; Iijima, Y.; Sakamura, Y. Response Time Scales of Anodized-Aluminum Pressure-Sensitive Paints. Sens. Actuators A 2013, 199, 74–79. [Google Scholar] [CrossRef]
  189. Yomo, K.; Ikami, T.; Fujita, K.; Nagai, H. Investigation of Formulations on Pyrene-Based Anodized-Aluminum Pressure Sensitive Paints for Supersonic Phenomena. Sensors 2022, 22, 4430. [Google Scholar] [CrossRef]
  190. Banishev, A.A.; Dlott, D.D. Ultrafast Pressure-Sensitive Paint for Shock Compression Spectroscopy. J. Appl. Phys. 2014, 115, 203515/1–203515/9. [Google Scholar] [CrossRef]
  191. Pilch, M.; Ortyl, J.; Chachaj-Brekiesz, A.; Galek, M.; Popielarz, R. Europium-Based Luminescent Sensors for Mapping Pressure Distribution on Surfaces. Sens. Actuators B 2020, 305, 127409. [Google Scholar] [CrossRef]
  192. Cellini, F.; Peterson, S.D.; Porfiri, M. Highly Compressible Fluorescent Particles for Pressure Sensing in Liquids. Appl. Phys. Lett. 2017, 110, 221904. [Google Scholar] [CrossRef]
  193. Yang, D.; Li, J.; Ren, J.; Wang, Q.; Zhou, S.; Wang, Q.; Xie, Z.; Qu, X. Fast-Response Oxygen Sensitive Transparent Coating for Inner Pressure Ratiometric Optical Mapping. J. Mater. Chem. C 2021, 9, 3919–3927. [Google Scholar] [CrossRef]
  194. Strozik, M.; Majkut, M.; Dykas, S. Measuring System for Pressure Sensitive Paint (PSP) Calibration in the Range of Low Pressure Gains. Mod. Appl. Sci. 2015, 9, 116–122. [Google Scholar] [CrossRef]
  195. Tagliabue, A.; Scharnowski, S.; Kähler, C.J. Surface Pressure Determination: A Comparison Between PIV-Based Methods and PSP Measurements. J. Vis. 2017, 20, 581–590. [Google Scholar] [CrossRef]
  196. Quinn, M.K. Binary Pressure-Sensitive Paint Measurements Using Miniaturised, Colour, Machine Vision Cameras. Meas. Sci. Technol. 2018, 29, 055107. [Google Scholar] [CrossRef]
  197. Park, J. Optical Glucose Sensor Using Pressure Sensitive Paint. Sensors 2021, 21, 4474. [Google Scholar] [CrossRef]
  198. Lenzi, T.; Picchi, A.; Becchi, R.; Andreini, A.; Facchini, B. Swirling Main Flow Effects on Flm Cooling: Time Resolved Adiabatic Effectiveness Measurements in a Gas Turbine Combustor Model. Int. J. Heat Mass Transf. 2023, 200, 123554. [Google Scholar] [CrossRef]
  199. Kolodner, P.; Tyson, A. Microscope Fluorescent Imaging of Surface Temperature Profiles with 0.01 °C Resolution. Appl. Phys. Lett. 1982, 40, 782–784. [Google Scholar] [CrossRef]
  200. Kolodner, P.; Tyson, A. Remote Thermal Imaging with 0.7 Micron Spatial Resolution Using Temperature Dependent Fluorescent Thin Films. Appl. Phys. Lett. 1983, 42, 117–119. [Google Scholar] [CrossRef]
  201. Kolodner, P.; Tyson, A. Non-Contact Surface Temperature Measurement During Reactive-Ion Etching Using Fluorescent Polymer Films. Appl. Phys. Lett. 1983, 42, 749–751. [Google Scholar] [CrossRef]
  202. Hasegawa, Y.; Kitagawa, Y. Thermo-Sensitive Luminescence of Lanthanide Complexes, Clusters, Coordination Polymers and Metal–Organic Frameworks with Organic Photosensitizers. J. Mater. Chem. C 2019, 7, 7494–7511. [Google Scholar] [CrossRef]
  203. Tsukamoto, T.; Tanaka, S. Patternable Temperature Sensitive Paint using Eu(TTA)3 for the Micro Thermal Imaging. J. Phys. Conf. Ser. 2013, 476, 012073. [Google Scholar] [CrossRef]
  204. Huang, C.-Y.; Li, C.-A.; Wang, H.-Y.; Liou, T.-M. The Application of Temperature-Sensitive Paints for Surface and Fluid Temperature Measurements in Both Thermal Developing and Fully Developed Regions of a Microchannel. J. Micromech. Microeng. 2013, 23, 037001. [Google Scholar] [CrossRef]
  205. Tsukamoto, T.; Esashi, M.; Tanaka, S. High Spatial, Temporal and Temperature Resolution Thermal Imaging Method Using Eu(TTA)3 Temperature Sensitive Paint. J. Micromech. Microeng. 2013, 23, 114015. [Google Scholar] [CrossRef]
  206. Liu, T.; Chen, T.; Salazar, D.M.; Miozzi, M. Skin Friction and Surface Optical Flow in Viscous Flows. Phys. Fluids 2022, 34, 067101. [Google Scholar] [CrossRef]
  207. Egami, Y.; Matsuda, Y.; Yamaguchi, H.; Niimi, T. Property Changes of Temperature-Sensitive Paint Immobilized in Acrylic Polymer Matrices. Sens. Actuators B 2014, 195, 677–681. [Google Scholar] [CrossRef]
  208. Wang, Z.; Qu, X.; Jin, B.; Shi, J.; Zhi-tian, L.; Xi-Gao, J. Effect of Polymer Matrix on Temperature Sensitivity of Temperature Sensitive Paints. Chin. J. Polym. Sci. 2015, 33, 1351–1358. [Google Scholar] [CrossRef]
  209. Ondrus, V.; Meier, R.J.; Klein, C.; Henne, U.; Schäferling, M.; Beifuss, U. Europium 1,3-Di(thienyl)propane-1,3-Diones with Outstanding Properties for Temperature Sensing. Sens. Actuators A 2015, 233, 434–441. [Google Scholar] [CrossRef]
  210. Costantini, M.; Hein, S.; Henne, U.; Klein, C.; Koch, S.; Schojda, L.; Ondrus, V.; Schröder, W. Pressure Gradient and Nonadiabatic Surface Effects on Boundary Layer Transition. AIAA J. 2016, 54, 3465–3480. [Google Scholar] [CrossRef]
  211. Risius, S.; Costantini, M.; Koch, S.; Hein, S.; Klein, C. Unit Reynolds Number, Mach Number and Pressure Gradient Effects on Laminar–Turbulent Transition in Two-Dimensional Boundary Layers. Exp. Fluids 2018, 59, 86. [Google Scholar] [CrossRef]
  212. Costantini, M.; Fuchs, C.; Henne, U.; Klein, C.; Ondrus, V.; Bruse, M.; Löhr, M.; Jacobs, M. A Reliable Experimental Methodology for the Study of Wind-Turbine Rotor Blade Aerodynamics. J. Phys. Conf. Ser. 2019, 1222, 012001. [Google Scholar] [CrossRef]
  213. Ikami, T.; Fujita, K.; Nagai, H.; Yorita, D. Measurement of Boundary Layer Transition on Oscillating Airfoil Using cntTSP in Low-Speed Wind Tunnel. Meas. Sci. Technol. 2021, 32, 075301. [Google Scholar] [CrossRef]
  214. Costantini, M.; Fuchs, C.; Henne, U.; Klein, C.; Ondrus, V.; Bruse, M.; Löhr, M.; Jacobs, M. Experimental Analysis of the Performance of a Wind-Turbine Airfoil Using Temperature-Sensitive Paint. AIAA J. 2021, 59, 4449–4464. [Google Scholar] [CrossRef]
  215. Miozzi, M.; Capone, A.; Costantini, M.; Fratto, L.; Klein, C.; Di Felice, F. Skin Friction and Coherent Structures Within a Laminar Separation Bubble. Exp. Fluids 2019, 60, 13. [Google Scholar] [CrossRef]
  216. Costantini, M.; Henne, U.; Klein, C.; Miozzi, M. Skin-Friction-Based Identification of the Critical Lines in a Transonic, High Reynolds Number Flow via Temperature-Sensitive Paint. Sensors 2021, 21, 5106. [Google Scholar] [CrossRef]
  217. Capone, A.; Klein, C.; Di Felice, F.; Beifuss, U.; Miozzi, M. Fast-Response Underwater TSP Investigation of Subcritical Instabilities of a Cylinder in Crossflow. Exp. Fluids 2015, 56, 196. [Google Scholar] [CrossRef]
  218. Lemarechal, J.; Klein, C.; Puckert, D.K.; Rist, U. Application of the Temperature-Sensitive Paint Method for Quantitative Measurements in Water. Meas. Sci. Technol. 2021, 32, 105301. [Google Scholar] [CrossRef]
  219. Ozawa, H. Experimental Study of Unsteady Aerothermodynamic Phenomena on Shock-Tube Wall Using Fast-Response Temperature-Sensitive Paints. Phys. Fluids 2016, 28, 046103/1–046103/15. [Google Scholar] [CrossRef]
  220. Ozawa, H.; Laurence, S.J.; Schramm, J.M.; Wagner, A.; Hannemann, K. Fast-Response Temperature-Sensitive-Paint Measurements on a Hypersonic Transition Cone. Exp. Fluids 2015, 56, 1853. [Google Scholar] [CrossRef]
  221. Ozawa, H.; Laurence, S.J. Experimental Investigation of the Shock-Induced Flow Over a Wall-Mounted Cylinder. J. Fluid Mech. 2018, 849, 1009–1042. [Google Scholar] [CrossRef]
  222. Bitter, M.; Hilfer, M.; Schubert, T.; Klein, C.; Niehuis, R. An Ultra-Fast TSP on a CNT Heating Layer for Unsteady Temperature and Heat Flux Measurements in Subsonic Flows. Sensors 2022, 22, 657. [Google Scholar] [CrossRef]
  223. Goodman, K.Z.; Lipford, W.E.; Watkins, A.N. Boundary-Layer Detection at Cryogenic Conditions Using Temperature Sensitive Paint Coupled with a Carbon Nanotube Heating Layer. Sensors 2016, 16, 2062. [Google Scholar] [CrossRef]
  224. Klein, C.; Henne, U.; Costantini, M.; Ondrus, V.; Beifuss, U.; Zhai, J.; Quest, J. Development of a Highly Sensitive Temperature-Sensitive Paint for Measurements Under Cryogenic Temperature (100–160 K) Conditions. In Proceedings of the 54th AIAA Aerospace Sciences Meeting, San Diego, CA, USA, 4–8 January 2016. [Google Scholar] [CrossRef]
  225. Egami, Y.; Fey, U.; Klein, C.; Quest, J.; Ondrus, V.; Beifuss, U. Development of New Two-Component Temperature-Sensitive Paint (TSP) for Cryogenic Testing. Meas. Sci. Technol. 2012, 23, 115301. [Google Scholar] [CrossRef]
  226. Watkins, A.N.; Goodman, K.; Peak, S. Transition Detection at Cryogenic Temperatures Using a Carbon-Based Resistive Heating Layer Coupled with Temperature Sensitive Paint. In Proceedings of the AIAA Scitech 2019 Forum, San Diego, CA, USA, 7–11 January 2019. [Google Scholar] [CrossRef]
  227. Claucherty, S.; Sakaue, H. Temperature Characterization of an Optical-Chemical Tunable-Peak Sensor Using CdSe/ZnS Quantum-Dots Applied on Anodized-Aluminum for Surface Temperature Measurement. Sens. Actuators B 2017, 251, 958–962. [Google Scholar] [CrossRef]
  228. Claucherty, S.; Sakaue, H. An Optical-Chemical Sensor Using Rhodamine B on Anodized-Aluminum for Surface Temperature Measurement from 150 to 500 K. Sens. Actuators B 2017, 240, 956–961. [Google Scholar] [CrossRef]
  229. Claucherty, S.; Sakaue, H. Phenol-Formaldehyde Resin for Optical-Chemical Temperature Sensing. Sensors 2018, 18, 1756. [Google Scholar] [CrossRef]
  230. Yamamoto, M.; Kitagawa, Y.; Nakanishi, T.; Fushimi, K.; Hasegawa, Y. Ligand-Assisted Back Energy Transfer in Luminescent TbIII Complexes for Thermosensing Properties. Chem. Eur. J. 2018, 24, 17719. [Google Scholar] [CrossRef]
  231. Hirai, Y.; Mallette, A.; Nishio, Y.; Patterson, W.; Hasegawa, Y.; Sakaue, H. Visualization of Icing of Supercooled Water Using Tb(III)-Based Temperature-Sensitive Paint. Sens. Actuators A 2019, 285, 599–602. [Google Scholar] [CrossRef]
  232. Iijima, Y.; Sakaue, H. Platinum Porphyrin and Luminescent Polymer for Two-Colour Pressure- and Temperature-Sensing Probes. Sens. Actuators A 2012, 184, 128–133. [Google Scholar] [CrossRef]
  233. Kameya, T.; Matsuda, Y.; Egami, Y.; Yamaguchi, H.; Niimi, T. Dual Luminescent Arrays Sensor Fabricated by Inkjet-Printing of Pressure- and Temperature-Sensitive Paints. Sens. Actuators B 2014, 190, 70–77. [Google Scholar] [CrossRef]
  234. Klein, C.; Henne, U.; Sachs, W.; Hock, S.; Falk, N.; Beifuss, U.; Ondrus, V.; Schaber, S. Pressure Measurement on Rotating Propeller Blades by Means of the Pressure-Sensitive Paint Lifetime Method. In Proceedings of the 51st AIAA Aerospace Sciences Meeting including the New Horizons Forum and Aerospace Exposition, Dallas, TX, USA, 7–10 January 2013. [Google Scholar]
  235. Fischer, L.H.; Karakus, C.; Meier, R.J.; Risch, N.; Wolfbeis, O.S.; Holder, E.; Schäferling, M. Referenced Dual Pressure- and Temperature-Sensitive Paint for Digital Colour Camera Read Out. Chem. Eur. J. 2012, 18, 15706–15713. [Google Scholar] [CrossRef]
  236. Peng, D.; Liu, Y. A Grid-Pattern PSP/TSP System for Simultaneous Pressure and Temperature Measurements. Sens. Actuators B 2016, 222, 141–150. [Google Scholar] [CrossRef]
  237. Moon, K.-J.; Mori, H.; Furukawa, M. Simultaneous Measurement Method of Pressure and Temperature Using Dual-Layer PSP/TSP with Lifetime-Based Method. Meas. Sci. Technol. 2018, 29, 125301. [Google Scholar] [CrossRef]
  238. Disotell, K.J.; Peng, D.; Juliano, T.J.; Gregory, J.W.; Crafton, J.W.; Komerath, N.M. Single-Shot Ttemperature- and Pressure-Sensitive Paint Measurements on an Unsteady Helicopter Blade. Exp. Fluids 2014, 55, 1671. [Google Scholar] [CrossRef]
  239. Gu, Q.-S.; Li, T.; Liu, T.; Yu, G.; Mao, G.-J.; Xu, F.; Li, C.-Y. Recent Advances in Design Strategies and Imaging Applications of Fluorescent Probes for ATP. Chemosensors 2023, 11, 417. [Google Scholar] [CrossRef]
  240. Sun, X.; Zhai, W.; Fossey, J.S.; James, T.D. Boronic Acids for Fluorescence Imaging of Carbohydrates. Chem. Commun. 2016, 52, 3456–3469. [Google Scholar] [CrossRef]
  241. Wang, K.; Zhang, R.; Zhao, X.; Ma, Y.; Ren, L.; Ren, Y.; Chen, G.; Ye, D.; Wu, J.; Hu, X.; et al. Reversible Recognition-Based Boronic Acid Probes for Glucose Detection in Live Cells and Zebrafish. J. Am. Chem. Soc. 2023, 145, 8408–8416. [Google Scholar] [CrossRef]
  242. Lin, V.S.; Dickinson, B.C.; Chang, C.J. Boronate-Based Fluorescent Probes: Imaging Hydrogen Peroxide in Living Systems. Methods Enzymol. 2013, 526, 19–43. [Google Scholar] [CrossRef] [PubMed]
  243. Brewer, T.F.; Garcia, F.J.; Onak, C.S.; Carroll, K.S.; Chang, C.J. Chemical Approaches to Discovery and Study of Sources and Targets of Hydrogen Peroxide Redox Signaling Through NADPH Oxidase Proteins. Ann. Rev. Biochem. 2015, 84, 765–790. [Google Scholar] [CrossRef] [PubMed]
  244. Huang, Y.; Yu, L.; Fu, L.; Hou, J.; Wang, L.; Sun, M.; Wang, X.; Chen, L. Molecular Fluorescent Probes for Imaging and Evaluation of Peroxynitrite Fluctuations in Lving Cells and In Vivo Under Hypoxic Stress. Sens. Actuators B 2022, 370, 132410. [Google Scholar] [CrossRef]
  245. Yan, Z.; Tang, Z.; Wang, X.; Zheng, Z.; Tian, Z.; Geng, X.; Li, Y.; Jiang, H. A Novel Golgi-Targetable Fluorescent Probe for Imaging Peroxynitrite in Golgi Stress and Sepsis-Iinduced Acute Lung Injury. Sens. Actuators B 2022, 369, 132352. [Google Scholar] [CrossRef]
  246. Niu, P.; Zhu, J.; Wie, L.; Liu, X. Application of Fluorescent Probes in Reactive Oxygen Species Disease Model. Crit. Rev. Anal. Chem. 2022, 11, 2080495. [Google Scholar] [CrossRef] [PubMed]
  247. Jenkins, J.; Borisov, S.M.; Papkovsky, D.B.; Dmitriev, R.I. Sulforhodamine Nanothermometer for Multiparametric Fluorescence Lifetime Imaging Microscopy. Anal. Chem. 2016, 88, 10566–10572. [Google Scholar] [CrossRef] [PubMed]
  248. Okabe, K.; Sakaguchi, R.; Shi, B.; Kiyonaka, S. Intracellular Thermometry with Fluorescent Sensors for Thermal Biology. Pflugers Arch. Eur. J. Physiol. 2018, 470, 717–731. [Google Scholar] [CrossRef]
  249. Duan, N.; Yang, S. Research Progress on. Multifunctional Fluorescent Probes for Biological Imaging, Food and Environmental Detection. Crit. Rev. Anal. Chem. 2022, 18, 1–43. [Google Scholar] [CrossRef]
  250. Liu, D.; Lu, K.; Poon, C.; Lin, W. Metal–Organic Frameworks as Sensory Materials and Imaging Agents. Inorg. Chem. 2014, 53, 1916–1924. [Google Scholar] [CrossRef]
  251. Zhang, M.; Feng, G.; Song, Z.; Zhou, Y.-P.; Chao, H.-Y.; Yuan, D.; Tan, T.T.Y.; Guo, Z.; Hu, Z.; Tang, B.Z.; et al. Two-Dimensional Metal–Organic Framework with Wide Channels and Responsive Turn-On Fluorescence for the Chemical Sensing of Volatile Organic Compounds. J. Am. Chem. Soc. 2014, 136, 7241–7244. [Google Scholar] [CrossRef]
  252. Zhao, S.-N.; Wang, G.; Poelman, D.; Voort, P.V.D. Luminescent Lanthanide MOFs: A Unique Platform for Chemical Sensing. Materials 2018, 11, 572. [Google Scholar] [CrossRef] [PubMed]
  253. Shen, Y.; Tissot, A.; Serre, C. Recent Progress on MOF-Based Optical Sensors for VOC Sensing. Chem. Sci. 2022, 13, 13978–14000. [Google Scholar] [CrossRef] [PubMed]
Figure 1. Synthesis route and chemical structures of new oxygen-sensitive europium and gadolinium complexes. Reprinted from Borisov et al. Adv. Funct. Mat. 2014, 24, 6548, Copyright 2014 John Wiley and Sons [30].
Chemosensors 12 00031 g001
Figure 2. (A) Experimental set up to determine skin oxygenation using the LLI-based imaging technology. The LLI-device excites the sensor foils with a pulsable LED array (blue light). Subsequent to the pulse of excitation light, the oxygen-dependent decay of the red light emitted from the sensor foil will be recorded by the LLI-device with the use of a time-gated CCD camera. The transparent sensor foil consists of a sensor layer, which comprises an oxygen-dependent probe immobilized in a highly oxygen-permeable polymer matrix. (B) Calibration of the LLI-sensor foil. (C) LLI-sensor foil (green) on the footpad (white edging) of a hind leg of a restrained mouse that is positioned on a heating foil (black). (D) Representative black and white intensity image of the sensor (left) and the corresponding referenced pseudocolour image (right) of the calculated skin tissue oxygen distribution. Reprinted from Hofmann et al. Methods Appl. Fluoresc. 2013, [32]. © IOP Publishing. Reproduced with permission. All rights reserved.
Chemosensors 12 00031 g002
Figure 3. Perfused bioreactor experimental set up. The culture medium in reservoir 1 flows through gas-permeable tubes to the culture chamber and to reservoir 2. The culture chamber may hold 3 scaffolds. At the outlet of the culture chamber, a bypass circuit composed of a 3-way valve and a gas-impermeable tubing with an optically accessible miniaturized bioreactor allows the oxygen concentration in the culture medium to be measured. The exhausted culture medium in reservoir 2 was reversed and collected in a waste reservoir to assess glucose and lactate content. Reprinted from Eghbali et al. Int. J. Artif. Organs. 2017, 40, 185. Copyright 2017 Springer [38].
Chemosensors 12 00031 g003
Figure 4. Chemical structure of pHsensitive diazaoxatriangulenium dyes and PET sensing mechanism. Adapted with permission from Dalfen et al. Anal. Chem. 2019, 91, 808. Copyright 2019 American Chemical Society [43].
Chemosensors 12 00031 g004
Figure 5. (a) Diagram of a pH-sensing film integrated into a paper-based culture platform. A single sheet of paper, wax-patterned with three identical channels, was seeded with cells, sandwiched between a PET film and pH sensor, and placed in a custom-made acrylic holder. (b) Representative micrographs of a (top) single channel seeded with mCherry-expressing MDA-MB-231 cells, (middle) the pH-sensitive fluorescein particles, and (bottom) the pH-insensitive DPA reference particles. The wax lines were used to limit cellular movement during the experiment and are visible through the sensing film. (c) Schematic of the pH sensor (not to scale). Reprinted with permission from Kenney et al. Anal. Chem. 2018 [47]. Copyright 2018 American Chemical Society.
Chemosensors 12 00031 g005
Figure 6. Chemical structures and reaction mechanisms of DPP-based fluorescent pH indicators. (a) Photoinduced electron transfer induced by deprotonation of the phenol group, and (b) shift in fluorescence emission maximum induced by deprotonation of nitrogen. Reproduced from Ref. [51] with permission from the Royal Society of Chemistry.
Chemosensors 12 00031 g006
Figure 7. Clinical case of a 51-year-old male, three years after laryngectomy and radiochemotherapy, who suffered from severe wound healing disorder after treatment of a voice fistula insufficency. (a) Photo documentation. (b) pO2 sensor response. (c) pH sensor response. Sensor foils have a size of 2 × 2 cm. Copyright © 2019, Springer Nature, Auerswald et al., Radiat. Oncol. 2019, 14, 199 [59]. https://creativecommons.org/licenses/by/4.0/ (accessed on 2 February 2024).
Chemosensors 12 00031 g007
Figure 8. (a) Chemical structures of cyclometalated iridium(III) complexes and sensing mechanism for peroxynitrite ONOO. (b) Scheme of the synthetis route to phosphorescent mesoporous silica nanoprobe (MSN-ONOO) for peroxynitrite determination. Reprinted from Chen et al. Adv. Healthcare Mater. 2018, 7, 1800309, Copyright 2018 John Wiley and Sons [69].
Chemosensors 12 00031 g008
Figure 9. Synthesis and structure of molecular probes and nanosensor particles based on pH-sensitive perylene-bisimide dyes. Insert: Turn on fluorescence mechanism by interruption of PET due to the protonation of amino groups. Used with permission of Royal Society of Chemistry, Aigner et al. J. Mater. Chem. B, 2014, 2, 6792–6801, permission conveyed through Copyright Clearance Center, Inc. [74].
Chemosensors 12 00031 g009
Figure 10. Scheme of a ratiometric pH nanosensors consisting of hyperbranched polylactide nanoparticles, a score that is functionalized with the naphthalimide-based fluorophores N2 (green) as the pH-sensitive probe and N1 (blue) as the reference. Protonation of the naphthalimide leads to interruption of intramolecular PET. Reprinted with permission from Bao et al. Chem. Mater. 2015, 27, 3450–3455 [79]. Copyright 2015 American Chemical Society.
Chemosensors 12 00031 g010
Figure 11. Scheme and spectral properties of K+-sensitive Bodipy dye encapsulated in cationic methacrylate copolymer nanoparticles RL100. Reprinted from Müller et al. Adv. Funct. Mater. 2018, 28, 1704598 [80]. Copyright 2018 John Wiley and Sons.
Chemosensors 12 00031 g011
Figure 12. Preparation of dual-labeled carbon nanodots (DLCDs) with FITC as pH-sensitive dye and RBITC as reference. Reprinted from Shi et al. Angew. Chem. Int. Ed. 2012, 51, 6432–6435 [98]. Copyright 2018 John Wiley and Sons.
Chemosensors 12 00031 g012
Figure 13. (a) Scheme of the structure of a dopamine nanosensor and the resulting fluorescence emission enhancement of (GT)15DNA-wrapped SWNTs after binding of dopamine. Dopamine increases the fluorescence emission intensity of using both 1PE (b) and 2PE (c). The dashed line indicates the original signal, while solid the line indicates signal after dopamine addition. Reprinted from Del Bonis-O’Donnell et al., Adv. Funct. Mater. 2017, 27, 1702112 [103]. Copyright 2018 John Wiley and Sons.
Chemosensors 12 00031 g013
Figure 14. Top: Scheme of a ratiometric core–shell UC nanoprobe for intracellular pH sensing. The fluorescence of the pH-sensitive dye pHrodo Red is sensitized by the red upconversion luminescence (LRET), the green emission acts as reference. Bottom: Ratiometric imaging of pH probes reveals their localization in three types of microenvironment. Panel A shows localization of UCNPs by means of its green emission (550 nm) using 980 nm excitation, panel B sensitized UC-RET emission from pHrodo Red, panel C shows outlines of the cell in transmitted light, and panel D shows an overlaid ratiometric image of pH nanoprobes with different ratio depending on the localization. Different intensity ratios indicate localization of the nanoprobes in extracellular medium (ctrl), small endosomes, large endosomes, and lysosomes. Scale bar 10 μm [113].
Chemosensors 12 00031 g014
Figure 15. Normalized absorption and emission spectra showing the spectral overlap of the emission of NaYF4:Yb/Tm nanoparticles with the absorption of the oxygen-sensitive probe [Ru(dpp)3]2+Cl2. Black line: emission spectrum of the nanoparticles under photoexcitation at 980 nm. Red and blue line: absorbance and emission spectrum of [Ru(dpp)3]2+Cl2, respectively [117]. Reprinted with permission from Liu et al., J. Amer. Chem. Soc. 2015, Copyright 2015 American Chemical Society.
Chemosensors 12 00031 g015
Figure 16. (a) General design and synthetic route of silica coated upconversion nanoprobe functionalized with a merocyanaine dye (MC) UCNPs@SiO2-MC. (b) Sensing mechanism for HS detection and energy transfer (LRET) process of UCNPs@SiO2-MC [122]. Reprinted with permission from Liu et al., ACS Appl. Mater. Interfaces 2014, 6, 14, 11013. Copyright 2014 American Chemical Society.
Chemosensors 12 00031 g016
Figure 17. Experimental set up of the soil incubation box. Excitation filter: 470 nm short-pass filter; emission filter: 530 nm long-pass filter. (a) Filter membrane, ~10 μm thick, (b) DGT gel, ~100 μm thick, and (c) planar oxygen optode, ~30 μm thick. Copyright © 2016 Wibke et al. [129]. Published by Elsevier Ltd.
Chemosensors 12 00031 g017
Figure 18. pH distribution obtained by RGB imaging of a planar pH-sensitive optrode patterns in the rhizopshere of Vallisneria spiralsv. (A) Photo of roots of Vallisneria spiralsv through the side of a rhizobox. The three white dashed lines (a,b,c) represent the positions of the extracted profiles, presented in (C,D). (B) Two-dimensional pH distribution around the roots from Vallisneria spiralsv taken after 4 h in the light. The images size is 20 mm × 56 mm. (C) Two profiles (a,b) of pH distribution across the sediment and water interface represented by the horizontal dashed line (D) pH distribution across two single roots from one profile (c), with the rhizosphere zones indicated as shade areas [135]. Copyright © 2018, Springer Nature, Han et al., Sci. Rep. 2016, 6, 26417. https://creativecommons.org/licenses/by/4.0/ (accessed on 2 February 2024).
Chemosensors 12 00031 g018
Figure 19. (A) Composition of a planar NH3 optrode and the chemical reaction with ammonia that leads to a changed emission of the indicator dye Oxazoline 170 perchlorate due to deprotonation. Makrolex yellow is added as reference. (B) Ratiometric calibration curve of the NH3 and a close up of the linear range. Copyright © 2020 Merl et al. [140]. Published by Elsevier Ltd.
Chemosensors 12 00031 g019
Figure 20. Experimental set up for combined NH3, pH, and O2 visualization. Two transparent glass plates form a soil sandwich. Optrodes (one O2, one pH, and two NH3) were attached to the insides as shown. Soil is filled in between the slides and the optrodes leave a headspace. Two single-lens reflex cameras as well as a blue LED and a UV LED are positioned at the respective sides of the soil sandwich. This enables simultaneous imaging of the three parameters. Copyright © 2020 Merl et al. [140]. Published by Elsevier Ltd.
Chemosensors 12 00031 g020
Figure 21. (A) False color images showing the ratio between the red and green channel from RGB images of a spray-painted coral skeleton at various defined O2 levels in the surrounding seawater. (B) Calibration curve calculated by fitting an exponential decay function to the red-to-green ratio values vs. O2 concentration data. Copyright © 2016 Koren et al. [143]. Published by Elsevier Ltd.
Chemosensors 12 00031 g021
Figure 22. Left: PSP coating composed of PtTFPP as a sensor dye and PTMSP as binder on the lower side of a wing. Right: Pressure distribution on the upper side of wing model at test conditions Re = 25 × 106 (Reynolds number), T = 296 K, angle of attack = 1°. Luminescence lifetime data were converted to pressure coefficients and displayed [176]. Copyright © 2018 by the American Institute of Aeronautics and Astronautics, Inc.
Chemosensors 12 00031 g022
Figure 23. (a) Normalized intensity change, (b) relative temperature sensitivity of ruthenium complexes with different terpyridine ligands, and (c) description of the complexes [225]. Copyright © 2016 by the American Institute of Aeronautics and Astronautics, Inc.
Chemosensors 12 00031 g023
Figure 24. Boundary layer transition on a swept wing using the 2C-cryoTSP at T = 278 K, Ma = 0.5, and Re = 1.7 million in DNW-KRG and with a different surface roughness [226]. Copyright © 2018 by the American Institute of Aeronautics and Astronautics, Inc.
Chemosensors 12 00031 g024
Figure 25. Top: Picture of a PSP/TSP-coated propeller model in the test section of a low-speed wind tunnel. Bottom: Test results showing the pressure distribution at different rotational speeds n from 3000 to 24,550 at the suction side of the propeller blade [230]. © 2018 by Claucherty et al. http://creativecommons.org/licenses/by/4.0/ (accessed on 2 February 2024).
Chemosensors 12 00031 g025
Table 1. Characteristics of fluorescent nanoprobes for chemical sensing.
MaterialCompositionLuminescence PropertiesSensing Mechanism
Polymer NPsPS, PMMA, PAM, cationic hydrogel-Fluorescent probes incorporated or attached to surface
Silica NPsSiO2-Fluorescent probes incorporated or attached to surface
Quantum dotsCdSe/CdS
CdSe/ZnS
Intrinsic size-dependent fluorescence, high photostabilitySurface modification with fluorescent probes
NanocarbonCIntrinsic tunable fluorescence, size- and excitation-wavelength-dependentSurface modification with fluorescent probes
UCNPsNaYF4:Yb3+,Er3+
NaYF4:Yb3+,Tm3+
Sensitized emission of Yb3+ or Er3+ Surface modification with fluorescent probes, energy transfer
Table 2. Summary of newly developed and tested oxygen-sensitive probes in PSP applications and their spectroscopic properties.
Dyeλex [nm]λem [nm]Binding MatrixApplicationRefs.
Pyrene sulfonic acid350395, 455–465AAFast PSP[187,188,189]
Rhodamine 6G527580PMMAFast PSP[190]
EuTTA
complexes
336–342613–616Copolymer BA-DEGDA
Silicone elastomer
Anaerobic PSP[191]
Nile Red460570PDMSPSP in liquid[192]
Ru-Silane365630SiCD, siliconeFast PSP[193]
SiCD—Silicon-carbon dot; BA-DEGDA—butyl acrylate-diethylene glycol diacrylate.
Table 3. Novel developed and tested materials for oxygen optrodes and applications.
Sensitive Dyeλex [nm]λem [nm]Reference BinderApplicationRefs.
Eu-hydroxyphenalenone460615CoumarinPSTrace oxygen sensing[30]
Gd-hydroxyphenalenone460540, 600CoumarinPSTrace oxygen sensing[30]
PtTFPP392, 507, 540650NCCPNNot specifiedIn vivo imaging of skin oxygenation[32]
PtTFPP FLIMPS scaffoldCell culture O2 gradients[34]
PtTFPP Macrolex Fluorescent YellowPSO2 dynamics in soil, rhizosphere, cement[129,130,142]
PtOEP382, 536647CoumarinPETDental biofilm[35]
PtOEP Quantum DotPSO2 dynamics in seawater[137]
Ir(CS)2 acac445, 475564FLIMPSBenthic microalgal community [128]
Eu(HPhN)3dpp400–470617Bu3CoumPSO2 dynamics in microbial mats[141]
NCCPN: N-(5-carboxy-pentyl)-4-piperidino-1,8-naphthalimide.
Table 4. Novel developed and tested materials for pH, CO2, and NH3 optrodes and applications.
Sensitive Dyeλex [nm]λem [nm]Reference BinderApplication/Dynamic RangeRef.
Neutral Red/UCNP980550, 660UCNP emissionPUHuman serum
pH 6–7.5
[42]
Diazaoxatriangulenium560590FLIMPUpH 4–7[43]
Flourescein/Aminoethylcellulose *507542Ru(dpp)3/PAN *Traumasept wound gelWound imaging, pH 4–9[44]
Fluorescein DiphenylanthracenePUpH gradient in tumor models[47]
Phenolic BODIPY series495530 PU/test stripeSensor array pH 1–13[48]
Aza-BODIPY series 506–667516–680Lumogen Red/Fluorescent pigment greenECCO2 sensor, LOD 0.009 hPa[50]
Aza-Bodipy694720Bu3Coum PUpH 8–11 in cement[142]
1,4-Diketopyrrolo-[3,4-c]pyrroles509, 543/575, 606580Macrolex Fluorescence YellowPUMicrofluidic system, pH 6–9[51]
496–550564–587Dual emissionECCO2 sensor
LOD 0.07 kPa
[52]
501, 572524, 605Dual emissionECCO2 sensor[53]
Chlorophenyliminopropenyl-anailine550590Macrolex Fluorescence Yellow Sediment dynamics[135]
5-Hexadecanoyl-aminofluorescein495520Quantum DotPUpH 6–8, dynamics in seawater[137]
Oxazine 170 perchlorate624645Macrolex Fluorescence YellowPU/fluoropolymerNH3 sensor in soil, LOD 2.11 ppm[140]
* microparticles; EC = Ethyl cellulose.
Disclaimer/Publisher’s Note: The statements, opinions and data contained in all publications are solely those of the individual author(s) and contributor(s) and not of MDPI and/or the editor(s). MDPI and/or the editor(s) disclaim responsibility for any injury to people or property resulting from any ideas, methods, instructions or products referred to in the content.

