Abstract
Organic acids are a key active component of Pinellia ternata (Thunb.) Breit, and their concentration is closely associated with the quality of P. ternata. Developing an efficient and rapid method for detecting organic acids can offer a valuable technology for real-time assessment of P. ternata quality. In this work, a high-performance liquid chromatography coupled to triple quadrupole mass spectrometry (HPLC-QqQ-MS/MS) approach, combining the optimization of extraction conditions using response surface methodology (RSM), was developed for the simultaneous quantitative analysis of six organic acids in P. ternata. The optimal extraction conditions for organic acids in P. ternata were ultrasonic extraction with a solid–liquid ratio of 1:50, ultrasonic time of 60 min, and extraction temperature of 55 °C. Multiple-reaction monitoring (MRM) scanning was employed for quantification using HPLC-QqQ-MS/MS in negative ionization mode through a single run of 10 min, and the limit of detection (LLOD) and limit of quantification (LLOQ) for organic acids were as low as 0.138 ng/mL and 0.614 ng/mL, respectively. The relative standard deviations (RSDs) of reproducibility, precision, and stability were all lower than 5.0%, and recovery rates were 97.75–107.14%, with RSDs < 5.0%. Finally, this method was successfully applied to determine the investigated organic acids in 12 production regions of P. ternata, revealing significant differences between different production areas. This indicates that the optimized method is suitable for further accurate investigations of organic acids of P. ternata.
1. Introduction
Pinellia ternata (Thunb.) Breit is a perennial medicinal plant mainly produced in China [1]. Its dry tubers, with important pharmacological activities, have a long medicinal history, such as antitussive, expectorant, anti-inflammation, anti-tumor, and anti-early pregnancy effects [2]. Modern pharmacology is devoted to exploring the main active ingredients of medicinal plants that exert pharmacological activity. The metabolites of P. ternata are complex, mainly containing various types of organic acids (OAs), nucleosides, proteins, alkaloids, and others [3]. Organic acids are a class of compounds responsible for P. ternata’s biological activity, and their content is related to the antitussive effect [4,5], which is one of the important indices for evaluating the quality of P. ternata. Therefore, succinic acid, a typical OA component, was recorded as a quality evaluation indicator in the 2015 Chinese Pharmacopoeia. However, the current methods for determining succinic acid are relatively cumbersome, and efficient methods for determining other organic acid components in P. ternata are still lacking. At present, the commonly used analysis methods for OA content include potentiometric titration, high performance liquid chromatography (HPLC) [6], and gas chromatography (GC) [7]. The potentiometric titration method can only determine the total amount of all acids present but not the separate identification and determination of each acidic compound concentration. Therefore, HPLC is often used for single OA component determination but not many different OAs separately, which are susceptible to matrix interference under this method, resulting in inaccurate qualitative and quantitative results [6]. HPLC-coupled triple quadrupole mass spectrometry (HPLC-QqQ-MS/MS) can simultaneously achieve qualitative and quantitative analysis of target compounds and has been highly praised in the analytical chemistry field in recent years [8]. It has the characteristics of low matrix interference and high sensitivity. The comprehensive application of retention time, parent ion, daughter ion, and multi-reaction monitoring (MRM) instrument conditions can ensure the accuracy of qualitative and quantitative results of target analytes [9], and it is currently recognized as an efficient detection technology. However, a rapid and efficient HPLC-QqQ-MS/MS method for determining six organic acids (OAs) in P. ternata has not yet been explored and established.
In addition, extraction is an important step to obtain target compounds of medicinal materials [10]. Selecting the appropriate extraction technology and optimizing relevant process parameters can greatly reduce the time and economic costs of extraction processes [11]. There are many methods for extracting the active ingredients of natural medicines, including solvent extraction (SE) [12], steam distillation (SD) [13], ultrasonic-assisted extraction (UAE) [14], microwave-assisted extraction (MAE) [15], supercritical-fluid extraction (SFE) [16], enzyme hydrolysis (EH) [17], and other methods [18]. Among them, UAE has the advantages of simple extraction, convenient operation, high extraction efficiency, and short extraction time, making it the most commonly used process [19]. Moreover, it has a wide range of extraction adaptability and is suitable for extracting most species of Chinese medicinal materials and various ingredients [20]. However, the extraction efficiency of UAE is affected by many factors such as the solvent, material–liquid ratio, extraction repetition, temperature, and time. Response surface methodology (RSM) provides an excellent solution, serving as a statistical experimental method employed to analyze an empirical model. This model describes the impact of multiple independent variables on one or more dependent variables [21].
The extraction conditions of different materials are different, and selecting the appropriate extraction method can improve the extraction efficiency. We employed the RSM method to compare ultrasonic extraction time, temperature, and solid–liquid ratio to explore the optimal extraction process of organic acids in P. ternata. On this basis, we established a rapid detection and quantitative method utilizing HPLC-QqQ-MS/MS technology for the analysis of six organic acids’ concentrations in P. ternata samples. The method was verified, and LLOD, LLOQ, linearity, precision, and recovery rate were determined. Subsequently, the method was applied to analyze 13 samples from 12 production regions in China. The findings from this study contribute to the enhancement of the precise quantification of organic acid components in P. ternata, providing valuable insights for quality evaluation and exploring the pharmacological activity material basis of P. ternata.
2. Materials and Methods
2.1. Plant Material
After the aboveground part of the plants withered in summer, a total of 13 samples of P. ternata tubers were harvested from 12 production areas. The fresh collected samples were washed of the surface soil, peeled, and dried at 55 °C for 24 h. Then, they were crushed with a grinder and sieved through a 60 mesh sieve. The P. ternata powder sample was stored in a sealed bag and placed in dryer until the experiment. The detailed information for all samples is shown in Table S1.
2.2. Standard Solutions Preparation
To accurately weigh an appropriate amount of cis-aconite acid (≥98%), fumaric acid (≥98%), oxalic acid (≥98%), succinic acid (≥98%), citric acid (≥97%), and malic acid (≥98%) from Shanghai Yuanye Biotechnology Co., Ltd. (Shanghai, China), was dissolve in ultrapure water to obtain the mixed standard working solutions, which contained 7488 ng/mL of oxalic acid, 89,136 ng/mL of citric acid, 12,624 ng/mL of malic acid, 5080 ng/mL of succinic acid, 56,064 ng/mL of cis-aconite acid, and 5792 ng/mL of fumaric acid. All the standard solutions were stored at 4 °C for further analysis.
2.3. Single Factor Ultrasonic Extraction Assay
Precision weighing 0.5 g of P. ternata powder per piece (Sample 6) was conducted to optimize the ultrasonic-assisted extraction method. An experiment involving five factors affecting extraction was performed: extraction solvent (water, 50% methanol, methanol, 50% ethanol, ethanol), ultrasonic repetition (1, 2, 3 times), solid–liquid ratio (1:10, 1:30, 1:50, 1:70, 1:90), ultrasonic time (20, 40, 60, 80, 100 min), and ultrasonic temperature (20, 35, 50, 65, 80 °C). One of the factors was used as a variable, and the other factors were used as quantitative experiments to explore the effects on the total content of six organic acids in P. ternata.
2.4. Experimental Design and Statistical Analysis of Response Surface Methodology
The optimization of ultrasonic-assisted extraction for the total sum of six organic acids from P. ternata was conducted by the response surface method (RSM). The three key independent variables of solid–liquid ratio (A), ultrasonic time (B), and ultrasonic temperature (C) were investigated at three levels (−1, 0, 1), with the sum total yield of six organic acids as response variables (Table 1). A total of 17 different experiment combinations were analyzed using the software Design Expert (V8.0.6.1); detailed experimental designs are presented in Table 2. The experimental data were fitted into a second-order polynomial model, which represented the content of the total organic acids of 6 compounds as a function of the independent variables, as follows:
where Y represents the predicted response value and β0 is the intercept or regression, βi the linear, βii the quadratic, and βij the interaction coefficients. The parameters were optimized using the desirability function approach to achieve the highest yield of the total six organic acids. All experiments were carried out in triplicate, and the data were expressed as mean ± standard deviation (SD). The data were analyzed using ANOVA, with differences considered significant at a level of p < 0.05. Further, Design-Expert v8.0.6.1 software was used to analyze the results and draw the three-dimensional response surface diagram and contour diagram.

Table 1.
Level of the tested parameter for RSM design.
Table 2.
Extraction conditions of each treatment group in RSM optimization experiment.
2.5. Method of Application of Different Production Regions on P. ternata
The P. ternata powders from different production regions were accurately weighed at 0.5 g and added to 25 mL of ultrapure water to achieve a solid–liquid ratio of 1:50 (m/v). After ultrasound treatment at 55 °C for 60 min, the supernatant was centrifuged and retained. The residue was added to 25 mL of ultrapure water and extracted again. The supernatants were merged and pass through a 0.22 μm filter membrane twice for measurement according to the established method.
2.6. HPLC-QqQ-MS/MS Analysis
Chromatographic analyses were performed by a 1260 series HPLC system (Agilent Technologies, Santa Clara, CA, USA). Liquid chromatography was performed at 25 °C on an Agilent ZORBAX Eclipse Plus C18 (2.1 mm × 100 mm i.d., 1.8 μm particle size) (Agilent Technologies, USA). The mobile phase consisted of a 0.1% solution of formic acid water (A) and acetonitrile (B). Elution was performed in an isocratic mode with 95% of A for 0–10 min. The flow rate was 0.20 mL/min, and the volume of sample injection was 2 μL.
Mass spectrometry was performed on an Ultivo Triple Quadrupole Mass Spectrometer (Agilent Technologies, USA). An electrospray ionization source was operated in negative ion mode (ESI-). High-purity nitrogen was used as the sheath gas, auxiliary gas, and sweep gas. Other parameters included a drying temperature of 325 °C, flow rate of 8 L/min, atomizing gas pressure of 45 psi, sheath temperature of 350 °C, sheath gas flow rate of 11 L/min, and spray voltage of 3839 V. In addition, multiple-reaction monitoring (MRM) mode was selected for simultaneous detection of six OAs. The results of the fragment ions, corresponding declustering potential (DP), collision energy (CE), and retention time are listed in Table 3.
Table 3.
The MS/MS molecular formula (MF), molecular weight (MW), fragment ions, declustering potential (DP), collision energy (CE), and retention time (tR) of 6 targeted components.
2.7. Method Validation
According to the chromatographic and mass spectrometry conditions mentioned above, we diluted the mixed standard solution to different ratios and injected into wells it for testing. The peak area value of the standard solution was obtained (n = 6). With the peak area of the OA standard solution as the vertical coordinate and the concentration as the horizontal coordinate, the standard curve was drawn, and the regression equation and linear coefficient were calculated. Limits of detection (LLODs) and limits of quantification (LLOQs) were ascertained according to signal-to-noise (S/N) ratios greater than 3 and 10, respectively.
In addition, the mixed standard solution was injected into 6 wells, and the precision of the method was evaluated according to the relative standard deviation (RSD). The solutions prepared from the same sample were stored at 4 °C for 0, 2, 6, 8, 12, and 24 h to study the stability of the sample. The RSD of six consecutive injections of one sample was used to estimate the reproducibility of the method.
Moreover, precision weighing of 0.5 g of P. ternata powder (taken from sample 6) was performed, followed by the addition of 25 mL of ultrapure water. The mixture underwent ultrasonic extraction at 54 °C for 60 min. After extraction, the solution was filtered to retain the supernatant. The filter residue underwent another extraction process, and the liquid was filtered twice through a 0.22 μm microporous filter membrane. Finally, the content (N) was calculated. Then, an equal amount of standard substance (M) was added to the sub-samples of P. ternata to determine the total content (O) according to the established method. The above experiment was repeated six times, and specific M, N, and O values are shown in Table 4. The formula for the recovery rate of adding samples was as follows: Recovery rate (%) = (O − N)/M × 100.
Table 4.
Analysis of recovery results of six organic acids in P. ternata.
3. Results
3.1. Optimization of Chromatographic Conditions
Based on commonly used methods for determining organic acids [22], chromatographic conditions were optimized from multiple aspects such as mobile phase, flow rate, column temperature, and injection volume. Because the six organic acids tested were all weak acids, it was necessary to adjust the mobile phase system to weak acid conditions to prevent dissociation of the organic acids.
High abundance [M–H]− dehydrogenation excimer ion peaks were formed by adding 0.1% volume fraction of formic acid to the mobile aqueous phase. Using [M–H]− as the parent ion can obtain high-strength ion fragments and enhance the response value of the target compound. The effects of using methanol-0.1% formic acid water and acetonitrile-0.1% formic acid water as mobile phases on the separation and response values of the target compound were investigated. The results indicated that using acetonitrile-0.1% formic acid water as the mobile phase yields symmetrical peak shapes for the target compound in ESI− mode, with no tailing, blurring, or baseline drift. This composition is preferred. Additionally, we investigated peak time, shape, instrument pressure, and separation at flow rates of 0.1, 0.2, and 0.3 mL/min. At 0.1 mL/min, the analyte peak width increased, and retention time was longer. At 0.3 mL/min, the column pressure approached a critical level, negatively affecting the column. At 0.2 mL/min, the pressure was moderate, response was high, sensitivity was good, and the total peak time shortened to 6 min. After considering various factors, the final flow rate of 0.2 mL/min was chosen as the optimal condition. Furthermore, the influence of column temperature and injection volume on separation efficiency was investigated in the range of 20 °C–45 °C and 1 μL–5 μL, respectively. We found that the impact of column temperature and injection volume on chromatographic peaks was not significant, so the conventional 25 °C and 2 μL was selected for subsequent experiments.
3.2. Establishment of Mass Spectrometry Conditions
The OA standard solution was analyzed by single needle automatic injection, and the mass spectrum parameters were optimized in negative ion mode. Two fragment ions with the highest response and the least interference were selected as qualitative and quantitative ions, and the fragmentation voltage and collision energy were obtained.
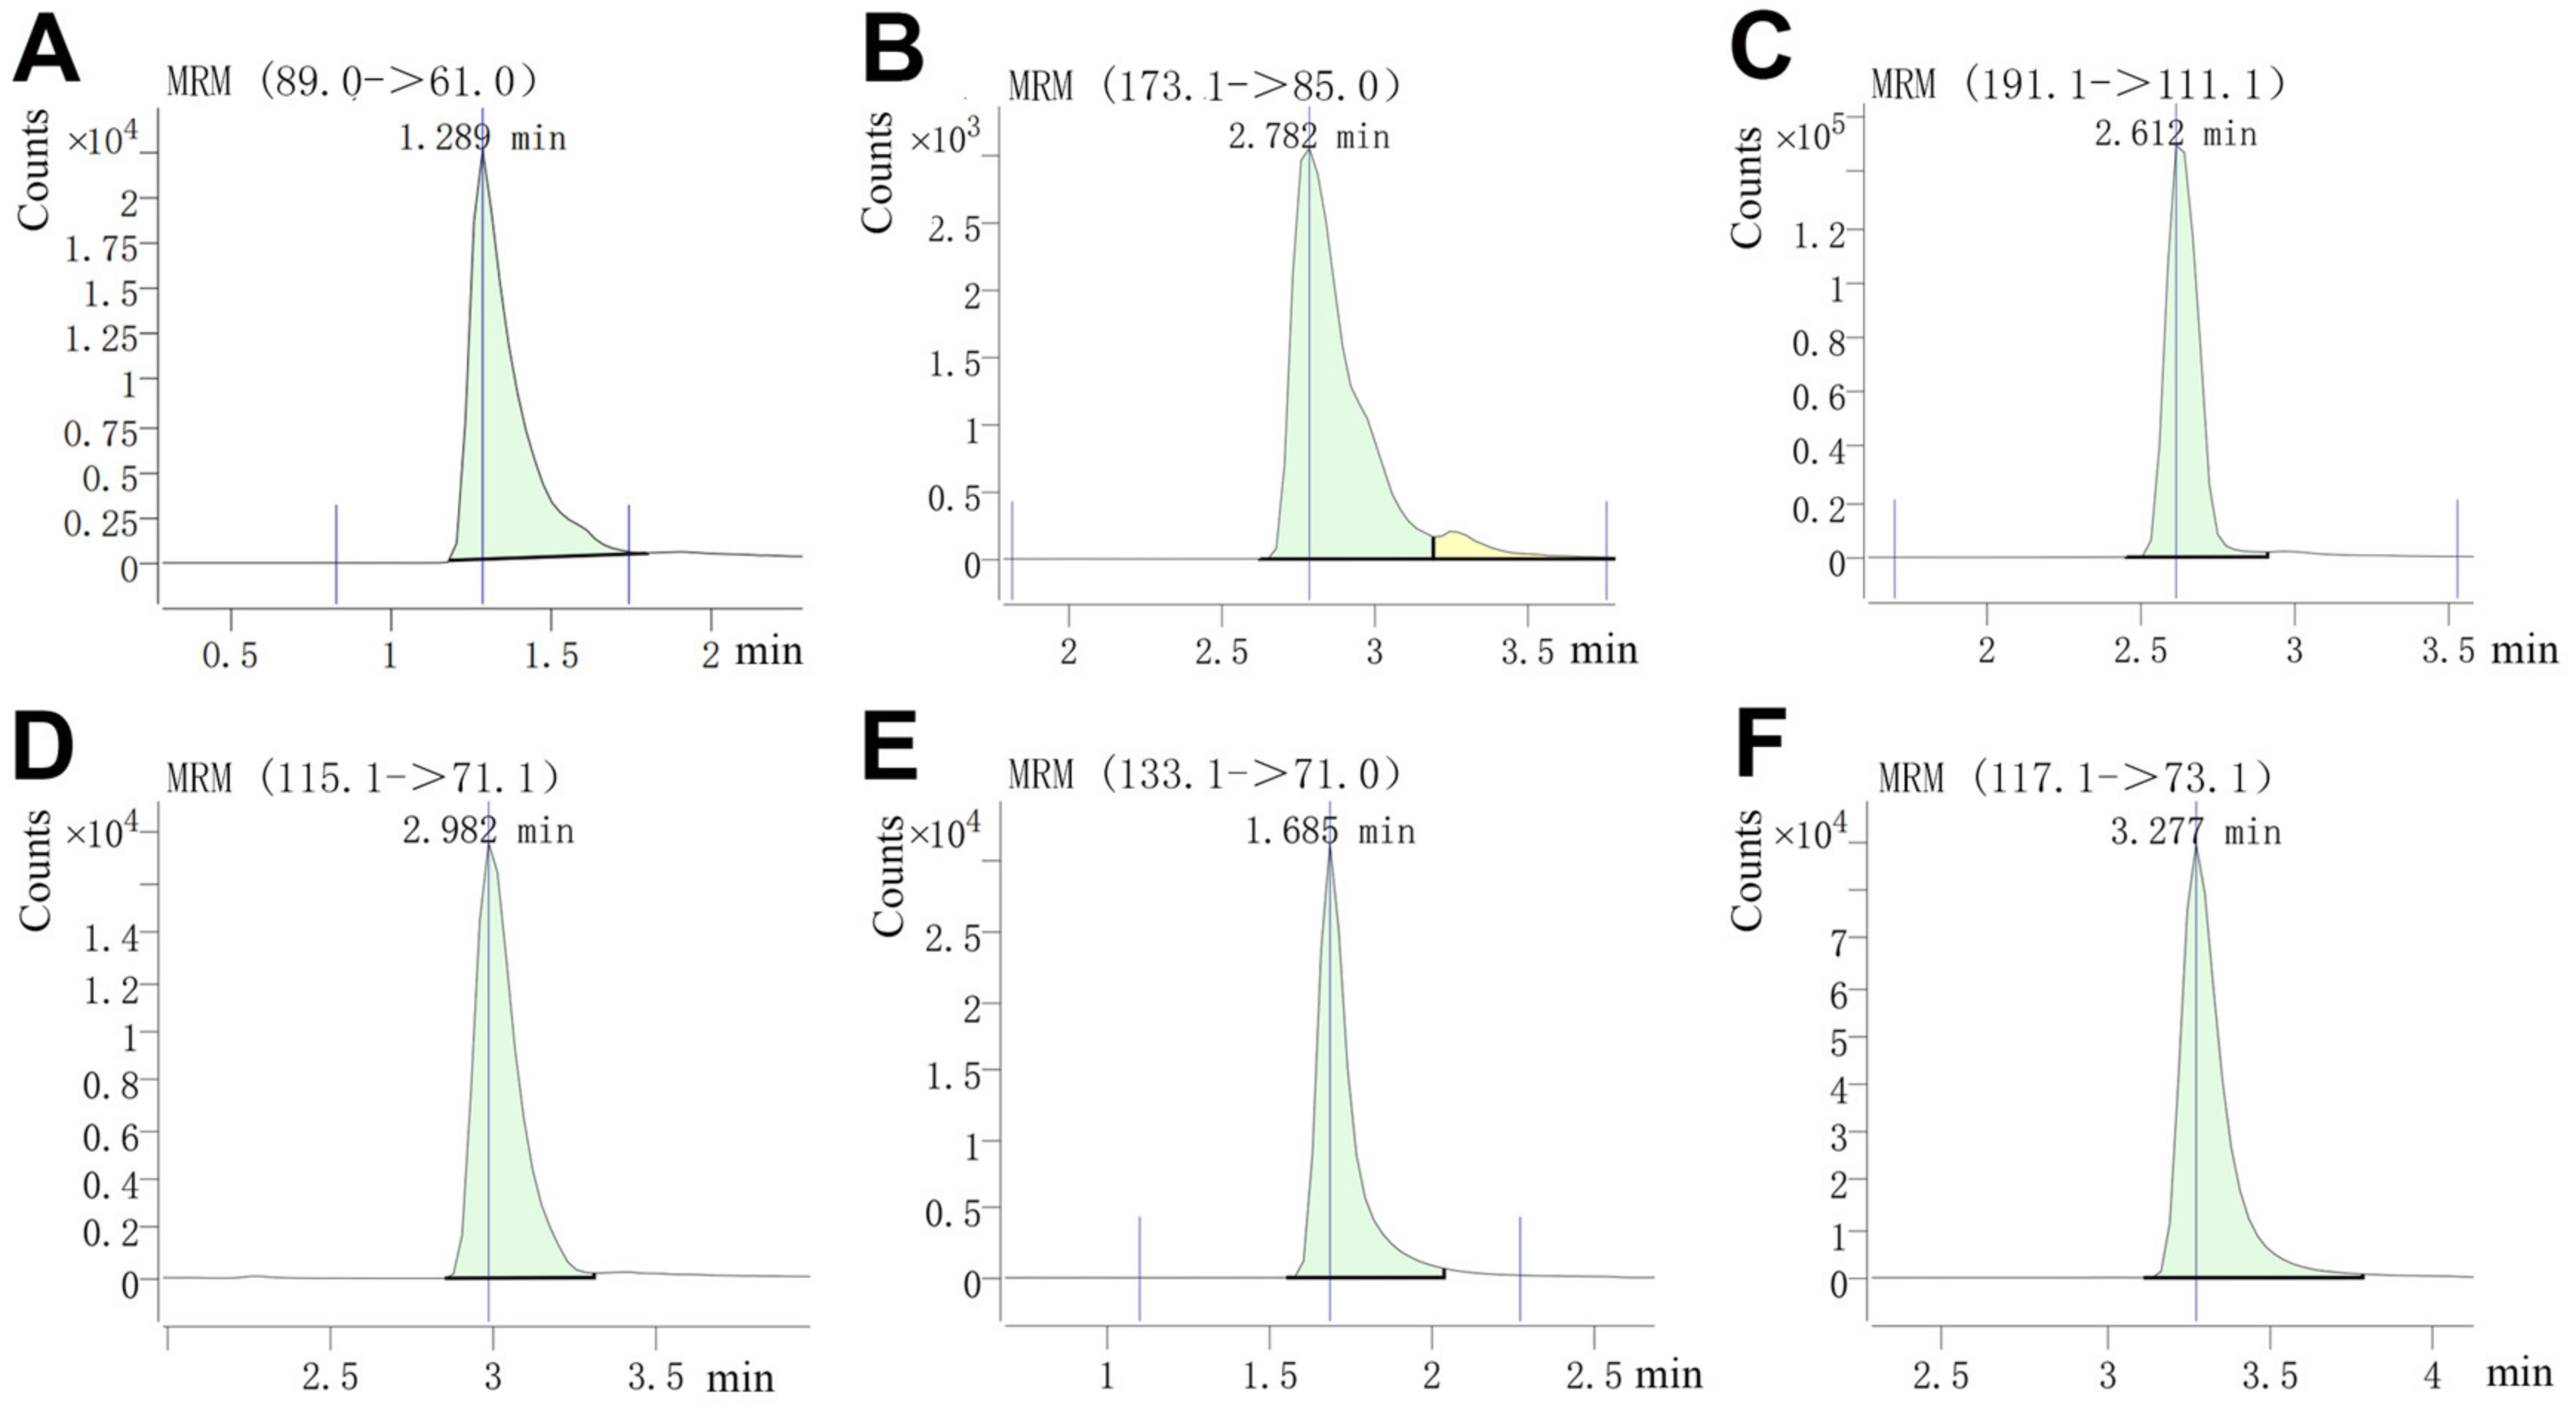
The optimal condition parameters are given in Table 3, and the ion spectra of six compounds’ MS products are shown in Figure 1. These results indicated that the quantitative analysis of six organic acids could be realized by using ESI- and the multi-reaction ion monitoring (MRM) mode of the electric spray ion source.
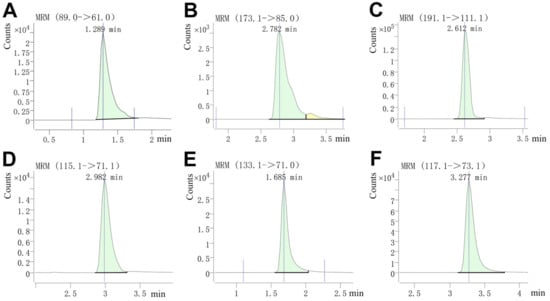
Figure 1.
The six compounds’ MS product ion spectra. (A) Oxalic acid, (B) cis-aconite acid, (C) citric acid, (D) fumaric acid, (E) malic acid, (F) succinic acid. The green area represents the area quantified by integration, and the yellow area is not integrated.
3.3. Linearity, Limit of Detection, and Limit of Quantification of the Established HPLC-QqQ-MS/MS Method
The method linearity was evaluated by diluting the mixed standard solution with water to obtain appropriate concentrations. Calibration curves for the six organic acids were constructed by plotting the peak areas versus the corresponding injection concentrations, as shown in Table 5. All target analytes exhibited good linear regression in the studied concentration range (R2 > 0.99). For each target component, the limit of detection (LLOD) and limit of quantification (LLOQ) were determined by successive dilution of the standard solution until the signal-to-noise (S/N) ratio of each compound was 3 and 10. As summarized in Table 5, the LLODs of the OAs (1)–(6) were 0.604 ng/mL, 0.138 ng/mL, 0.327 ng/mL, 0.398 ng/mL, 0.284 ng/mL, and 0.194 ng/mL, and the LLOQs were 1.872 ng/mL, 0.614 ng/mL, 0.819 ng/mL, 1.252 ng/mL, 0.724 ng/mL, and 0.408 ng/mL, indicating the high sensitivity of this method for the quantification of the six organic acids in P. ternata extract.
Table 5.
Linear equation, linear range, lower limit of detection (LLOD), and lower limit of quantitation (LLOQ) of six organic acids.
3.4. One-Variable-at-a-Time (OVAT) Experiment
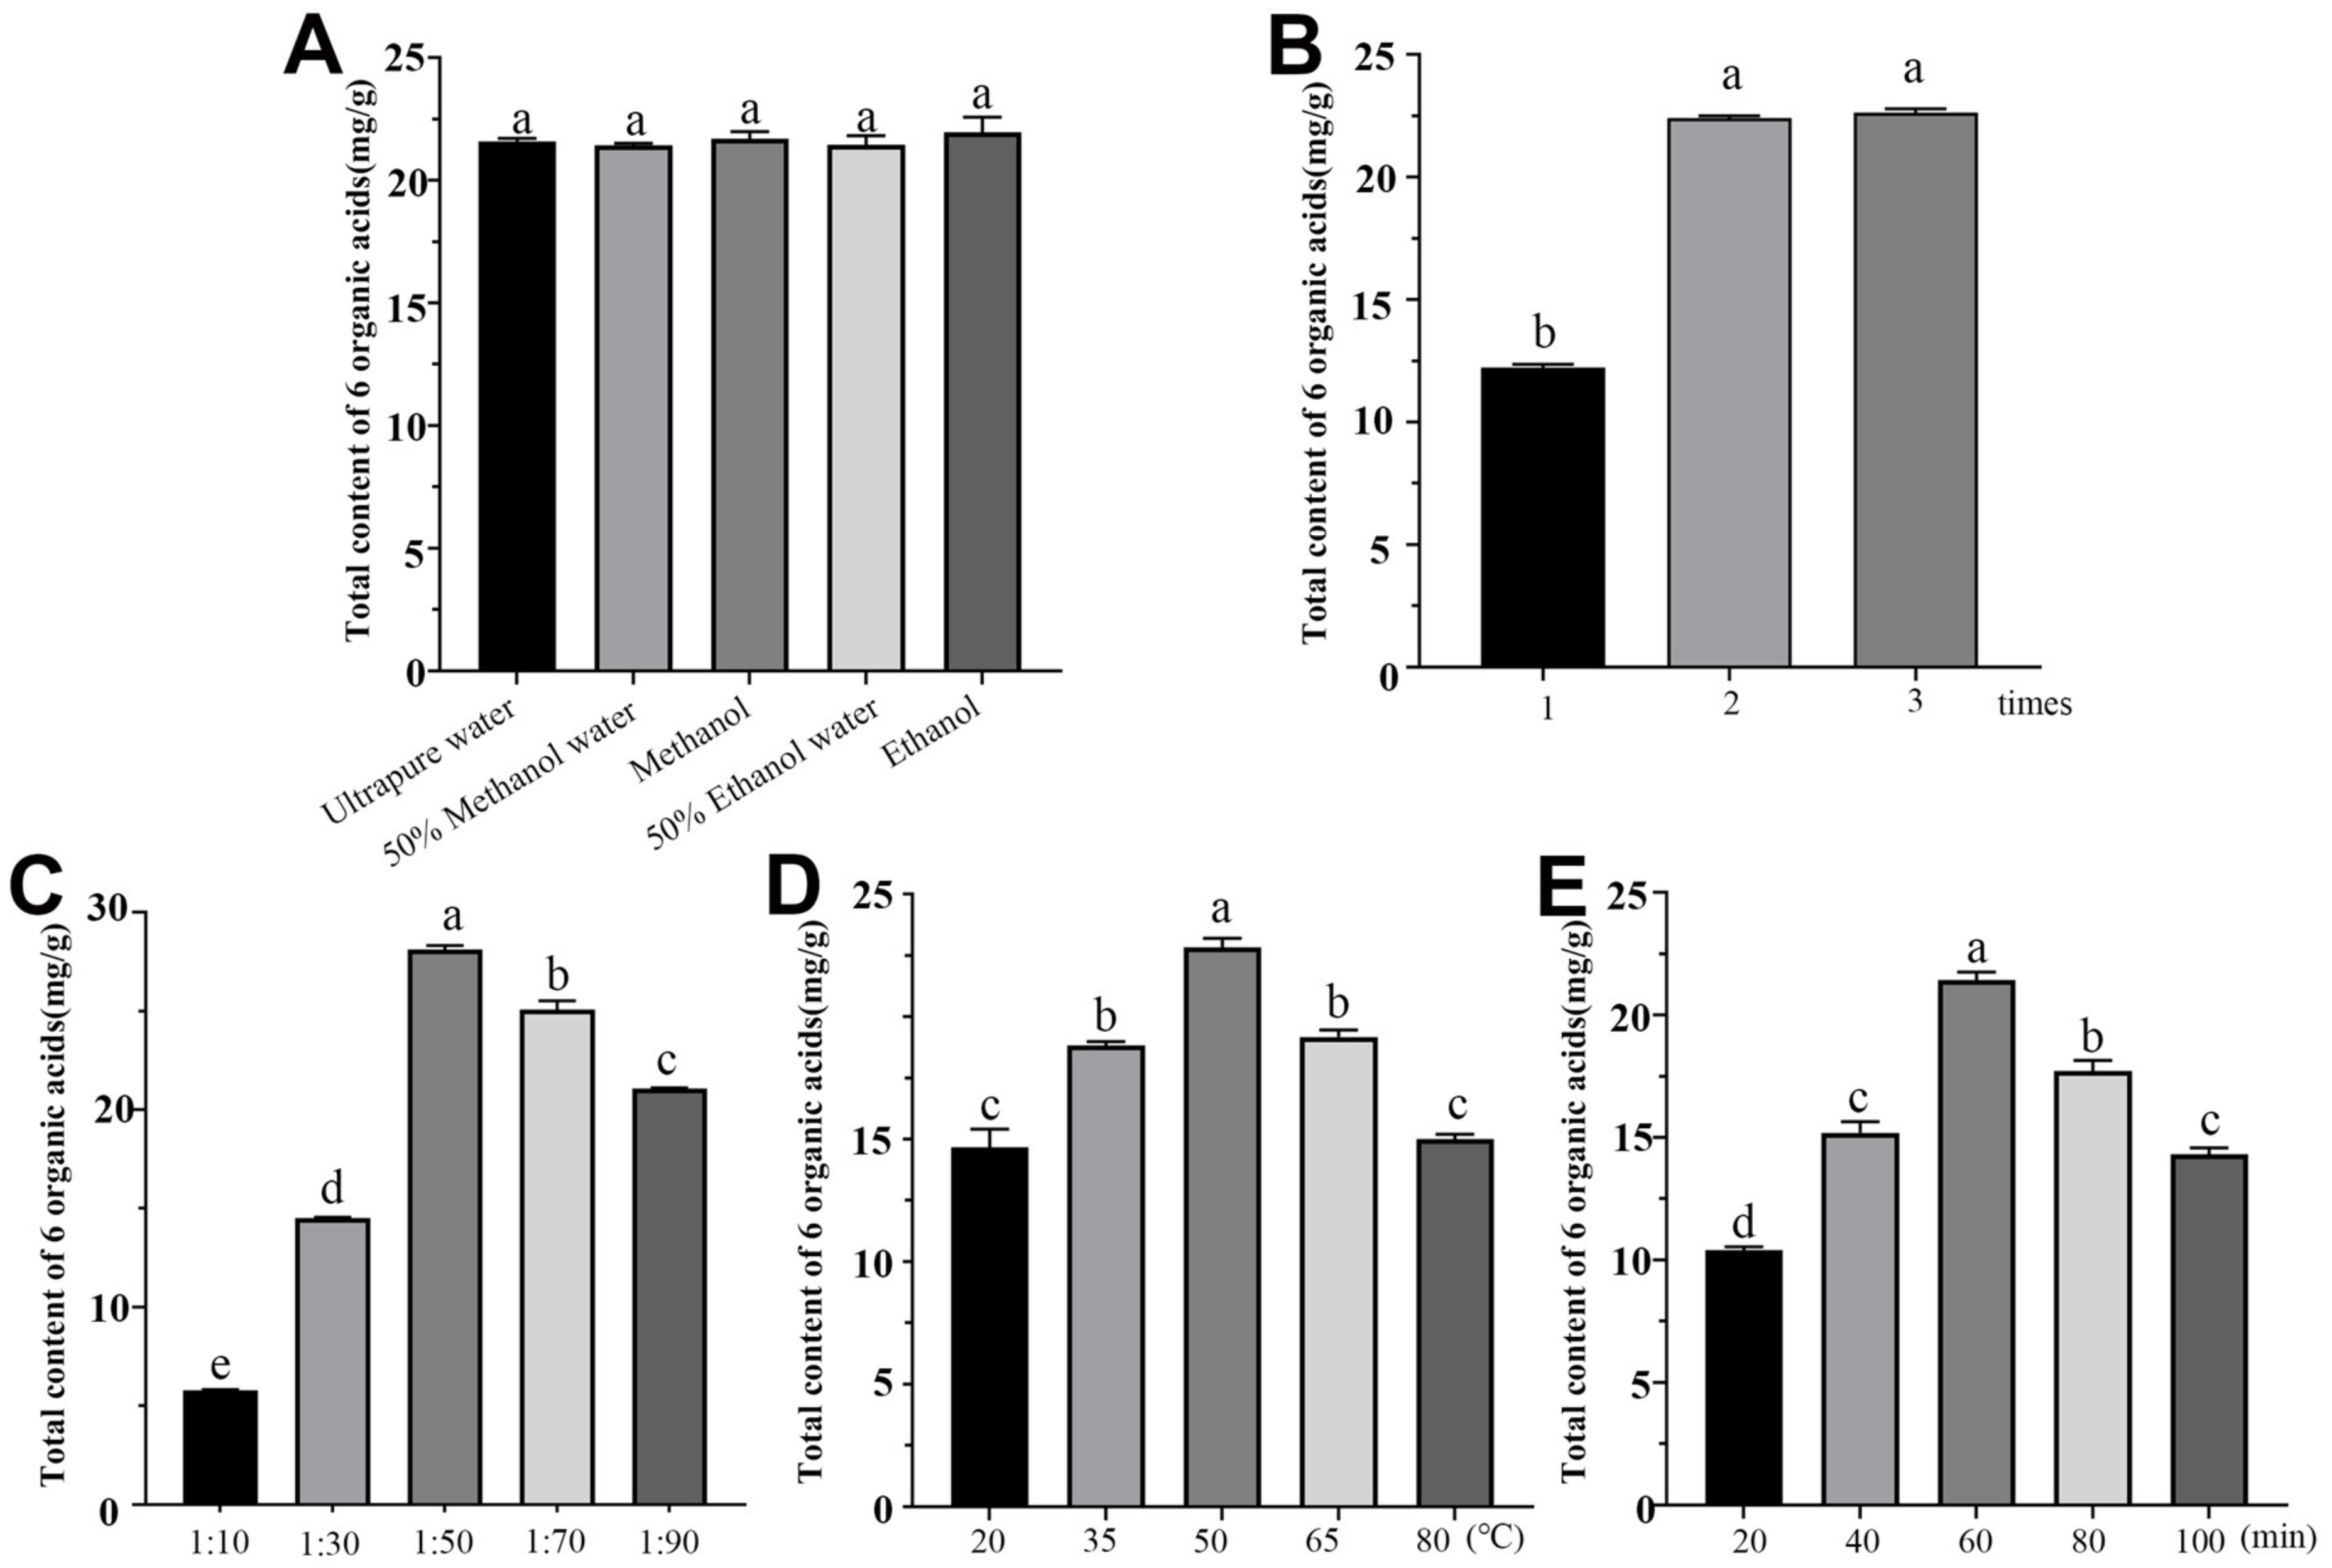
It is particularly important to establish a stable and high extraction rate sample pretreatment method for the detection of OAs in P. ternata. The effects of extraction solvent, extraction repetition, extraction temperature, extraction time, and solid–liquid ratio were analyzed via OVAT experiments to determine the most critical extraction factors and their ranges. Firstly, different extraction solvents of water, 50% and 100% methanol and 50% and 100% ethanol, were used for ultrasonic extraction. The results indicated no significant differences among different treatment groups on the six OAs’ yields (p > 0.05). Considering the feasibility of actual production, ultrapure water was preferred as the extraction solvent (Figure 2A). Secondly, after two ultrasonic repetitions, the content of the OAs tended to stabilize, indicating that the extraction was complete and that two extraction repetitions were preferred (Figure 2B). Then, the ratios of P. ternata to water were set to 1:10, 1:30, 1:50, 1:70, and 1:90 for ultrasonic extraction, which was performed twice to obtain the appropriate material liquid ratio. When the solvent was increased within a certain range, the extraction efficiency of the organic acids continued to increase, reaching a peak at 1:50 (Figure 2C). The effect of temperature on extraction efficiency was investigated in the range of 20 to 80 °C. The results indicated the organic acid content increased first and then decreased, highlighting the optimal extraction conditions at 50 °C for achieving the best extraction efficiency (Figure 2D).

Figure 2.
The total content of six organic acids was examined by a single factor. (A) Extraction solvent. (B) Extraction repetition. (C) Solid-liquid ratio. (D) Extraction temperature. (E) Extraction time. Treatments with the same letter are not significantly different from each other at an alpha level of 0.05 (LSD post hoc test).
In addition, the samples were extracted with water at 50 °C for 20, 35, 50, 65, and 80 min to screen for the optimal extraction time. The extraction efficiency was observed to peak at 60 min and subsequently showed a slight decrease, possibly attributed to the degradation of the extracted compounds resulting from prolonged extraction repetition (Figure 2E). Ultimately, except for the extraction solvent and extraction repetition, a 1:50 material–liquid ratio, ultrapure water, 50 °C, and 60 min were set as the center points of RSM to determine the optimum extraction conditions for further studies.
3.5. Response Surface Methodology Optimization
The RSM describing the relationship between different variables (solid–liquid ratio, ultrasonic time, and temperature) and response values was established to obtain the best extraction conditions. In the statistical analysis of RSM, 17 assays were performed with varied experimental conditions. The quadratic model’s expressions for the OA’s responses are presented as followed:
YOAs = 19.46 + 2.70A − 0.18B − 0.49C + 0.60AB − 0.14AC + 0.11BC − 3.58A2 − 3.92B2 − 2.30C2
To assess the significance of the fit of the second-order polynomial equation for the experimental data (Table S2), analysis of variance (ANOVA) was employed. The results revealed that the lack of fit was not statistically significant (p > 0.05), while the quadratic regression model was highly significant (p < 0.01). This indicates that the mathematical model used in this study is reliable for computing organic acid contents. The coefficient of variation (CV) was less than 10%, suggesting that the model exhibits good precision and reproducibility. Additionally, the coefficient of determination (R2) and the adjusted determination coefficient (Radj2) were calculated to be 0.9484 and 0.8821, respectively, indicating a high level of accuracy in the model.
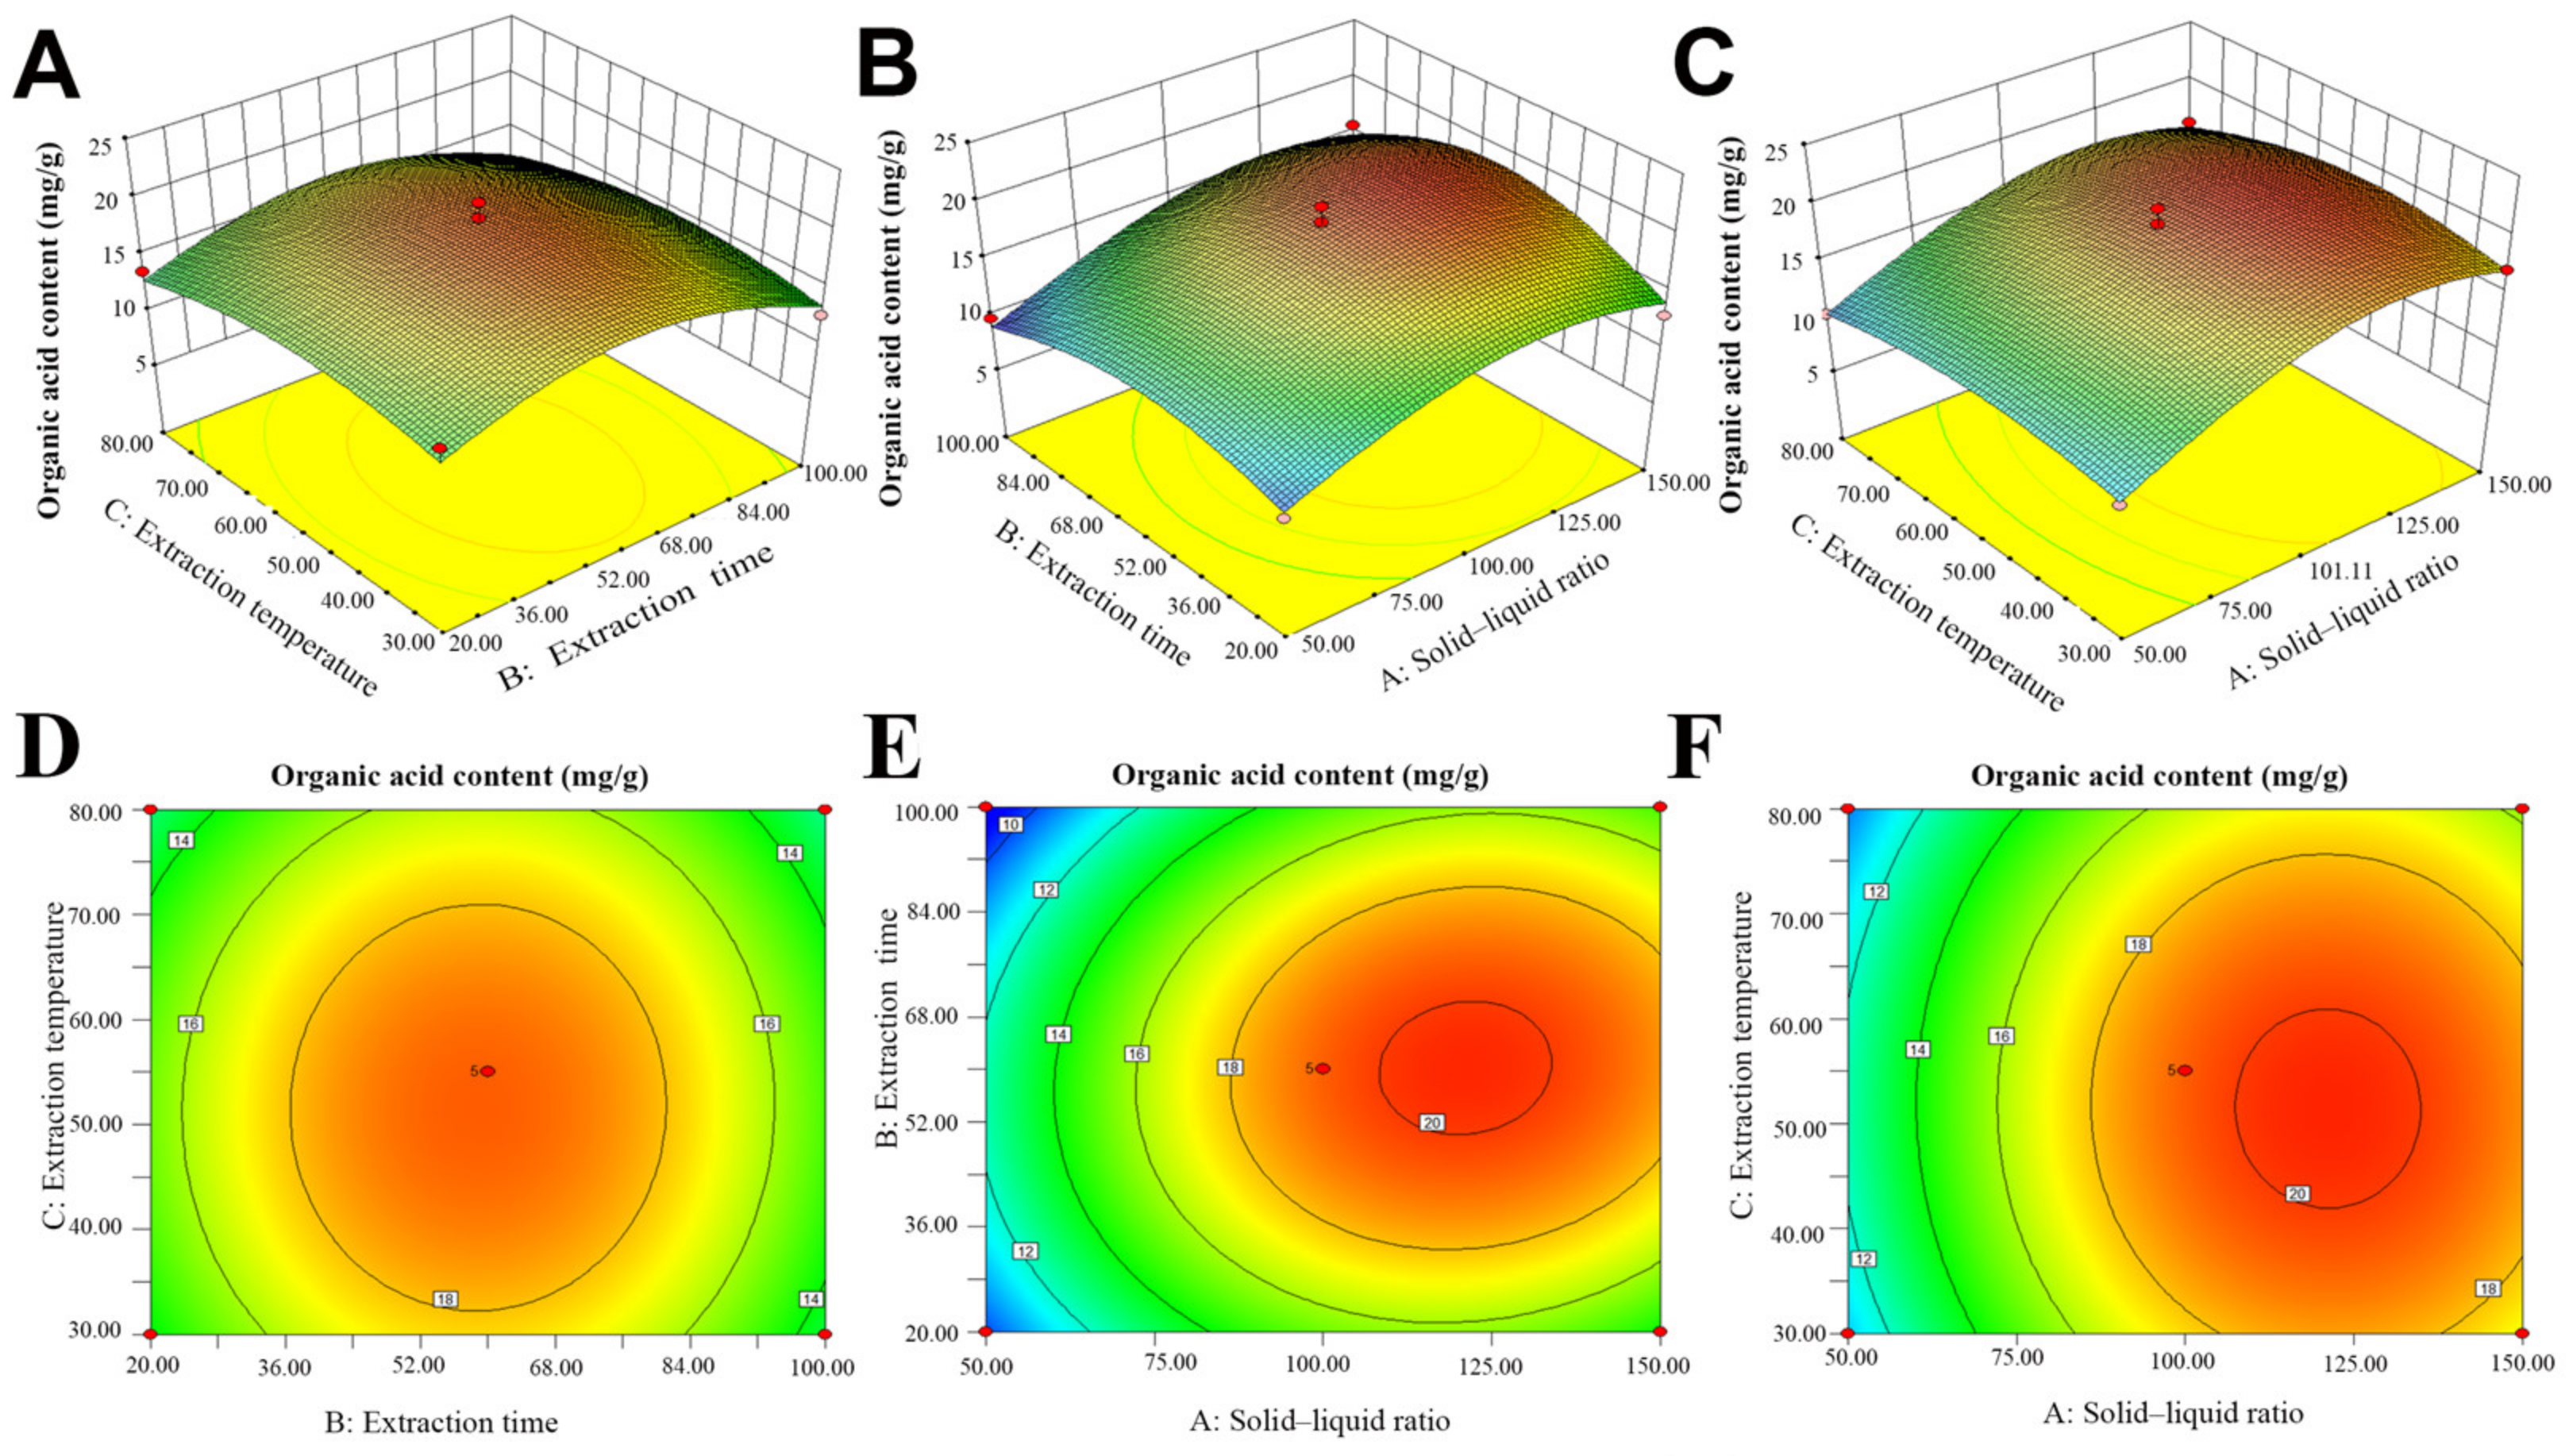
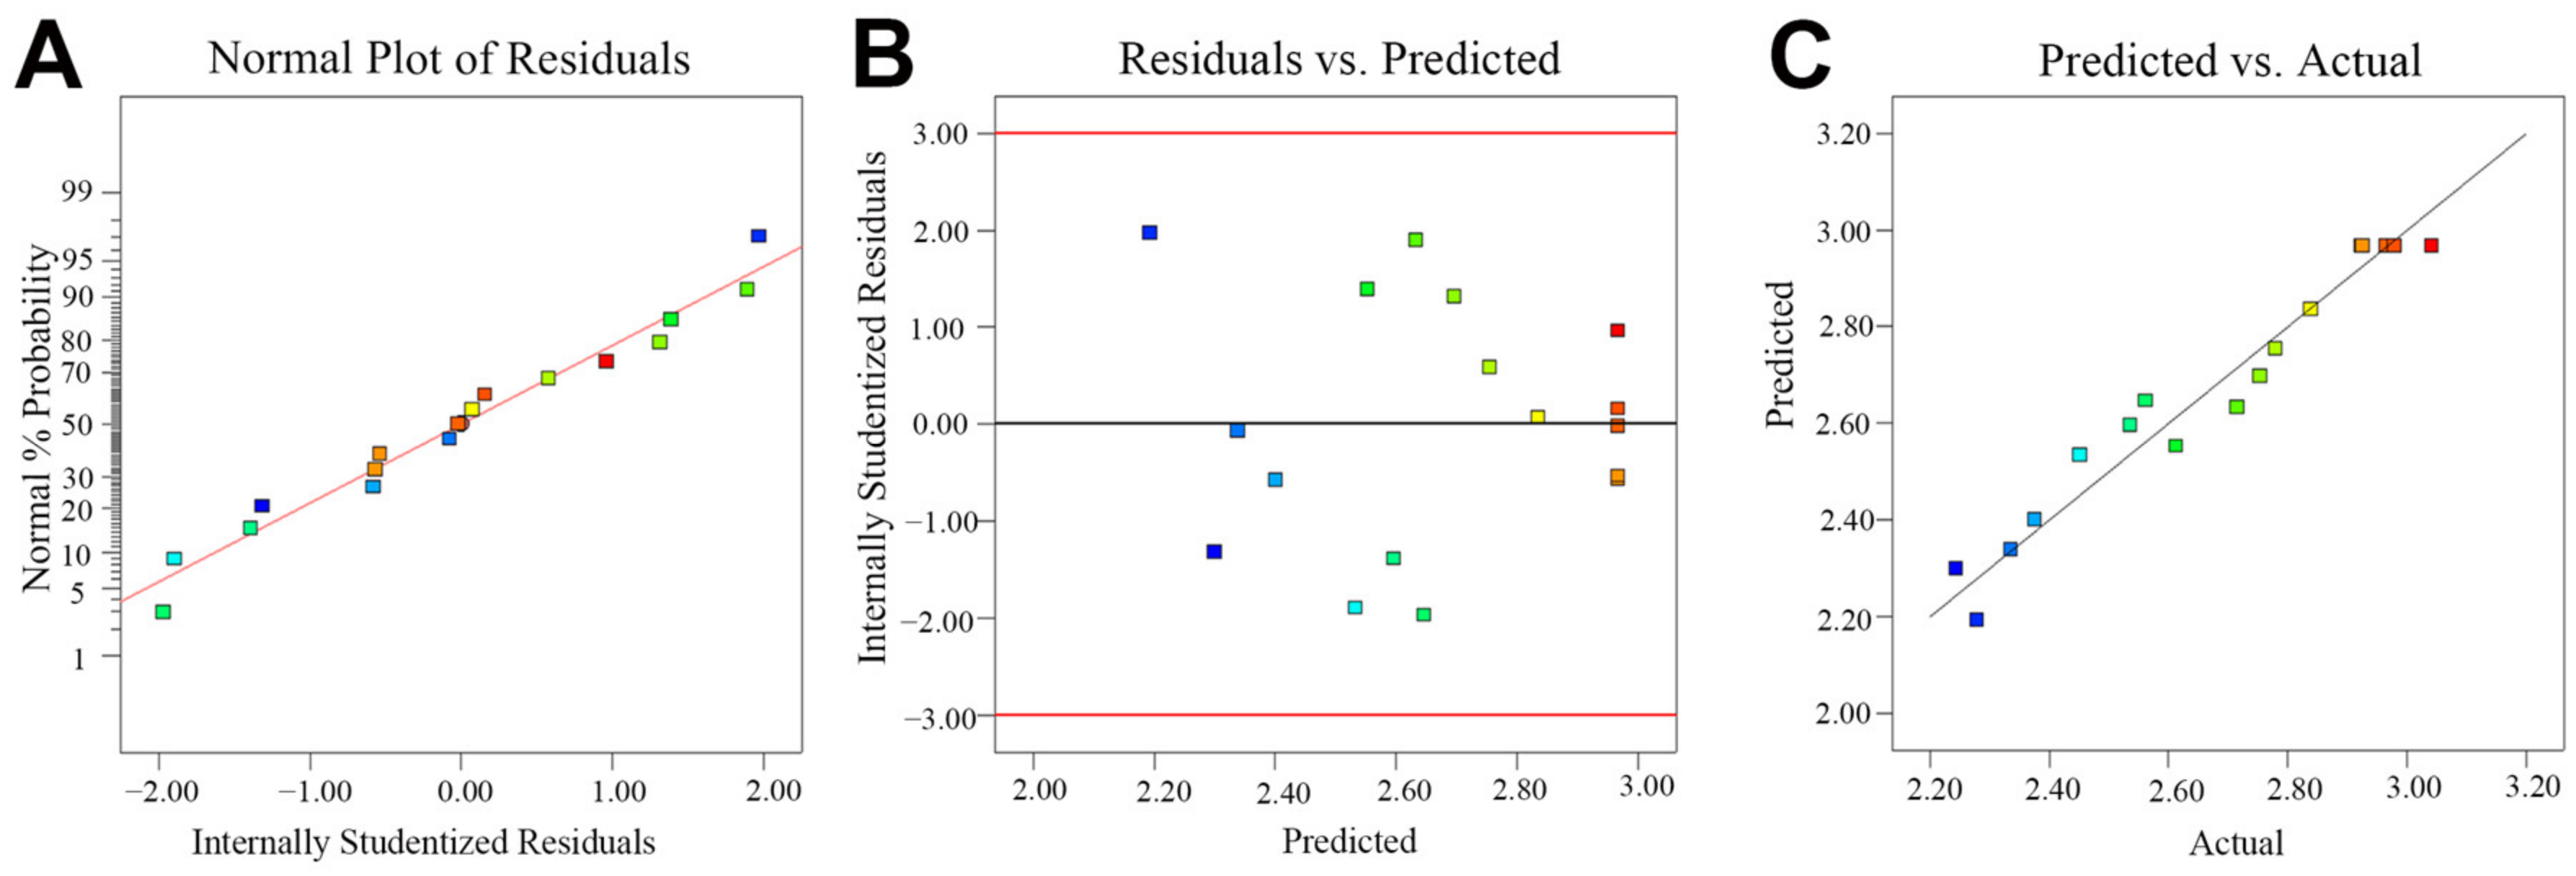
Further, Design-Expert V8.0.6.1 software was used for visualization, and the three-dimensional response surface plots and contour diagrams of the interactions between various factors were drawn according to the regression model of the yield of six organic acids in P. ternata (Figure 3). The normal probability distribution of the residual analysis results revealed that the datapoints are basically distributed on a straight line (Figure 4A); the distribution of the residual and predicted values is irregular (Figure 4B); and the predicted and actual values are distributed near a straight line (Figure 4C), signifying the high precision of the established response surface model. The three-dimensional contour map illustrates that the optimal extraction conditions were a solid–liquid ratio of 1:47.17, extraction time of 61.31 min, and temperature of 55.56 °C (Figure 3). Considering practical feasibility in industrial production, the process parameters were adjusted to a solid–liquid ratio of 1:50, an extraction time of 60 min, and a temperature of 55 °C. Under these revised conditions, the total content of the six organic acids in P. ternata was 21.11 mg/g (Table S3), surpassing the values obtained from 17 alternative operation schemes, affirming the optimality of the model screening conditions.
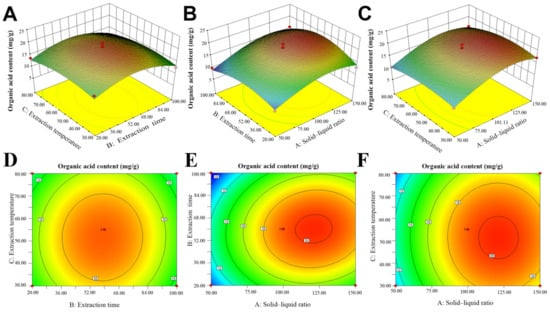
Figure 3.
Response surface plots of the combined effects of the factors and the response variable (total yield of six organic acids) in 3D and 2D. (A,D) Extraction temperature and extraction time. (B,E) Extraction time and solid–liquid ratio. (C,F) Extraction temperature and solid–liquid ratio. (A–F): The change from blue to red in the figure indicates that the extracted organic acid content goes from low to high. The red dots represent the positions of the surrounding and central points.
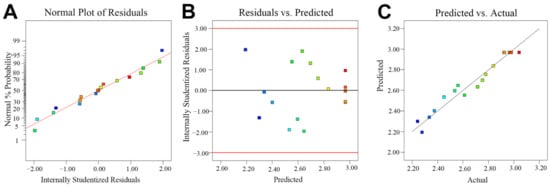
Figure 4.
RSM model with tested variables. (A) The normal probability distribution of the residual. (B) The distribution of the residual and predicted values. (C) The residual and predicted value. (A–C): Different colored squares in the figure represent the 17 runs in RSM.
3.6. Practical Application of the Optimized Method for Determining OA Content of P. ternata from Different Regions
The established method was used to detect P. ternata samples collected from 12 different regions. The results indicated variations in the organic acid (OA) contents in P. ternata among different regions and also within different varieties from the same region (Table 6). Sample 7 (collected in Tianmen) contained the highest amount of oxalic acid, reaching 1.58 mg/g. The citric acid content in P. ternata from Sample 7 and Sample 10 (collected in Huaihua) both exceeded 16 mg/g. Sample 1 (collected in Huangshan) contained the highest amount of malic acid, at 6.58 mg/g. Cis-aconite content in Sample 6 (collected in Qianjiang) and Sample 10 exceeded 0.84 mg/g. Succinic acid, specified as an indicator component in the 2015 edition of the Chinese Pharmacopoeia, had a content of 2.57 mg/g in Sample 5, significantly higher than in the other samples. Further analysis of the total organic acid contents revealed that the regions centered around Qianjiang, Shiyan, and Tianmen in Hubei Province, as well as the surrounding Hunan and Anhui provinces, had higher levels. As is well known, these areas are considered the daodi production area of P. ternata, and the produced medicinal material is known as “Jing Banxia” due to its good quality. This also confirms the accuracy of the detection method, providing additional evidence of its reliability. Further, our research results provide a theoretical foundation for understanding the influence of climate characteristics and environmental conditions in various regions on the formation of the quality of daodi medicinal materials.
Table 6.
The content of six organic acids in P. ternata from different regions (n = 3).
3.7. Precision, Reproducibility, Stability, and Recovery Rates of the Established Ultrasonic Extraction and HPLC-QqQ-MS/MS Methods
As summarized in Table 7, precision is expressed by the relative standard deviation (RSD). Under optimal conditions, the RSDs of the investigated components were less than 1.91%, which was evaluated by analyzing the mixed standard solution six times. The method repeatability and stability were established by analyzing multiple consecutive injections and 24-h interval injections, and the results showed that the RSDs for the investigated components were less than 2.41% and 2.82%, respectively. All compounds met the proposed requirement of RSD ≤ 5%. In addition, the average recovery rates of the six organic acids tested in P. ternata ranged from 97.75 to 107.14%, with RSDs ranging from 1.67% to 4.50%. Above all, these results indicated that the developed method is sensitive and reliable enough to monitor OAs in P. ternata.
Table 7.
Repeatability, precision, stability, and recovery rate of 6 organic acids by ultrasonic extraction and HPLC-QqQ-MS/MS (n = 6).
4. Discussion
At present, it is difficult for the detection methods for P. ternata to directly reflect the specific contents of its active components [23], especially organic acid contents. In this study, we introduced a new method for determining organic acids using HPLC-QqQ-MS/MS. Differing from the traditional potentiometric titration method employed for total organic acid determination [24], our method simultaneously and accurately measures six organic acids in P. ternata. Compared to the 40-min HPLC method [6], it significantly improved detection efficiency. It is a single-test, multi-evaluation method that’s quick and easy to use, offering substantial application value and potential for determining organic acid components in P. ternata.
The quantitative determination of active components is an effective means of quality control in traditional Chinese medicine, and the extraction of active components is a crucial prerequisite for quantitative analysis [25]. Among various extraction methods, ultrasonic-assisted extraction stands out as the preferred choice due to its simple operation, minimal time requirement, low solvent consumption, and high extraction yield [26]. The optimization of the ultrasonic extraction method for P. ternata organic acids encompassed considerations such as solvent selection, ultrasonic frequency, solid–liquid ratio, ultrasonic temperature, and ultrasonic time. Key factors influencing extraction efficiency were identified as the solid–liquid ratio, ultrasonic temperature, and ultrasonic time. Within a certain range, an increase in the solid–liquid ratio was found to enhance organic acid extraction. However, when the ratio exceeded 1:50, the organic acid yield began to decline (Figure 2C), possibly due to excessive solid–liquid ratio hindering ultrasound-induced cell damage, thereby reducing the degree of cell fragmentation [27]. Increasing the ultrasound temperature was observed to accelerate the dissolution rate of active ingredients, enhancing the extraction rate [28]. Nevertheless, when the ultrasonic temperature exceeded 50 °C, the extraction rate of organic acids from P. ternata decreased (Figure 2D), and studies have pointed out that excessive temperature can destroy structural components [29]. Similar to the ultrasonic time, a prolonged extraction time process can cause organic acids to come into contact with O2, leading to oxidation, polymerization, and other reactions, resulting in a decreased extraction rate [30].
The One-Variable-at-a-Time (OVAT) experiment was used to investigate the optimal range of different extraction conditions. However, this method overlooked the interaction between various factors, hindering a quantitative description of the parameters’ influence on the corresponding results and making it difficult to achieve the best outcome [31]. Based on the single-factor test, the RSM method was employed to design and optimize the extraction process of organic acids from P. ternata. In order of importance, the three factors affecting the total extraction rate of organic acids were the solid–liquid ratio (A) > ultrasonic temperature (C) > ultrasonic time (B). According to the vertex position of the 3D response surface, the optimal extraction process was identified as a solid–liquid ratio of 1:47.17, extraction time of 61.31 min, and temperature of 55.56 °C (Figure 3). Subsequent experiments verified that upon changing the extraction method, the extraction rate reached “21.11 mg/g”, which was higher than that of the other 17 experimental designs (Table S3), affirming the optimality of the model’s screening conditions. Moreover, the extraction method utilized in this study involved simple ultrasonic extraction, whereas other methods described in the literature [32,33,34,35] are more intricate. In our study, the use of ultrapure water as a solvent proved to be more cost-effective, economical, and environmentally friendly compared to the organic solvents mentioned in previous studies. Additionally, the HPLC-QqQ-MS/MS analysis utilized in our study was faster and less time consuming. Considering the extraction method, extraction cost, and analysis time, our study demonstrates significant superiority over methods described in previous studies. Consequently, a highly efficient ultrasonic-assisted extraction method for P. ternata organic acids was successfully established. The established extraction and analysis methods were applied for the quality evaluation of P. ternata resources from different production areas. This study revealed that in terms of the total content of the six organic acids of P. ternate, Huaihua City, Shiyan City, Huangshan City, Tianmen City, and Qianjiang City ranked as the top five among the 12 different producing areas. It is worth noting that the succinic acid content of P. ternata in Qianjiang City, Hubei Province, was as high as 2.57 mg/g, which is the highest among the 12 producing areas. Additionally, the P. ternata collected in Baoding City, Hebei Province, had the lowest total content of the following organic acids: malic, citric, fumaric, and succinic acids. This finding aligns with the reported good quality of the daodi-producing area [36], further validating the reliability of the method established in this study. Finally, the extraction and analysis methods were fully verified by analyzing the LLOD, LLOQ, linear relationship, precision, repeatability, stability, and sample recovery. As depicted in Table 5, the R2 values of the six organic acids were all higher than 0.99, indicating a strong linear relationship within a defined range. The RSD values of accuracy, repeatability, stability, and recovery rate were all below 5% (Table 6), demonstrating the accuracy, reliability, sensitivity, and reproducibility of our method. The method proved suitable for the determination of the six organic acids in P. ternata. In summary, this method is highly suitable for the extraction and detection of organic acid components in P. ternata and can be effectively applied in the quality evaluation of P. ternata.
5. Conclusions
In our study, an efficient approach was established and validated for quantifying six organic acids in P. ternata within a short separation time of 10 min by HPLC-QqQ-MS/MS. The method exhibited excellent linearity, sensitivity, and accuracy, accompanied by outstanding advantages such as its rapidity and efficiency. In addition, the ultrasonic-assisted extraction of organic acids was optimized by the response surface method with three variables and three levels. The results showed that the optimal extraction conditions were as follows: a solid–liquid ratio of 1:50, an extraction time of 60 min, and a temperature of 55 °C. The further determination of organic acids in P. ternata from different regions highlights the practical utility of this extraction and quantitative method in quality evaluations.
Supplementary Materials
The following supporting information can be downloaded at: https://www.mdpi.com/article/10.3390/chemosensors12030047/s1, Table S1. Detailed information of different Pinellia ternata samples; Table S2. The ANOVA test for the fitted quadratic polynomial model of predictive model; Table S3. The total organic acid content extracted under the 17 scheme conditions in RSM design and the optimized conditions.
Author Contributions
Software, Investigation, Data curation, Writing—original draft, L.W. and J.L.; Methodology, Writing—review and editing, Data curation, J.Z.; Resource, Investigation, Validation, K.Q. and M.W.; Investigation, Validation, T.N.; Methodology, Writing—review and editing, Visualization, Y.M., M.L. and S.F.; Conceptualization, Resources, Funding acquisition, Supervision, Project administration, Writing—review and editing, D.L. All authors have read and agreed to the published version of the manuscript.
Funding
This research was funded by Dahui Liu, and this work was supported by National Key Research and Development Program (2023YFC3503804), Major Science and Technology Research Projects of Hubei University of Chinese Medicine (2022ZZXZ001; 2023ZDXM008), and the Young Qihuang Scholars of the State Administration of Traditional Chinese Medicine.
Institutional Review Board Statement
Pinellia ternata was used in this study. It comes from the resource nursery of the Medicinal Botanical Garden of Hubei University of Chinese Medicine (Wuhan, City) and was identified as Pinellia ternata by Dahui Liu.
Informed Consent Statement
Not applicable.
Data Availability Statement
The original contributions presented in the study are included in the article/Supplementary Material, further inquiries can be directed to the corresponding author/s.
Conflicts of Interest
The authors declare no conflicts of interest.
References
- Peng, W.; Li, N.; Jiang, E.; Zhang, C.; Huang, Y.; Tan, L.; Chen, R.; Wu, C.; Huang, Q. A review of traditional and current processing methods used to decrease the toxicity of the rhizome of Pinellia ternata in traditional Chinese medicine. J. Ethnopharmacol. 2022, 299, 115696. [Google Scholar] [CrossRef]
- Chen, C.; Sun, Y.; Wang, Z.; Huang, Z.; Zou, Y.; Yang, F.; Hu, J.; Cheng, H.; Shen, C.; Wang, S. Pinellia genus: A systematic review of active ingredients, pharmacological effects and action mechanism, toxicological evaluation, and multi-omics application. Gene 2023, 870, 147426. [Google Scholar] [CrossRef]
- Yang, L.; Gao, H.; Luo, W.; He, D. Research progress and prospect of Pinellia ternata. Anhui Agric. Sci. Bull. 2023, 02, 33–38. [Google Scholar]
- Yang, B.Y.; Lin, M.; Wu, F.M.; Xia, Q.; Zhou, H.; Liang, P. Methodological study on quality evaluation of crude and processed Pinelliae Rhizoma based on antitussive bioassay. Chin. Tradit. Herb. Drugs 2015, 46, 2586–2592. [Google Scholar]
- Yang, B.Y.; Lin, M.; Ren, M.; Zhao, C.Y.; Wei, H.; Peng, L. Spectrum-effect relationship of antitussive effect by total organic acids in crude and four processed Pinellia ternata based on gray relative analysis method. Chin. Tradit. Herb. Drugs 2016, 47, 2301–2307. [Google Scholar]
- Wen, Q.; Zhang, Y.; Zhang, J.; Zhao, H. Simultaneous determination of 6 organic acids, 3 nucleosides, and ephedrine in Pinellia ternata by HPLC. J. Chin. Pharm. Sci. 2016, 25, 906–913. [Google Scholar]
- Lee, J.Y.; Park, N.H.; Lee, W.; Kim, E.H.; Jin, Y.H.; Seo, E.K.; Hong, J. Comprehensive chemical profiling of Pinellia species tuber and processed Pinellia tuber by gas chromatography–mass spectrometry and liquid chromatography–atmospheric pressure chemical ionization–tandem mass spectrometry. J. Chromatogr. A 2016, 1471, 164–177. [Google Scholar] [CrossRef]
- Uclés, S.; Lozano, A.; Sosa, A.; Vázquez, P.P.; Valverde, A.; Fernández-Alba, A.R. Matrix interference evaluation employing GC and LC coupled to triple quadrupole tandem mass spectrometry. Talanta 2017, 174, 72–81. [Google Scholar] [CrossRef]
- Dong, M.Y.; Wang, Y.L.; Tang, H.R.; Huang, Q.X.; Lei, H.H. Quantitative analysis of 10 classes of phospholipids by ultrahigh-performance liquid chromatography tandem triple-quadrupole mass spectrometry. Analyst 2019, 144, 3980–3987. [Google Scholar]
- Ji, W.; Xu, P.; Yin, J.; Chen, J. Effect of extraction methods on the chemical components and taste quality of green tea extract. Food Chem. 2018, 248, 146–154. [Google Scholar]
- Díaz-de-Cerio, E.; Tylewicz, U.; Verardo, V.; Fernández-Gutiérrez, A.; Segura-Carretero, A.; Romani, S. Design of sonotrode ultrasound-assisted extraction of phenolic compounds from Psidium guajava L. leaves. Food Anal. Method 2017, 10, 2781–2791. [Google Scholar] [CrossRef]
- Seo, S.; Kim, K. Antioxidant activities of Aster glehni extracted with different solvent. Iran. J. Public Health 2019, 48, 176–178. [Google Scholar] [CrossRef]
- Yu, J.; Wang, C.; Li, J.; Zhang, C.; Li, G. Rectification extraction of Chinese herbs’ volatile oils and comparison with conventional steam distillation. Sep. Purif. Technol. 2010, 77, 261–268. [Google Scholar]
- Fernando, G.S.N.; Wood, K.; Papaioannou, E.H.; Marshall, L.J.; Sergeeva, N.N.; Boesch, C. Application of an Ultrasound-Assisted Extraction Method to Recover Betalains and Polyphenols from Red Beetroot Waste. ACS Sustain. Chem. Eng. 2021, 9, 8736–8747. [Google Scholar] [CrossRef]
- Fernandes, J.B.; Palma, M.; Nebo, L.; Varela, R.M. Microwave-Assisted Extraction of Ricinine from Ricinus communis Leaves. Antioxidants 2019, 8, 438. [Google Scholar]
- Atwi-Ghaddar, S.; Lesellier, E.; Destandau, E. Optimization of supercritical fluid extraction of polar flavonoids from Robinia pseudoacacia L. heartwood. J. CO2 Util. 2023, 20, 102440. [Google Scholar] [CrossRef]
- Liu, H.; Yan, Y.; Wang, X.; Liu, X.; Qin, G. Emulsifying and structural properties of polysaccharides extracted from Chinese yam by an enzyme-assisted method. LWT 2019, 111, 242–251. [Google Scholar] [CrossRef]
- Belokurov, S.S.; Narkevich, I.A.; Flisyuk, E.V.; Kaukhova, I.E.; Aroyan, M.V. Modern extraction methods for medicinal plant raw material. Pharm. Chem. J. 2019, 53, 559–563. [Google Scholar] [CrossRef]
- Zhi, W.W.; Wei, T.C.; Jen, Y.W.; Long, W.H.; Lin, C.C.; Der, C.J.; Kuang, L.M.; Tung, L.W. Comparative study on the physicochemical and functional properties of the mucilage in the carpel of Nymphaea odorata using ultrasonic and classical heating extractions. Int. J. Biol. Macromol. 2018, 117, 1367–1373. [Google Scholar] [CrossRef] [PubMed]
- Zakaria, F.; Tan, J.K.; Faudzi, S.M.M.; Rahman, M.B.A.; Ashari, S.E. Ultrasound-assisted extraction conditions optimisation using response surface methodology from Mitragyna speciosa (Korth.) Havil leaves. Ultrason. Sonochem. 2021, 81, 105851. [Google Scholar] [CrossRef] [PubMed]
- Bezerra, M.A.; Santelli, R.E.; Oliveira, E.P.; Villar, L.S.; Escaleira, L.A. Response surface methodology (RSM) as a tool for optimization in analytical chemistry. Talanta 2008, 76, 965–977. [Google Scholar] [CrossRef] [PubMed]
- Stachniuk, A.; Szmagara, A.; Czeczko, R.; Fornal, E. Determination of six kinds on organic in fruits and vegetables by LC-MS method. Food Sci. Technol. 2016, 41, 275–279. [Google Scholar]
- Li, D.M.; Zhang, S.W.; Gao, X.N.; Sun, J.Y.; Li, Y.J.; Li, W.P. Research progress on main chemical constituents and detection methods of Pinellia ternata. Sci. Tech. Informat. Gansu 2023, 52, 37–41. [Google Scholar]
- Zhang, Y.Q.; Yi, X.H.; Yan, G.M.; Yuan, J.L. Determination of total organic acids in different Pinellia ternata by potentiometric titration. Jiangxi J. Tradit. Chin. Med. 2019, 50, 64–65. [Google Scholar]
- Fu, S.; Zhang, J.; Li, T.; Wang, S.; Ding, W.; Zhao, M.; Du, Y.F.; Wang, Q.; Jia, J. Multi-responses extraction optimization based on response surface methodology combined with polarity switching HPLC–MS/MS for the simultaneous quantitation of 11 compounds in Cortex Fraxini: Application to four species of Cortex Fraxini and its 3 confusable species. J. Pharmaceut Biomed. 2014, 91, 210–221. [Google Scholar]
- Daneshvand, B.; Ara, K.M.; Raofie, F. Comparison of supercritical fluid extraction and ultrasound-assisted extraction of fatty acids from quince (Cydonia oblonga Miller) seed using response surface methodology and central composite design. J. Chromatogr. A 2012, 1252, 1–7. [Google Scholar] [CrossRef] [PubMed]
- Dong, H.M.; Li, S.Q.; Niu, X.Y.; Shen, L.W.; Li, L.; Qin, W. Optimizing ultrasonic extraction of polysaccharides from Chuanminshen violaceum based on orthogonal experiments design. Sci. Technol. Food Indust. 2014, 35, 306–309,322. [Google Scholar]
- Liu, Y.; Guo, Y.Y.; Xu, Y.L.; Zhang, Z.F.; Wei, Y.; Feng, S.X.; Yan, Z.G. Optimization in ultrasonic extraction process of rubusoside by response surface methodology. Chem. Bioeng. 2023, 40, 34–38,63. [Google Scholar]
- Wu, S.Z.; Wang, C.; Gui, S.Y.; Peng, C.; Luo, J.P.; Li, Q.M. Optimization of vacuum-coupled uitrasonic extraction process for Ganderma lucidum triterpenoids and their anti-parkinsonian activity. Chin. Tradit. Pat. Med. 2023, 45, 2822–2827. [Google Scholar]
- Zhang, D.; Jiang, X. Extraction and antibacterial activity of Fructus mume organic acids. Chin. J. Bioprocess. Eng. 2018, 16, 47–52. [Google Scholar]
- Hatambeygi, N.; Abedi, G.; Talebi, M. Method development and validation for optimised separation of salicylic, acetyl salicylic and ascorbic acid in pharmaceutical formulations by hydrophilic interaction chromatography and response surface methodology. J. Chromatogr. A 2011, 1218, 5995–6003. [Google Scholar] [CrossRef]
- Sun, L.M.; Zhang, B.; Wang, Y.C.; He, H.K.; Chen, X.G.; Wang, S.J. Metabolomic analysis of raw Pinelliae Rhizoma and its alum-processed products via UPLC–MS and their cytotoxicity. Biomed. Chromatogr. 2019, 33, e4411. [Google Scholar] [CrossRef]
- Lv, L.L.; Huang, W.; Huang, Y.Y.; Wang, L.; Sun, R. Experimental Research on Influences on the Content of Toxical Substances and Acute Toxicity of Different Producing Areas’ Rhizoma pinelliae. Chin. J. Pharmacovigil. 2010, 7, 649. [Google Scholar]
- Lai, Y.Y.; Jing, Y.; Li, H.Y.; Liu, J.L.; Li, M. A study on the effect of sodium metabisulfite on the quality of Pinelliae Rhizoma. Chin. Tradit. Pat. Med. 2020, 42, 965–968. [Google Scholar]
- Liao, F.J.; Liu, Y.Y.; He, H.; Chen, L.; Chen, H.P.; Wang, F.; Hu, Y.; Liu, Y.P. Comparison on chemical constituents and irritant toxicity of Banxia of different diameters. Pharmacol. Clin. Chin. Mater. Medica 2023, 39, 88–95. [Google Scholar]
- Jing, Y.; Lai, Y.; Chen, H.; Li, M.; Zhou, J.; Lan, Z. Study on the identification of Pinelliae Rhizoma and Pinelliae pedatisectae rhizoma based on the characteristic component triglochinic acid. RSC Adv. 2019, 9, 11774–11780. [Google Scholar] [CrossRef]


Disclaimer/Publisher’s Note: The statements, opinions and data contained in all publications are solely those of the individual author(s) and contributor(s) and not of MDPI and/or the editor(s). MDPI and/or the editor(s) disclaim responsibility for any injury to people or property resulting from any ideas, methods, instructions or products referred to in the content. |
© 2024 by the authors. Licensee MDPI, Basel, Switzerland. This article is an open access article distributed under the terms and conditions of the Creative Commons Attribution (CC BY) license (https://creativecommons.org/licenses/by/4.0/).