Identification of the Beverage Sotol Adulterated with Ethylene Glycol Using UV-Vis Spectroscopy and Artificial Neural Networks

 ,
,  ,
, 
Abstract
:1. Introduction
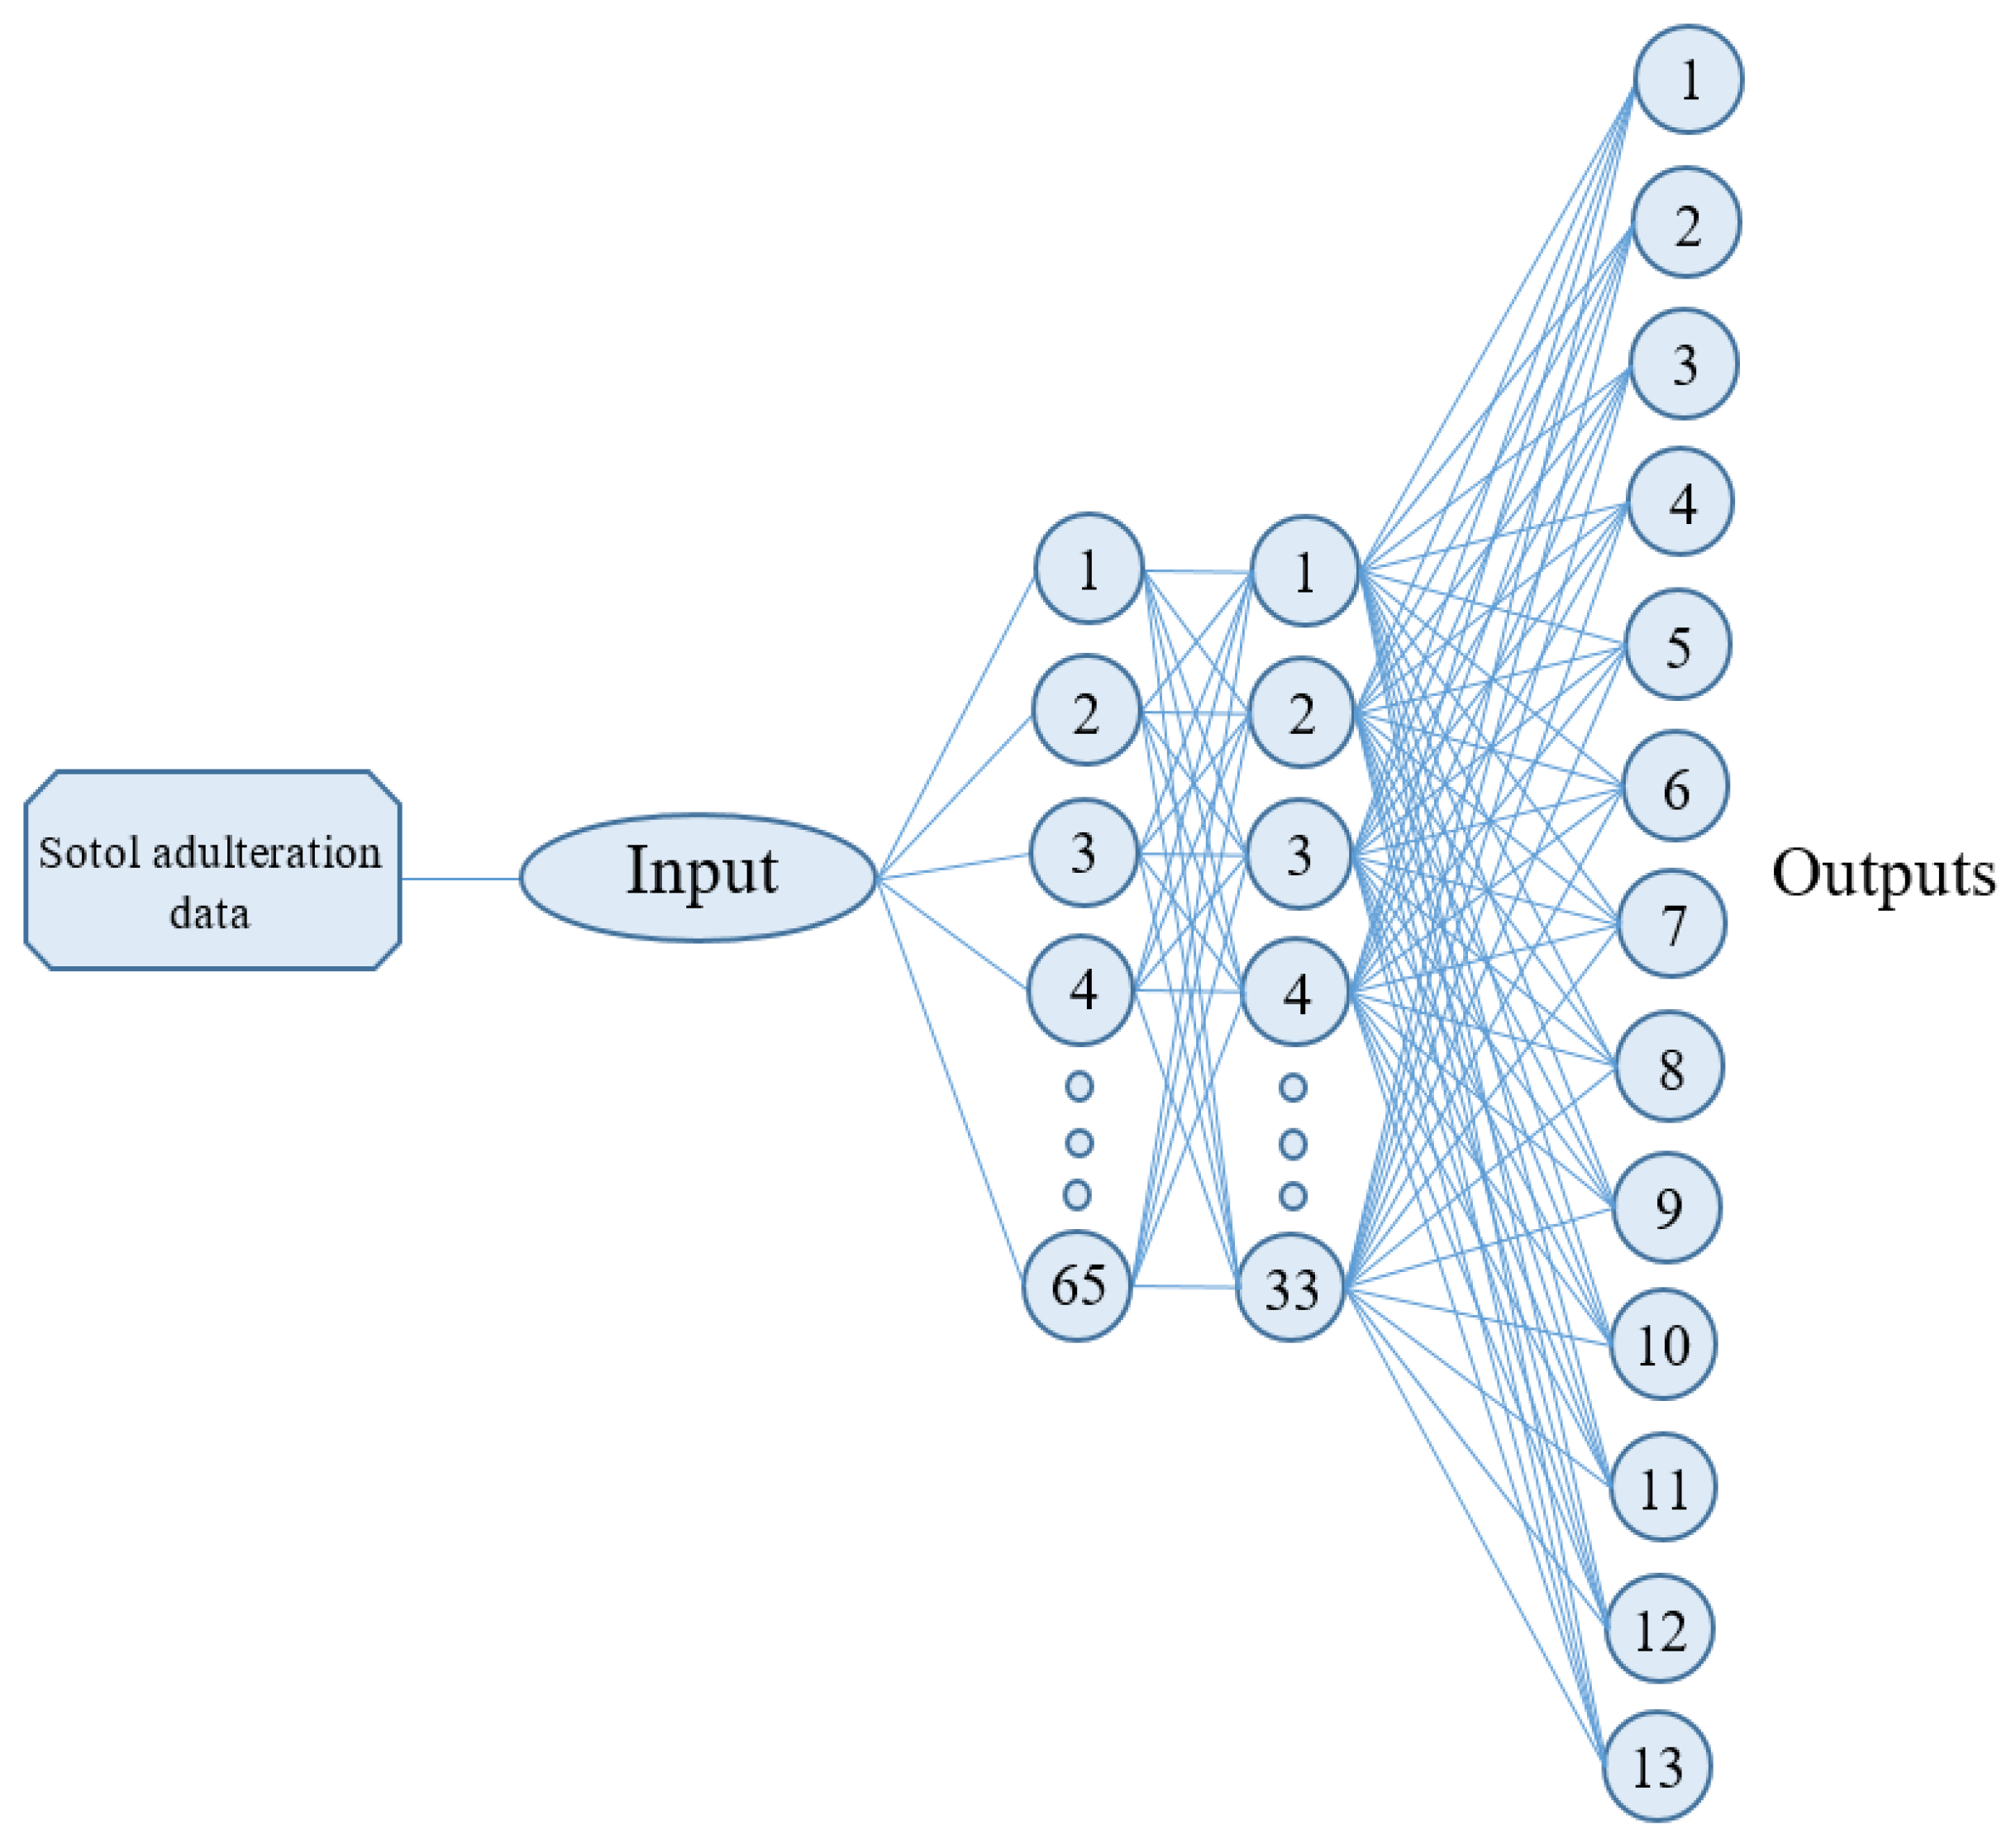
Multilayer Artificial Neural Networks
- A set of inputs xi = x1, x2, x3, …, xn.
- The synaptic weights wi = w1, w2, w3, …, wn corresponding to each input.
- An aggregation function, ∑.
- An activation function .
- An output.
2. Materials and Methods
2.1. UV-Vis Spectroscopy and the Artificial Neural Network: The Proposed Method
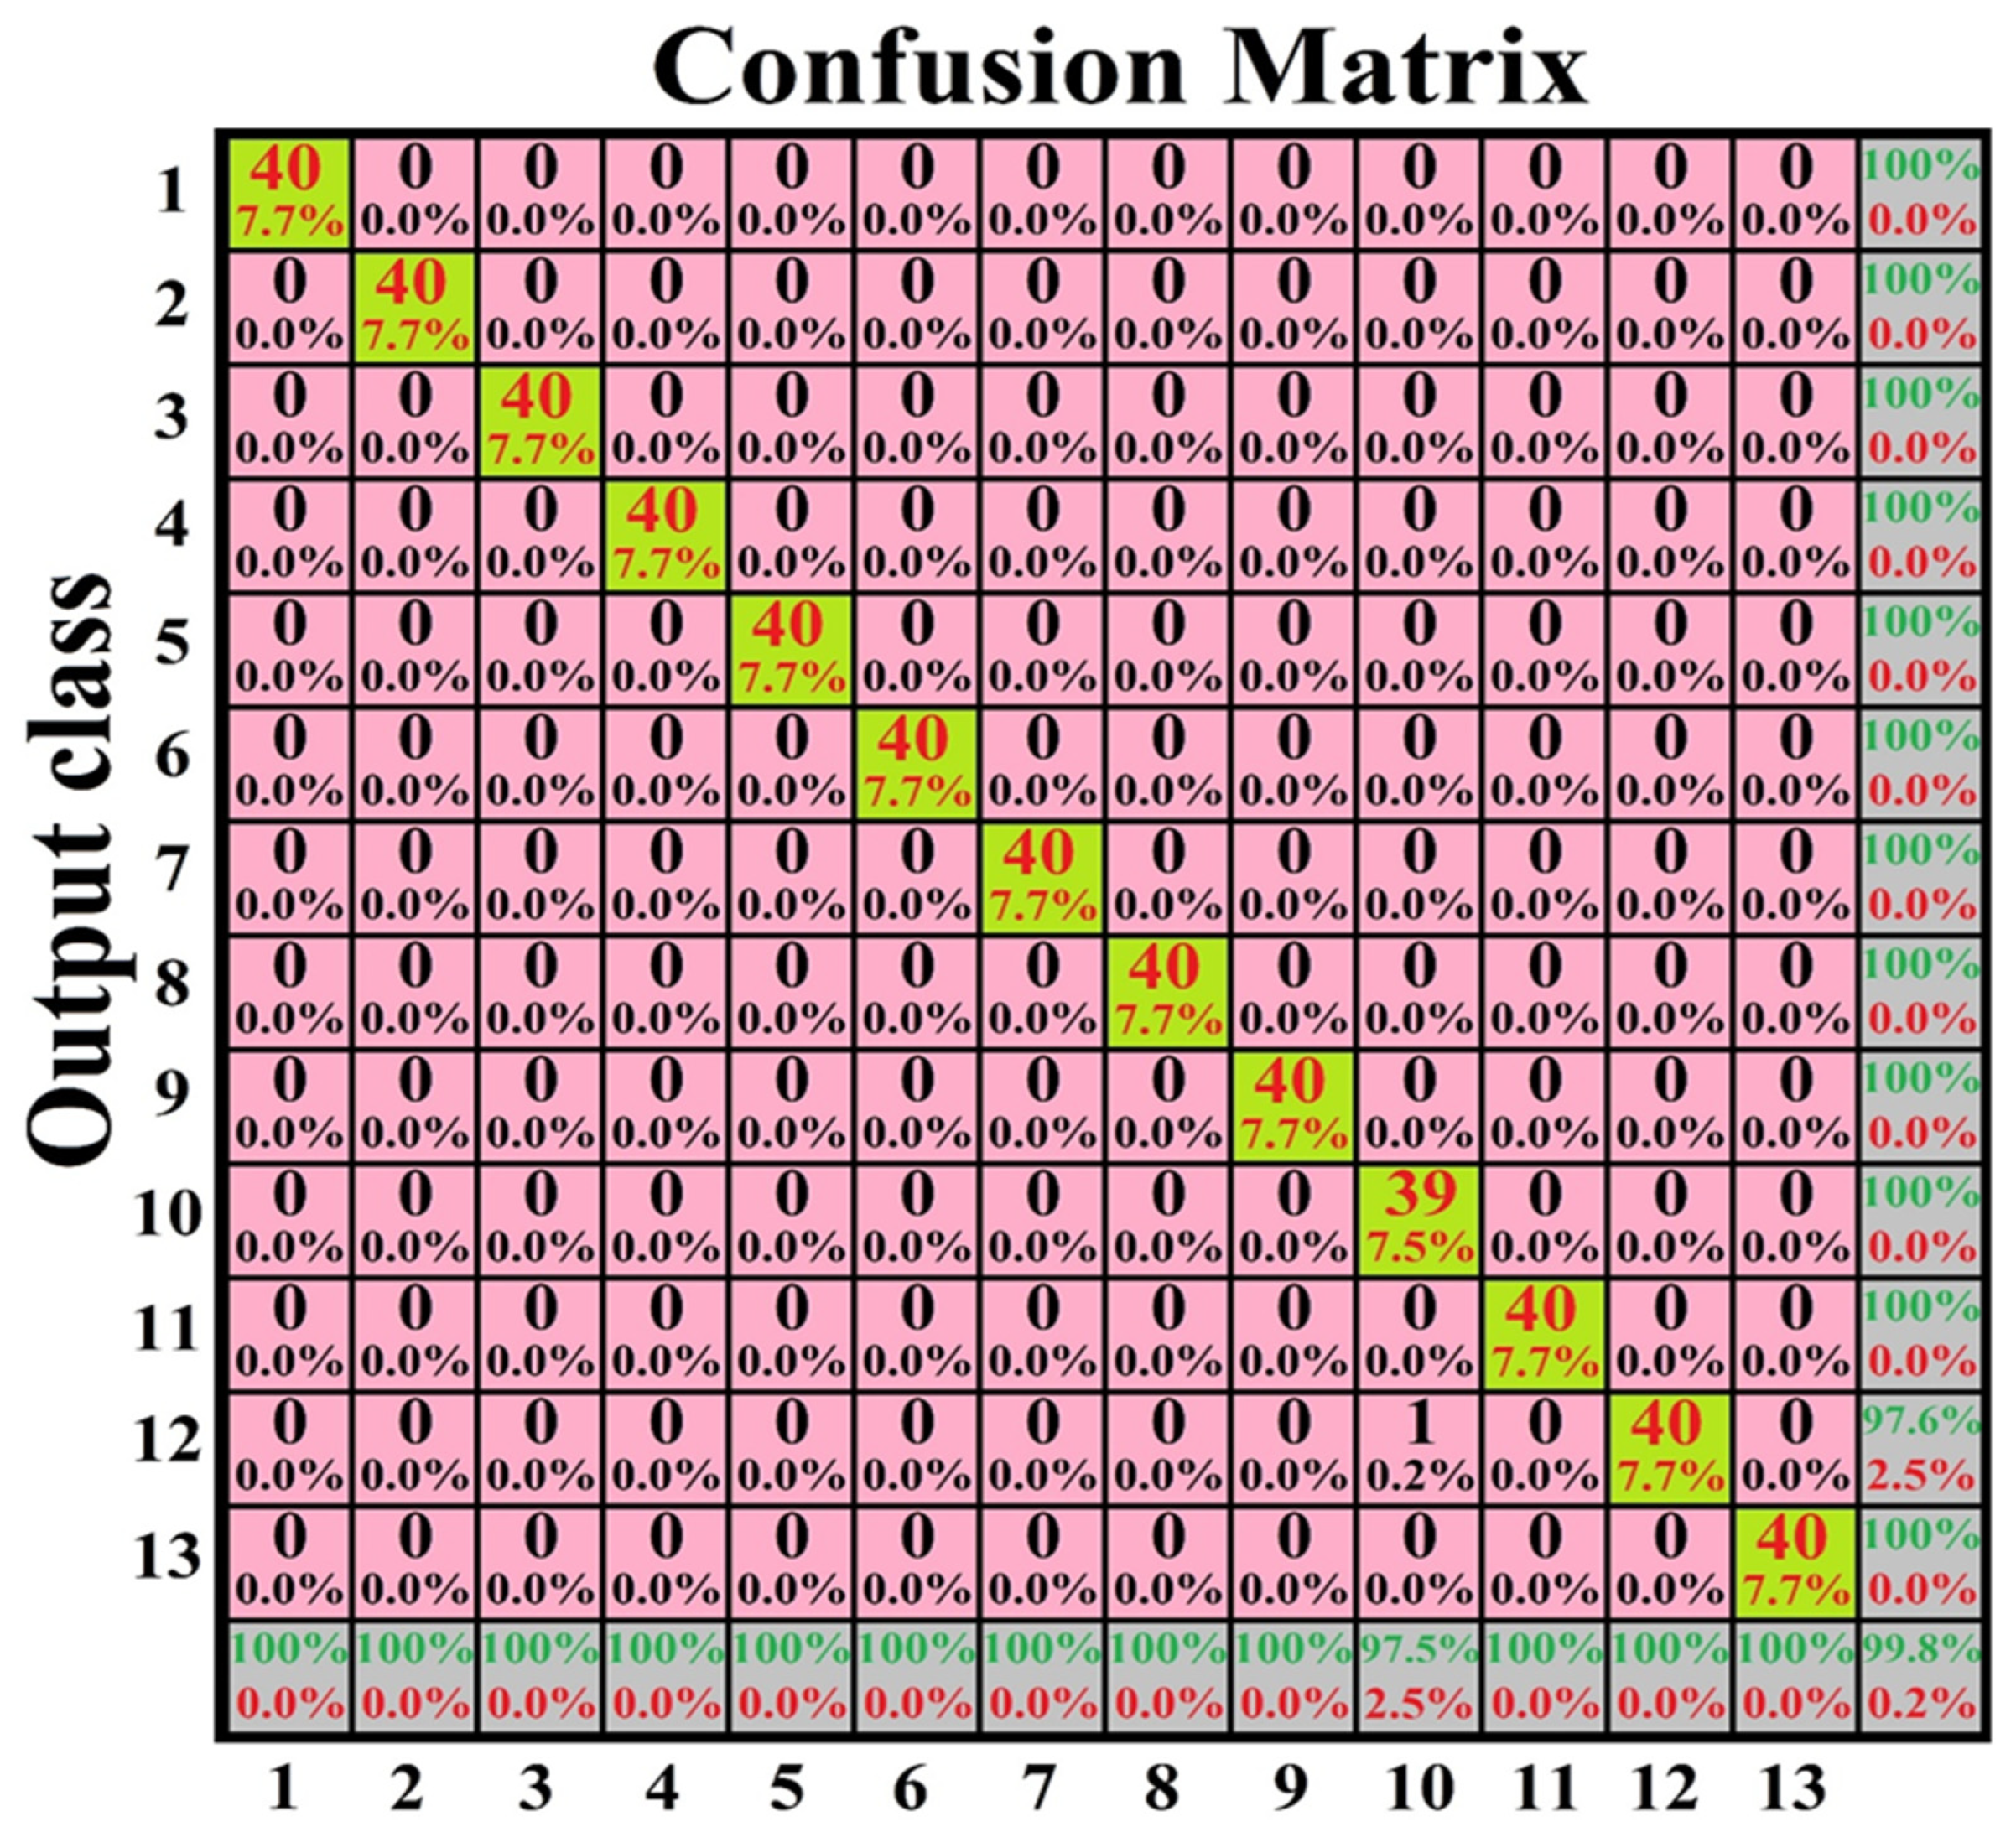
- TP = True Positive, indicates correct identification of the class.
- FP = False Positive, indicates incorrect identification of the class.
- FN = False Negative, indicates incorrect identification of another class.
2.2. Gas Chromatography–Mass Spectrometry: An Alternative Method
3. Results
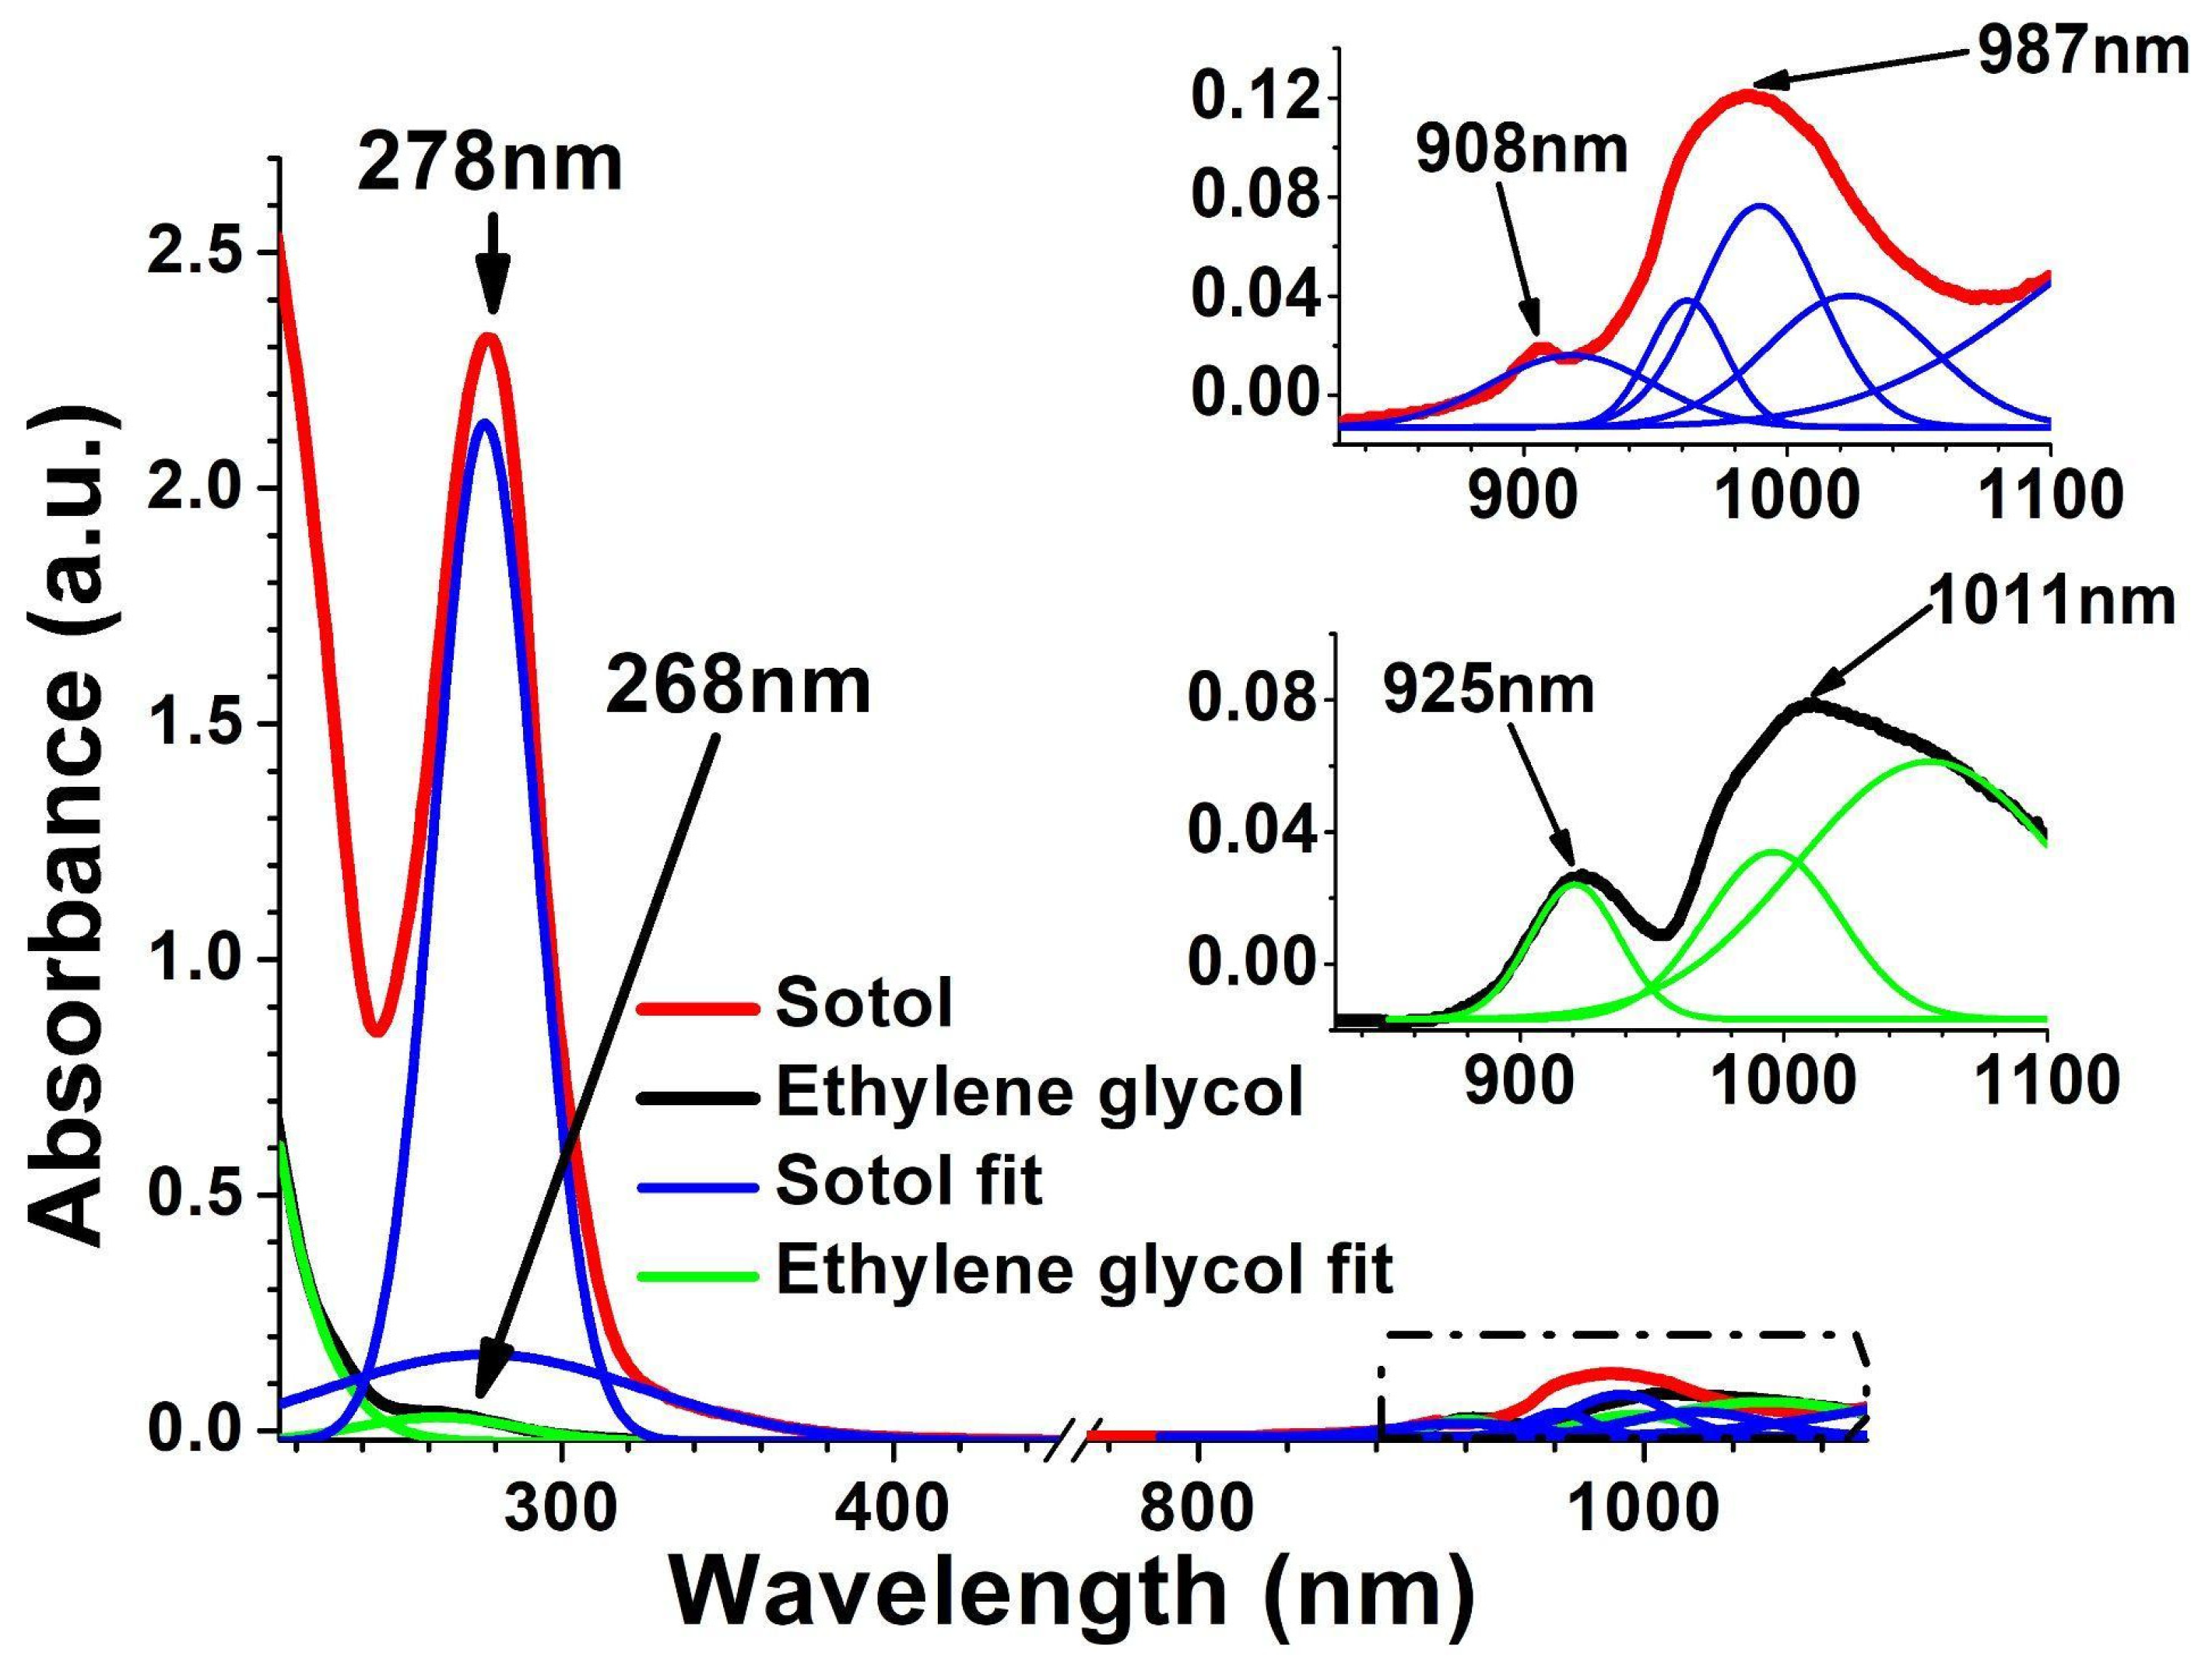
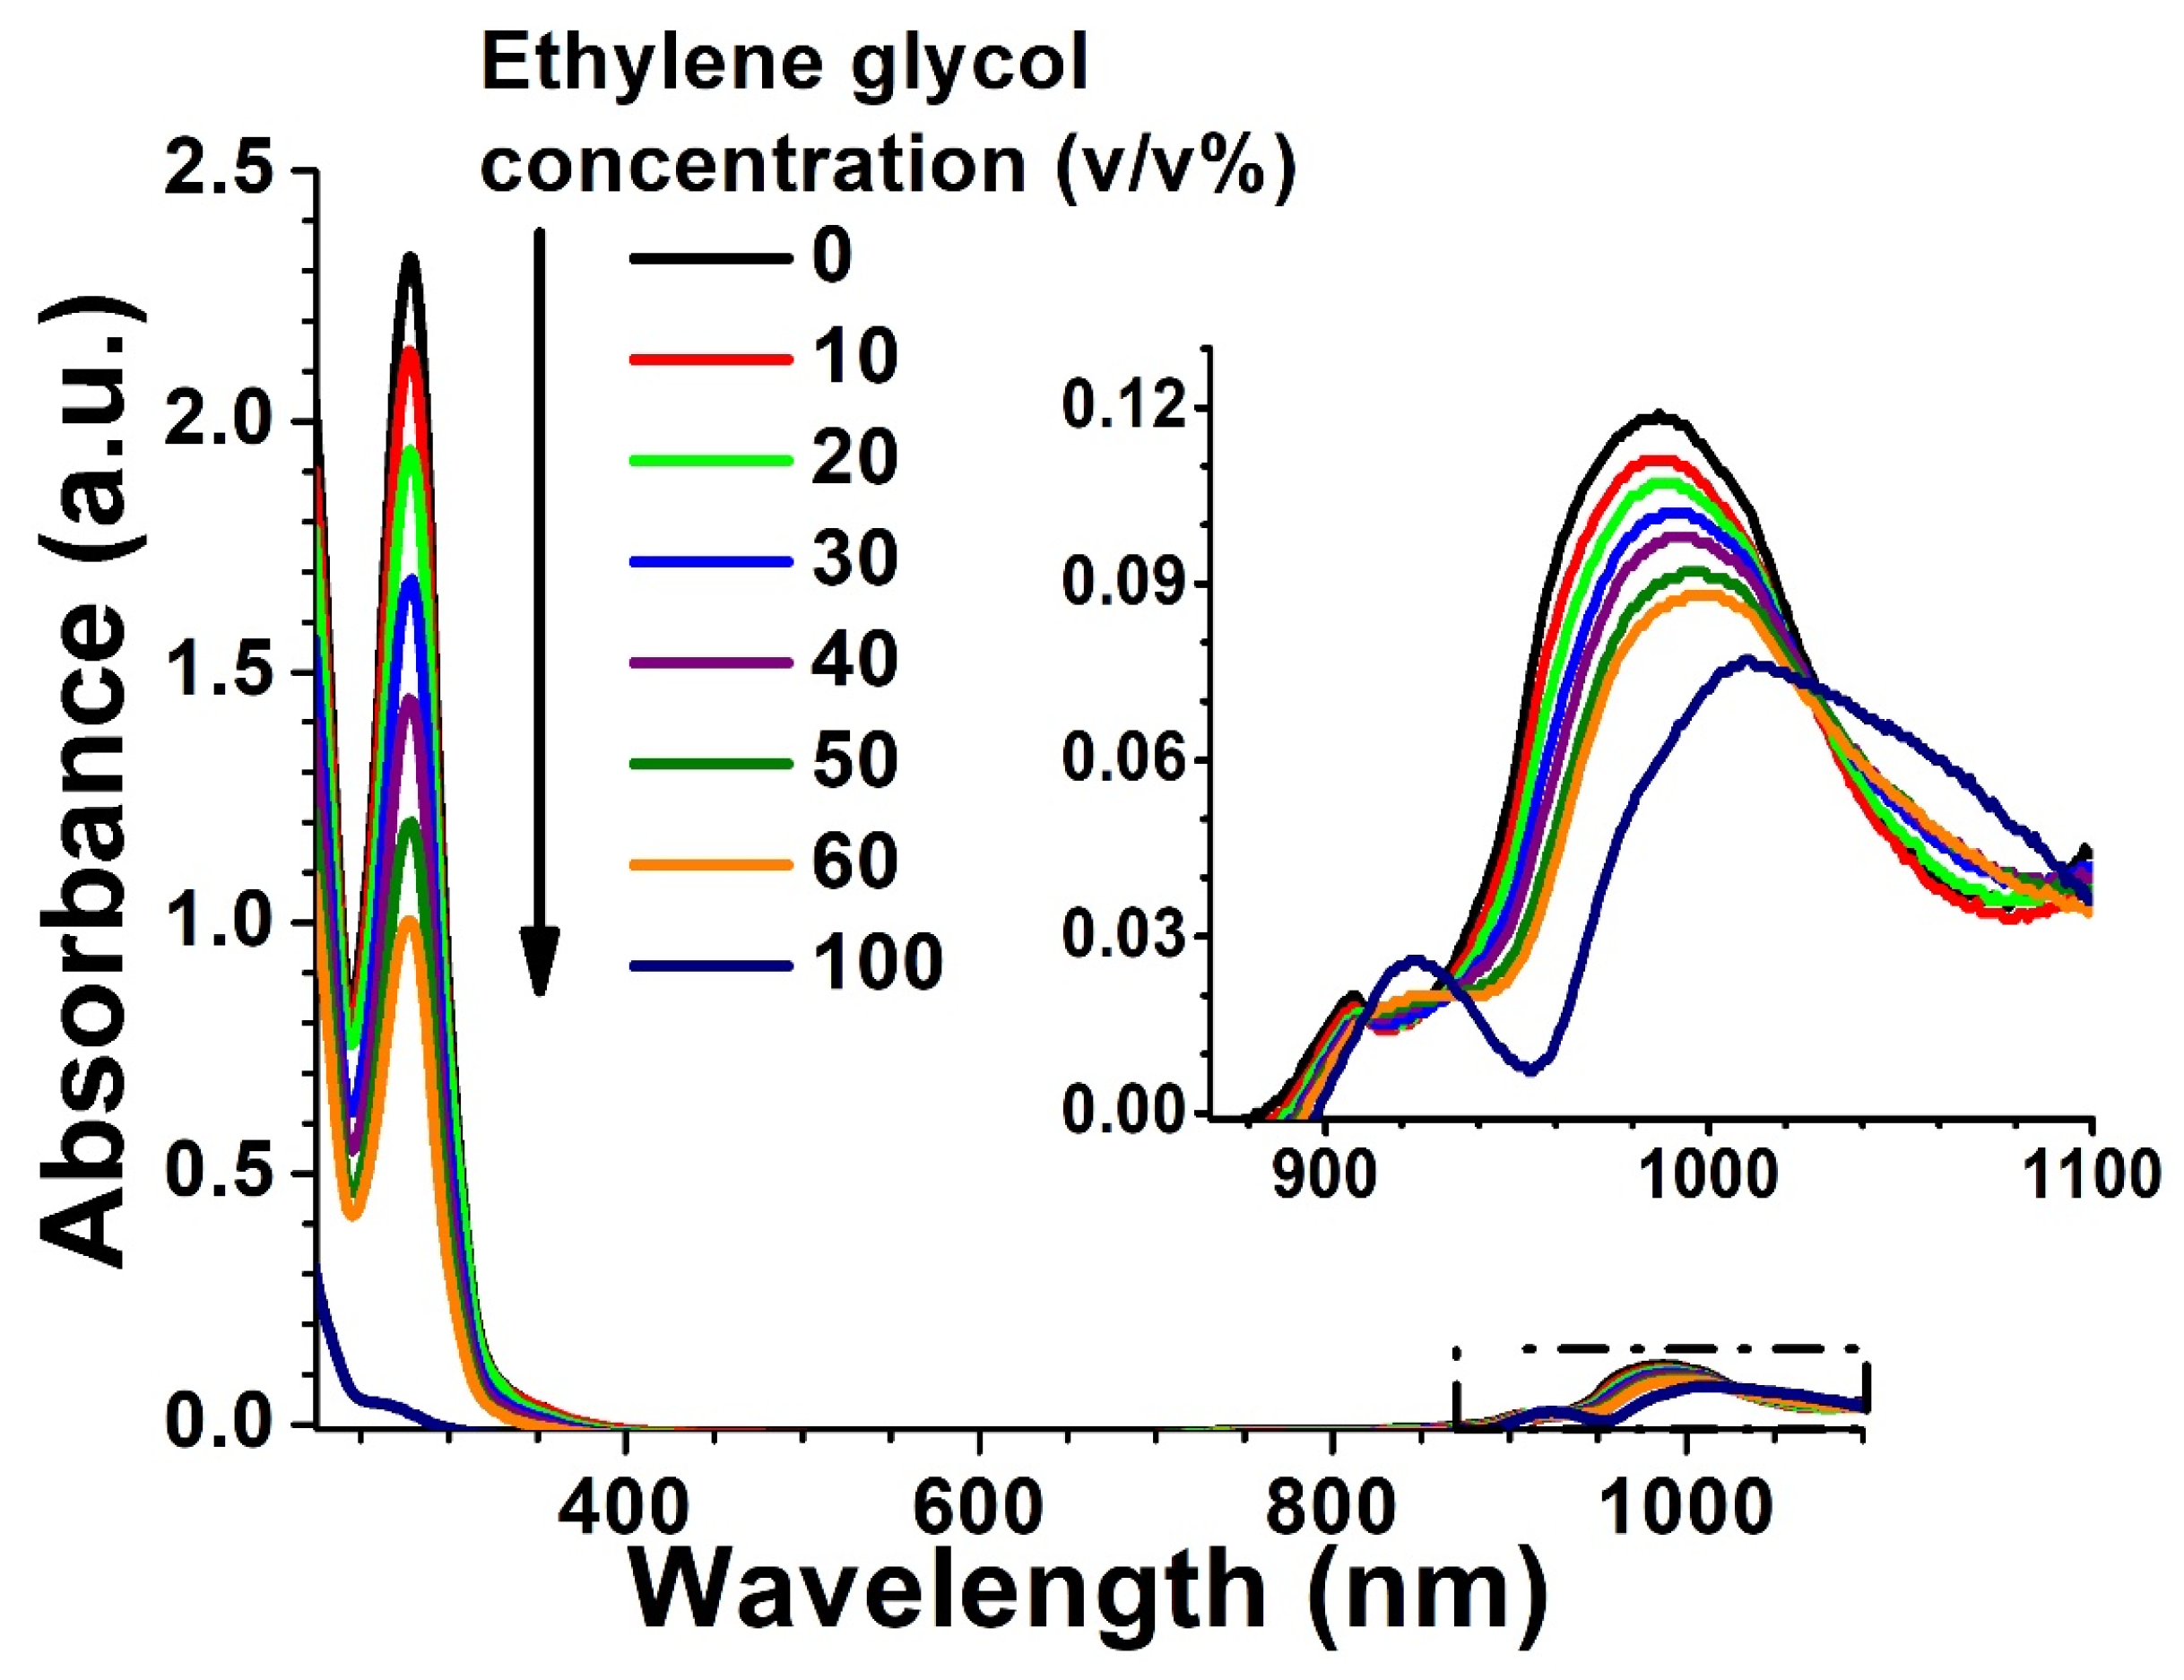
3.1. Absorbance Spectra
3.2. The Artificial Neural Network
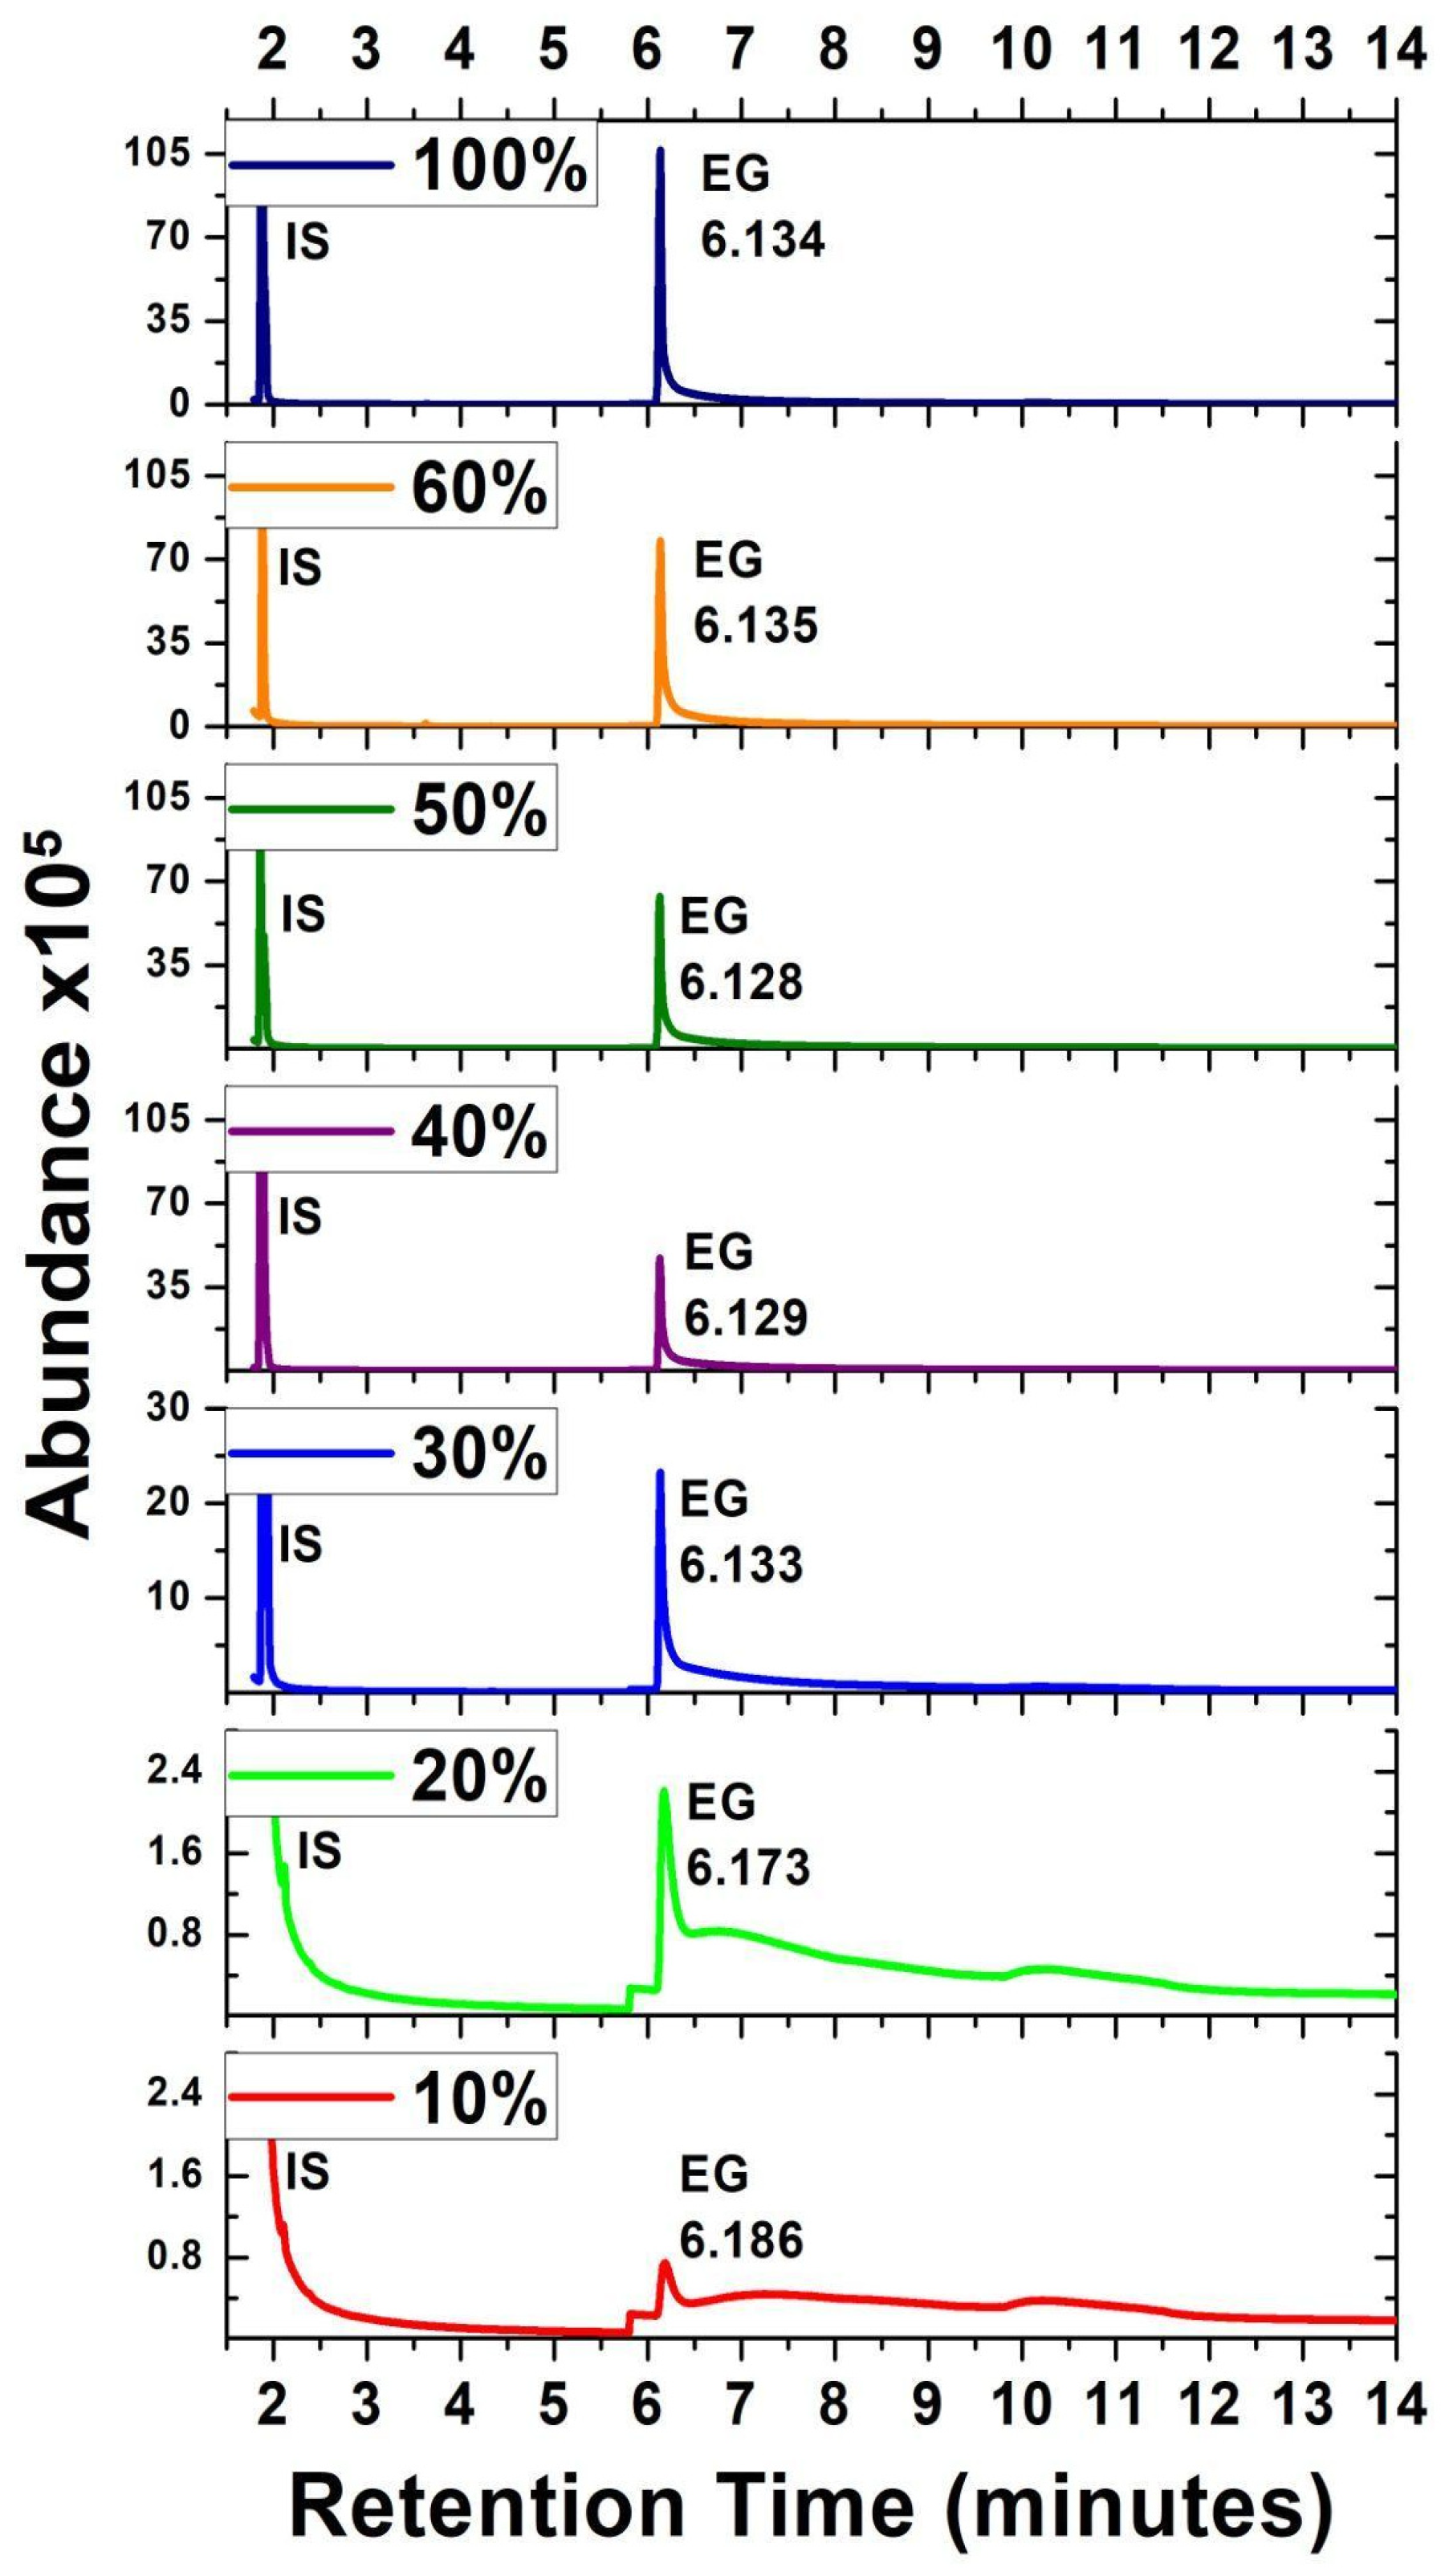
3.3. Gas Chromatography–Mass Spectrometry
4. Conclusions
Supplementary Materials
Author Contributions
Funding
Institutional Review Board Statement
Data Availability Statement
Acknowledgments
Conflicts of Interest
References
- Madrid-Solórzano, J.M.; García-Alcaraz, J.L.; Macías, E.J.; Cámara, E.M.; Fernández, J.B. Life Cycle Analysis of Sotol Production in Mexico. Front. Sustain. Food Syst. 2021, 5, 769478. [Google Scholar] [CrossRef]
- Flores-Gallegos, A.C.; Cruz-Requena, M.; Castillo-Reyes, F.; Rutiaga-Quiñones, O.M.; Sepulveda Torre, L.; Paredes-Ortíz, A.; Soto, O.N.; Rodriguez-Herrera, R. 5—Sotol, an Alcoholic Beverage with Rising Importance in the Worldwide Commerce. In Alcoholic Beverages, 1st ed.; Woodhead Publishing: Cambridge, UK, 2019; Volume 7, pp. 141–160. [Google Scholar]
- NOM-159-SCFI-2004 Norma Oficial Mexicana NOM-159-SCFI-2004, Bebidas Alcohólicas-Sotol-Especificaciones y Métodos de Prueba. Planta 2004. Available online: http://www.ordenjuridico.gob.mx/Documentos/Federal/wo45110.pdf (accessed on 7 March 2024).
- De la Garza, T.H.; Martínez, M.; Lara, L.; Rodríguez-Herrera, R.; Rodríguez-Martínez, J.; Aguilar, C.N. Production of a Mexican Alcoholic Beverage: Sotol. Res. J. Biol. Sci. 2008, 3, 566–571. [Google Scholar]
- Secretaría de Salud; Comisión Nacional Contra las Adicciones; Dirección de la Oficina Nacional para el Control del Tabaco y Alcohol Intoxicación Por Bebidas Alcohólicas Adulteradas En México. 2020. Available online: https://www.gob.mx/salud/conadic/documentos/intoxicacion-por-bebidas-alcoholicas-adulteradas-en-mexico (accessed on 7 March 2024).
- Hess, R.; Bartels, M.J.; Pottenger, L.H. Ethylene glycol: An estimate of tolerable levels of exposure based on a review of animal and human data. Arch. Toxicol. 2004, 78, 671–680. [Google Scholar] [CrossRef]
- Berman, L.B.; Schreiner, G.E.; Feys, J. The Nephrotoxic Lesion of Ethylene Glycol. Ann. Intern. Med. 1957, 46, 611–619. [Google Scholar] [CrossRef] [PubMed]
- Barceloux, D.G.; Krenzelok, E.P.; Olson, K.; Watson, W. American Academy of Clinical Toxicology Practice Guidelines on the Treatment of Ethylene Glycol Poisoning. Ad Hoc Committee. J. Toxicol. Clin. Toxicol. 1999, 37, 537–560. [Google Scholar] [CrossRef] [PubMed]
- Moriarty, R.W.; McDonald, R.H. The Spectrum of Ethylene Glycol Poisoning. Clin. Toxicol. 1974, 7, 583–596. [Google Scholar] [CrossRef] [PubMed]
- McNair, H.M.; Miller, J.M. Introduction. In Basic Gas Chromatography, 2nd ed.; John Wiley & Sons, Inc.: Hoboken, NJ, USA, 2008; Volume 1, pp. 1–30. [Google Scholar]
- Arslan, M.; Tahir, H.E.; Zareef, M.; Shi, J.; Rakha, A.; Bilal, M.; Huang, X.; Li, Z.; Zou, X. Recent Trends in Quality Control, Discrimination and Authentication of Alcoholic Beverages Using Nondestructive Instrumental Techniques. Trends Food Sci. Technol. 2021, 107, 80–113. [Google Scholar] [CrossRef]
- Fernández, A.; Montero-Fernández, I.; Monago-Maraña, O.; Martín-Tornero, E.; Martín-Vertedor, D. Acrylamide–Fat Correlation in Californian-Style Black Olives Using Near-Infrared Spectroscopy. Chemosensors 2023, 11, 491. [Google Scholar] [CrossRef]
- Müller Molnár, C.; Berghian-Groșan, C.; Măgdaș, D.A.; Cîntă Pînzaru, S. Surface-Enhance Raman Spectroscopy Detection of Thiabendazole in Frozen Food Products: The Case of Blueberries and Their Extracts. Chemosensors 2023, 11, 505. [Google Scholar] [CrossRef]
- Christensen, J.; Nørgaard, L.; Bro, R.; Engelsen, S.B. Multivariate Autofluorescence of Intact Food Systems. Chem. Rev. 2006, 106, 1979–1994. [Google Scholar] [CrossRef]
- Vlasov, Y.; Legin, A.; Rudnitskaya, A.; Di Natale, C.; D’Amico, A. Nonspecific sensor arrays (“electronic tongue”) for chemical analysis of liquids (IUPAC Technical Report). Pure Appl. Chem. 2005, 77, 1965–1983. [Google Scholar] [CrossRef]
- Proietti, N.; Capitani, D.; Aru, V.; Bellomaria, A.; Bertocchi, F.; Botta, B.; Cagliani, L.R.; Caligiani, A.; Capozzi, F.; Çela, D. NMR Applications in Food Analysis-Part B. In Analytical Chemistry: Developments, Applications and Challenges in Food Analysis; Nova Science Publishers, Inc.: New York, NY, USA, 2017; pp. 255–296. [Google Scholar]
- Röck, F.; Barsan, N.; Weimar, U. Electronic Nose: Current Status and Future Trends. Chem. Rev. 2008, 108, 705–725. [Google Scholar] [CrossRef] [PubMed]
- Li, Z.; Askim, J.R.; Suslick, K.S. The Optoelectronic Nose: Colorimetric and Fluorometric Sensor Arrays. Chem. Rev. 2019, 119, 231–292. [Google Scholar] [CrossRef] [PubMed]
- Borràs, E.; Ferré, J.; Boqué, R.; Mestres, M.; Aceña, L.; Busto, O. Data Fusion Methodologies for Food and Beverage Authentication and Quality Assessment—A Review. Anal. Chim. Acta 2015, 891, 1–14. [Google Scholar] [CrossRef] [PubMed]
- Philippidis, A.; Poulakis, E.; Kontzedaki, R.; Orfanakis, E.; Symianaki, A.; Zoumi, A.; Velegrakis, M. Application of Ultraviolet-Visible Absorption Spectroscopy with Machine Learning Techniques for the Classification of Cretan Wines. Foods 2020, 10, 9. [Google Scholar] [CrossRef] [PubMed]
- Sellitto, P.; Di Noia, A.; Del Frate, F.; Burini, A.; Casadio, S.; Solimini, D. On the Role of Visible Radiation in Ozone Profile Retrieval from Nadir UV/VIS Satellite Measurements: An Experiment with Neural Network Algorithms Inverting SCIAMACHY Data. J. Quant. Spectrosc. Radiat. Transf. 2012, 113, 1429–1436. [Google Scholar] [CrossRef]
- Gao, B.; Zhang, J.; Lu, W. Characterizing Variances of Adulterated Extra Virgin Olive Oils by UV-Vis Spectroscopy Combined with Analysis of Variance-Projected Difference Resolution (ANOVA-PDR) and Multivariate Classification. Appl. Sci. 2023, 13, 4360. [Google Scholar] [CrossRef]
- Kerslake, F.; Longo, R.; Dambergs, R. Discrimination of Juice Press Fractions for Sparkling Base Wines by a UV-Vis Spectral Phenolic Fingerprint and Chemometrics. Beverages 2018, 4, 45. [Google Scholar] [CrossRef]
- Pérez-Caballero, G.; Andrade, J.M.; Olmos, P.; Molina, Y.; Jiménez, I.; Durán, J.J.; Fernandez-Lozano, C.; Miguel-Cruz, F. Authentication of Tequilas Using Pattern Recognition and Supervised Classification. TrAC Trends Anal. Chem. 2017, 94, 117–129. [Google Scholar] [CrossRef]
- Swift, J.R.; Turner, M.A.; Reynolds, J.C. A Rapid Dynamic Headspace Method for Authentication of Whiskies Using Artificial Neural Networks. Food Chem. Adv. 2023, 3, 100417. [Google Scholar] [CrossRef]
- Cheng, B.; Titterington, D.M. Neural Networks: A Review from a Statistical Perspective. Stat. Sci. 1994, 9, 2–30. Available online: http://www.jstor.org/stable/2246275 (accessed on 7 March 2024).
- McCulloch, W.S.; Pitts, W. A Logical Calculus of the Ideas Immanent in Nervous Activity. Bull. Math. Biophys. 1943, 5, 115–133. [Google Scholar] [CrossRef]
- Caldeira, L.; Madureira, F.; Maia, T.; Muller, C.; Fernandes, C. Simultaneous quantification of ethylene glycol and diethylene glycol in beer by gas chromatography coupled to mass spectrometry. Food Chem. 2020, 346, 128871. [Google Scholar] [CrossRef] [PubMed]
- Bruni, M.E.; Lazzaroli, V.; Perboli, G.; Vandoni, C. Machine Learning to Forecast Rainfall Intensity. In Proceedings of the IEEE 47th Annual Computers, Software, and Applications Conference (COMPSAC 2023), Torino, Italy, 26–30 June 2023; pp. 1762–1767. [Google Scholar] [CrossRef]


| Silver | Gold | Aged | Extra Aged | |||||
|---|---|---|---|---|---|---|---|---|
| Min | Max | Min | Max | Min | Max | Min | Max | |
| Alcohol content at 20 °C (% Vol. Alc.) | 35 | 55 | 35 | 55 | 35 | 55 | 35 | 55 |
| Dry extract (g/L) | 0 | 0.2 | 0 | 15 | 0 | 15 | 0 | 15 |
| Higher alcohols (mg/100 mL) 1 | 20 | 400 | 20 | 400 | 20 | 400 | 20 | 400 |
| Methanol (mg/100 mL) | 0 | 300 | 0 | 300 | 0 | 300 | 0 | 300 |
| Aldehydes (acetaldehyde) (mg/100 mL) | 0 | 40 | 0 | 40 | 0 | 40 | 0 | 40 |
| Esters (ethyl acetate) (mg/100 mL) | 2 | 270 | 2 | 350 | 2 | 360 | 2 | 360 |
| Furfural (mg/100 mL) | 0 | 4 | 0 | 4 | 0 | 4 | 0 | 4 |
| Class | |||||||||||||
|---|---|---|---|---|---|---|---|---|---|---|---|---|---|
| 1 | 2 | 3 | 4 | 5 | 6 | 7 | 8 | 9 | 10 | 11 | 12 | 13 | |
| v/v% | 0 | 5 | 10 | 15 | 20 | 25 | 30 | 35 | 40 | 45 | 50 | 60 | 100 |
| Sample | Near-Ultraviolet (u2) | Near-Infrared (u2) |
|---|---|---|
| Sotol | 194.2 | 11.9 |
| Ethylene glycol | 8.5 | 7.6 |
Disclaimer/Publisher’s Note: The statements, opinions and data contained in all publications are solely those of the individual author(s) and contributor(s) and not of MDPI and/or the editor(s). MDPI and/or the editor(s) disclaim responsibility for any injury to people or property resulting from any ideas, methods, instructions or products referred to in the content. |
© 2024 by the authors. Licensee MDPI, Basel, Switzerland. This article is an open access article distributed under the terms and conditions of the Creative Commons Attribution (CC BY) license (https://creativecommons.org/licenses/by/4.0/).
Share and Cite
Gaxiola, F.; Leal, J.J.; Manzo-Martínez, A.; Salmerón, I.; Linares-Morales, J.R.; Narro-García, R. Identification of the Beverage Sotol Adulterated with Ethylene Glycol Using UV-Vis Spectroscopy and Artificial Neural Networks. Chemosensors 2024, 12, 46. https://doi.org/10.3390/chemosensors12030046
Gaxiola F, Leal JJ, Manzo-Martínez A, Salmerón I, Linares-Morales JR, Narro-García R. Identification of the Beverage Sotol Adulterated with Ethylene Glycol Using UV-Vis Spectroscopy and Artificial Neural Networks. Chemosensors. 2024; 12(3):46. https://doi.org/10.3390/chemosensors12030046
Chicago/Turabian StyleGaxiola, Fernando, Jesús Javier Leal, Alain Manzo-Martínez, Iván Salmerón, José Rafael Linares-Morales, and Roberto Narro-García. 2024. "Identification of the Beverage Sotol Adulterated with Ethylene Glycol Using UV-Vis Spectroscopy and Artificial Neural Networks" Chemosensors 12, no. 3: 46. https://doi.org/10.3390/chemosensors12030046