Ultrahigh-Sensitivity Detection of 17β-Estradiol


1
Department of Physics, Gachon University, Seongnam-si, Gyeonggi-do 13120, Republic of Korea
2
Gachon Bionano Research Institute, Gachon University, Seongnam-si, Gyeonggi-do 13120, Republic of Korea
*
Author to whom correspondence should be addressed.
Chemosensors 2024, 12(4), 61; https://doi.org/10.3390/chemosensors12040061
Submission received: 4 March 2024
/
Revised: 28 March 2024
/
Accepted: 9 April 2024
/
Published: 10 April 2024
(This article belongs to the Section Materials for Chemical Sensing)
Abstract
:17β-estradiol (E2), a vital female sex hormone, plays a crucial role in female reproductive cycles and secondary sexual characteristics. The quantification of E2 concentration in human blood and urine samples is essential because a deviation from physiological levels of E2 indicates the development of diseases and abnormalities such as precocious puberty, breast cancer, weight gain, abnormal menstruation, osteoporosis, and infertility. In addition, the detection of E2 in food and the environment has gained widespread interest because of its role as an endocrine disruptor (environmental hormone) that can perturb physiological processes. E2 is used as a drug for hormone therapy. Various E2 detection technologies for diagnosing relevant human diseases, drug screening, and environmental monitoring have been demonstrated in studies. In this article, we have reviewed technological strategies developed for E2 detection with ultrahigh sensitivity, with a limit of detection comparable to several pg/mL or lower. We observed that gold nanoparticles (AuNPs) were used as nanoplatforms for signal amplification, which enabled ultrahigh sensitivity in most studies. Signal amplification was facilitated by AuNP characteristics such as the versatility of surface biochemistry, exceedingly large surface-to-volume ratio, surface plasmonic activity, luminescence quenching ability, and biocompatibility. These techniques have been used to detect E2 in food, water, human serum, and urine with ultrahigh sensitivity. We summarize the working principles of E2 detection strategies that allow ultrahigh sensitivity and provide an approach for future work required for the elucidation of practical applications of these technologies.
Keywords:
17β-estradiol; E2; biosensor; ultrahigh sensitivity; precocious puberty; urine; serum; environmental hormone1. Introduction
17β-estradiol (estradiol, E2) is a vital estrogen steroid female sex hormone. In humans, E2 plays an important role in the development of female secondary sexual characteristics, the maintenance of reproductive tissues, and pregnancy. Generally, levels of E2 higher or lower than normal can cause various health problems, such as breast cancer, weight gain, abnormal menstruation, osteoporosis, and infertility in females and males [1,2,3,4]. E2 levels can be affected by external factors such as food or the environment; therefore, many researchers have investigated the presence of E2 in human-derived fluids such as serum and urine, and in many external factors such as milk, river water, and meat. According to Rosner et al. [1], detection methods for E2 have been developed since the 1930s, including liquid or gas chromatography (LC or GC) bioassays, mass spectroscopy (MS), radioimmunoassays (RIA), high-performance liquid chromatography (HPLC), ultraviolet–visible (UV) absorption spectroscopy, direct RIA, and the combination of HPLC and MS (HPLC-MS) [5,6,7,8,9].
Requirements have been requested in analytical methods with sensors in clinical settings such as the following: low concentrations of E2 have to be tested at lower than 1 pg/mL, measurement precision to characterize patient status, a wide concentration range including in vitro fertilization programs that require measuring approximately 3000 pg/mL, high specificity for E2, and comparable accurate results. In particular, the poor detection limits of E2 sensors were considered a limitation in investigating the status of men, postmenopausal women, and young girls before sexual maturity [1].
For example, the capability of detecting extremely low concentrations of E2 in human serum is substantially important for diagnosing precocious puberty, as seen in Table 1 [10]. Precocious puberty refers to the considerably early development of secondary sexual characteristics occurring in girls under the age of 8 years and boys under the age of 9 years [11,12,13,14,15,16]. This may cause early skeletal maturation, resulting in the loss of potential stature, obesity, an increasing risk of breast cancer, and even social/emotional problems such as depression. Recently, the human-urine-based detection of E2 for its early diagnosis is gaining more popularity due to its patient-friendly and comfortable assay in comparison with serum-based assays [17,18,19,20,21], despite the fact that the E2 concentration present in human urine is much smaller than that in human serum [22].
As solutions to the aforementioned challenges associated with the limited sensitivity available from existing sensor strategies, attempts have been made with various detection mechanisms, such as plasmonic-nanoparticle-based sensors [23,24,25,26,27], fluorescence sensors [28,29,30,31,32], Raman-based sensors [33,34,35,36,37,38], electrochemical sensors [39,40,41,42,43,44,45,46,47,48,49], enzyme immunosensors [50,51], and others [52,53,54,55,56,57,58,59]. To achieve a limit of detection (LOD) of E2 comparable or lower than 1 pg/mL, most of the ultrahigh-sensitivity E2 sensors have employed signal amplification mechanisms that involve gold nanoparticles (AuNPs) in common as amplifying nanoplatforms. In this review, we categorize the E2 sensors into luminescence-based sensors [29,30], electrochemical sensors [46,47,48], surface-enhanced Raman scattering (SERS) sensors [35,36,37], and other sensors (miscellaneous) [56,57,58,59]. Prior to describing the working principles of sensors in each category, the signal amplifying mechanism with AuNPs is summarized to highlight their role for ultrahigh sensitivity for E2 detection. Lastly, we provide the conclusion and outlook for future possible directions of E2-related research in need.
2. Nanoplatforms for Ultrahigh-Sensitivity E2 Sensors
Nanoparticles have been widely used in various types of highly sensitive sensor systems for detecting biomolecules or chemicals due to their advantages including an extremely large surface-to-volume ratio and the ability of modulating their physicochemical properties. For instance, nanoparticles of metals such as gold (Au) [60,61], silver (Ag) [60,61,62], palladium (Pd) [60,63], copper (Cu) [64], and platinum (Pt) [65,66] or nanoparticles of oxide compounds such as TiO2 [67] and Fe3O4 [68] were used for biochemical sensor systems. As non-metallic nanoparticles for E2 detection, magnetic nanoparticles of Fe3O4 were used to achieve an LOD of 3.48 PM [68]. However, noble metals of gold (Au) and silver (Ag) are mainly used as nanoplatforms for signal enhancement due to their unique optoelectronic properties in visible wavelengths [69,70,71,72,73,74,75,76,77,78,79]. Among the two noble metals, gold nanoparticles (AuNPs) are more widely used [60,61,62] due to their biocompatibility, chemical stability, and capability of versatile biochemical surface treatment.
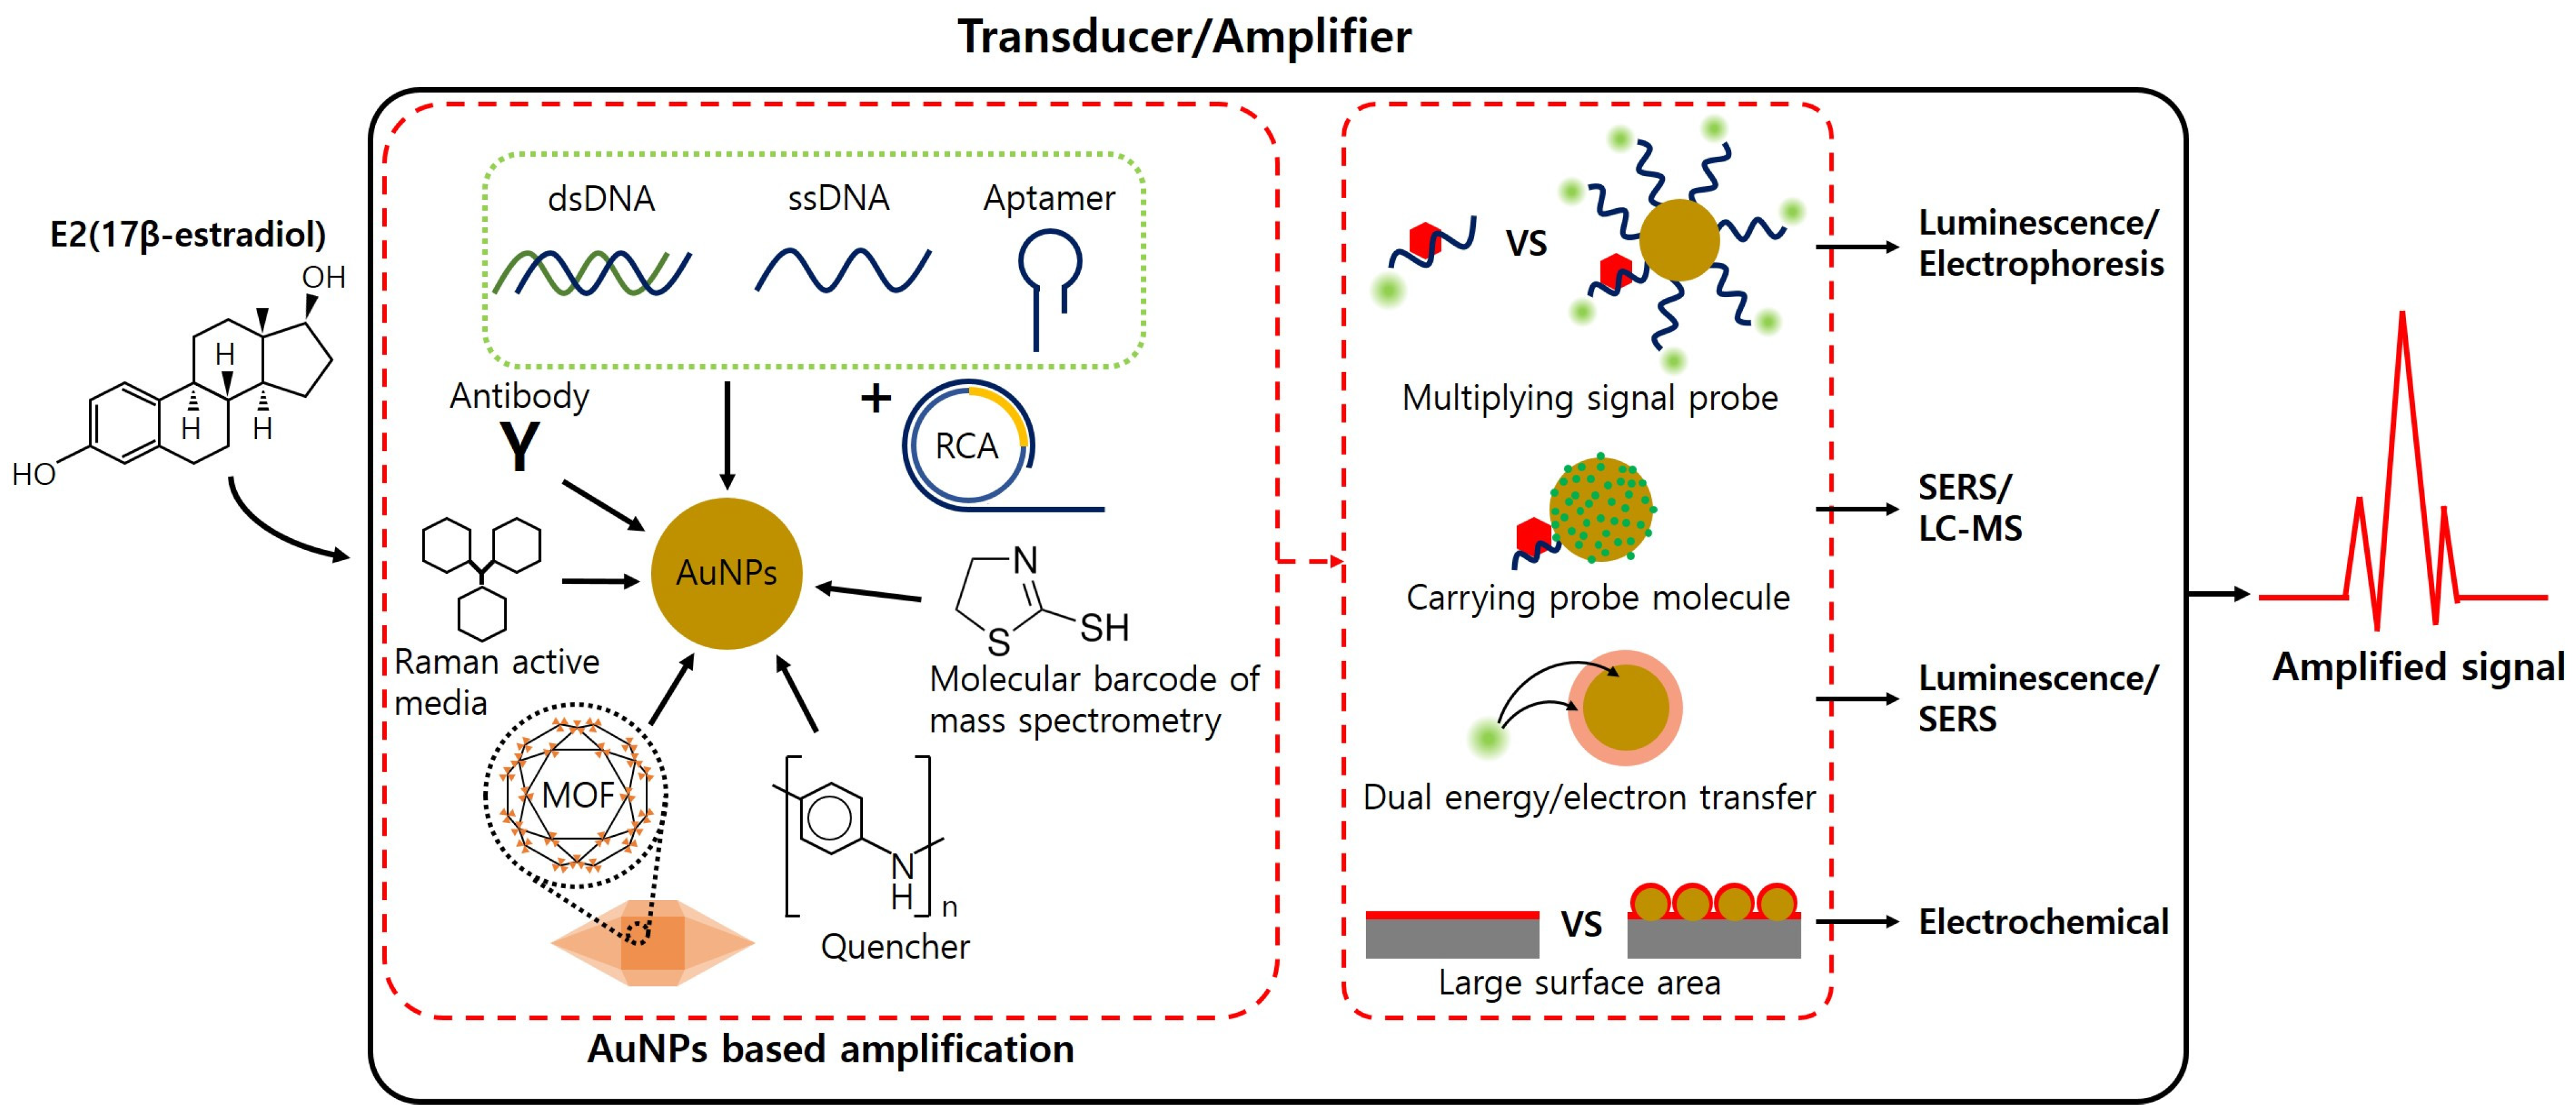
This section outlines the key principles for signal amplification demonstrated for the ultrahigh-sensitivity detection to date in various strategies with LODs comparable to 1 pg/mL or lower. In various detection strategies as shown in Figure 1, AuNPs played a key role for signal amplification due to their advantages such as an extremely large surface-to-volume ratio, the availability of various biochemical surface treatments, localized surface plasmon excitability at visible wavelengths, and biocompatibility [80,81,82,83,84]. AuNPs could serve as metallic nanoplatforms where many types of fluorescent molecules could be deployed through thiol-labeled nucleic acids or antibodies for fluorescence amplification in a competitive immunoassay [29,56,58]. Moreover, AuNPs could be used as luminescence quenchers via electron transfer [30,58,85,86,87,88,89]. When covered with polymer-based quenching molecules, AuNPs could strongly quench electrochemiluminescence, the so-called dual quenching, in a competitive immunoassay. AuNPs could also be used as carriers for chemical reagents that act as molecular barcodes for mass spectrometry [56]. Meanwhile, the nanotags that consisted of Raman-probe-labeled AuNPs, on the surface of which E2-conjugated compounds were immobilized, were used in a competitive immunoassay to produce amplified signals in surface-enhanced Raman spectroscopy (SERS) [35]. Silver nanoparticles (AgNPs) conjugated with metal–organic frameworks (MOFs) were also used for SERS sensors that detected E2 molecules [36].
3. Luminescence-Based Sensors
Sensors that use light-emitting materials as sensing probes are classified as luminescence-based ones. Luminescence-active materials that are excited by electromagnetic radiation, chemical interaction, mechanical bombardment, or electrical energy emit photons. Fluorescence is the luminescence that occurs when active materials are excited by electromagnetic radiation pumps. Organic dyes and quantum dots are the representative probes in fluorescence being used for detecting toxic substances, pollutants, and nutrients and for diagnosing diseases [71,72,90,91,92,93,94]. Measuring luminescence power as a function of analyte (E2) injected is a basis of quantifying E2 concentration. Competitive immunoassays with fluorescence technology were reported for detecting E2 molecules. An antibody for capturing E2 with high specificity was used as an E2 recognition element. As shown in Figure 2, analyte E2 molecules bonded with E2-specific antibodies on magnetic microparticles (MMPs). For bonding with antibodies, E2 molecules competed with AuNPs conjugated with both fluorescent probes and antibodies. This competitive assay led the smaller E2 molecules (analyte) that were injected to detect higher fluorescence. Herewith, the inherently large volume-to-surface ratio of AuNPs that hosted a large number of fluorescent molecules on the surface amplified the luminescence, with a consequence of ultrahigh sensitivity in E2 detection.
Du et al. [29] used AuNPs to carry the fluorescent molecules, i.e., avidin–fluorescein isothiocyanate (avidin-FITC), for a competitive immunoassay and demonstrated an E2 LOD of 6.37 fg/mL with a linear detection range from 10.0 fg/mL to 1.0 ng/mL. Anti-E2-antibodies with a rabbit host were used as the E2 capture antibody while goat anti-rabbit immunoglobulin G (IgG) was used as the detection antibodies that could react with the rabbit host antibodies. The detection antibodies that were immobilized on fluorescently labeled AuNPs (using thiol-functionalized double-stranded DNA covered with biotin (ds-DNA-Bio)) allowed AuNPs to compete with E2 molecules for bonding with anti-E2 antibodies on the surface of magnetic microparticles (MMPs). After the immunoreaction, the immune-complex MMPs were separated magnetically, and thiolate DNA strands were removed using dithiothreitol (DTT). Thus, hundreds of fluorescently labeled DNA strands were released. This prevented the fluorescence quenching effect of AuNPs from occurring, producing fluorescence. A large number of fluorescent molecules labeled on the AuNP surface enabled amplified luminescence to be detected.
This competitive immunoassay used a human urine specimen arranged to contain E2 concentrations of 0, 0.1, 0.5, and 0.8 ng/mL for detection. The detected E2 concentrations were 0.106, 0.211, 0.643, and 0.878 ng/mL, respectively, with a relative standard deviation (RSD) below 8.1% and a recovery range of 96.5–107.4%. This suggested high reproducibility and an independence of matrix effects of the detection method. However, the E2 concentrations evaluated in urine specimens might differ from the original values present in real urine which would later go through biochemical treatment into urine specimens for E2 detection. Further investigations are required to apply this strategy appropriately for the clinical diagnosis of E2 with real urine specimens.
Dong et al. [30] reported the electrochemiluminescence (ECL) immunosensors for E2 detection using a compound quencher, i.e., polyaniline-conjugated AuNPs (PANI@AuNPs), as shown in Figure 3A. An ECL reagent, polyoxomolybdate-zirconia (POM-ZrO2), was synthesized via a solvothermal treatment for electrochemiluminescence. In this compound, ZrO2 could act as both an oxidizable and reducible compound, while the phosphomolybdate assembly could be the catalytically active part of its hybrid structure. The mechanism of this sensor was as follows (Figure 3B): POM-ZrO2 was dropped onto a polished glassy carbon electrode (GCE). Then, E2-specific antibodies (capture antibodies) were immobilized on POM-ZrO2. This was followed by BSA immobilization on POM-ZrO2 to block non-specific bonding. E2-containing specimens taken from lake water and milk were injected for specific bonding between E2 and the capture antibodies. Then, PANI@AuNPs labeled with BSA-E2, i.e., PANI@AuNPs-BSA-E2, were injected to bond with the remaining capture antibodies on the electrode, resulting in competition with the injected E2 molecules (analytes) for antibody bonding. PANI@AuNPs acted as luminescence quenchers via electron transfer between PANI@AuNPs and POM-ZrO2. The luminescence quenching occurred due to the polyaniline part and AuNPs that both interacted with POM-ZrO2, forming the so-called dual quenching mechanism. This competitive immunoassay-based electrochemiluminescence yielded an LOD of 3.7 fg/mL and a sensing range from 0.01 pg/mL to 200 ng/mL for E2 detection. The relative standard deviation (RSD) for E2 detection ranged from 2.1 to 4.5% for lake water samples, and from 2.2 to 4.6% for milk samples, demonstrating good reproducibility. The signal recovery ranged from 98.3 to 102.0% for lake water samples, and from 97.7 to 104.0% for milk samples, showing satisfactory accuracy in E2 detection.
4. Electrochemical Sensors
Electrochemical sensors are usually based on three electrodes, i.e., a working, counter-, and reference electrode with a redox solution. The redox-coupled working electrode generates electrical signals. We reviewed three papers that reported ultrahigh-sensitivity E2 detection via the electrochemical sensors that used the same type of redox solution, i.e., a hexacyanoferrate(III)/hexacyanoferrate(II) (K3Fe(CN)6/K4Fe(CN)6) solution. The surfaces of working electrodes were modified with the recognizing materials, such as molecularly imprinted polymers (MIPs) [46,47], antibodies [48], aptamers [3], and enzymes [42,43].
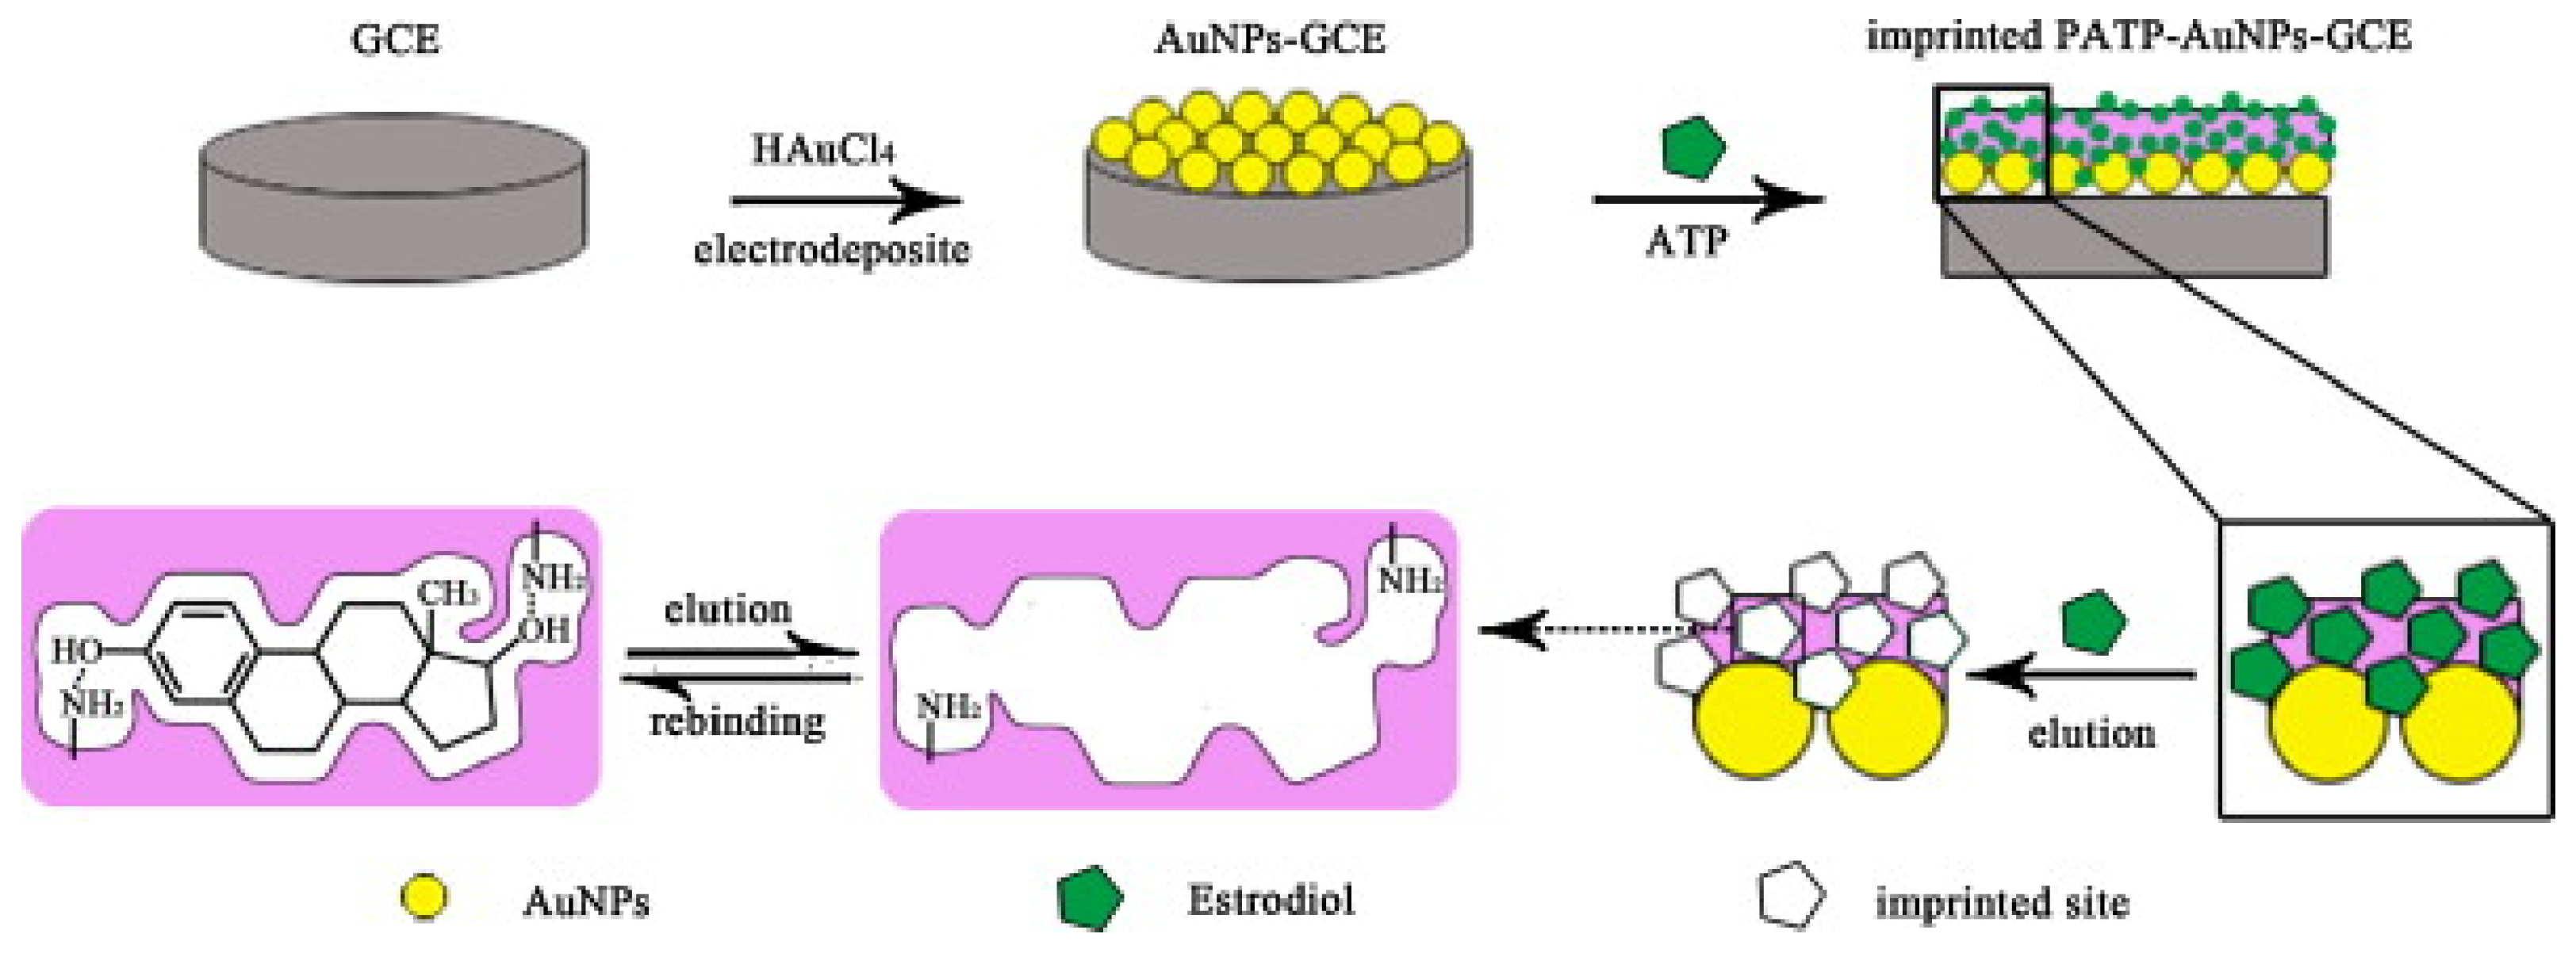
Zhang et al. [46] were the first to introduce MIP-based electrochemical sensors for E2 detection. Cyclic voltammetry (CV) and electrochemical impedance spectroscopy were used in a three-electrode system where platinum foil was used for the counter-electrode, a Ag/AgCl-saturated-KCl electrode was used as the reference electrode, and a modified GCE was used as a working electrode. As shown in Figure 4, AuNPs were electrodeposited onto GCEs. A layer of p-aminothiophenol (ATP, a pink-colored layer in Figure 4) was deposited on the AuNP-GCE by immersion in an ATP ethanol solution. The electrode was then immersed in E2 molecules (solid green pentagons) containing acetone solution for E2-ATP binding. Then, the electropolymerization of ATP was achieved using seven cycles of CVs and the subsequent chemical elution that removed the inner E2 molecules produced the hollow structure of polymers, i.e., MIP. The E2 molecules subsequently injected rebound with the MIP to occupy its hollow chambers with excellent specificity. The use of AuNPs exceedingly expanded the surface area on top of which the MIP was built, leading to the rebinding of extremely large E2 molecules for ultrahigh sensitivity. Although specimens for these sensors were directly taken from milk, the excellent specificity and ultrahigh sensitivity for E2 detection were achieved with an LOD of 1.28 fg/mL and a linear detection range from 1.0 fg/mL to 100 pg/mL. The signal recovery ranged from 84.7 to 102.9%, and thus demonstrated the immutability of the sensors to external interfering effects such as sample matrix effects, requiring no pretreatment of samples.
Florea et al. [47] used the MIP-based assay in electrochemical sensors with three electrodes for E2 detection in a similar manner to the abovementioned strategies [46]. It showed an LOD of 1.09 fM (0.297 fg/mL) and a linear detection range from 3.6 fM to 3.6 nM (corresponding to 0.981 fg/mL to 0.981 ng/mL). The sensor system consisted of an MIP-modified gold-based working electrode, a platinum-based counter-electrode, and a saturated-calomel-based reference electrode. Similarly to [46], AuNPs were used to form MIPs on the working electrode for signal amplifications. Specimens that were arranged by adding different concentrations of E2 (3.6 fM, 3.6 pM, and 3.6 nM) to river water samples were tested to assess the practical applicability of the sensor strategy. The results showed 102.1%, 95.6%, and 103.6% of signal recoveries and 23.2%, 7.8%, and 0.9% of RSD at the respective concentrations. This indicated that the sensor exhibited reasonably good accuracy for E2 detection while showing, at lower concentrations, poorer reproducibility.
Dai et al. [48] reported a cost-effective biosensor based on differential pulse voltammetry (DPV) that utilized three electrodes for E2 detection. The working and counter-electrodes were both Au-film-coated, while a printed-thick Ag/AgCl film was used as the reference electrode. As shown in Figure 5, an α-estrogen antibody was immobilized on the gold working electrode with self-assembled monolayers of 3-Mercaptopropionic acid (MPA). For arranging specimens, E2 was dissolved in dimethyl sulfoxide (DMSO) and then further diluted with PBS, tap water, and urine. After incubating E2 molecules on the sensor at room temperature for 3 h, DPV measurement was performed using the redox solution, 5 mM K3Fe(CN)6/K4Fe(CN)6, in 0.1 M PBS. The redox coupling caused the reaction between E2 molecules and the α-estrogen antibody, generating electrical signals. Tests were performed using tap water and simulated urine samples under identical conditions. Both specimens showed similar results of the sensors. The approximate linear range for E2 detection was obtained from 2.25 pg/mL to 2250 pg/mL. An interference study was also performed with testosterone, showing that testosterone did not interfere with this E2 sensor.
Although this DPV-based sensor offered a somewhat higher LOD than the other two abovementioned electrochemical sensors [46,47], the working electrode on which Au thin films were deposited by sputter-aided roll-to-roll processes could be fabricated in a cost-effective way. These DPV-based sensor results showed the applicability of this strategy to the development of a single-use cost-effective E2 detection unit with reasonably good sensitivity for both environmental and healthcare applications.
5. SERS-Based Sensors
SERS-based sensors use the Raman scattering signals greatly enhanced by using SERS substrates involving metallic nanostructures. In these nanostructures, plasmonic hot spots induce local electric field enhancement or effectively mediate the charge transfer between Raman-active probe molecules and metals [95,96,97]. The SERS-induced amplification of Raman scattering signals has been intensively studied using the substrates involving metal nanoparticles [98,99,100,101], MOFs [102,103,104,105], and materials with large electron mobility [95,96,97,98,99,100,101,102,103,104,105]. Several works with SERS technologies for E2 detection have been attempted [33,34,35,36,37,106] where a few studies reported ultrahigh sensitivity with an LOD smaller than pg/mL [35,36,37].
Wang et al. [35] reported use of the SERS technologies to detect E2 in human serum for the clinical diagnosis of precocious puberty. This work used malachite green isothiocyanate (MGITC) as Raman probes for labeling AuNPs. SERS nanotags were constructed from the Raman-probe-labeled AuNPs on the surface of which ovalbumin-conjugated E2 (E2-OVA) compounds were immobilized by amine-carboxyl coupling. Meanwhile, goat anti-mouse antibodies (secondary antibodies) were immobilized on magnetic bead particles, which was followed by binding mouse anti-E2 antibodies (primary antibodies) with secondary antibodies via antibody–antibody interaction, as shown in Figure 6a, after injecting E2 molecules (analyte). E2 and SERS nanotags that contained E2 competitively reacted with primary antibodies on magnetic beads (Figure 6b). Then, the magnetic beads bound with both E2 and SERS nanotags were isolated using a magnetic bar. The remaining SERS nanotags unbound with magnetic beads were washed away. The immunocomplexes on magnetic beads shown in Figure 6c were redispersed and transferred to a capillary tube for Raman signal measurement. AuNPs of the SERS nanotags produced amplified Raman signals of MGITC, and this signal increased for smaller E2 concentrations and vice versa, due to the competitiveness of the immune reaction between E2 and SERS nanotags. This strategy demonstrated an LOD of 0.65 pg/mL of E2 concentration and with 30 clinical serum samples collected from patients aged 7 to 15 years old, with a range of E2 levels from 2.22 pg/mL to 98.5 pg/mL being detected. This reflected that the sensitivity was higher than a commercialized kit of an enzyme-linked immunosorbent assay (ELISA, LOD of 5 pg/mL) for detecting E2 in human serum.
Wang et al. [36] demonstrated the detection of E2 present in specimens taken from food products (milk, fish, and duck meat) and wastewater samples, using a new SERS analysis strategy called the peak-differentiation-imitating-assisted SERS (PDI-SERS). This technique used the plasmonic MOF (MIL-101(Fe)) nanoparticles (PMNs) that involved AgNPs as shown in Figure 7. A p-aminothiophenol (PATP) group was used to chemically modify PMNs into a self-assembled form of PATP-modified PMNs. The Griess reaction then allowed the PATP part of the modified PMNs to react with phenolic estrogens (PEs) such as E1 (estrone), E2, and E3 (estriol), into the formation of azo-complexes [107,108]. Here, the Raman signals for the stretching vibration of N=N differed between cases of E1 (1431 cm−1), E2 (1435 cm−1), and E3 (1436 cm−1). For specimens involving a combination of E1, E2, and E3, the net Raman signals detected were the multiplex Raman signals involving individual effects. The modeling-aided analysis suggested from PDI-SERS performed spectral deconvolution for discrimination into individual signals. This led to the estimation of respective PE concentrations (E1, E2, and E3) using the standard curves achieved with the known concentrations (from 10−14 to 10−7 M) of individual PEs.
For a specimen involving a single type of PE, the PATP-modified PMN-based SERS provided LODs of 2.0 fM (0.54 fg/mL) of E1, 4.0 fM (1.1 fg/mL) of E2, and 6.0 fM (1.7 fg/mL) of E3, showing ultrahigh sensitivity. Meanwhile, for a specimen involving mixed PEs (E1, E2, and E3), the PDI-SERS analysis method was utilized to estimate individual PE concentrations. In these mixed cases, the LOD, however, became much higher (0.12 to 1.06 μg/kg) than those of the unmixed cases due to interference from the competitive reaction of each PE. Nonetheless, the LOD was still much lower than the daily tolerable level recommended by the U.S. Environmental Protection Agency [109].
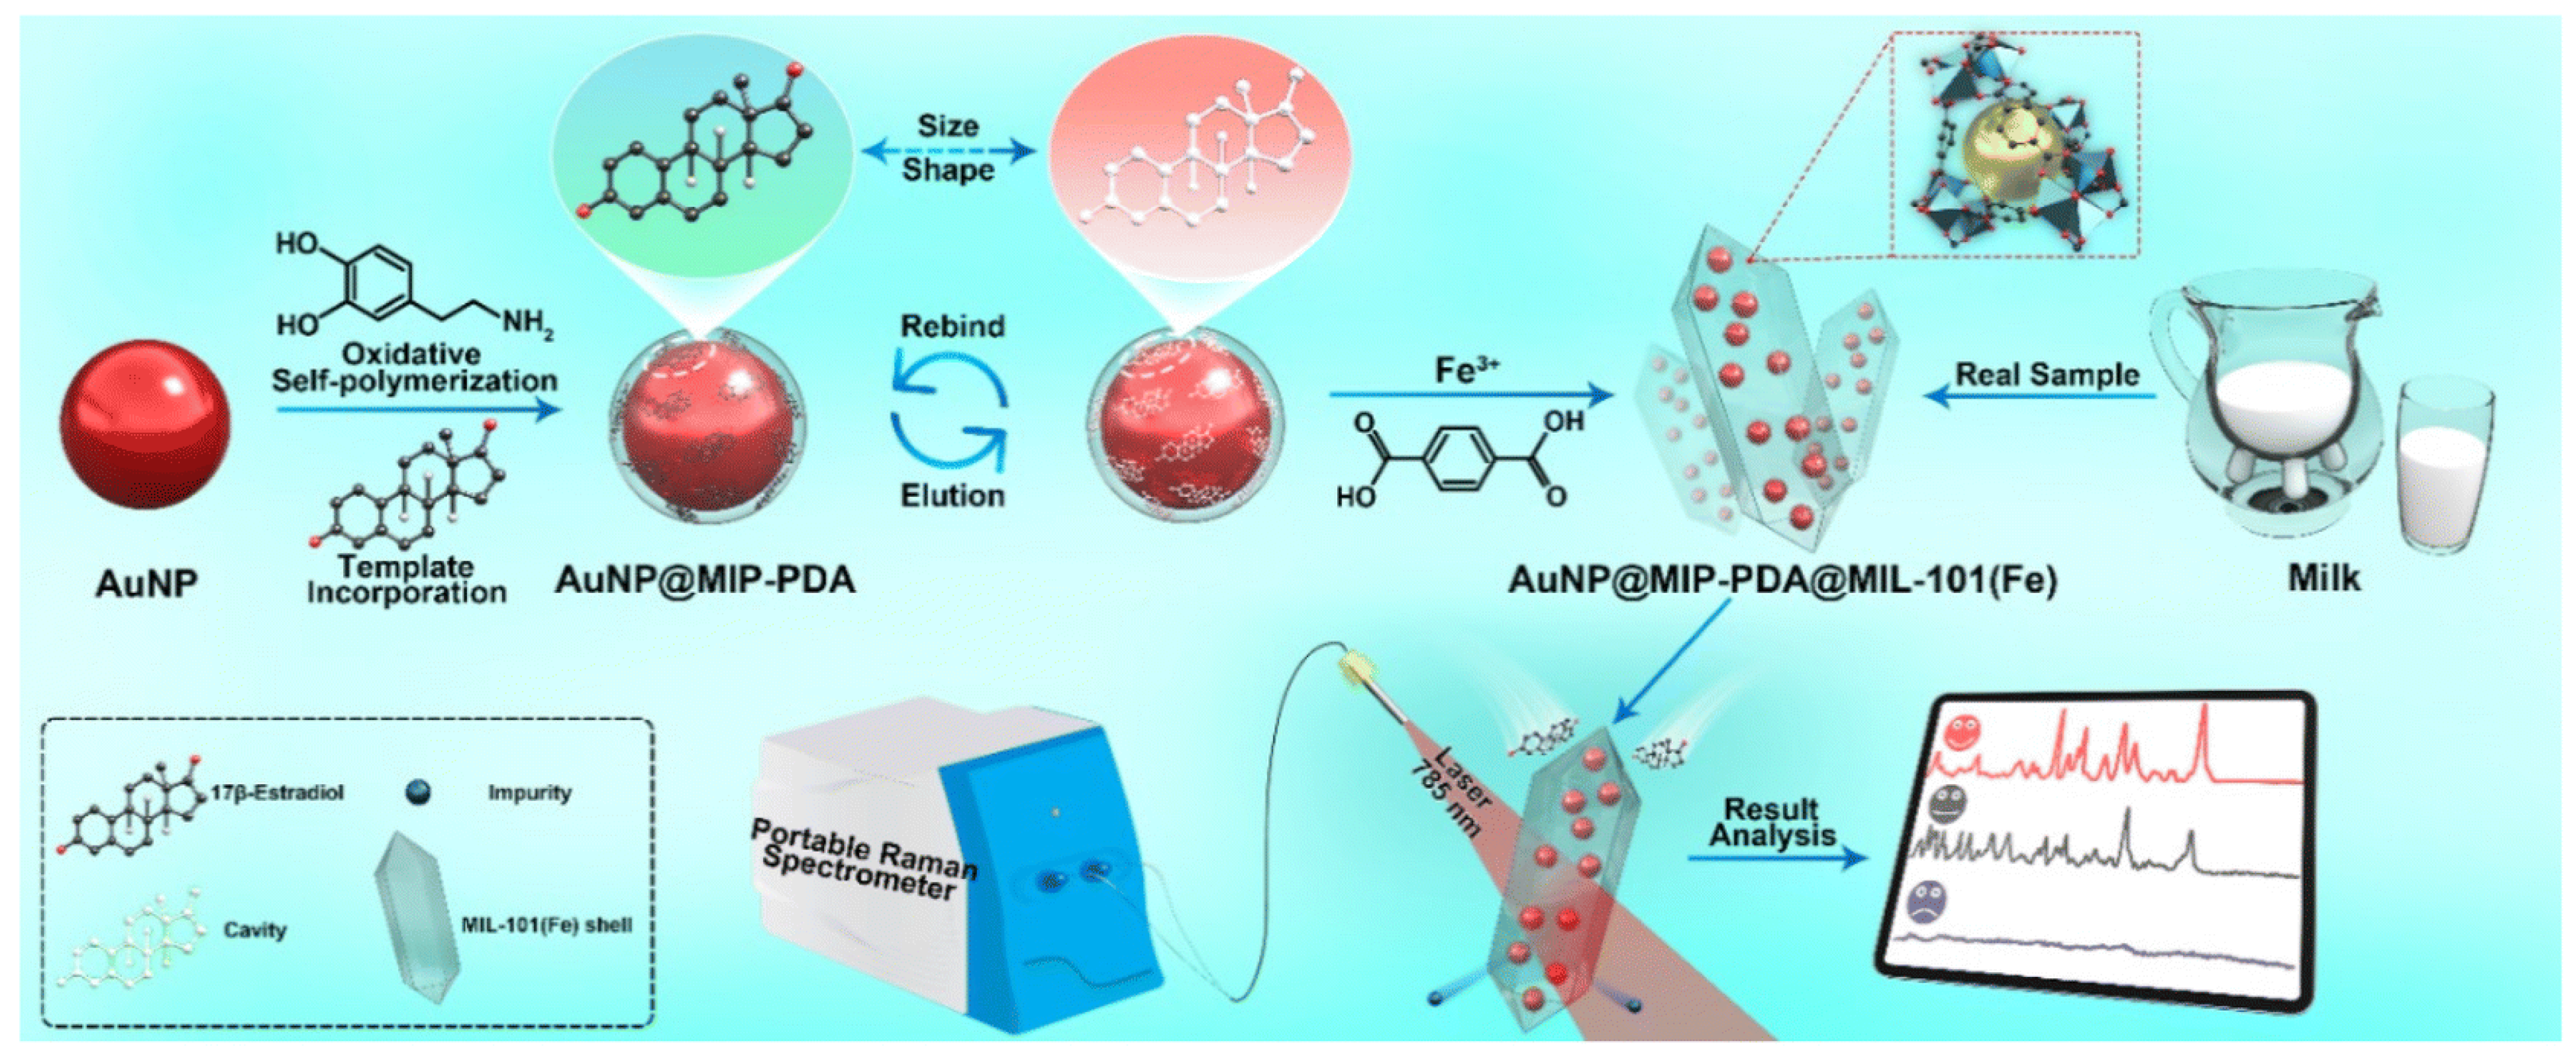
Zhang et al. [37] reported ultrahigh-sensitivity E2 detection using the SERS technique with PMNs, similar to Figure 7. The MOFs used for PMNs in this work were MIL-101(Fe) and were embedded with AuNP@MIP-PDA. The AuNP@MIP-PDA was a AuNP of 50 nm diameter coated with a polymerized layer of polydopamine (PDA) wherein E2 molecules were imprinted, as shown in Figure 8. The AuNP@MIP-PDA was anchored in MIL-101(Fe), into a torpedo-shaped compound (AuNP@MIP-PDA@MIL-101(Fe)). When specimens were arranged from 30% ethanol-solvent-based E2 solutions which were further diluted with Milli-Q water, an LOD of 0.195 fM (0.0531 fg/mL) was obtained, reflecting ultrahigh sensitivity. When specimens were made from milk spiked with E2 of specific concentrations, an LOD of about 10 fM (2.7 fg/mL) was obtained, still exhibiting ultrahigh sensitivity for E2 detection.
6. Miscellaneous
In this section, we review four papers that reported ultrahigh-sensitivity E2 detection and that fell outside of the categories covered by the previous sections. They are about the molecular barcode assay [56], cantilever-based sensors [57], photoelectrochemical immunoassay with DNA amplification and AuNPs [58], and liquid-crystal-aptamer-based optical sensors [59].
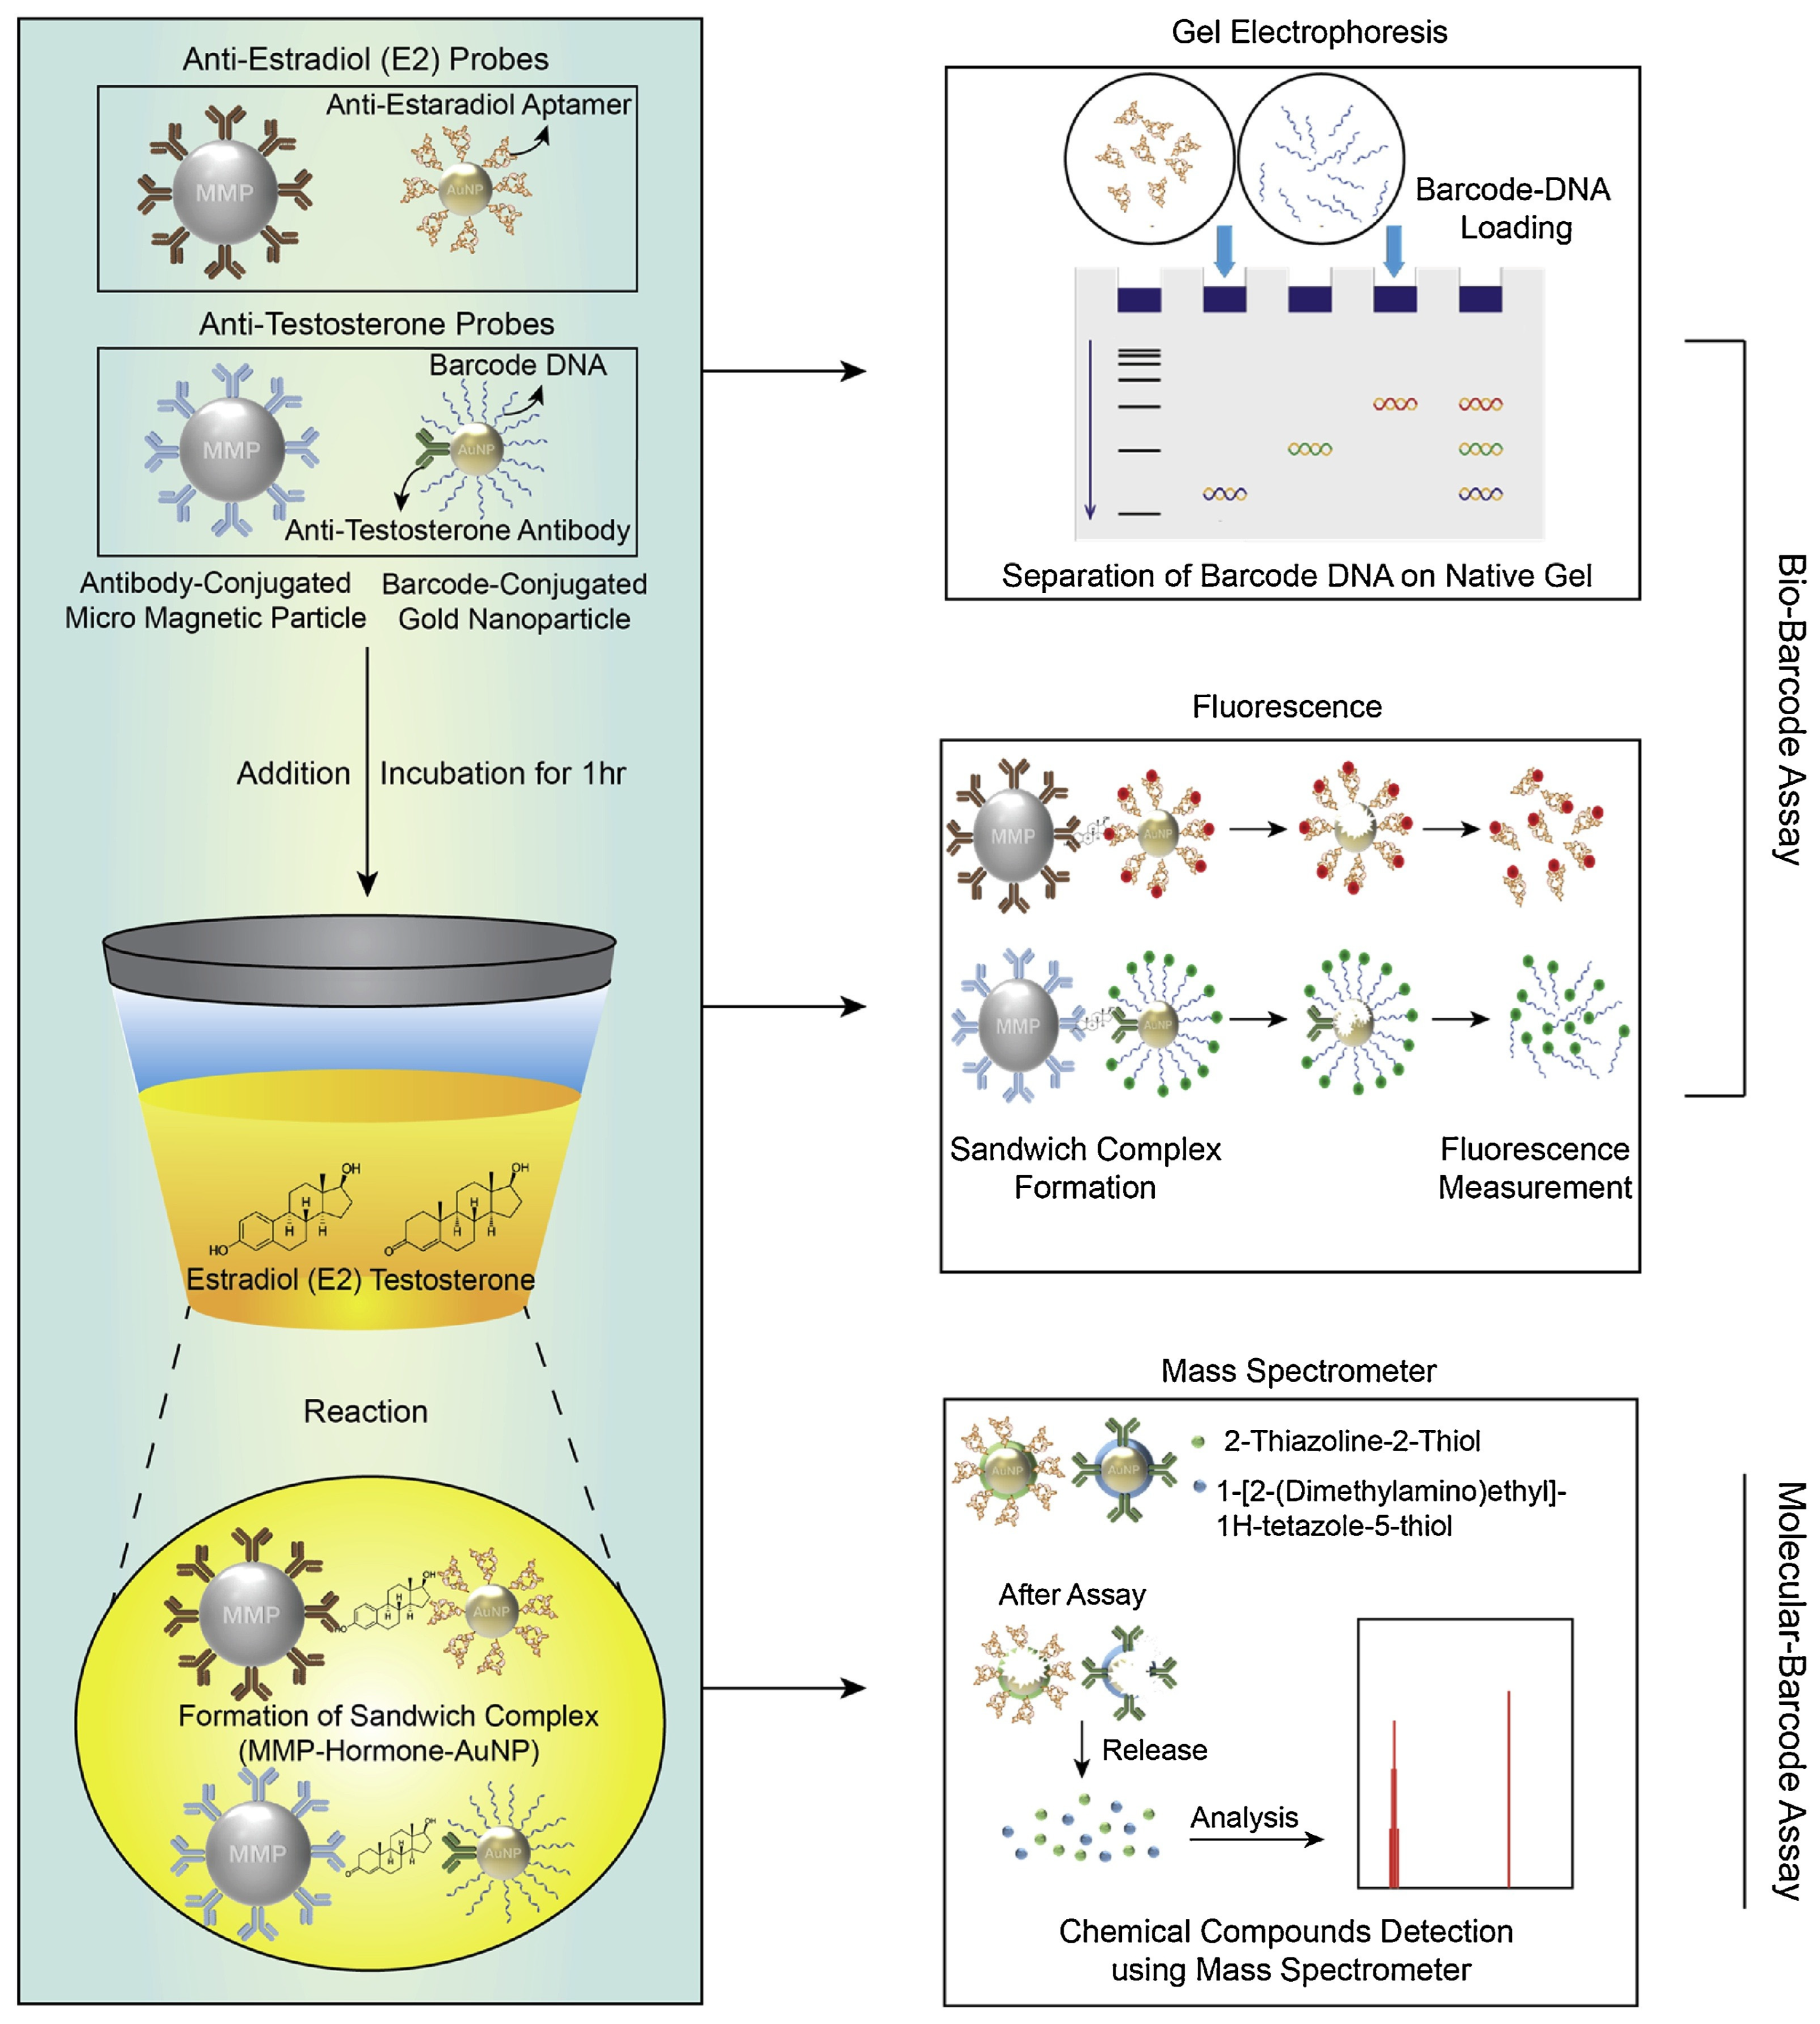
Lee et al. [56] reported a molecular barcode assay for E2 and testosterone for the non-invasive early diagnosis of precocious puberty, as shown in Figure 9. For E2 (or testosterone) detection, micro-magnetic particles (MMPs) were used as substrates on which anti-E2 antibodies were immobilized. Upon E2 (or testosterone) injection, E2 molecules (or testosterone) were specifically bound with antibodies on MMPs. Meanwhile, anti-E2 aptamers (or anti-testosterone antibody with DNA) were made to be immobilized on AuNPs, making them DNA carriers. These DNA carriers were taken to interact with the abovementioned E2 (or testosterone)-antibody-modified MMPs. Subsequent chemical treatment enabled the DNAs to only be extracted from the carrier—MMP composite. These DNAs were fed to an electrophoresis-based assay and fluorescence-based assay (using the DNAs pre-attached with fluorophores). This allowed the E2 (or testosterone) concentration to be estimated by quantifying the amounts of DNAs, making aptamers called E2 (testosterone)-detection barcodes.
In cases of using an LC-MS-based assay, AuNPs were additionally chemically coated with molecules, i.e., 2-Thiazoline-2-Thiol and 1-[2-(dimethylamino)ethyl]-1H-tetazole-5-thiol (MTDT), which was called the molecular barcodes for E2 (or testosterone) detection. Aptamers on AuNPs only played a role of binding with E2 (analyte) molecules on MMPs. After dissolving AuNPs out of AuNP-E2-MMP composites with KCN, the remaining products were fed to LC-MS, which produced the signal associated with the barcode molecules. This enabled the E2 (or testosterone) concentration to be estimated with the highest sensitivity ever reported to date: the LOD was about 10 ag/mL for specimens taken from hormone-free urine involving the analyte (E2 or testosterone), while it was 100 ag/mL when the multiplexed assay was performed with specimens involving both hormones.
The cantilever nanobiosensors were used for detecting E2 with ultrahigh sensitivity as reported by de Cezaro et al. [57]. This work used an AFM system which detected the change in intensity of laser light reflected from a gold-coated cantilever tip which could physically bend as a result of the change in E2-oxidation-induced surface stress. As shown in Figure 10, a gold-coated cantilever tip was additionally coated with tyrosinase (enzymes) using a 1-Ethyl-3-diaminopropyl carbodiimide (EDC)-N-hydroxysuccinimide (NHS) reaction with a thiolate carboxyl hydrocarbon chain. Tyrosinase could catalyze injected E2 molecules to be oxidized into quinones [110]. The tyrosinase-boosted anchoring of E2 molecules on the tip surface produced the change in tip surface stress, leading to a physical bending of the cantilever, resulting in a change in reflected light intensity. This strategy for E2 detection produced an LOD of 0.1 pg/mL with a detection range of 1 pg/mL to 10 ng/mL.
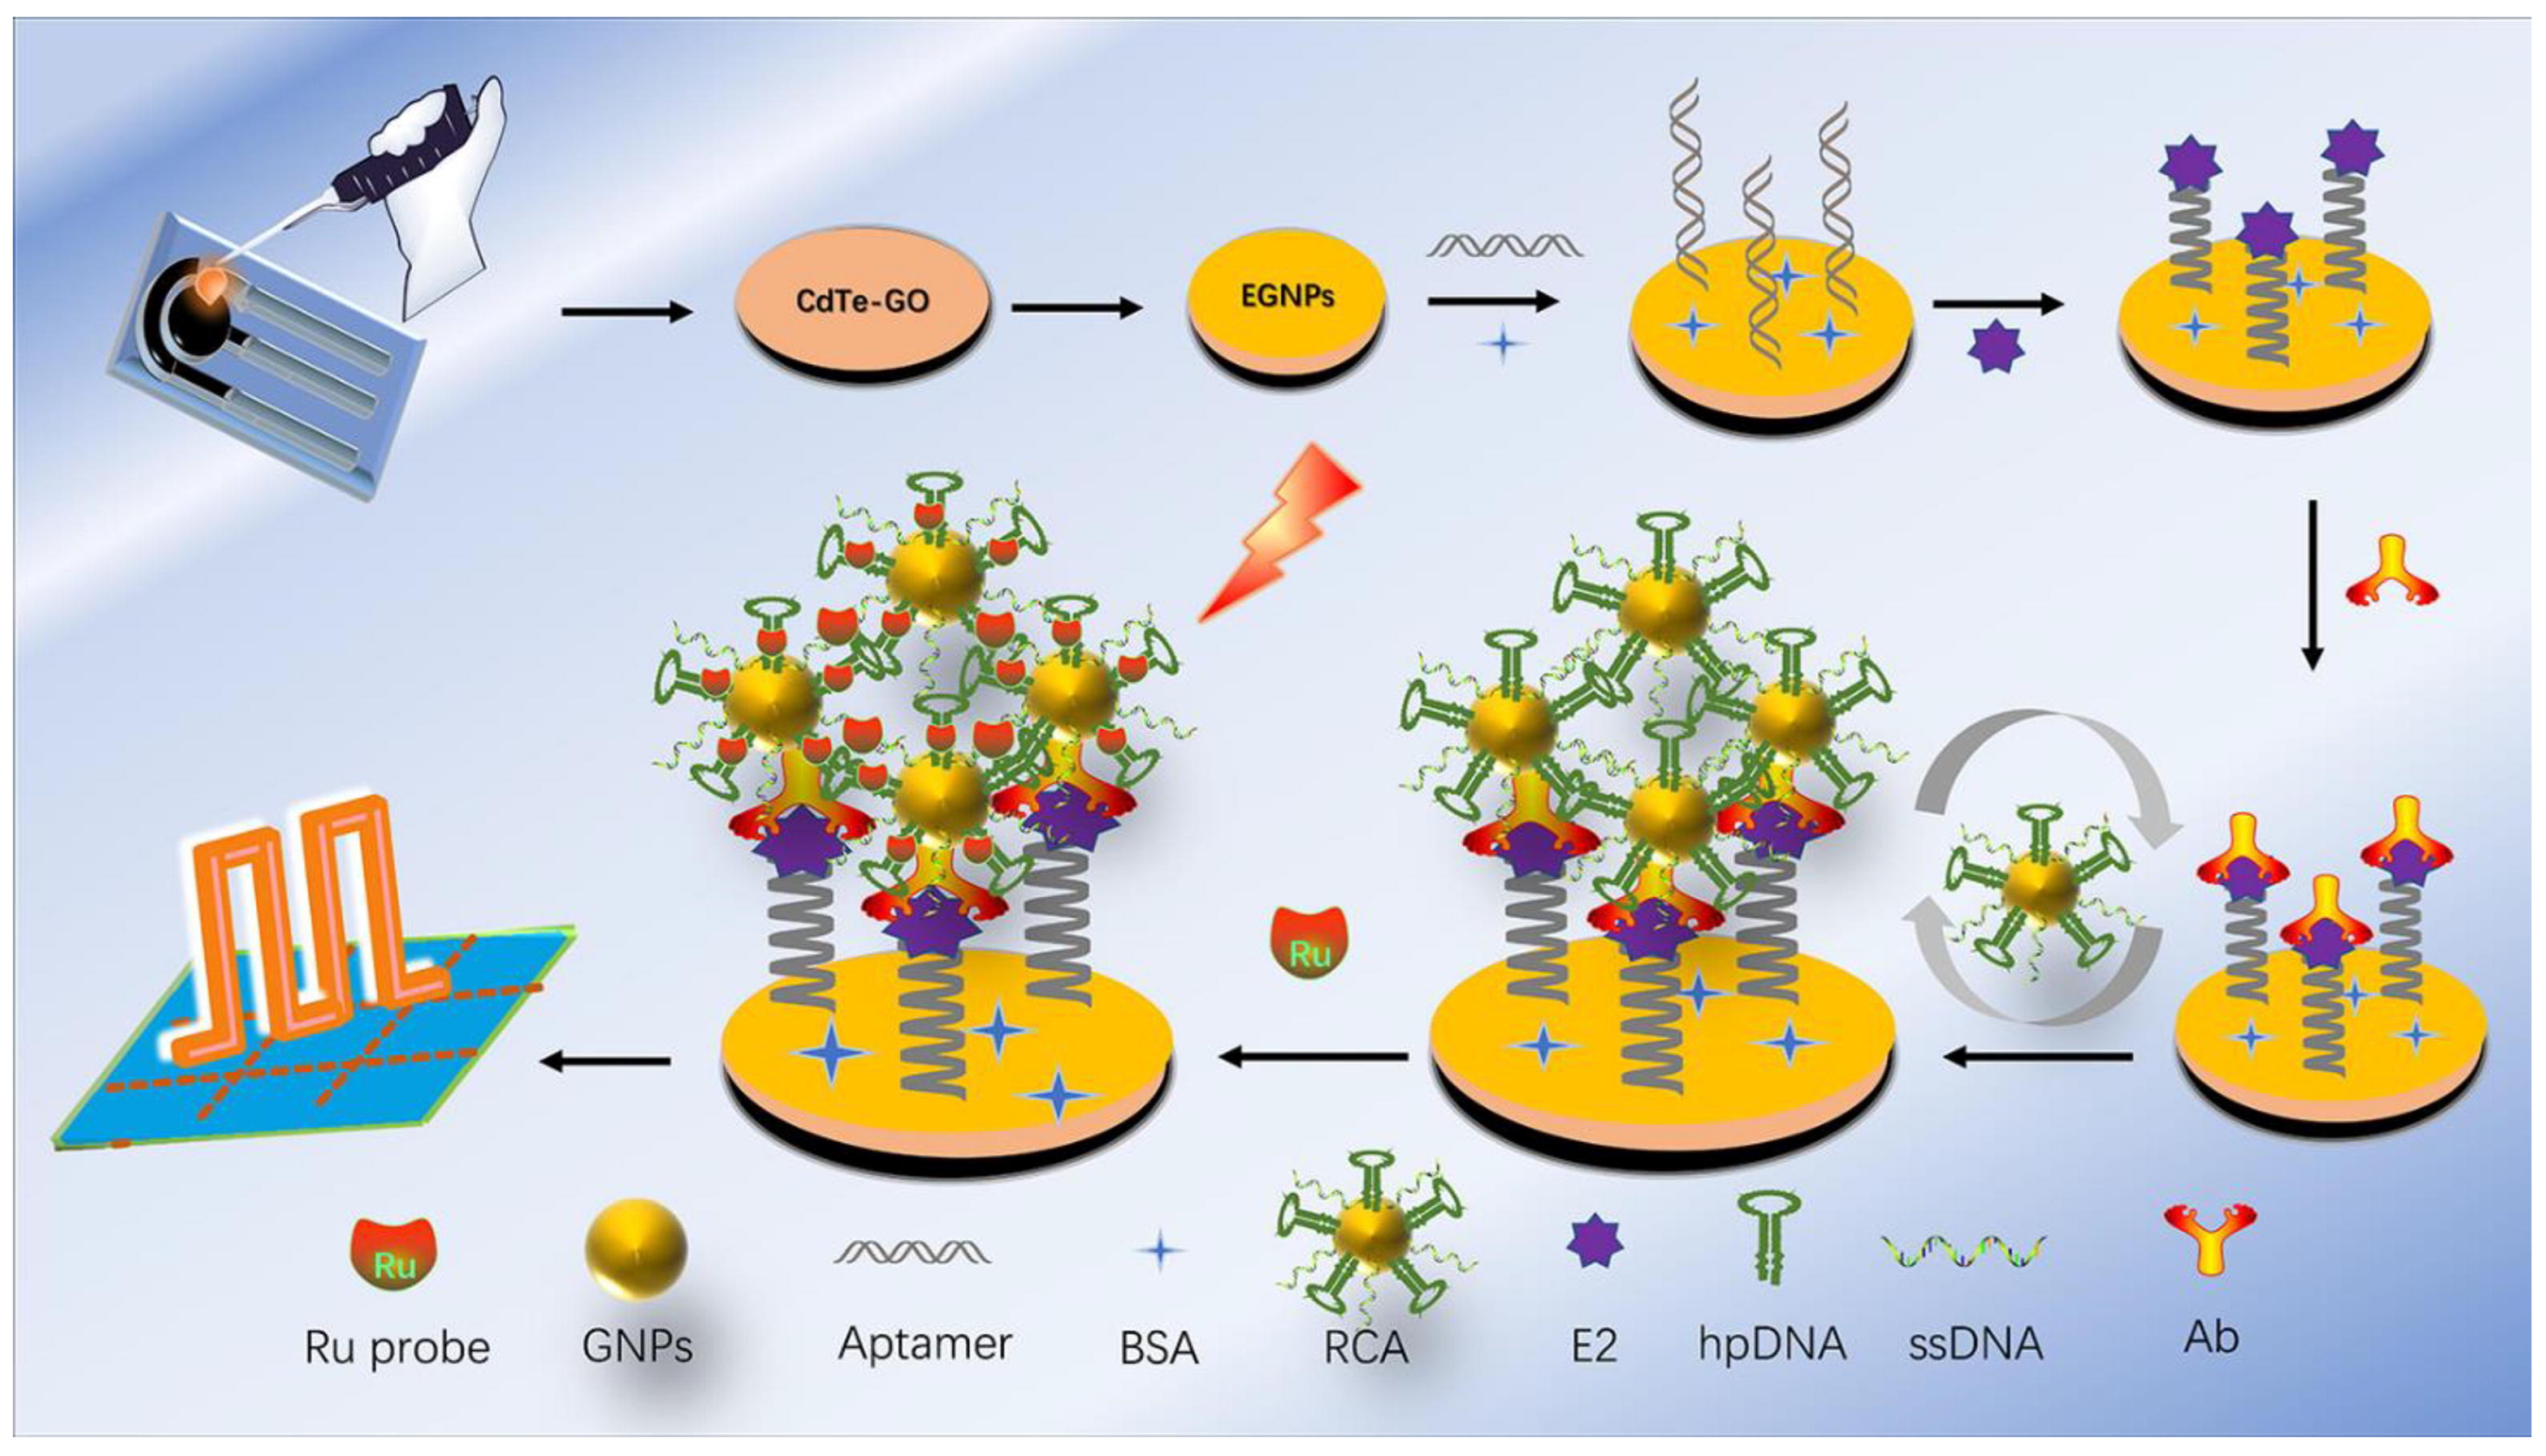
Photoelectrochemical (PEC) technologies for E2 detection with ultrahigh sensitivity were developed by Hao et al. [58]. Quantum dots of cadmium telluride (CdTe) were chemically conjugated with graphene oxide (GO) for photosensitive materials. CdTe quantum dots were chosen for a narrow emission spectral band in the visible region, wide absorption spectral band, and photochemical stability. GO conjugated with CdTe quantum dots could improve the photocurrent generation efficiency by reducing the unwanted recombination of photo-excited electron–hole pairs generated within quantum dots. As shown in Figure 11, the synthesized CdTe-GO was dropped onto a screen-printed electrode (SPE). Then, AuNPs were electrodeposited (EGNP) on its surface. Anti-E2 aptamers (35 mer) were immobilized on the EGNP surface, and bovine serum albumin (BSA) was subsequently deposited on part of the EGNP surface where aptamers were not immobilized, to avoid non-specific bonding. Then, E2 molecules were injected to specifically bind with aptamers. E2 antibodies were introduced for the double-aptamer–E2-antibody structure. The E2-containing electrodes and AuNPs (not the same as EGNP) were incubated with fragments obtained from rolling cycle amplification (RCA) to produce the composite electrode with AuNPs on which the number of hairpin DNA (hpDNA) and single-stranded DNA (ssDNA) was amplified, as shown in Figure 11. Ruthenium (Ru) probe molecules were labeled on the composite. The presence of AuNPs could increase the fluorescence intensity by 104-fold when Ru was combined with hpDNA. Finally, Ru fluorescence energy was converted to photocurrent by CdTe-GO material. When the specimen was taken from E2 solution with a DI water solvent, the PEC sensor for detecting E2 had an LOD of 0.01 pM (2.7 fg/mL) and a linear detection range from 0.04 to 10 pM (0.01–2.72 pg/mL). When specimens were taken from royal jelly, milk powder, and urine, the PEC sensor offered a minimum detectable concentration around 1 pM.
Ahn et al. [59] developed a liquid-crystal-based aptasensor for E2 detection. 4-cyano-4′-pentylbiphenyl liquid crystals (5CBs) filled a cell with its boundaries set by copper grids on an octyltrichlorosilane (OTS)-treated glass substrate. Cetyl trimethyl ammonium bromide (CTAB) was added to form an interface with 5CBs in a cell. Through the interface, 5CBs would be vertically aligned with the aid of an OTS group on the bottom of a glass substrate. Vertically aligned 5CBs formed a uniaxial crystal with its optic axis parallel to the major axis of a 5CB ellipse. When linearly polarized light was incident on the glass substrate along the optic axis, no change in polarization occurred during propagation through the cell. In this case, the cross-polarized analyzer setting allowed no transmission of light through it, making the corresponding image dark. However, if disturbing elements such as aptamers that had a net negative charge were injected into the cell, CTAB that was positively charged was attracted by aptamers. This caused a disruption in the 5CB vertical alignment and thus their uniaxial crystalline properties were broken, leading to a change in optical birefringence [111,112]. Consequently, the intensity of transmitted light through the analyzer would increase, making the corresponding image brighter. When injecting E2 molecules, they were specifically bound with aptamers. This prevented aptamers from disturbing the vertical alignment of 5CBs, eventually making the image darker. The gray-scaled luminescence from images was finally integrated into quantifiable intensity, being the foundation for the quantitative estimation of E2 molecules. This strategy obtained an LOD of 3.1 pM (0.8 pg/mL) for E2 solution with TBS buffer and 6.8 pM (1.9 pg/mL) for E2 in human urine. The liquid crystal technologies also turned out to be cost-effective without compromising the ultrahigh sensitivity.
7. Conclusions and Outlook
E2 detection at low concentrations is important in clinical practice and for the examination of environmental or food samples. The importance of detecting E2 with high accuracy at low concentrations has rapidly increased as environmental hormone issues arise and the early diagnosis of precocious puberty has continued to gain much attention. Given the fact that human urine involved much lower concentrations of E2 than human serum, a urine-based E2 test with ultrahigh sensitivity is becoming more important for children to whom multiple serum-based tests are not friendly. Following this trend, we focused on sensors capable of detecting E2 concentrations comparable to 1 pg/mL.
In this article, various strategies for detecting E2 with such ultrahigh sensitivity were reviewed. The strategies included those based on luminescence, electrochemical reaction, SERS, cantilever bending, photo-electrochemistry, electrophoresis, LC-MS, and liquid crystals. Although a few sensing methods show adequate sensitivity independently, various signal amplification techniques have been developed to achieve ultrahigh sensitivity in sensor systems. The highest sensitivity was reported when employing the LC-MS sensor, which used the molecular barcode assay for 10 ag/mL LOD. Nevertheless, AuNPs have mostly been widely used for signal enhancement due to their exceedingly large surface-to-volume ratio, chemical stability, capability of versatile biochemical treatment, and unique plasmon properties at visible wavelengths, and they are also well known as bio-compatible materials. The AuNPs reported in this review can function as nanoplatforms for preparing a large number of fluorescence labels, aptamers, or molecular barcode materials. AuNPs have also been used as fluorescence quenchers or SERS substrates. Table 2 shows a summary of characteristics of the reviewed ultrahigh-sensitivity E2 sensor in various categories of detection strategies such as detection mode, signal amplifying method, selectivity, LOD, sensing range, specimen types, and signal recovery.
However, there has been a lack of investigations of clinical urine samples, although the sensitivity of pre-developed sensors is adequate for quantifying serum E2 levels. Further studies are necessary to elucidate their clinical applications and their related engineering aspects. In this context, the biocompatibility of AuNPs can be utilized, along with their role in signal amplification, for clinical applications of the ultrahigh-sensitivity detection strategies reviewed in this article. Such ultrahigh-sensitivity strategies can be used for the non-invasive early diagnosis of precocious puberty.
Future studies on the practical applications of such ultrahigh-sensitivity E2 detection may be involved with increasing controllability of the size of the fabricated AuNPs and the homogeneity of their distribution to reduce signal fluctuation for precision diagnosis with a smaller standard deviation of sensing signals (a smaller coefficient of variation). Optical waveguides such as optical fibers that have been exploited to demonstrate various biochemical sensing platforms [113,114,115] can also be incorporated with AuNPs for ultrahigh-sensitivity E2 detection in a compact module enabling remote sensing. Further efforts may have to be exerted to enhance detection sensitivity in multiplexed assays involving E2 and testosterone in the presence of other types of interfering elements such as in human serum and urine.
Author Contributions
Conceptualization, H.J.; methodology, H.J. and J.S.S.; software, J.S.S.; validation, J.S.S. and H.J.; formal analysis, J.S.S. and H.J.; investigation, J.S.S. and H.J.; resources, H.J.; writing—original draft preparation, J.S.S. and H.J.; writing—review and editing, H.J.; visualization, J.S.S. and H.J.; supervision, H.J.; project administration, H.J.; funding acquisition, H.J. All authors have read and agreed to the published version of the manuscript.
Funding
This work was supported by the Gachon University Research Fund, 2020 (GCU-202004490001), and also supported by the National Research Foundation of Korea (NRF) grant funded by the Korean government (MSIT) (No. RS-2023-00279149).
Conflicts of Interest
The authors declare no conflict of interest.
References
- Rosner, W.; Hankinson, S.E.; Sluss, P.M.; Vesper, H.W.; Wierman, M.E. Challenges to the Measurement of Estradiol: An Endocrine Society Position Statement. J. Clin. Endocr. Metab. 2013, 98, 1376–1387. [Google Scholar] [CrossRef]
- Pu, H.B.; Huang, Z.B.; Sun, D.W.; Fu, H.H. Recent advances in the detection of 17β-estradiol in food matrices: A review. Crit. Rev. Food Sci. 2019, 59, 2144–2157. [Google Scholar] [CrossRef] [PubMed]
- Waifalkar, P.P.; Noh, D.; Derashri, P.; Barage, S.; Oh, E. Role of Estradiol Hormone in Human Life and Electrochemical Aptasensing of 17β-Estradiol: A Review. Biosensors 2022, 12, 1117. [Google Scholar] [CrossRef] [PubMed]
- Seeger, H.; Armbruster, F.P.; Mueck, A.O.; Lippert, T.H. The effect of estradiol on urodilatin production in postmenopausal women. Arch. Gynecol. Obstet. 1998, 262, 65–68. [Google Scholar] [CrossRef]
- Gleixner, A.; Meyer, H.H.D. Detection of estradiol and testosterone in hair of cattle by HPLC/EIA. Fresen J. Anal. Chem. 1997, 357, 1198–1201. [Google Scholar] [CrossRef]
- Geisler, J.; Berntsen, H.; Lonning, P.E. A novel HPLC-RIA method for the simultaneous detection of estrone, estradiol and estrone sulphate levels in breast cancer tissue. J. Steroid Biochem. 2000, 72, 259–264. [Google Scholar] [CrossRef]
- Yasui, T.; Uemura, H.; Umino, Y.; Takikawa, M.; Kuwahara, A.; Saito, S.; Matsuzaki, T.; Maegawa, M.; Furumoto, H.; Miura, M.; et al. Serum estradiol concentration as measured by HPLC-RIA and bone mineral density in postmenopausal women during hormone replacement therapy. Horm. Res. 2004, 61, 117–125. [Google Scholar] [CrossRef] [PubMed]
- Szarka, S.; Nguyen, V.; Prokai, L.; Prokai-Tatrai, K. Separation of dansylated 17β-estradiol, 17α-estradiol, and estrone on a single HPLC column for simultaneous quantitation by LC-MS/MS. Anal. Bioanal. Chem. 2013, 405, 3399–3406. [Google Scholar] [CrossRef]
- Yakupova, Z.R.; Lebedinets, S.A.; Vakh, K.S.; Garmonov, S.Y.; Bulatov, A.V. Microextraction of 17-β-Estradiol from Medicinal Preparations for the Subsequent Determination by HPLC-UV. J. Anal. Chem. 2022, 77, 342–346. [Google Scholar] [CrossRef]
- Laboratories, M.C. Estradiol, Serum. Available online: https://pediatric.testcatalog.org/show/EEST (accessed on 29 December 2023).
- Wheeler, M.D.; Styne, D.M. Diagnosis and management of precocious puberty. Pediatr. Clin. N. Am. 1990, 37, 1255–1271. [Google Scholar] [CrossRef]
- Jenner, M.R.; Kelch, R.P.; Kaplan, S.L.; Grumbach, M.M. Hormonal changes in puberty. IV. Plasma estradiol, LH, and FSH in prepubertal children, pubertal females, and in precocious puberty, premature thelarche, hypogonadism, and in a child with a feminizing ovarian tumor. J. Clin. Endocrinol. Metab. 1972, 34, 521–530. [Google Scholar] [CrossRef] [PubMed]
- Aksglaede, L.; Juul, A.; Leffers, H.; Skakkebaek, N.E.; Andersson, A.M. The sensitivity of the child to sex steroids: Possible impact of exogenous estrogens. Hum. Reprod. Update 2006, 12, 341–349. [Google Scholar] [CrossRef] [PubMed]
- Lee, P.A. Advances in the management of precocious puberty. Clin. Pediatr. 1994, 33, 54–61. [Google Scholar] [CrossRef]
- Endocrinolgy, T.K.S.o.P. The Korean Society of Pediatric Endocrinolgy’s Clinical Guidelines; The Korean Society of Pediatric Endocrinolgy: Seoul, Republic of Korea, 2011. [Google Scholar]
- D’Alessandro, P.R.; Hamilton, J.; Khatchadourian, K.; Lunaczek-Motyka, E.; Schultz, K.R.; Metzger, D.; Deyell, R.J. Precocious puberty: A red flag for malignancy in childhood. Br. Columbia Med. J. 2021, 63, 242–246. [Google Scholar]
- Coburn, S.B.; Stanczyk, F.Z.; Falk, R.T.; McGlynn, K.A.; Brinton, L.A.; Sampson, J.; Bradwin, G.; Xu, X.; Trabert, B. Comparability of serum, plasma, and urinary estrogen and estrogen metabolite measurements by sex and menopausal status. Cancer Causes Control 2019, 30, 75–86. [Google Scholar] [CrossRef] [PubMed]
- Newman, M.; Pratt, S.M.; Curran, D.A.; Stanczyk, F.Z. Evaluating urinary estrogen and progesterone metabolites using dried filter paper samples and gas chromatography with tandem mass spectrometry (GC-MS/MS). BMC Chem. 2019, 13, 20. [Google Scholar] [CrossRef] [PubMed]
- Pattnaik, S.; Das, D.; Venkatesan, V.A.; Rai, A. Predicting serum hormone concentration by estimation of urinary hormones through a home-use device. Hum. Reprod. Open 2022, 2023, hoac058. [Google Scholar] [CrossRef] [PubMed]
- Chotboon, C.; Salang, L.; Buppasiri, P.; Amnatbuddee, S.; Eamudomkarn, N. Association between urine and serum estradiol levels in in vitro fertilization cycles. Sci. Rep. 2022, 12, 4393. [Google Scholar] [CrossRef] [PubMed]
- Gulamhusein, N.; Miranda, K.T.; Ahmed, S.B.; Leung, A.A.; Tang, K.L.; Adekanye, J.; Butalia, S. Measurements of Postmenopausal Serum Estradiol Levels and Cardiovascular Events: A Systematic Review. CJC Open 2023, 6, 347–354. [Google Scholar] [CrossRef]
- Penning, T.M.; Lee, S.H.; Jin, Y.; Gutierrez, A.; Blair, I.A. Liquid chromatography-mass spectrometry (LC-MS) of steroid hormone metabolites and its applications. J. Steroid Biochem. 2010, 121, 546–555. [Google Scholar] [CrossRef]
- Liu, J.; Bai, W.; Niu, S.; Zhu, C.; Yang, S.; Chen, A. Highly sensitive colorimetric detection of 17beta-estradiol using split DNA aptamers immobilized on unmodified gold nanoparticles. Sci. Rep. 2014, 4, 7571. [Google Scholar] [CrossRef]
- Mbomson, I.; McMeekin, S.; Lahiri, B.; De La Rue, R.; Johnson, N. Gold asymmetric split ring resonators (A-SRRs) for nano sensing of estradiol. In Proceedings of the SPIE Photonics Europe, Brussels, Belgium, 14–17 April 2014. [Google Scholar]
- Alsager, O.A.; Kumar, S.; Zhu, B.C.; Travas-Sejdic, J.; McNatty, K.P.; Hodgkiss, J.M. Ultrasensitive Colorimetric Detection of 17β-Estradiol: The Effect of Shortening DNA Aptamer Sequences. Anal. Chem. 2015, 87, 4201–4209. [Google Scholar] [CrossRef] [PubMed]
- Arcadio, F.; Seggio, M.; Zeni, L.; Bossi, A.M.; Cennamo, N. Estradiol Detection for Aquaculture Exploiting Plasmonic Spoon-Shaped Biosensors. Biosensors 2023, 13, 432. [Google Scholar] [CrossRef]
- Jin, H.Y.; Cheng, Y.; Kong, F.L.; Huang, H.; Yang, Z.J.; Wang, X.Y.; Cai, X.X.; Luo, J.P.; Ming, T. Design and Validation of a Short Novel Estradiol Aptamer and Exploration of Its Application in Sensor Technology. Molecules 2024, 29, 535. [Google Scholar] [CrossRef]
- Li, Y.; Su, R.; Xu, J.; Bie, J.; Sun, R.; Wang, L.; Liu, X.; Sun, C. Aptamers-Based Sensing Strategy for 17beta-Estradiol Through Fluorescence Resonance Energy Transfer Between Oppositely Charged CdTe Quantum Dots and Gold Nanoparticles. J. Nanosci. Nanotechnol. 2018, 18, 1517–1527. [Google Scholar] [CrossRef] [PubMed]
- Du, L.Y.; Ji, W.; Zhang, Y.F.; Zhang, C.Y.; Liu, G.F.; Wang, S.H. An ultrasensitive detection of 17β-estradiol using a gold nanoparticle-based fluorescence immunoassay. Analyst 2015, 140, 2001–2007. [Google Scholar] [CrossRef]
- Dong, X.; Zhao, G.H.; Li, Y.Y.; Zeng, Q.Z.; Ma, H.M.; Wu, D.; Ren, X.; Wei, Q.; Ju, H.X. Dual-Mechanism Quenching of Electrochemiluminescence Immunosensor Based on a Novel ECL Emitter Polyoxomolybdate-Zirconia for 17β-Estradiol Detection. Anal. Chem. 2022, 94, 12742–12749. [Google Scholar] [CrossRef] [PubMed]
- Zhang, Y.J.; Jia, L.C.; Wang, W.; Jiang, M.; Zhang, H.Y.; Niu, L.M. A novel fluorescent sensor based on aptamer recognition and DNA walker amplification strategy and its determination of 17β-estradiol. Arab. J. Chem. 2023, 16, 105340. [Google Scholar] [CrossRef]
- Qi, X.; Hu, H.; Yang, Y.; Piao, Y. Graphite nanoparticle as nanoquencher for 17beta-estradiol detection using shortened aptamer sequence. Analyst 2018, 143, 4163–4170. [Google Scholar] [CrossRef]
- Brognara, A.; Mohamad Ali Nasri, I.F.; Bricchi, B.R.; Li Bassi, A.; Gauchotte-Lindsay, C.; Ghidelli, M.; Lidgi-Guigui, N. Highly sensitive detection of estradiol by a SERS sensor based on TiO(2) covered with gold nanoparticles. Beilstein J. Nanotechnol. 2020, 11, 1026–1035. [Google Scholar] [CrossRef]
- Wang, Z.; Wang, J.J.; Lai, Y.; Wei, Z.; Li, J. Rapid detection of estrogen compounds using surface-enhanced Raman spectroscopy with a Zn/Au-Ag/Ag sandwich-structured substrate. Opt. Mater. 2021, 112, 110759. [Google Scholar] [CrossRef]
- Wang, R.; Chon, H.; Lee, S.; Cheng, Z.Y.; Hong, S.H.; Yoon, Y.H.; Choo, J. Highly Sensitive Detection of Hormone Estradiol E2 Using Surface-Enhanced Raman Scattering Based Immunoassays for the Clinical Diagnosis of Precocious Puberty. ACS Appl. Mater. Interfaces 2016, 8, 10665–10672. [Google Scholar] [CrossRef] [PubMed]
- Wang, X.Y.; Song, M.X.; Wang, Y.H.; Deng, W.; Li, D. Peak-differentiation-imitating-assisted SERS strategy for the accurate detection of estrogens at the femtomole level. Chem. Commun. 2022, 58, 13887–13890. [Google Scholar] [CrossRef]
- Zhang, M.M.; Wu, Z.Y.; Yang, Y.H.; Ye, J.; Han, S.; Li, Y.T. Fabrication of molecularly-imprinted gold nanoparticle-embedded Fe-MOFs for highly selective SERS detection of 17β-estradiol in milk. Analyst 2023, 148, 2472–2481. [Google Scholar] [CrossRef] [PubMed]
- Li, C.N.; He, X.; Li, H.; Xiao, Y.; Xu, X.A.; Jiang, C.A.; Wen, G.Q.; Jiang, Z.L. A new COF@AuNC catalytic amplification-aptamer SERS quantitative analysis method for trace estradiol with nanoreaction of HAuCl4-sulfite. Microchem. J. 2023, 191, 108920. [Google Scholar] [CrossRef]
- Wang, S.; Li, Y.; Ding, M.; Wu, X.; Xu, J.; Wang, R.; Wen, T.; Huang, W.; Zhou, P.; Ma, K.; et al. Self-assembly molecularly imprinted polymers of 17beta-estradiol on the surface of magnetic nanoparticles for selective separation and detection of estrogenic hormones in feeds. J. Chromatogr. B Analyt Technol. Biomed. Life Sci. 2011, 879, 2595–2600. [Google Scholar] [CrossRef] [PubMed]
- Özcan, A.; Topçuoğulları, D.; Atılır Özcan, A. Voltammetric Determination of Estradiol in Milk and Pharmaceuticals Based on Fumed-Silica Modified Carbon Paste Electrode. Anadolu Univ. J. Sci. Technol.-A Appl. Sci. Eng. 2018, 19, 963–975. [Google Scholar] [CrossRef]
- Masikini, M.; Ghica, M.E.; Baker, P.G.L.; Iwuoha, E.I.; Brett, C.M.A. Electrochemical Sensor Based on Multi-walled Carbon Nanotube/Gold Nanoparticle Modified Glassy Carbon Electrode for Detection of Estradiol in Environmental Samples. Electroanalysis 2019, 31, 1925–1933. [Google Scholar] [CrossRef]
- Spychalska, K.; Zajac, D.; Cabaj, J. Electrochemical biosensor for detection of 17beta-estradiol using semi-conducting polymer and horseradish peroxidase. RSC Adv. 2020, 10, 9079–9087. [Google Scholar] [CrossRef]
- Spychalska, K.; Baluta, S.; Świst, A.; Cabaj, J. Biosensors for β17-estradiol detection based on graphene quantum dots (GQDs)/conducting polymer and laccase modified platinum/gold electrodes. Int. J. Electrochem. Sci. 2020, 15, 3127–3142. [Google Scholar] [CrossRef]
- Guo, M.; Cui, X.; Wang, L.; Yang, K.; Xu, J.; Yu, L.; Luo, Z.; Zeng, A.; Zhang, J.; Fu, Q. Electrochemical Sensor Based on Poly-L-Tyrosine/AuNCs/PDA-CNTs Nanocomposites for the Detection of 17β-Estradiol in Wastewater. J. Electrochem. Soc. 2022, 169, 107506. [Google Scholar] [CrossRef]
- Zhang, T.; Du, X.; Zhang, Z. Advances in electrochemical sensors based on nanomaterials for the detection of lipid hormone. Front. Bioeng. Biotechnol. 2022, 10, 993015. [Google Scholar] [CrossRef]
- Zhang, X.Y.; Peng, Y.; Bai, J.L.; Ning, B.A.; Sun, S.M.; Hong, X.D.; Liu, Y.Y.; Liu, Y.; Gao, Z.X. A novel electrochemical sensor based on electropolymerized molecularly imprinted polymer and gold nanomaterials amplification for estradiol detection. Sens. Actuators B-Chem. 2014, 200, 69–75. [Google Scholar] [CrossRef]
- Florea, A.; Cristea, C.; Vocanson, F.; Sandulescu, R.; Jaffrezic-Renault, N. Electrochemical sensor for the detection of estradiol based on electropolymerized molecularly imprinted polythioaniline film with signal amplification using gold nanoparticles. Electrochem. Commun. 2015, 59, 36–39. [Google Scholar] [CrossRef]
- Dai, Y.F.; Liu, C.C. Detection of 17 β-Estradiol in Environmental Samples and for Health Care Using a Single-Use, Cost-Effective Biosensor Based on Differential Pulse Voltammetry (DPV). Biosensors 2017, 7, 15. [Google Scholar] [CrossRef]
- Kim, Y.S.; Jung, H.S.; Matsuura, T.; Lee, H.Y.; Kawai, T.; Gu, M.B. Electrochemical detection of 17β-estradiol using DNA aptamer immobilized gold electrode chip. Biosens. Bioelectron. 2007, 22, 2525–2531. [Google Scholar] [CrossRef]
- Domènech, A.; Pich, S.; Arís, A.; Plasencia, C.; Bach, A.; Serrano, A. Heat identification by 17β-estradiol and progesterone quantification in individual raw milk samples by enzyme immunoassay. Electron. J. Biotechnol. 2011, 14, 10. [Google Scholar]
- Chiu, M.L.; Tseng, T.T.; Monbouquette, H.G. A convenient homogeneous enzyme immunoassay for estradiol detection. Biotechnol. Appl. Biochem. 2011, 58, 75–82. [Google Scholar] [CrossRef]
- Huang, Y.; Zhang, L.; Li, Z.Z.; Gopinath, S.C.B.; Chen, Y.; Xiao, Y. Aptamer-17β-estradiol-antibody sandwich ELISA for determination of gynecological endocrine function. Biotechnol. Appl. Biochem. 2021, 68, 881–888. [Google Scholar] [CrossRef]
- Akki, S.U.; Werth, C.J.; Silverman, S.K. Selective Aptamers for Detection of Estradiol and Ethynylestradiol in Natural Waters. Environ. Sci. Technol. 2015, 49, 9905–9913. [Google Scholar] [CrossRef]
- Harnsoongnoen, S.; Loutchanwoot, P.; Srivilai, P. Sensing High 17β-Estradiol Concentrations Using a Planar Microwave Sensor Integrated with a Microfluidic Channel. Biosensors 2023, 13, 541. [Google Scholar] [CrossRef]
- Tu, L.H.; Zhu, J.H.; Tanjung, A.P.; Wang, M.; Kang, J.; Wang, A.J.; Mei, L.P.; Xue, Y.; Song, P. A signal-off photoelectrochemical aptasensor for ultrasensitive 17beta-estradiol detection based on rose-like CdS@C nanostructure and enzymatic amplification. Mikrochim. Acta 2022, 189, 56. [Google Scholar] [CrossRef]
- Lee, H.; Kim, K.H.; Lee, K.H. Non-invasive molecular barcode assay for diagnosis of sex hormones correlated with precocious puberty. Sens. Actuators B-Chem. 2019, 282, 399–407. [Google Scholar] [CrossRef]
- de Cezaro, A.M.; Rigo, A.A.; Martinazzo, J.; Muenchen, D.K.; Manzoli, A.; Correa, D.S.; Steffens, J.; Steffens, C. Cantilever Nanobiosensor Functionalized with Tyrosinase for Detection of Estrone and β-estradiol in Water. Appl. Biochem. Biotech. 2020, 190, 1512–1524. [Google Scholar] [CrossRef]
- Hao, X.F.; Guan, Y.; Liu, F.; Zhang, Y.J.; Zhai, Y.J.; Niu, L.M. Ultrasensitive detection and application of estradiol based on nucleic acid aptamer and circulating amplification technology. J. Electroanal. Chem. 2022, 913, 116284. [Google Scholar] [CrossRef]
- Ahn, J.S.; Jang, C.H. Sensitive detection of 17β-estradiol at a picomolar level using an aptamer-assisted liquid crystal-based optical sensor. Anal. Bioanal. Chem. 2023, 415, 6323–6332. [Google Scholar] [CrossRef]
- Yaqoob, S.B.; Adnan, R.; Khan, R.M.R.; Rashid, M. Gold, Silver, and Palladium Nanoparticles: A Chemical Tool for Biomedical Applications. Front. Chem. 2020, 8, 376. [Google Scholar] [CrossRef]
- Kang, H.; Buchman, J.T.; Rodriguez, R.S.; Ring, H.L.; He, J.Y.; Bantz, K.C.; Haynes, C.L. Stabilization of Silver and Gold Nanoparticles: Preservation and Improvement of Plasmonic Functionalities. Chem. Rev. 2019, 119, 664–699. [Google Scholar] [CrossRef]
- Liao, C.Z.; Li, Y.C.; Tjong, S.C. Bactericidal and Cytotoxic Properties of Silver Nanoparticles. Int. J. Mol. Sci. 2019, 20, 449. [Google Scholar] [CrossRef]
- Krishnaveni, V.; DMello, M.E.; Sahoo, P.; Thokala, N.; Bakuru, V.R.; Vankayala, K.; Basavaiah, K.; Kalidindi, S.B. Palladium-Nanoparticle-Decorated Covalent Organic Framework Nanosheets for Effective Hydrogen Gas Sensors. ACS Appl. Nano Mater. 2023, 6, 10960–10966. [Google Scholar] [CrossRef]
- Liu, P.S.; Wang, H.; Li, X.M.; Rui, M.C.; Zeng, H.B. Localized surface plasmon resonance of Cu nanoparticles by laser ablation liquid media. RSC Adv. 2015, 5, 79738–79745. [Google Scholar] [CrossRef]
- Jeyaraj, M.; Gurunathan, S.; Qasim, M.; Kang, M.H.; Kim, J.H. A Comprehensive Review on the Synthesis, Characterization, and Biomedical Application of Platinum Nanoparticles. Nanomaterials 2019, 9, 1719. [Google Scholar] [CrossRef]
- de la Rosa, S.Y.G.; Diaz, R.M.; Gutiérrez, P.T.V.; Patakfalvi, R.; Coronado, O.G. Functionalized Platinum Nanoparticles with Biomedical Applications. Int. J. Mol. Sci. 2022, 23, 9404. [Google Scholar] [CrossRef]
- Sadique, M.A.; Yadav, S.; Khare, V.; Khan, R.; Tripathi, G.K.; Khare, P.S. Functionalized Titanium Dioxide Nanoparticle-Based Electrochemical Immunosensor for Detection of SARS-CoV-2 Antibody. Diagnostics 2022, 12, 2612. [Google Scholar] [CrossRef]
- Wei, Q.Y.; Zhang, P.Y.; Pu, H.B.; Sun, D.W. A fluorescence aptasensor based on carbon quantum dots and magnetic Fe3O4 nanoparticles for highly sensitive detection of 17β-estradiol. Food Chem. 2022, 373, 131591. [Google Scholar] [CrossRef]
- Kaushal, S.; Nanda, S.S.; Yi, D.K.; Ju, H. Effects of Aspect Ratio Heterogeneity of an Assembly of Gold Nanorod on Localized Surface Plasmon Resonance. J. Phys. Chem. Lett. 2020, 11, 5972–5979. [Google Scholar] [CrossRef]
- Seok, J.S.; Ju, H. Plasmonic Optical Biosensors for Detecting C-Reactive Protein: A Review. Micromachines 2020, 11, 895. [Google Scholar] [CrossRef]
- Tran, N.H.T.; Phan, T.B.; Nguyen, T.T.; Ju, H. Coupling of silver nanoparticle-conjugated fluorescent dyes into optical fiber modes for enhanced signal-to-noise ratio. Biosens. Bioelectron. 2021, 176, 112900. [Google Scholar] [CrossRef]
- Tran, V.T.; Ju, H. Fluorescence Enhancement via Dual Coupling of Dye Molecules with Silver Nanostructures. Chemosensors 2021, 9, 217. [Google Scholar] [CrossRef]
- Phuong, N.T.T.; Dang, V.Q.; Hieu, L.V.; Bach, T.N.; Khuyen, B.X.; Ta, H.K.T.; Ju, H.; Phan, B.T.; Tran, N.H.T. Functionalized silver nanoparticles for SERS amplification with enhanced reproducibility and for ultrasensitive optical fiber sensing in environmental and biochemical assays. RSC Adv. 2022, 12, 31352–31362. [Google Scholar] [CrossRef]
- Phuong, N.T.T.; Phung, V.D.; Le, T.B.N.; Chi, T.; Hien, B.T.T.; Tho, L.H.; Mai, N.X.D.; Phan, T.B.; Tran, N.H.T.; Ju, H.K.Y. Ultrasensitive Monitoring of Cyanide Concentrations in Water Using a Au-Ag Hybrid-Coating-Based Fiber Optical Sensor. Langmuir 2023, 39, 15799–15807. [Google Scholar] [CrossRef] [PubMed]
- Rajamanikandan, R.; Ilanchelian, M.; Ju, H. β-cyclodextrin functionalized gold nanoparticles as an effective nanocatalyst for reducing toxic nitroaromatics. Opt. Mater. 2023, 135, 113294. [Google Scholar] [CrossRef]
- Rajamanikandan, R.; Shanmugaraj, K.; Ilanchelian, M.; Ju, H. Cysteamine-decorated gold nanoparticles for plasmon-based colorimetric on-site sensors for detecting cyanide ions using the smart-phone color ratio and for catalytic reduction of 4-nitrophenol. Chemosphere 2023, 316, 137836. [Google Scholar] [CrossRef]
- Rajamanikandan, R.; Sasikumar, K.; Kosame, S.; Ju, H.K.Y. Optical Sensing of Toxic Cyanide Anions Using Noble Metal Nanomaterials. Nanomaterials 2023, 13, 290. [Google Scholar] [CrossRef] [PubMed]
- Kim, J.; Son, C.; Choi, S.; Yoon, W.J.; Ju, H. A Plasmonic Fiber Based Glucometer and Its Temperature Dependence. Micromachines 2018, 9, 506. [Google Scholar] [CrossRef] [PubMed]
- Tran, V.T.; Yoon, W.J.; Lee, J.H.; Ju, H. DNA sequence-induced modulation of bimetallic surface plasmons in optical fibers for sub-ppq (parts-per-quadrillion) detection of mercury ions in water. J. Mater. Chem. A 2018, 6, 23894–23902. [Google Scholar] [CrossRef]
- Cao, X.D.; Ye, Y.K.; Liu, S.Q. Gold nanoparticle-based signal amplification for biosensing. Anal. Biochem. 2011, 417, 1–16. [Google Scholar] [CrossRef]
- Hong, X.; Hall, E.A.H. Contribution of gold nanoparticles to the signal amplification in surface plasmon resonance. Analyst 2012, 137, 4712–4719. [Google Scholar] [CrossRef]
- Huang, J.Y.; Lin, H.T.; Chen, T.H.; Chen, C.A.; Chang, H.T.; Chen, C.F. Signal Amplified Gold Nanoparticles for Cancer Diagnosis on Paper-Based Analytical Devices. ACS Sens. 2018, 3, 174–182. [Google Scholar] [CrossRef]
- Bezuneh, T.T.; Fereja, T.H.; Kitte, S.A.; Li, H.J.; Jin, Y.D. Gold nanoparticle-based signal amplified electrochemiluminescence for biosensing applications. Talanta 2022, 248, 123611. [Google Scholar] [CrossRef]
- Kadhim, R.J.; Karsh, E.H.; Taqi, Z.J.; Jabir, M.S. Biocompatibility of gold nanoparticles: In-vitro and In-vivo study. Mater. Today Proc. 2021, 42, 3041–3045. [Google Scholar] [CrossRef]
- Xu, J.; Sahu, S.; Cao, L.; Bunker, C.E.; Peng, G.; Liu, Y.M.; Fernando, K.A.S.; Wang, P.; Guliants, E.A.; Meziani, M.J.; et al. Efficient Fluorescence Quenching in Carbon Dots by Surface-Doped Metals–Disruption of Excited State Redox Processes and Mechanistic Implications. Langmuir 2012, 28, 16141–16147. [Google Scholar] [CrossRef] [PubMed]
- Kim, D.; Yokota, H.; Taniguchi, T.; Nakayama, M. Precise control of photoluminescence enhancement and quenching of semiconductor quantum dots using localized surface plasmons in metal nanoparticles. J. Appl. Phys. 2013, 114, 154307. [Google Scholar] [CrossRef]
- Samanta, A.; Zhou, Y.D.; Zou, S.L.; Yan, H.; Liu, Y. Fluorescence Quenching of Quantum Dots by Gold Nanoparticles: A Potential Long Range Spectroscopic Ruler. Nano Lett. 2014, 14, 5052–5057. [Google Scholar] [CrossRef] [PubMed]
- Pawar, S.; Duadi, H.; Fleger, Y.; Fixler, D. Design and Use of a Gold Nanoparticle-Carbon Dot Hybrid for a FLIM-Based IMPLICATION Nano Logic Gate. ACS Omega 2022, 7, 22818–22824. [Google Scholar] [CrossRef] [PubMed]
- Hildebrandt, N.; Lim, M.; Kim, N.; Choi, D.; Nam, J.M. Plasmonic quenching and enhancement: Metal-quantum dot nanohybrids for fluorescence biosensing. Chem. Commun. 2023, 59, 2352–2380. [Google Scholar] [CrossRef] [PubMed]
- Tran, V.T.; Ju, H. Fluorescence Based on Surface Plasmon Coupled Emission for Ultrahigh Sensitivity Immunoassay of Cardiac Troponin I. Biomedicines 2021, 9, 448. [Google Scholar] [CrossRef]
- Tran, V.T.; Seok, J.S.; Yoon, I.; Ju, H. Ultraviolet Fluorescence-Based Quantitative Detection of Polycyclic Aromatic Hydrocarbons. BioChip J. 2021, 15, 356–361. [Google Scholar] [CrossRef]
- Rajamanikandan, R.; Ilanchelian, M.; Ju, H. Highly Selective Uricase-Based Quantification of Uric Acid Using Hydrogen Peroxide Sensitive Poly-(vinylpyrrolidone) Templated Copper Nanoclusters as a Fluorescence Probe. Chemosensors 2023, 11, 268. [Google Scholar] [CrossRef]
- Sasikumar, K.; Rajamanikandan, R.; Ju, H. Fluorescent carbon dots for highly sensitive bilirubin sensing with excellent selectivity. J. Sci.-Adv. Mater. Dev. 2023, 8, 100599. [Google Scholar] [CrossRef]
- Sasikumar, K.; Rajamanikandan, R.; Ju, H. Nitrogen- and Sulfur-Codoped Strong Green Fluorescent Carbon Dots for the Highly Specific Quantification of Quercetin in Food Samples. Materials 2023, 16, 7686. [Google Scholar] [CrossRef]
- Galarreta, B.C.; Rupar, I.; Young, A.; Lagugné-Labarthet, F. Mapping Hot-Spots in Hexagonal Arrays of Metallic Nanotriangles with Azobenzene Polymer Thin Films. J. Phys. Chem. C 2011, 115, 15318–15323. [Google Scholar] [CrossRef]
- Pavaskar, P.; Theiss, J.; Cronin, S.B. Plasmonic hot spots: Nanogap enhancement vs. focusing effects from surrounding nanoparticles. Opt. Express 2012, 20, 14656–14662. [Google Scholar] [CrossRef] [PubMed]
- Wang, X.; Liu, C.X.; Gao, C.C.; Yao, K.L.; Masouleh, S.S.M.; Berte, R.; Ren, H.R.; Menezes, L.D.; Cortes, E.; Bicket, I.C.; et al. Self-Constructed Multiple Plasmonic Hotspots on an Individual Fractal to Amplify Broadband Hot Electron Generation. ACS Nano 2021, 15, 10553–10564. [Google Scholar] [CrossRef] [PubMed]
- Gabudean, A.M.; Biro, D.; Astilean, S. Localized surface plasmon resonance (LSPR) and surface-enhanced Raman scattering (SERS) studies of 4-aminothiophenol adsorption on gold nanorods. J. Mol. Struct. 2011, 993, 420–424. [Google Scholar] [CrossRef]
- Cialla, D.; März, A.; Böhme, R.; Theil, F.; Weber, K.; Schmitt, M.; Popp, J. Surface-enhanced Raman spectroscopy (SERS): Progress and trends. Anal. Bioanal. Chem. 2012, 403, 27–54. [Google Scholar] [CrossRef]
- Turino, M.; Pazos-Perez, N.; Guerrini, L.; Alvarez-Puebla, R.A. Positively-charged plasmonic nanostructures for SERS sensing applications. RSC Adv. 2021, 12, 845–859. [Google Scholar] [CrossRef] [PubMed]
- An, N.T.; Ta, H.K.T.; Van Hoang, D.; Phung, V.D.; Tran, N.H.T.; Phan, B.T. Multilayer Graphene Oxide-Silver Nanoparticles for Stable, Highly Sensitive, and Reusable SERS Platforms. Chemnanomat 2023, 9, e20220516. [Google Scholar]
- Yu, T.H.; Ho, C.H.; Wu, C.Y.; Chien, C.H.; Lin, C.H.; Lee, S. Metal-organic frameworks: A novel SERS substrate. J. Raman Spectrosc. 2013, 44, 1506–1511. [Google Scholar] [CrossRef]
- Tran, N.L.N.; Phan, B.T.; Ta, H.K.T.; Chi, T.T.K.; Hien, B.T.T.; Phuong, N.T.T.; Nguyen, C.C.; Doan, T.L.H.; Tran, N.H.T. Gold nanoparticles are capped under the IRMOF-3 platform for in-situ surface-enhanced Raman scattering technique and optic fiber sensor. Sens. Actuators A-Phys. 2022, 347, 113932. [Google Scholar] [CrossRef]
- Tran, N.L.N.; Nguyen, T.A.; Doan, T.L.H.; Nguyen, H.V.T.; Huong, V.T.; Tran, T.T.V.; Ju, H.; Huy, T.H.; Le, H.V.; Tran, N.H.T. Stacking-order Reversed Multilayers of ZIF-8 and Silver Nanoparticles for the SERS Detection of Organic Dye Species. Chemnanomat 2023, 9, e202300164. [Google Scholar] [CrossRef]
- Tran, N.L.; Van Hoang, D.; Pham, A.T.T.; Phuong, N.T.T.; Mai, N.X.D.; Chi, T.T.K.; Hien, B.T.T.; Phan, T.B.; Tran, N.H.T. Novel composites of nano-metal-organic frameworks (IRMOF-3) and silver nanoparticles for the ultra-sensitive performance of SERS sensing and optical fiber modes. J. Sci.-Adv. Mater. Dev. 2023, 8, 100584. [Google Scholar]
- Liu, Y.; Chen, Y.; Zhang, Y.Y.; Kou, Q.W.; Zhang, Y.J.; Wang, Y.X.; Chen, L.; Sun, Y.T.; Zhang, H.L.; Jung, Y.M. Detection and Identification of Estrogen Based on Surface-Enhanced Resonance Raman Scattering (SERRS). Molecules 2018, 23, 1330. [Google Scholar] [CrossRef] [PubMed]
- Liu, Z.G.; Yu, S.H.; Xu, S.P.; Zhao, B.; Xu, W.Q. Ultrasensitive Detection of Capsaicin in Oil for Fast Identification of Illegal Cooking Oil by SERRS. ACS Omega 2017, 2, 8401–8406. [Google Scholar] [CrossRef] [PubMed]
- Li, J.K.; Zuo, M.; Zhang, W.; Zou, X.B.; Sun, Z.B. Diazo Coupling-Based Ultrasensitive SERS Detection of Capsaicin and Its Application in Identifying Gutter Oil. Food Anal. Method. 2022, 15, 3468–3478. [Google Scholar] [CrossRef]
- Schecter, A.; Malik, N.; Haffner, D.; Smith, S.; Harris, T.R.; Paepke, O.; Birnbaum, L. Bisphenol A (BPA) in U.S. Food. Environ. Sci. Technol. 2010, 44, 9425–9430. [Google Scholar] [CrossRef] [PubMed]
- Pezzella, A.; Lista, L.; Napolitano, A.; d’Ischia, M. Tyrosinase-catalyzed oxidation of 17β-estradiol:: Structure elucidation of the products formed beyond catechol estrogen quinones. Chem. Res. Toxicol. 2005, 18, 1413–1419. [Google Scholar] [CrossRef] [PubMed]
- Nguyen, T.T.; Han, G.R.; Jang, C.H.; Ju, H. Optical birefringence of liquid crystals for label-free optical biosensing diagnosis. Int. J. Nanomed. 2015, 10, 25–32. [Google Scholar]
- Wang, H.N.; Xu, T.H.; Fu, Y.X.; Wang, Z.Y.H.; Leeson, M.S.; Jiang, J.F.; Liu, T.G. Liquid Crystal Biosensors: Principles, Structure and Applications. Biosensors 2022, 12, 639. [Google Scholar] [CrossRef]
- Li, B.; Ju, H. Label-free optical biosensors based on a planar optical waveguide. BioChip J. 2013, 7, 295–318. [Google Scholar] [CrossRef]
- Tran, N.H.T.; Kim, J.; Phan, T.B.; Khym, S.; Ju, H. Label-Free Optical Biochemical Sensors via Liquid-Cladding-Induced Modulation of Waveguide Modes. ACS Appl. Mater. Inter. 2017, 9, 31478–31487. [Google Scholar] [CrossRef] [PubMed]
- Tran, V.T.; Tran, N.H.T.; Nguyen, T.T.; Yoon, W.J.; Ju, H. Liquid Cladding Mediated Optical Fiber Sensors for Copper Ion Detection. Micromachines 2018, 9, 471. [Google Scholar] [CrossRef] [PubMed]
Figure 1.
Various strategies of AuNP-based signal amplification for detecting low E2 concentrations.
Figure 1.
Various strategies of AuNP-based signal amplification for detecting low E2 concentrations.

Figure 2.
Schematic showing a fluorescence-based competitive immunoassay for E2. (MMP; magnetic microparticles, DTT; dithiothreitol.) Used with permission of the Royal Society of Chemistry, from Ref. [29]; permission conveyed through Copyright Clearance Center, Inc.
Figure 2.
Schematic showing a fluorescence-based competitive immunoassay for E2. (MMP; magnetic microparticles, DTT; dithiothreitol.) Used with permission of the Royal Society of Chemistry, from Ref. [29]; permission conveyed through Copyright Clearance Center, Inc.
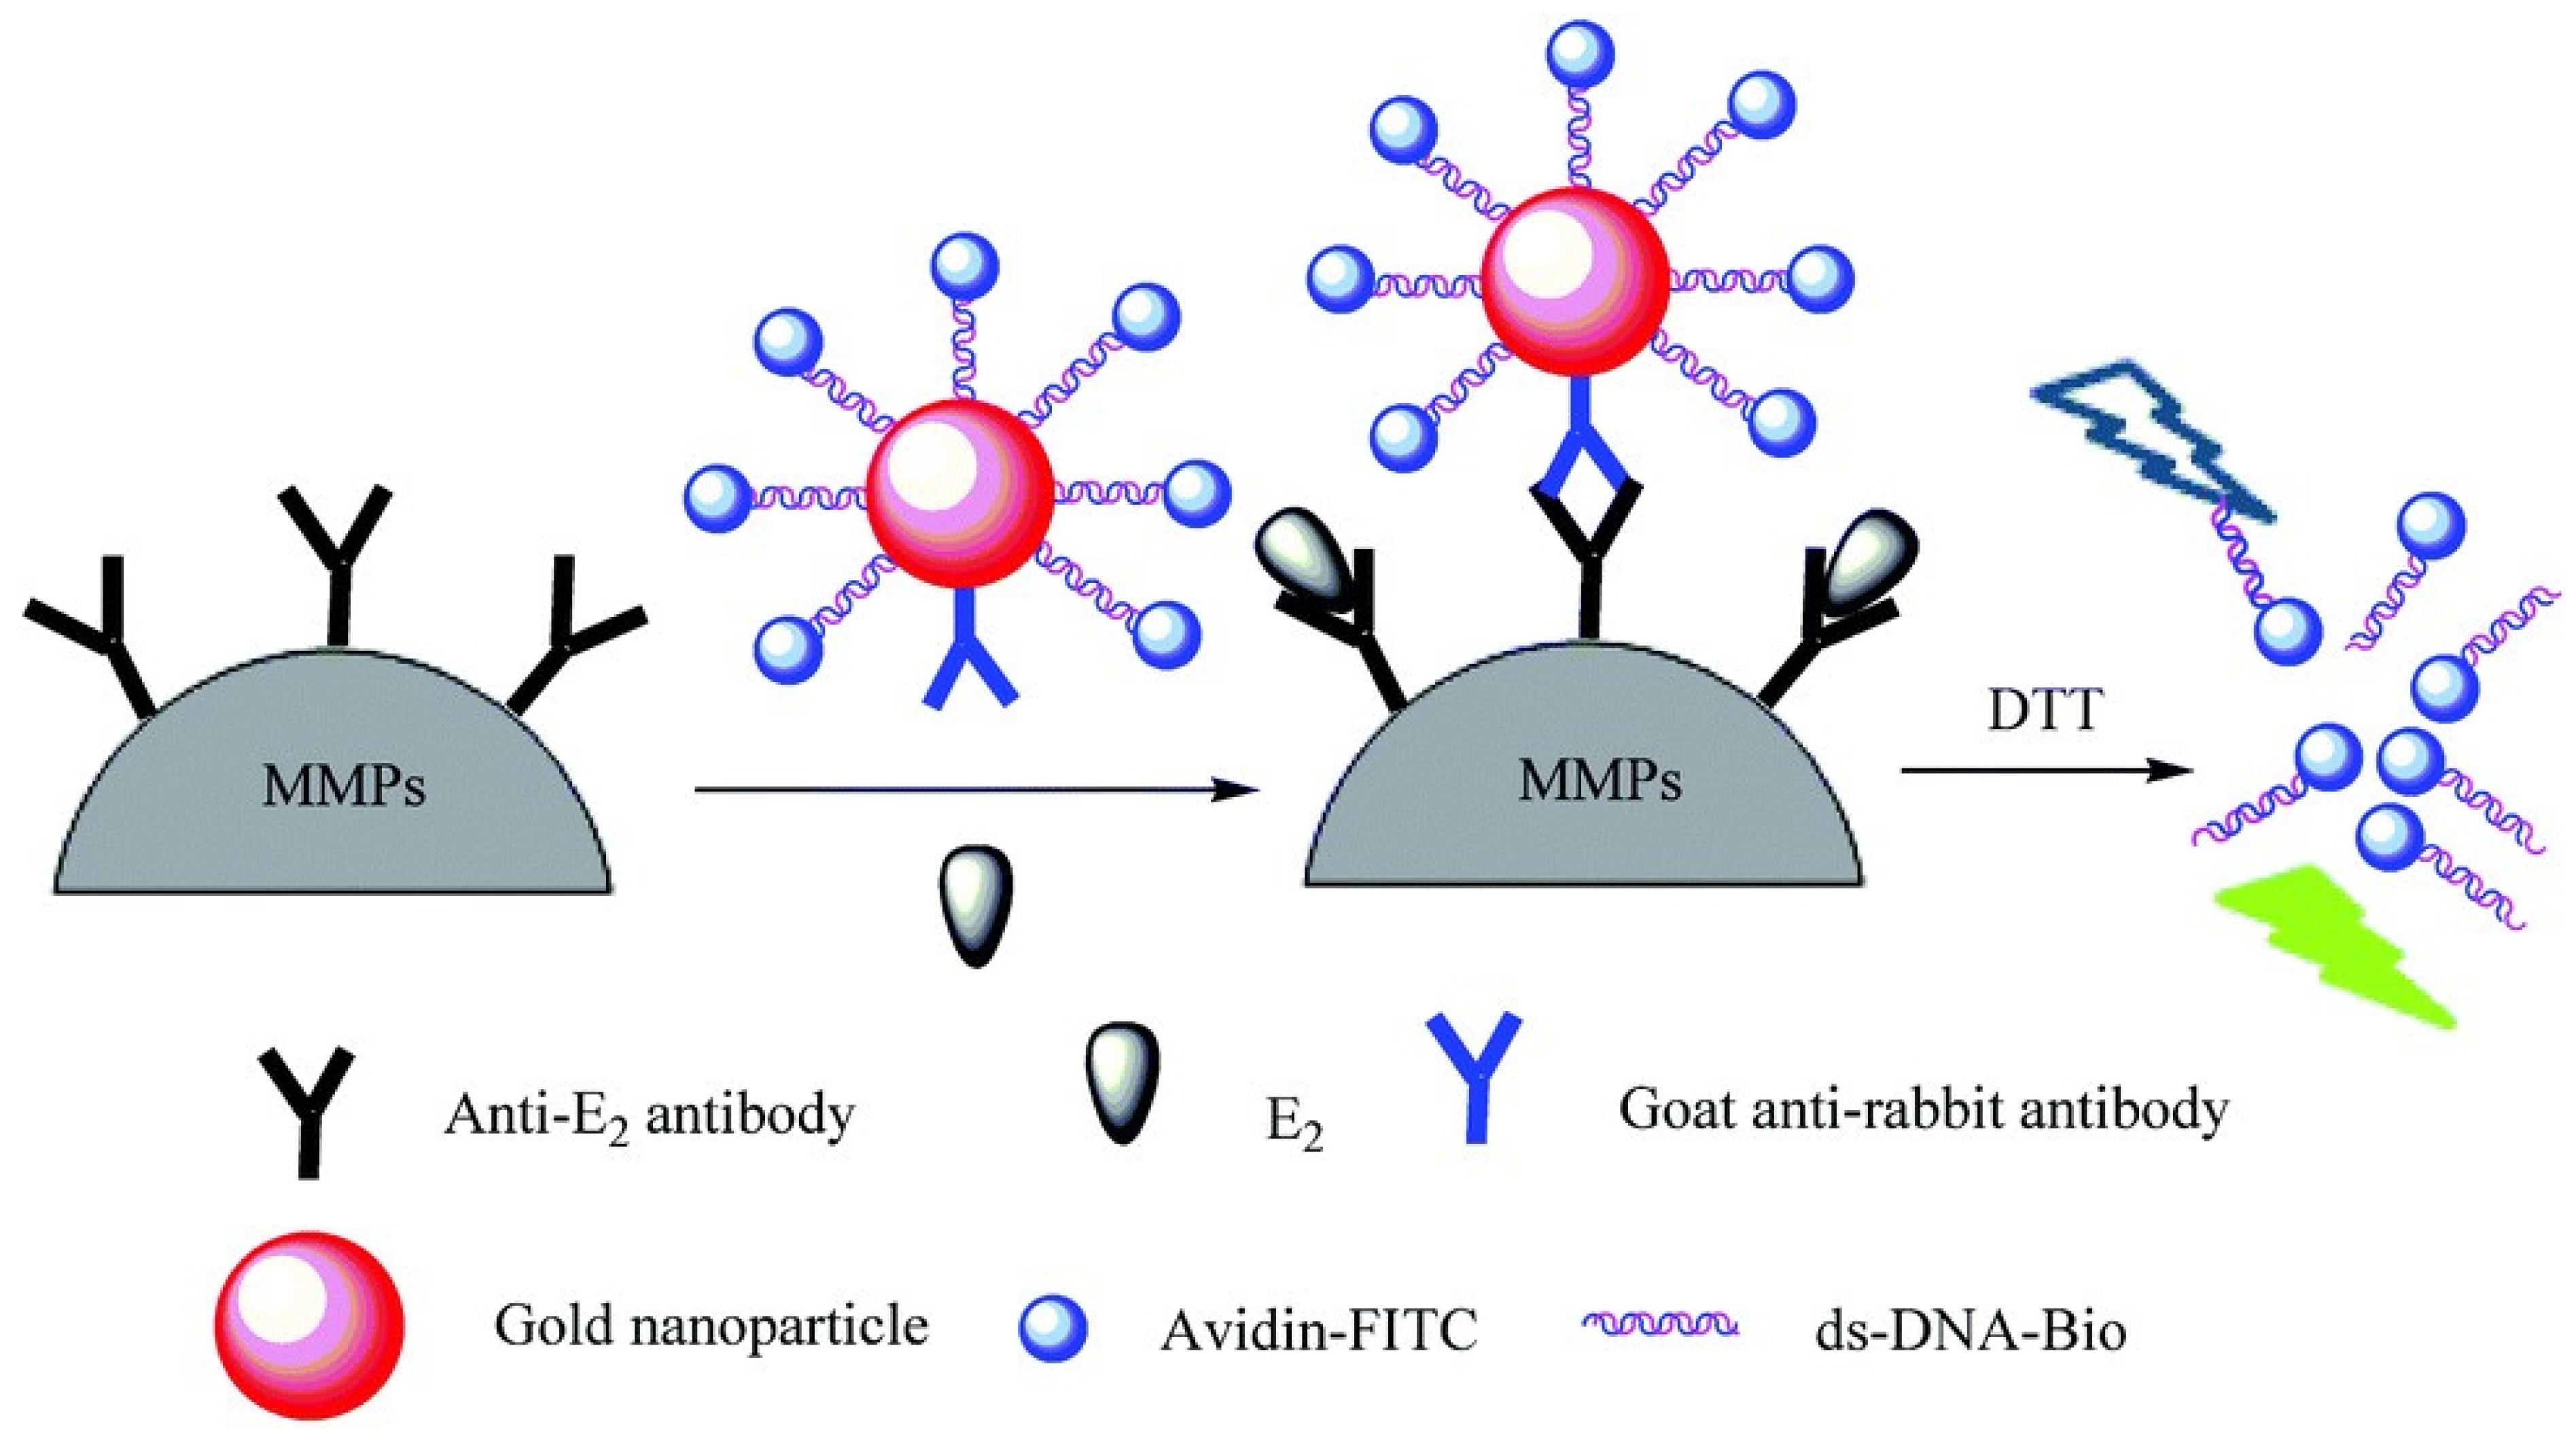
Figure 3.
Schematic showing the dual-quenching-based competitive immunoassay in electrochemiluminescence (PANI, polyaniline; AuNPs, Au nanoparticles; POM, polyoxomolybdate; GCE, glassy carbon electrode; Ab, antibody; BSA, bovine serum albumin; E2, 17β-estradiol). (A) Preparation of a BSA-E2-labeled dual quencher, i.e., PANI@AuNPs-BSA-E2. (B) Stepwise procedures for the competitive immunoassay for E2 detection using PANI@AuNPs-BSA-E2. Reprinted with permission from Ref. [30]. Copyright 2022 American Chemical Society.
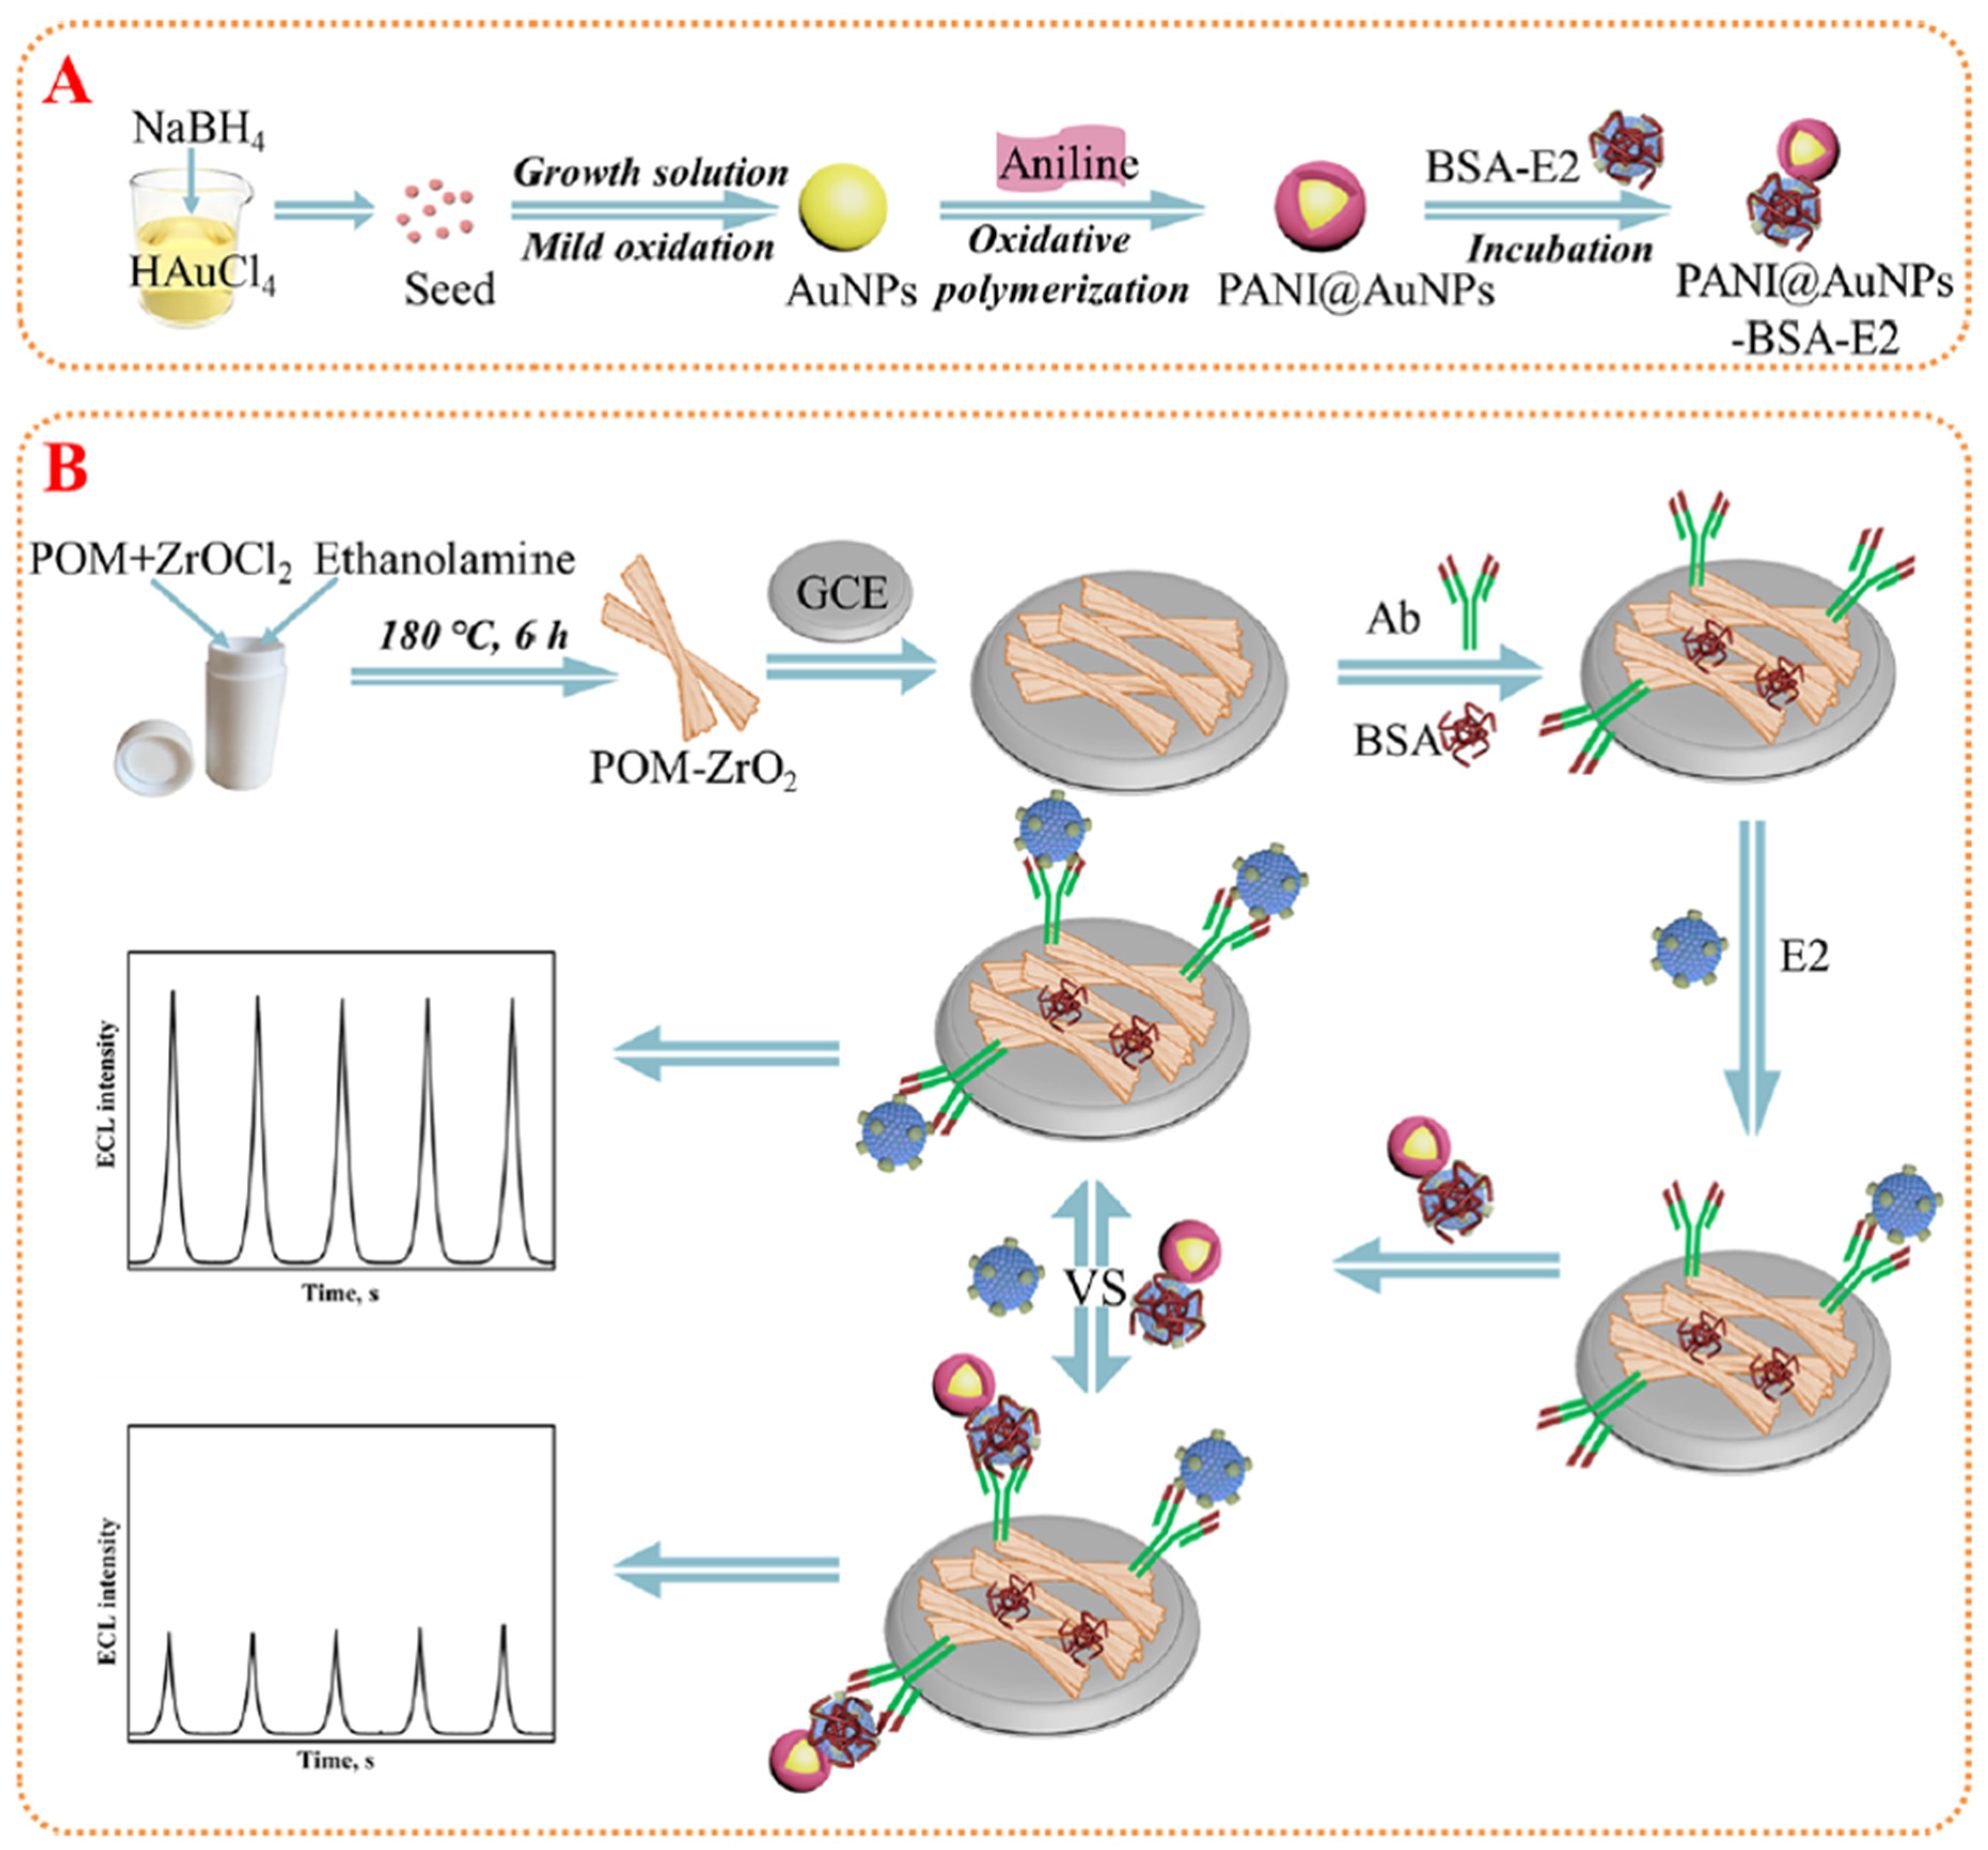
Figure 4.
Fabrication process of an MIP-modified electrode. (GCE, glassy carbon electrode; AuNPs, Au nanoparticles; ATP, p-aminothiophenol.) Reprinted from Ref. [46], Copyright (2014), with permission from Elsevier.
Figure 4.
Fabrication process of an MIP-modified electrode. (GCE, glassy carbon electrode; AuNPs, Au nanoparticles; ATP, p-aminothiophenol.) Reprinted from Ref. [46], Copyright (2014), with permission from Elsevier.

Figure 5.
Schematic of a three-electrode-based electrochemical sensor with a gold working electrode modified by α-estrogen antibody [48]. (ER: estrogen reactor).
Figure 5.
Schematic of a three-electrode-based electrochemical sensor with a gold working electrode modified by α-estrogen antibody [48]. (ER: estrogen reactor).
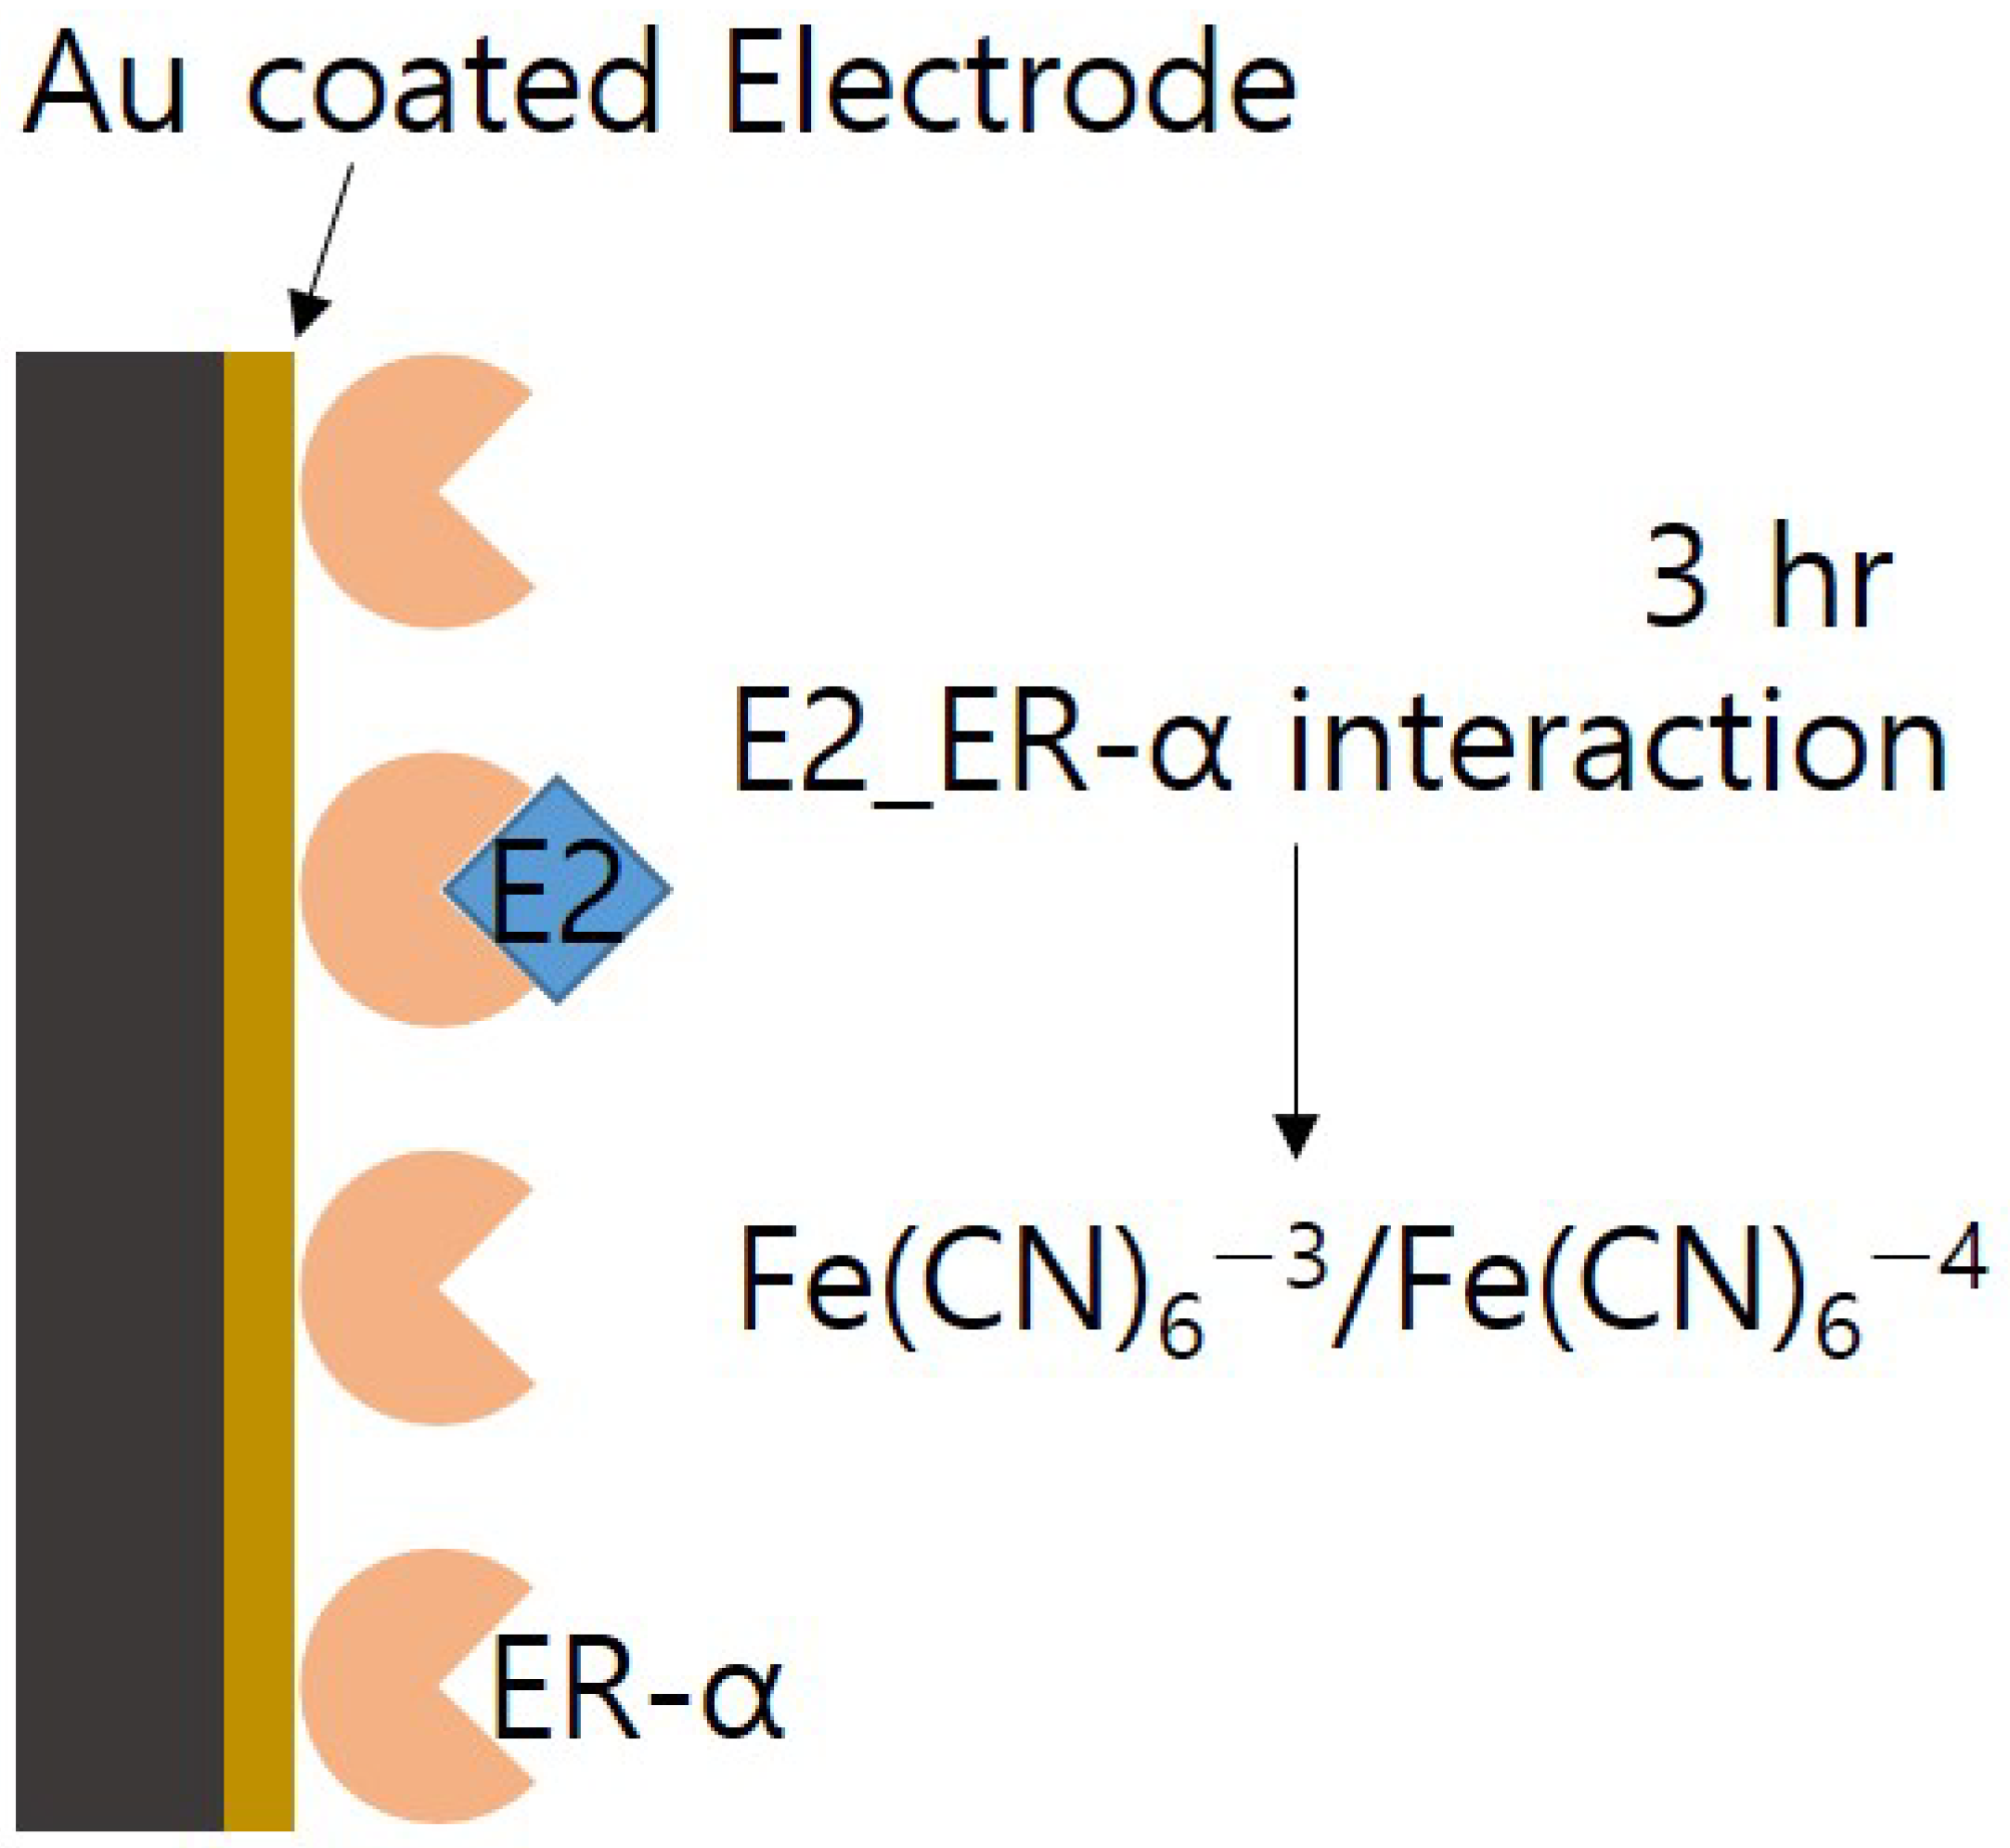
Figure 6.
Schematic showing the E2 detection with the SERS nanotags. (a) Binding a primary antibody (yellow) with a secondary antibody (red) pre-immobilized on a magnetic bead; (b) competitive immunoreaction between E2 molecules and a AuNP-based SERS nanotag; (c) post-immunoreaction step before SERS measurement. (E2, 17β-estradiol; OVA, ovalbumin; MGITC, malachite green isothiocyanate.) Reprinted with permission from Ref. [35]. Copyright 2016 American Chemical Society.
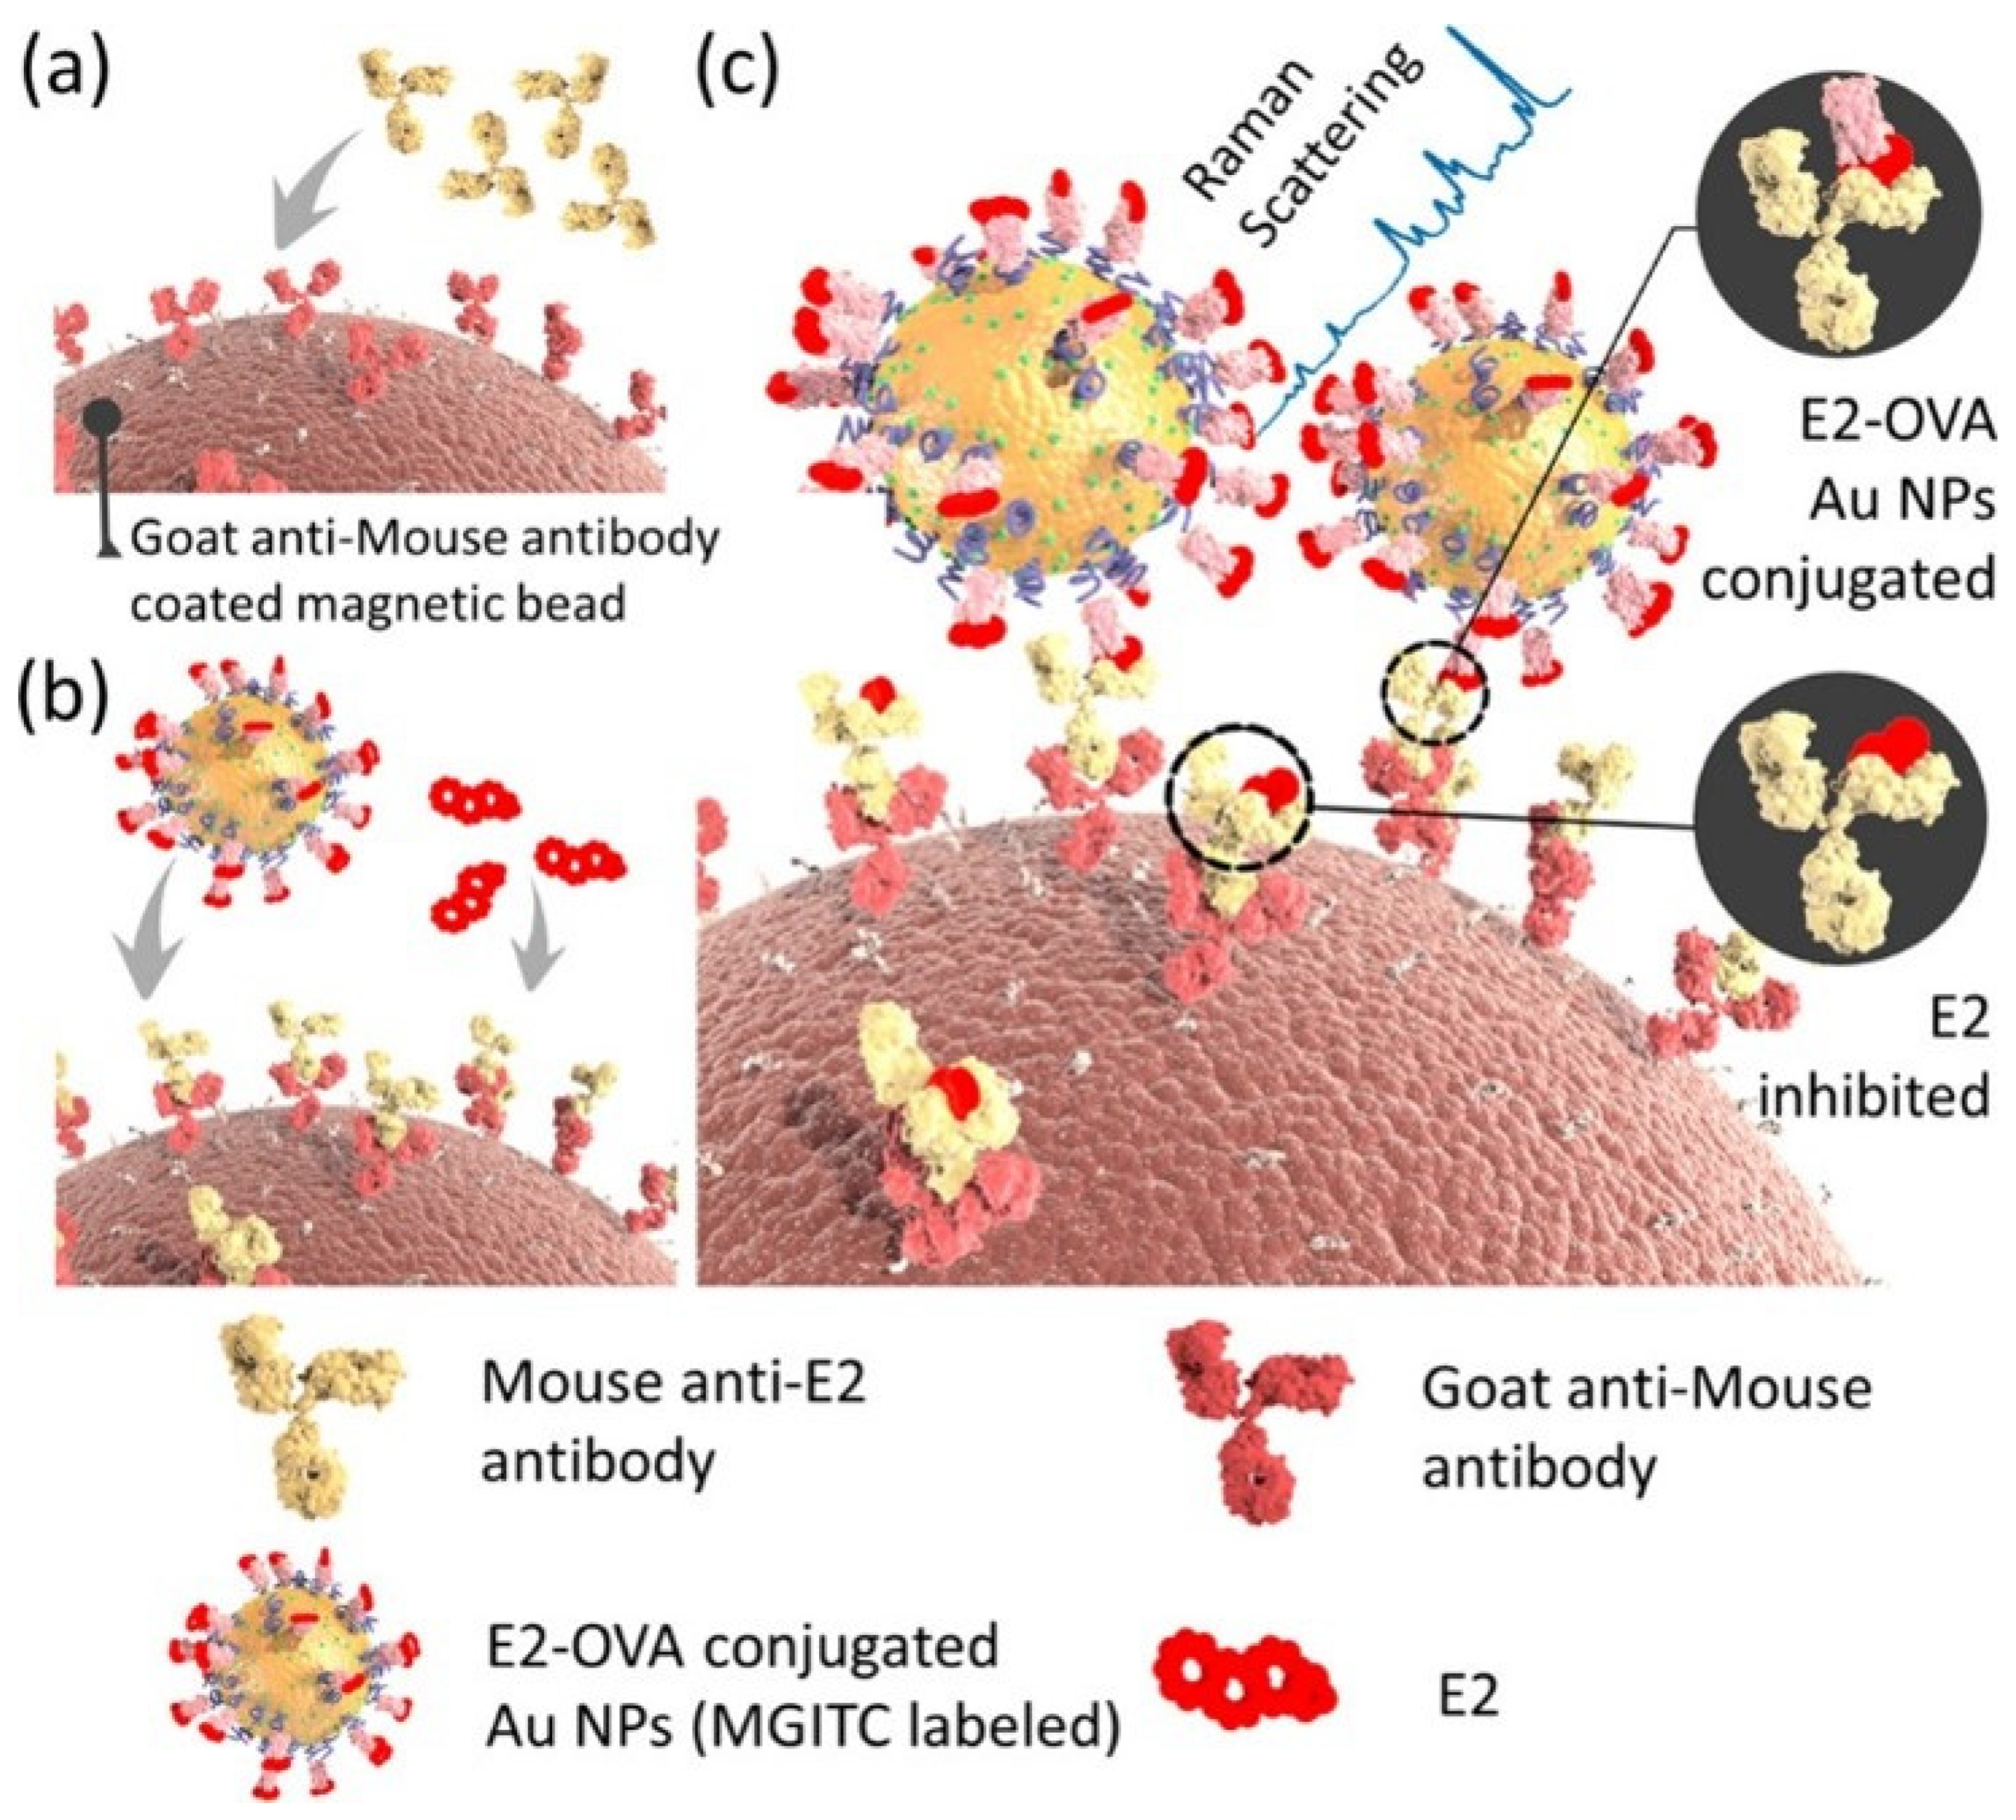
Figure 7.
Schematic of PDI-SERS-based E2 detection strategy. (A) Synthesizing process of PMNs. (B) Different Raman spectral peaks for PEs based on Griess reaction using PMNs. (C) TEM images of the synthesized PMNs. Red circles show AgNPs in PMNs. (D) Raman scattering spectra of PMNs (black) and estrone (E1)-added PMNs (red) which resulted in azo-complexes (MOFs: MIL-101(Fe), PATP: p-aminothiophenol, PE: phenolic estrogen (E1, E2, E3)). Used with permission of the Royal Society of Chemistry, from Ref. [36]; permission conveyed through Copyright Clearance Center, Inc.
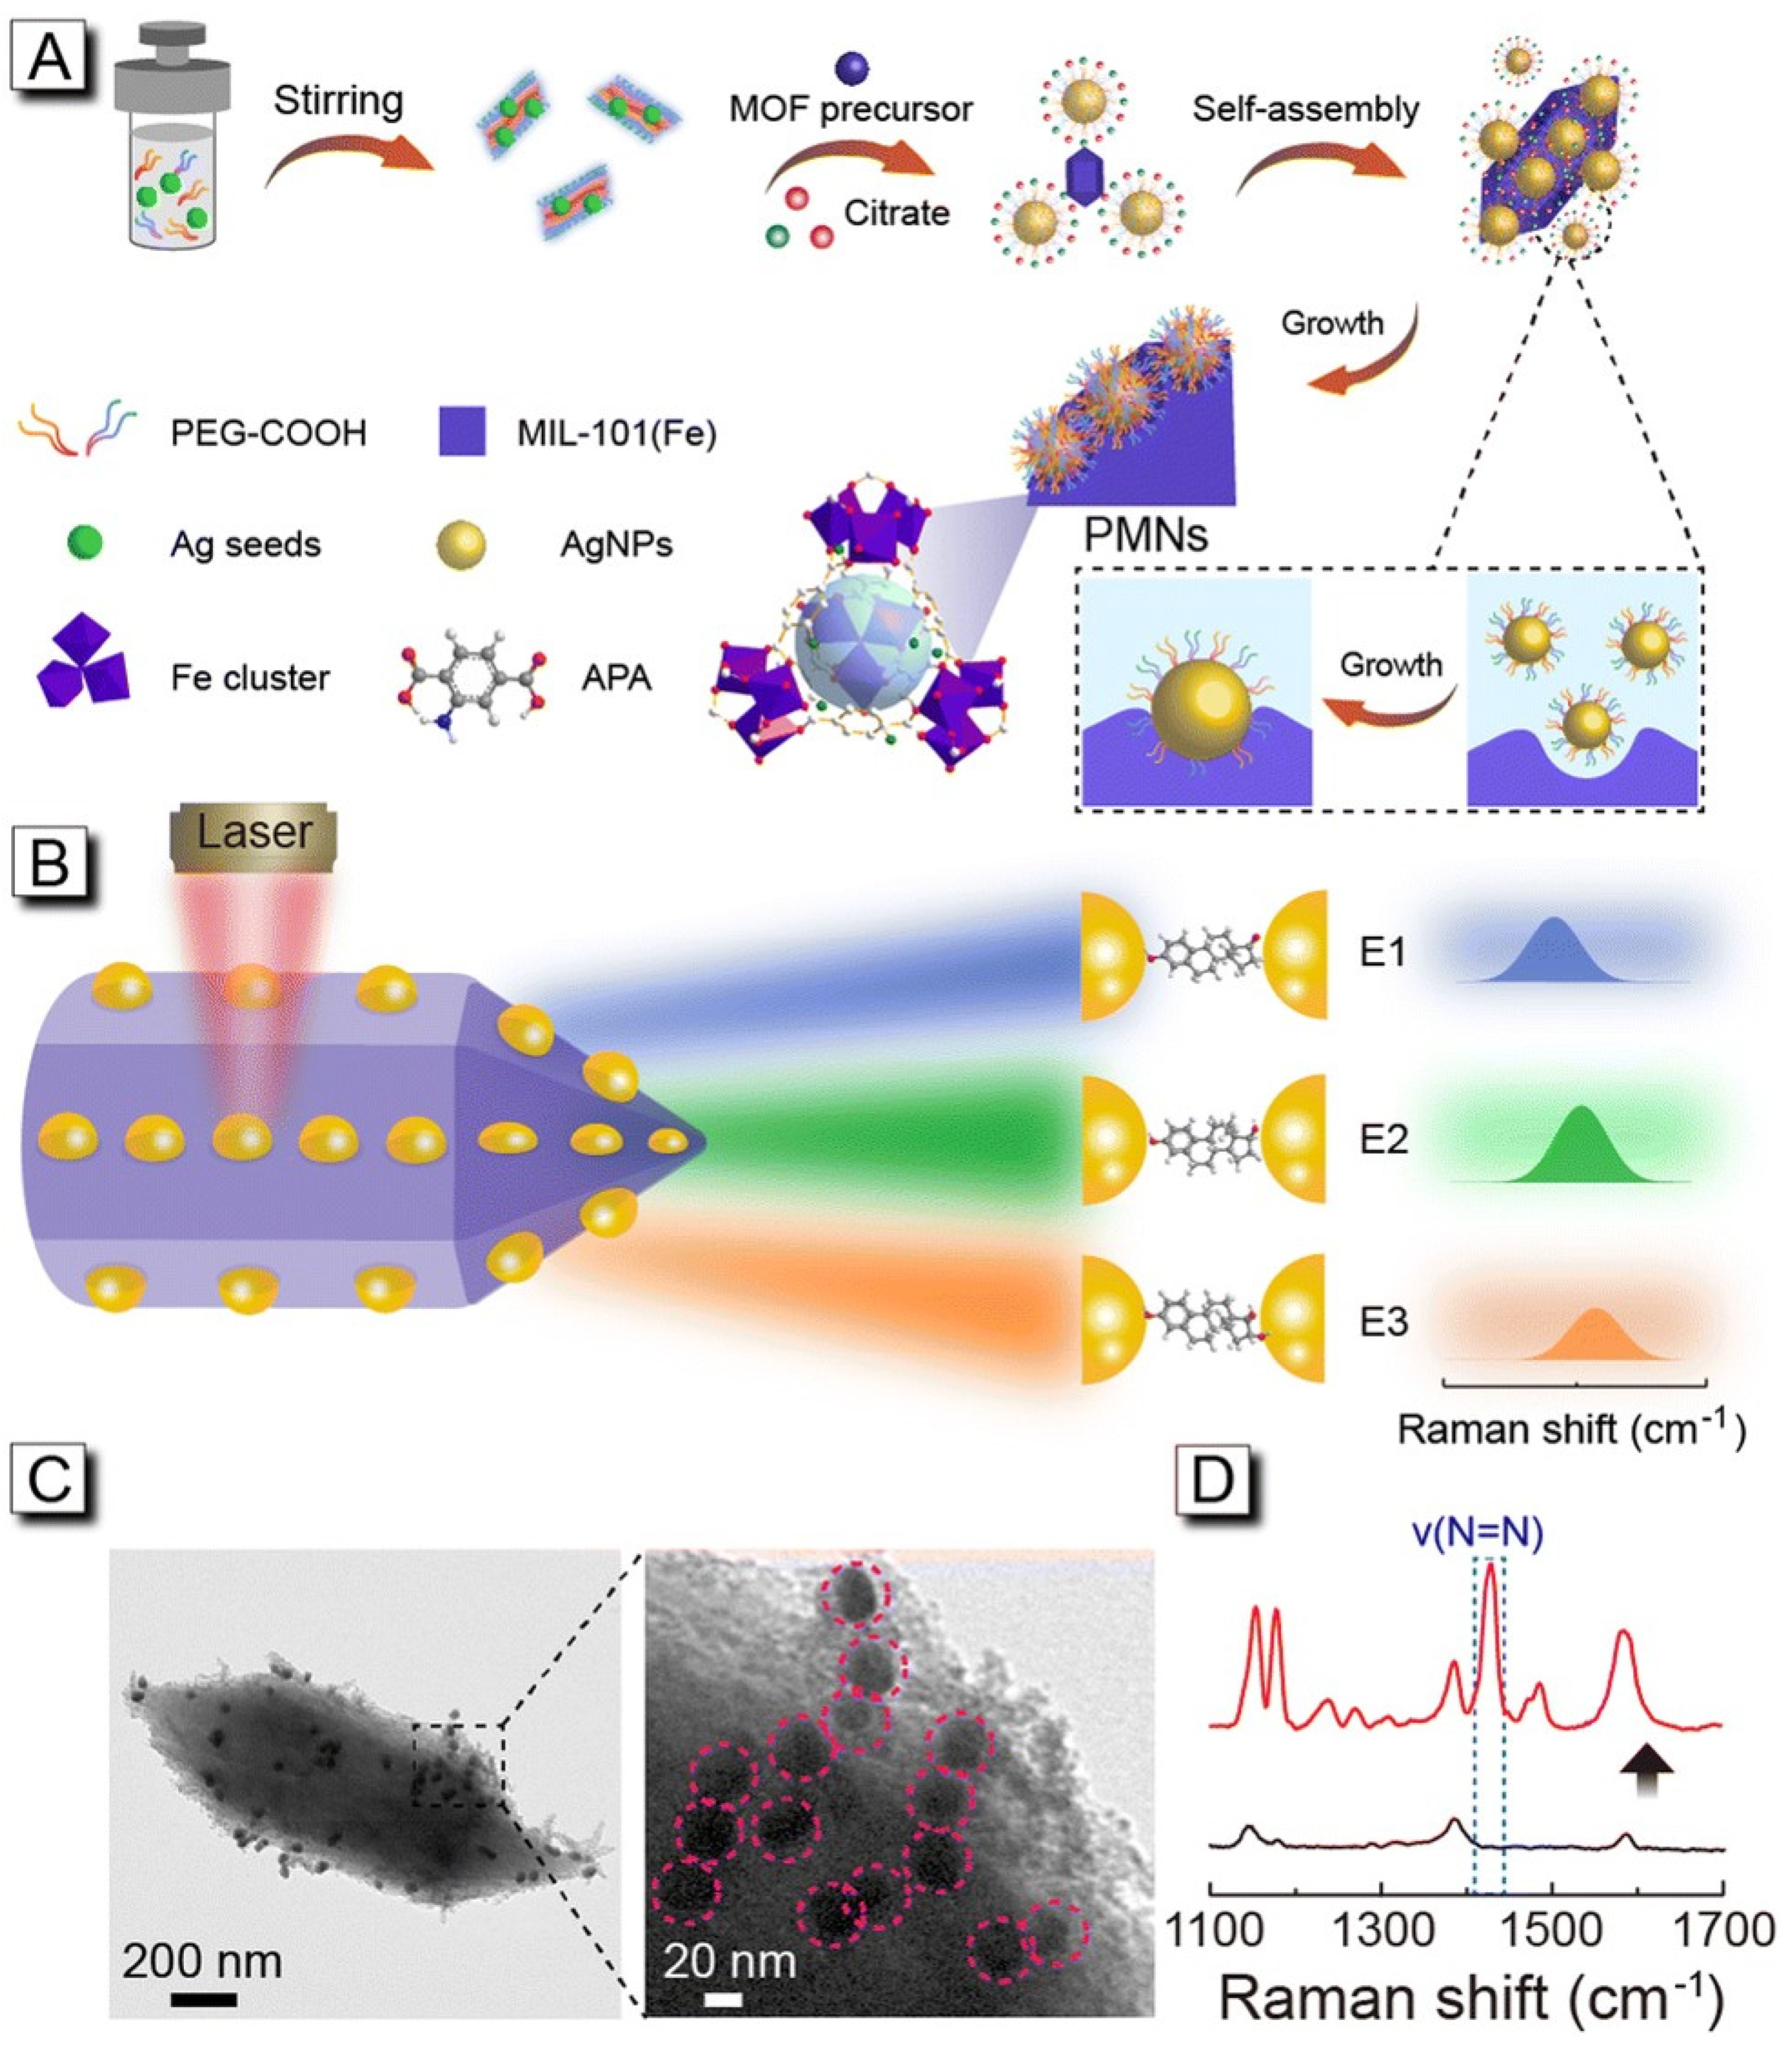
Figure 8.
Schematic of torpedo-shaped MOFs wherein E2-molecule-imprinted polymer-coated AuNPs are anchored (AuNP@MIP-PDA@MIL-101(Fe)) for SERS-based detection of E2. The MOF is MIL-101. (MIP: molecularly imprinted polymer, PDA: polydopamine.) Used with permission of the Royal Society of Chemistry, from Ref. [37]; permission conveyed through Copyright Clearance Center, Inc.

Figure 9.
Barcode assay for detecting E2 and testosterone. (MMP, micro-magnetic particle.) Reprinted from Ref. [56], Copyright 2019, with permission from Elsevier.
Figure 9.
Barcode assay for detecting E2 and testosterone. (MMP, micro-magnetic particle.) Reprinted from Ref. [56], Copyright 2019, with permission from Elsevier.

Figure 10.
A cantilever-based biosensor for detecting E2 [57]. Red arrows represent the laser light reflected from a cantilever.
Figure 10.
A cantilever-based biosensor for detecting E2 [57]. Red arrows represent the laser light reflected from a cantilever.
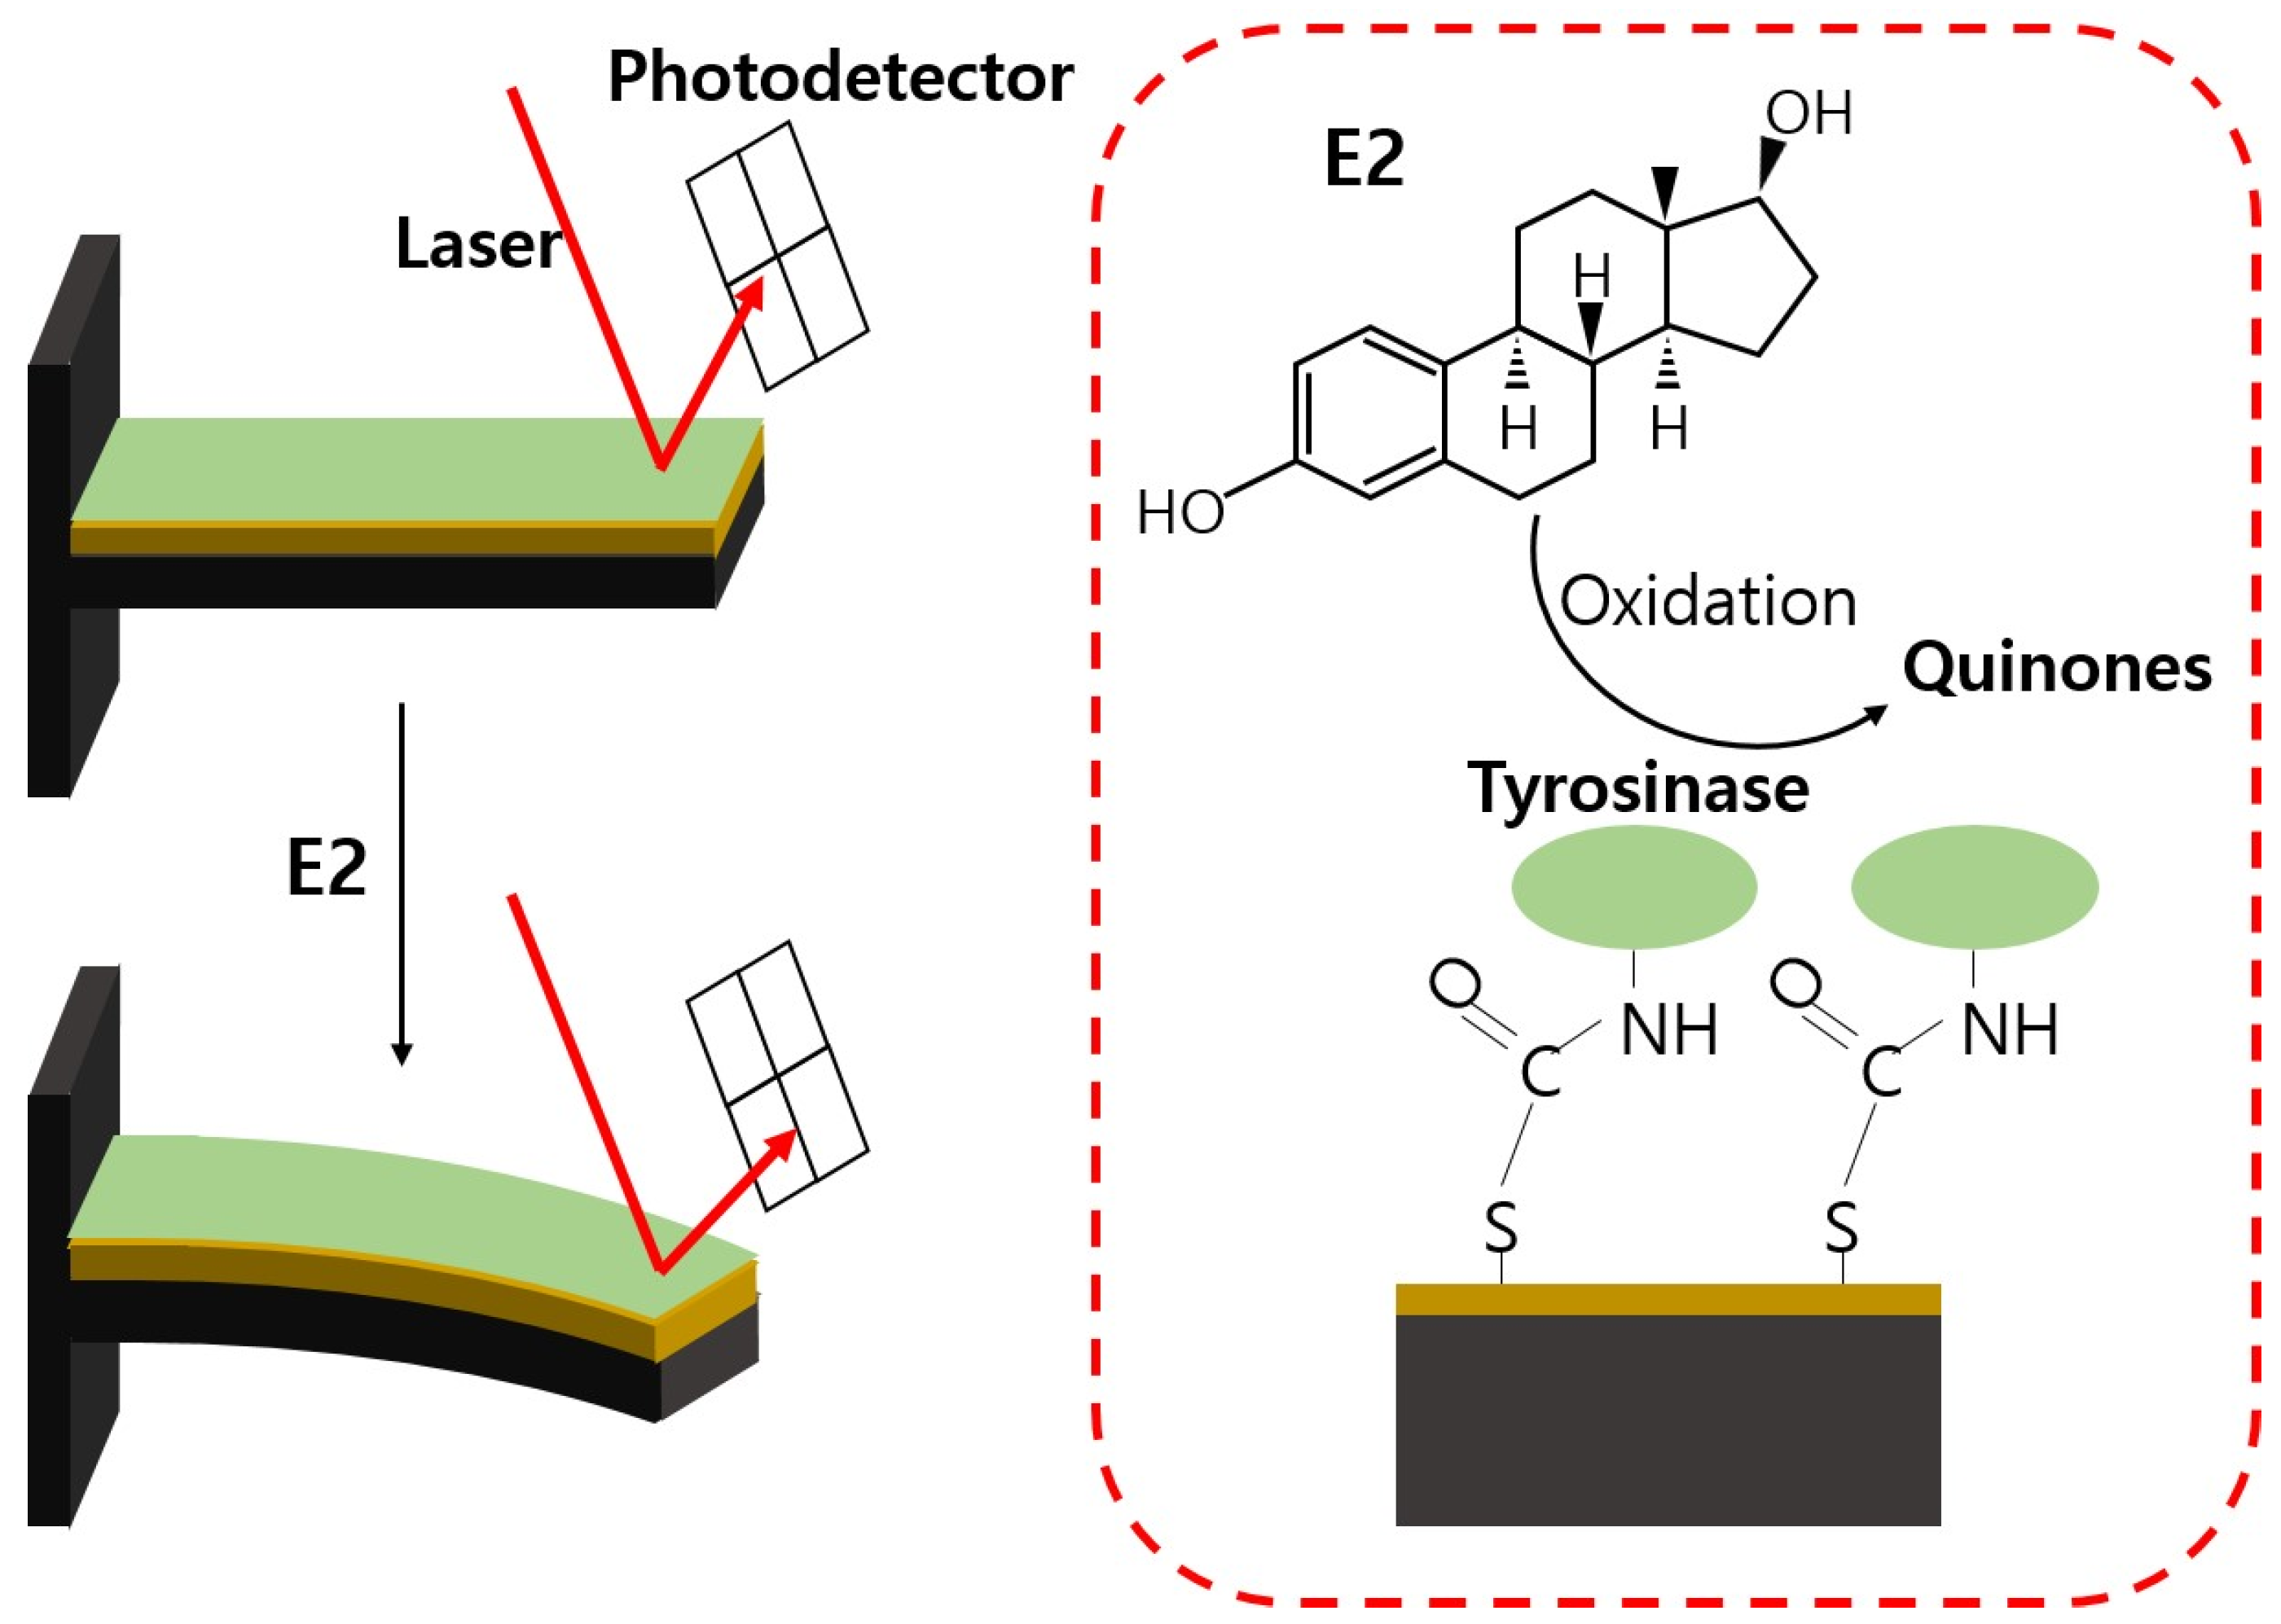
Figure 11.
Schematic showing the working principle of the photoelectrochemical aptasensor (CdTe, cadmium telluride quantum dots; GO, graphene oxide; EGNP, electrodeposited gold nanoparticle; BSA, bovine serum albumin; E2, 17β-estradiol; RCA, rolling circle amplification; hpDNA, hairpin DNA; ssDNA, single-stranded DNA; Ab, antibody). Reprinted from Ref. [58], Copyright 2022, with permission from Elsevier.

Table 1.
Serum E2 levels in various Tanner stages [10].
Table 1.
Serum E2 levels in various Tanner stages [10].
| Tanner Stage | Male | Female | ||
|---|---|---|---|---|
| E2 Levels [pg/mL] | Average Age [Years] | E2 Levels [pg/mL] | Average Age [Years] | |
| 1 | Undetectable–13 | 7.1 | Undetectable–20 | 7.1 |
| 2 | Undetectable–16 | 12.1 | Undetectable–24 | 10.5 |
| 3 | Undetectable–26 | 13.6 | Undetectable–60 | 11.6 |
| 4 | Undetectable–38 | 15.1 | 15–85 | 12.3 |
| 5 | 10–40 | 18 | 15–350 | 14.5 |
Table 2.
Summary of characteristics of ultrahigh-sensitivity E2 sensors reviewed.
| Category | Detection Mode | Signal Amplification | Selectivity | LOD | Sensing Range | Specimen | Recovery | Ref. | |
|---|---|---|---|---|---|---|---|---|---|
| Specific Recognition | Control | ||||||||
| Luminescence | Fluorescence | Multiplying fluorophore | Antibody | E1, E3, EE, E2-17-glucuronide, E2-3-sulfate-17-glucuronide, P4, Androstenedione, DES, p-NP | 6.37 fg/mL | 10.0 fg/mL–1.0 ng/mL | Human urine | 96.5–107.4% | [29] |
| Electrochemiluminescence | PANI@AuNP dual quenching | Antibody | DES, E1, E3, EE, BPA, DDT, TCDD | 3.7 fg/mL | 0.01 pg/mL–200 ng/mL | Lake water, milk | 97.7–104.0% | [30] | |
| Electrochemical | CV, EIS | AuNP-GCE | MIP | E3, DES, BPA, DPA | 1.28 fg/mL | 1.0 fg/mL–100 pg/mL | Milk | 84.7–102.9% | [46] |
| LSV | AuNP-Au electrode | MIP | Testosterone | 1.09 fM | 3.6 fM–3.6 nM | River water | 95.6–103.6% | [47] | |
| DPV | - | Antibody | Testosterone | - | 2.25 pg/mL–2250 pg/mL | Tap water, simulated urine | applicable | [48] | |
| SERS | Raman spectroscopy | MGITC-AuNPs | Antibody | 17α-estradiol, E1, E3, cortisol | 0.65 pg/mL | 0 pg/mL–1000 pg/mL | Clinical serum samples | 95% confidence intervals | [35] |
| Raman spectroscopy | AgNPs@MIL-101(Fe) | Spectral peak difference | Quinestrol, Epimestrol, Nilestriol, Estramustine, Norgestrel, estradiol benzoate, Histidine, estrone acetate, estradiol dipropionate | 4.0 fM | 100 fM–100 nM | Milk, fish, duck meat, wastewater | 86.51–109.8% | [36] | |
| Raman spectroscopy | AuNPs@MIP-PDA@MIL-101(Fe) | MIP | DES, BPA, Chloramphenicol | 0.195 fM | 10 fM–1.0 μM | Milk | 90.56–109.40% | [37] | |
| Miscellaneous | Electrophoresis | Multiplying barcode DNA | Antibody, Aptamer | Testosterone | 1 pg/mL | - | Urine | - | [56] |
| Fluorescence | Multiplying fluorophore | 10 pg/mL | - | - | |||||
| LC/MS | Molecular barcode carried by AuNPs | 10 ag/mL | - | 108.94% | |||||
| AFM voltage response | - | Voltage response difference | Ascorbic acid, Caffein, Thiamine | 0.1 pg/mL | 1 pg/mL–10 ng/mL | Ultrapure, river, tap, mineral water | - | [57] | |
| Photocurrent | DNA amplification (RCA), multiplying fluorophore | Aptamer, Antibody | 2,5-DCP, EE, BPA, E3, Glu, BSA, Urea | 0.01 pM | 0.04 pM–10 pM | Royal jelly, milk powder, urine | 82.58–108.19% | [58] | |
| Optical intensity | - | Aptamer, Antibody | E3, HC, P4, testosterone, E1 | 3.1 pM | 1 pM–250 pM | Human urine | - | [59] | |
Disclaimer/Publisher’s Note: The statements, opinions and data contained in all publications are solely those of the individual author(s) and contributor(s) and not of MDPI and/or the editor(s). MDPI and/or the editor(s) disclaim responsibility for any injury to people or property resulting from any ideas, methods, instructions or products referred to in the content. |
© 2024 by the authors. Licensee MDPI, Basel, Switzerland. This article is an open access article distributed under the terms and conditions of the Creative Commons Attribution (CC BY) license (https://creativecommons.org/licenses/by/4.0/).
Share and Cite
MDPI and ACS Style
Seok, J.S.; Ju, H. Ultrahigh-Sensitivity Detection of 17β-Estradiol. Chemosensors 2024, 12, 61. https://doi.org/10.3390/chemosensors12040061
AMA Style
Seok JS, Ju H. Ultrahigh-Sensitivity Detection of 17β-Estradiol. Chemosensors. 2024; 12(4):61. https://doi.org/10.3390/chemosensors12040061
Chicago/Turabian StyleSeok, Joo Seon, and Heongkyu Ju. 2024. "Ultrahigh-Sensitivity Detection of 17β-Estradiol" Chemosensors 12, no. 4: 61. https://doi.org/10.3390/chemosensors12040061
Note that from the first issue of 2016, this journal uses article numbers instead of page numbers. See further details here.