Article

Novel Photoluminescence and Optical Thermometry of Solvothermally Derived Tetragonal ZrO2:Ti4+,Eu3+ Nanocrystals

1
Department of Physics, Changchun Normal University, Changchun 130032, China
2
State Key Laboratory of Luminescence Science and Technology, Changchun Institute of Optics, Fine Mechanics and Physics, Chinese Academy of Sciences, Changchun 130033, China
3
Department of Physics, Pukyong National University, Busan 608-737, Republic of Korea
*
Authors to whom correspondence should be addressed.
Chemosensors 2024, 12(4), 62; https://doi.org/10.3390/chemosensors12040062
Submission received: 29 January 2024 / Revised: 5 March 2024 / Accepted: 14 March 2024 / Published: 15 April 2024
(This article belongs to the Section Optical Chemical Sensors)

Abstract

:
In this paper, we report on the solvothermal preparation and detailed characterization of pristine and intentionally doped zirconium dioxide (ZrO2) nanocrystals (NCs, ~5 nm) with Eu3+ or Ti4+/Eu3+ ions using alkoxide precursors. The results indicated that the ZrO2 NCs were dominantly of a tetragonal phase (t-ZrO2) with a small proportion of monoclinic ZrO2 (m-ZrO2). The high purity of t-ZrO2 NCs could be synthesized with more Eu3+ doping. It was found that the as-obtained ZrO2 NCs contain some naturally present Ti4+ ions originating from precursors, but were being overlooked commonly, and some carbon impurities produced during synthesis. These species showed distinct photoluminescence (PL) properties. At least two types of Eu3+, located at low- and high-symmetry sites (probably sevenfold and eightfold oxygen coordination), respectively, were demonstrated to build into the lattice structure of t-ZrO2 NCs together. The cationic dopants were illustrated to be distributed non-randomly over the sites normally occupied by Zr, while Ti impurities preferentially occupied the sites near the low-symmetry site of Eu3+, yielding efficient energy transfer from the titanate groups to the neighboring Eu3+. Luminescence nanothermometry could measure temperature in a non-contact and remote way and could find great potentials in micro/nano-electronics, integrated photonics, and biomedicine. On the basis of the dual-emitting combination strategy involving the white broadband CT (Ti3+→O) emissions of the titanate groups and red sharp Eu3+ emissions, t-ZrO2:Eu3+ nanophosphors were demonstrated to be ratiometric self-referencing optical thermometric materials, with a working range of 130–230 K and a maxima of relative sensitivity of ~1.9% K1 at 230 K.

Graphical Abstract

1. Introduction

Luminescent nanophosphors have recently been the subject of appreciable interest due to their promising potential in photoelectric devices, optical sensing, bio-medicine, and many other areas [1,2,3,4,5]. This potential is derived from some of their essential characteristics such as a small size, versatile surface chemistry, and excellent photoluminescence [1,2,6]. Nanophosphors are commonly known as a combination of activators (lanthanide and transition metal ions) and nanometer-sized host matrixes (e.g., simple oxide, fluoride, vanadates, phosphates, borates) in which activators are situated [1,2,7]. A wide optical band gap is commonly required to accommodate the ground and excited state levels of activators for the generation of efficient luminescence upon the direct optical excitation of an activator or upon the excitation of the host lattice followed by the energy transfer to the emitting centers [8]. Zirconium dioxide (ZrO2), one of the simple transition metal oxides with a moderately high bandgap energy of ~5–6.0 eV, has received much attention for the doping design of novel phosphors, extensive examination of luminescent properties, and/or proof-of-concept applications [9,10,11,12]. In addition, the intrinsic chemical and mechanical stabilities, biocompatibility, low phonon energy, high refractive index, and high dielectric constant properties are also favorable for ZrO2 to serve as a photonic material toward the host of cationic dopants, semiconductor substrates, and optical antireflection coating layers [9,13].
Till now, a variety of metallic ions have been intentionally introduced into ZrO2 nanocrystals (ZrO2 NCs) for characteristic photoluminescence (PL) emissions, including lanthanide (Ln3+) series (Pr3+, Nd3+, Sm3+, Eu3+, Tb3+, Dy3+, Er3+, Tm3+, Yb3+) and some transition metal ions (TM, Ti4+, Ni2+, Mn2+) [14,15,16,17,18,19,20,21,22,23,24,25,26,27,28,29]. Multicolor emissions spanning from the visible to infrared spectral regions have been achieved via downshifting or the upconversion luminescence of electronic transitions within the 4f or d subshell or from charge transfer (CT) processes between the metallic cations and the surrounding anions. Examples are Stokes-shifting red emissions from Eu3+ (5D07F1–4) [14,15,16,17], Sm3+ (4G5/26H7/2,9/2,11/2) [18], or Mn2+ (4T1 (4G)→6A1(6S)) [28] activators; green luminescence from Tb3+ (5D47F5) ions [22]; anti-Stokes green emissions of Er3+ (2H11/2/4S3/24I15/2) and blue emissions of Tm3+ (1G43H6) upon the infrared excitation of a Yb3+ sensitizer [24,25,26]; broadband white–blue emissions of Ti4+(excited Ti3+→O CT transition) [9,27]; and infrared emissions from Nd3+ (4F3/24I9/2,11/2,13/2) [19,20]. These multicolor-emitting ZrO2 NCs have great potential applications as fluorescence markers for bioimaging, biosensors, electronic printing, and anti-counterfeiting applications [16,17]. The trivalent Eu3+ ion is among the most studied activators in zirconia, probably by virtue of the intense luminescence benefiting from the high quenching concentration and the nature of the microstructural probe of the host matrix. In this study, we revisited the photoluminescence of Eu3+ in solvothermally derived tetragonal ZrO2 NCs and present a systematic characterization. In addition, we also placed our attention on the photoluminescence of pristine zirconia nanocrystals (p-ZrO2 NCs) without intentionally introducing any cation dopants, as well as the photoluminescence of those deliberately co-doped with Ti4+ and Eu3+. It was found that the p-ZrO2 NCs contain some naturally occurring Ti4+ ions originating from starting materials and some carbon impurities produced during synthesis. The Ti4+ ions exhibited bright white emission only at low temperatures via CT transition, which further transferred the excitation energy efficiently to the Eu3+ after co-doping. Meanwhile, the carbon species could luminesce at room temperature with a small Stokes shift and feature excitation wavelength-dependent PL emissions spanning the visible region, which greatly interfered with Raman measurements.
With regard to the crystallographic structure of zirconia, at atmospheric pressures, bulk zirconia exists in three commonly known polymorphs: monoclinic (m-ZrO2, P21/c), tetragonal (t-ZrO2, P42/nmc), and cubic (c-ZrO2, Fm 3 ¯ m) forms, with m-ZrO2 being the equilibrium structure at low temperatures [9,30]. The t- or c-ZrO2 are high-temperature polymorphs but could be stabilized by the chemical doping of aliovalent cationic dopants, such as lanthanide ions, Sc3+, Ca2+, and Mg2+ [9,30,31]. Oxygen vacancies, introduced by these dopants for charge compensation, have been shown to play an important role in stabilizing such metastable structures [30]. Meanwhile, nanoscale zirconia without chemical doping, if below the reported “critical crystallite size” ranging from 9 to 30 nm, could be stable in the tetragonal phase probably due to one of several factors, including the lower surface free energy relative to that of m-ZrO2 and the anionic vacancies that nucleate the tetragonal phase [31]. In some cases, however, t-ZrO2 NCs could also be stabilized above the critical crystallite size, and pure m-ZrO2 NCs < 10 nm in diameter could also be selectively grown under suitable synthetic conditions [14,32,33,34]. The controlled synthesis of a single phase of ZrO2 NCs was, therefore, challenging. The exact mechanism for the formation and stability of t-ZrO2 NCs remains ambiguous [30]. Herein, we prepared highly dispersed p-ZrO2 NCs and Ti4+/Eu3+-doped ZrO2NCs by the solvothermal method. The as-synthesized NCs each had a size of ~5 nm or smaller but showed a mixture, in the crystalline phase in p-ZrO2, of the dominant polymorph of the tetragonal form and a small fraction of monoclinic ones. The growth of m-ZrO2 was suppressed upon the further doping of Eu3+ ions, and highly pure t-ZrO2 was then obtained at higher Eu3+ concentrations. Following the photoluminescence evolution with the change in phase purity, at least two types of Eu3+ were identified to be present in t-ZrO2 NCs: one located at a higher symmetry of site (probably eightfold oxygen coordination), and the other located at a lower symmetry of site (perhaps sevenfold oxygen coordination). The latter Eu3+ ions were proposed to be preferentially associated with Ti4+ impurities in the crystalline lattices and displayed distinct spectroscopic characteristics from the former ones.
Temperature sensing by luminescent materials (commonly referring to as optical thermometry) is of fundamental and technological interest by considering the new insights into the temperature dependence of luminescence and the noninvasive detection feature, as well as their unique potential applications in some harsh environments, especially in a biological body [4,5,35,36]. Although several strategies by adopting different spectroscopic characteristics of luminophors (including fluorescence intensity or intensity ratio (FIR), bandwidth, band shape, polarization, spectral shift and lifetime, etc.) could be used for temperature sensing, FIR is among the most prevailing strategy because it reduces the dependence on the measurement conditions [5,9]. Typically, the FIR technique necessitates one probe signal of a high-temperature sensitivity and one self-referencing standard that is more inert to temperature [9]. Following these considerations, an FIR-based temperature-sensing material could be obtained by placing one luminescent transition metal ion and one trivalent lanthanide ion into a specific host lattice, since the optical behavior of transition metal(specifically, d-block element ions with unfulfilled d orbitals) and d0 ions (could be viewed as charged anion groups) is highly susceptible to temperature variations in many cases due to bared and spatially more extensive d-orbitals and the consequent, strong electron–lattice coupling; while the 4f-4f transitions of Ln3+, occurring in the well-shielded 4f subshells, showed weak interactions with the surroundings including, but not limited to, the temperature-induced consequences [9,37]. In this study, we demonstrated that the t-ZrO2:Ti4+, Eu3+ NCs could serve as FIR optical thermometry by combining the temperature-sensitive CT emissions (Ti3+→O) of the titanate groups and somewhat temperature-inert sharp emissions of the Eu3+ ions. The temperature sensing was achieved upon excitation into the CT (O2→Ti4+) band followed by energy transfer to Eu3+, and it covered a working range of 130–230 K with a maximum relative sensitivity of ~1.9%K1.

2. Materials and Methods

2.1. Chemicals and Materials Preparation

All chemicals used in this study were of analytical grade and were used without further purification. Starting materials of Zirconium (IV) butoxide solution (Zr(OC4H9)4, 80 wt%, in n-butoxide), titanium tetrabutoxide (TTB, Ti(OC4H9)4, 99.9 wt%), Eu(NO3)•6H2O (99.99%), and n-butanol were supplied by Macklin Inc., Shanghai, China.
All manipulations were carried out under ambient conditions. Highly dispersed p-ZrO2, Eu3+ singly doped (t-ZrO2:Eu3+), and Ti4+/Eu3+ doubly doped t-ZrO2 (t-ZrO2:Ti4+, Eu3+) NCs were synthesized according to a modified solvothermal procedure described previously [16,32]. In a typical synthesis of t-ZrO2:Ti4+, Eu3+NCs, fresh n-butoxide dispersions of TTB (0.01M) and Eu(NO3)3 (0.02M) were first prepared by dissolving appropriate amounts of TTB and Eu(NO3)•6H2O in the n-butanol, respectively. A stoichiometric amount of Eu(NO3)3 dispersion of was then added and well stirred (~10 min) in a 60 mL n-butanol solution containing 2.0 mL of zirconium (IV) butoxide solution to form a transparent solution. Thereafter, a stoichiometric amount of TTB dispersion was added in the above mixed solution, followed by another magnetic stirring of 10 min (care was taken in the sequence of adding the Eu and Ti sources into the Zr dispersion; the reverse procedure (i.e., first adding Ti and then the Eu source) would greatly decrease the phase purity). A mixture of acetic acid (0.2 mL) and deionized water (0.4 mL) was finally added dropwise to the above solution under vigorous stirring to trigger the hydrolysis reaction, and the resulting mixture was continuously stirred until the milky white appeared (~10 min). The colloidal dispersions were then sealed into a 100 mL poly(phenylene oxide) (PPL) bottle held in a stainless-steel autoclave and were subsequently heated at 260 °C for 10 h. After the autoclave naturally cooled down to room temperature, the supernatant solution in the bottle was decanted, while the resultant white deposits were collected by washing with absolute ethanol and drying at 60 °C. Through the same experimental procedure, the p-ZrO2 NCs was synthesized in the absence of the Ti and Eu source, while t-ZrO2:Eu3+ NCs were prepared in the absence of an extra Ti source. A thermal treatment of the obtained NCs was conducted in a muffle furnace at 400 °C for 4 h in air.

2.2. Characterization and Measurements

Powder X-ray diffraction (XRD) measurements were performed with a D8 Advance X-ray Diffractometer (Bruker, Billerica, MA, USA) in the range of 2θ = 10–80° with a step of 2θ = 0.02°. Cu-Kα radiation was utilized. The size and morphology were characterized by a G2 F20S-WTINE transmission electron microscope (TEM, FEI Tecnai, Hillsboro, OR, USA) operating at 200 kV. The TEM specimens were prepared by directly drying a drop of dilute ethanol dispersions of the products on the surface of a carbon-coated copper grid. Raman spectra were acquired on an InVia microscopic confocal Raman spectrometer (Renishaw, London, UK) with an 830 nm laser excitation source. Fourier-transform infrared (FTIR) spectra were obtained using a Nicolet 6700 spectrometer (Thermo Scientific, Waltham, MA, USA) equipped with an attenuated total reflectance (ATR) attachment. X-ray photoelectron spectroscopy (XPS) was performed on powdered samples deposited and pressed in small cuvettes in ambient conditions using an ESCALAB 250 (Thermo, Waltham, MA, USA) spectrometer equipped with a focused and scanned monochromatic Al Kα X-ray source. The peak-fitting of high-resolution spectra was processed using XPSPEAK41 software. The elemental composition of Ti and Zr in the supplied Zirconium (IV) butoxide solution was determined by an inductively coupled plasma–atom emissionspectrophotometer (ICP-AES) using ICP-9000 (N + M) (Thermo Jarrell Ash Corp., Franklin, MA, USA) analysis. The diffuse reflectance (DR) spectra in the 200–600 nm region were recorded by using a UV-3600 plus dual-beam UV–vis–NIR spectrophotometer (Shimadzu, Kyoto, Japan) equipped with an integrating sphere assembly (150 mm), with BaSO4 as a reference standard. The room-temperature steady-state photoluminescence emission and excitation spectra were collected on a F7000 spectrometer (Hitachi, Tokyo, Japan) equipped with a 150 W Xenon lamp as the excitation source, while the low-temperature photoluminescence spectra were recorded on a FLS 920 spectrofluorometer (Edinburgh Instruments, Edinburgh, UK) with a 450 W xenon lamp as the excitation source. The emission spectra were corrected for the recording system’s spectral efficiency. The decay dynamics traces in microsecond and millisecond scales were conducted using an optical parametric oscillator (OPO) as the pulse excitation source, and the signals were analyzed by using a Triax550 spectrometer (Horiba, Paris, France) and a TDS3052 digital oscilloscope (Tektronix, Beaverton, OR, USA), while those in a nanosecond scale were obtained by using the time-correlated single-photon counting method on a FLS 920 spectrofluorometer (Edinburgh Instruments, Edinburgh, UK) equipped with a photon-counting detector of a photomultiplier tube (PMT) R928 and a hydrogen flash lamp as the excitation source. For temperature-dependent (13–300 K) PL measurements, the sample was mounted on a closed-cycle helium cryostat holder using Silver Adhesive 503 supplied by Electron Microscopy Sciences. All the measurements were carried out at room temperature unless otherwise noted.

3. Results and Discussion

3.1. Materials Composition, Crystalline Structure, and Morphology

At present, many solution-based synthesis techniques including precipitation, sol-gel, pyrosol, pyrolysis, sonochemical, hydrothermal, and solvothermal processes have been developed for ZrO2 nanoparticles during the past few decades [14,15,16,17,18,19,20,21,22,23,24,25,31,32,33], which are favorable for controlling the size, morphology, and surface chemistry of the resulting product. Herein, a facile solvothermal method was adopted to prepare the pristine, Eu3+ singly doped and Ti4+/Eu3+-co-doped ZrO2 NCs using alkoxide precursors as the Zr source and n-butoxide as solvents. 
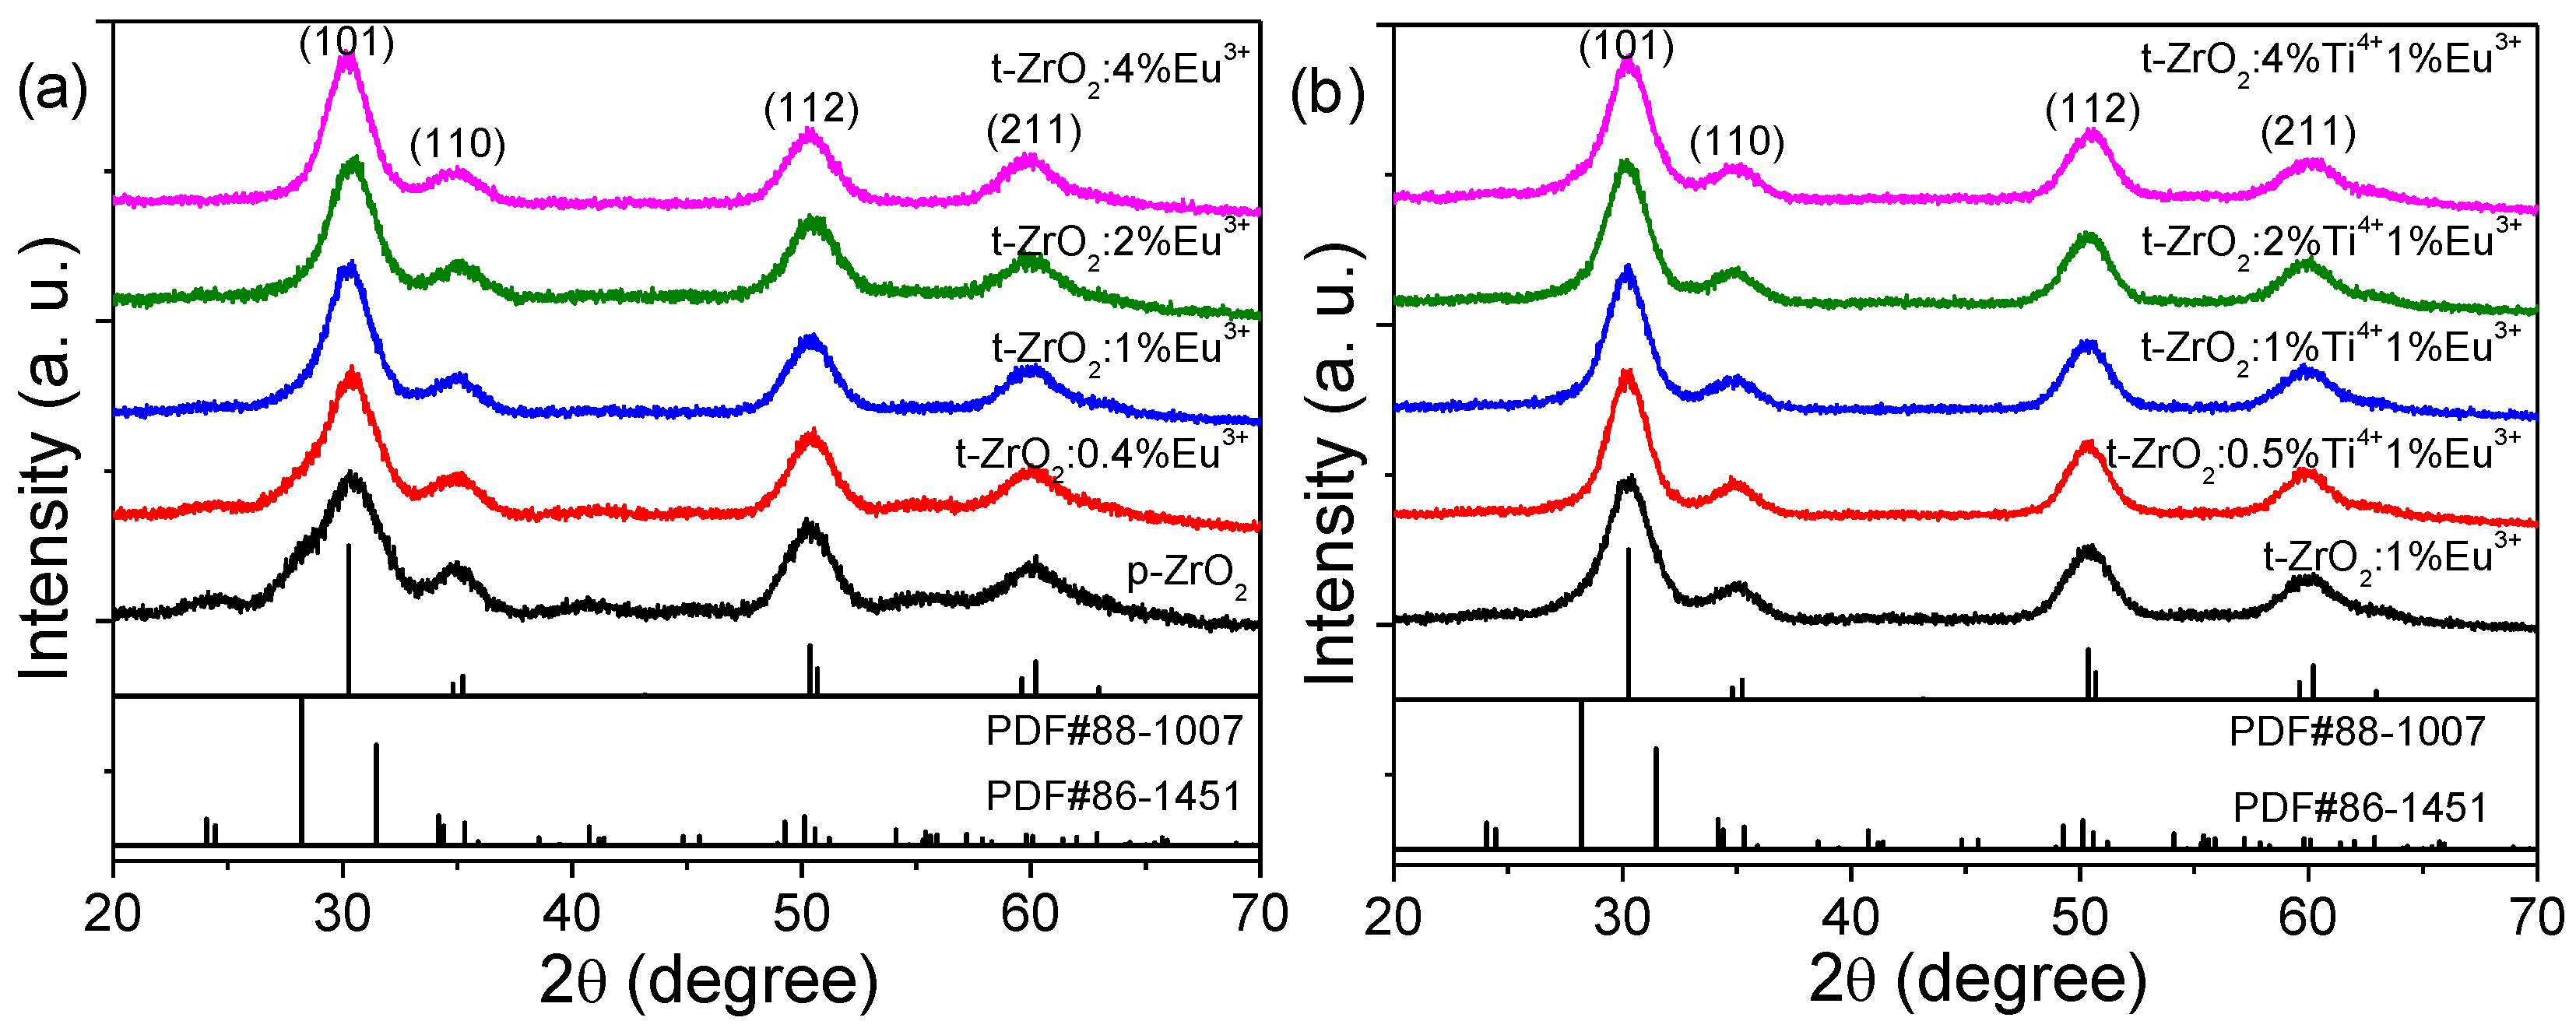
Figure 1 shows the powder XRD patterns of the as-obtained nanoparticles. Broad reflection peaks were observed in all of the samples, indicating a smaller crystallite size. Phase purity was examined upon indexing the reflection peaks to the standard patterns; a mixed phase of the predominant t-ZrO2 and a relatively small amount of m-ZrO2 (<10 vol%, additional weaker peaks at ~24.5°, 40.7°, and 55°) could be distinguished in the p-ZrO2 and the samples doped with a low concentration of Eu3+ (<2 mol%), while additional Ti4+ doping had no significant effect on the crystalline-phase purity. A high purity of t-ZrO2 NCs was obtained for the Eu3+ content above 2 mol% due to the production of more compensation defects of oxygen vacancy, which agrees well with a previous report [38]. Due to the same valency (4+) and slightly smaller ionic radius (CN8, 0.74 Å@Ti4+, 0.84 Å @Zr4+), the Ti4+ ions were expected to substitute for Zr sites in the cation network, and the obtained samples were a true solid solution of two oxides.
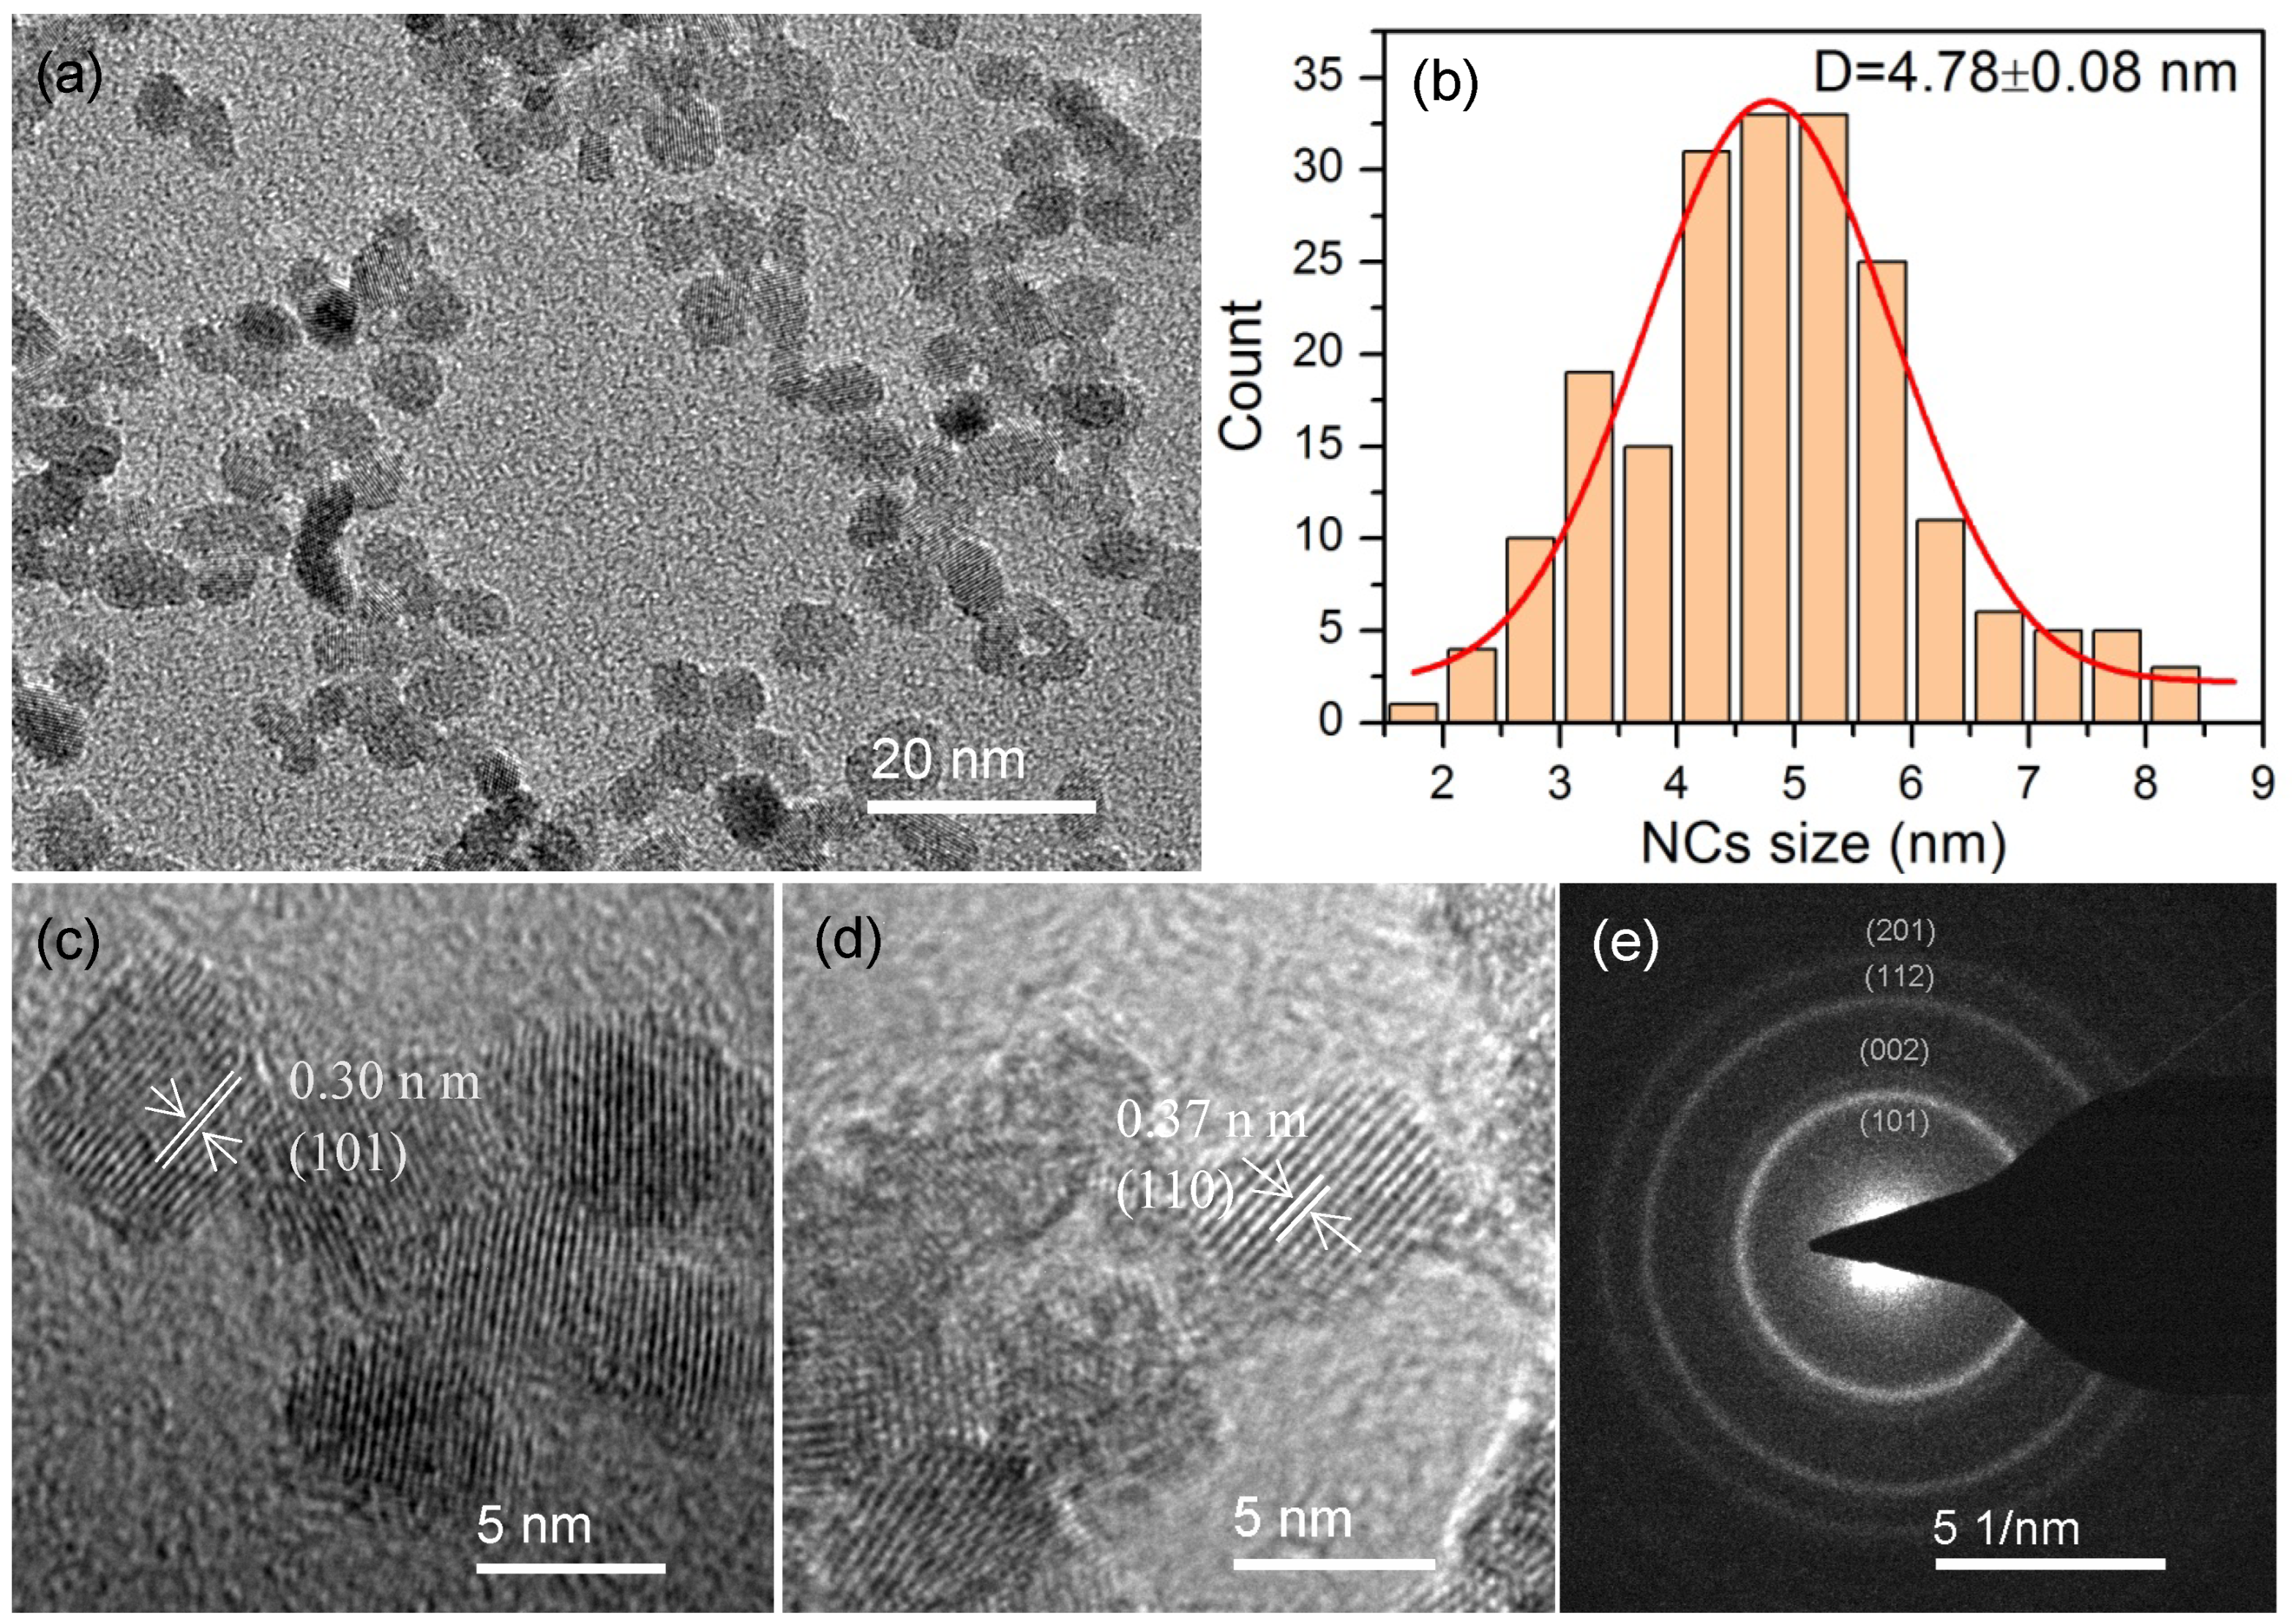
Figure 2a exhibits the TEM images of the as-synthesized p-ZrO2 NCs. The NCs were mostly round-shaped with similar sizes, despite the presence of a few oval-shaped or interconnected NCs. A histogram of more than 200 NCs is shown in Figure 2b, and a mean size of ~4.78 nm with a standard deviation of ~1.7% (0.08 nm) was derived, indicating a narrow-size distribution of the NCs. The high-resolution (HRTEM) image (Figure 2c) clearly demonstrates the single crystallinity of individual NCs. Lattice fringes were very clear with an observed d-spacing of ~0.30 nm, which is consistent with the lattice spacing for the (101) plane of tetragonal ZrO2 (PDF#88-1007). In addition, monoclinic ZrO2 NCs (PDF#86-1451) were also observed with the lattice spacing of ~0.37 nm for the (110) plane after a careful examination (Figure 2d). The selective area electron diffraction (SAED, Figure 2e) on an aggregation of NCs displayed a ring pattern that could be easily matched with the XRD pattern of t-ZrO2, indicating the presence of small crystallites within the aggregate and that the tetragonal crystalline phase is the principal polymorph. It is noteworthy that additional Eu3+ and Ti4+ doping did not induce any significant changes in the size and morphology of NCs upon extensive TEM observations on the other samples (see Figure S1).
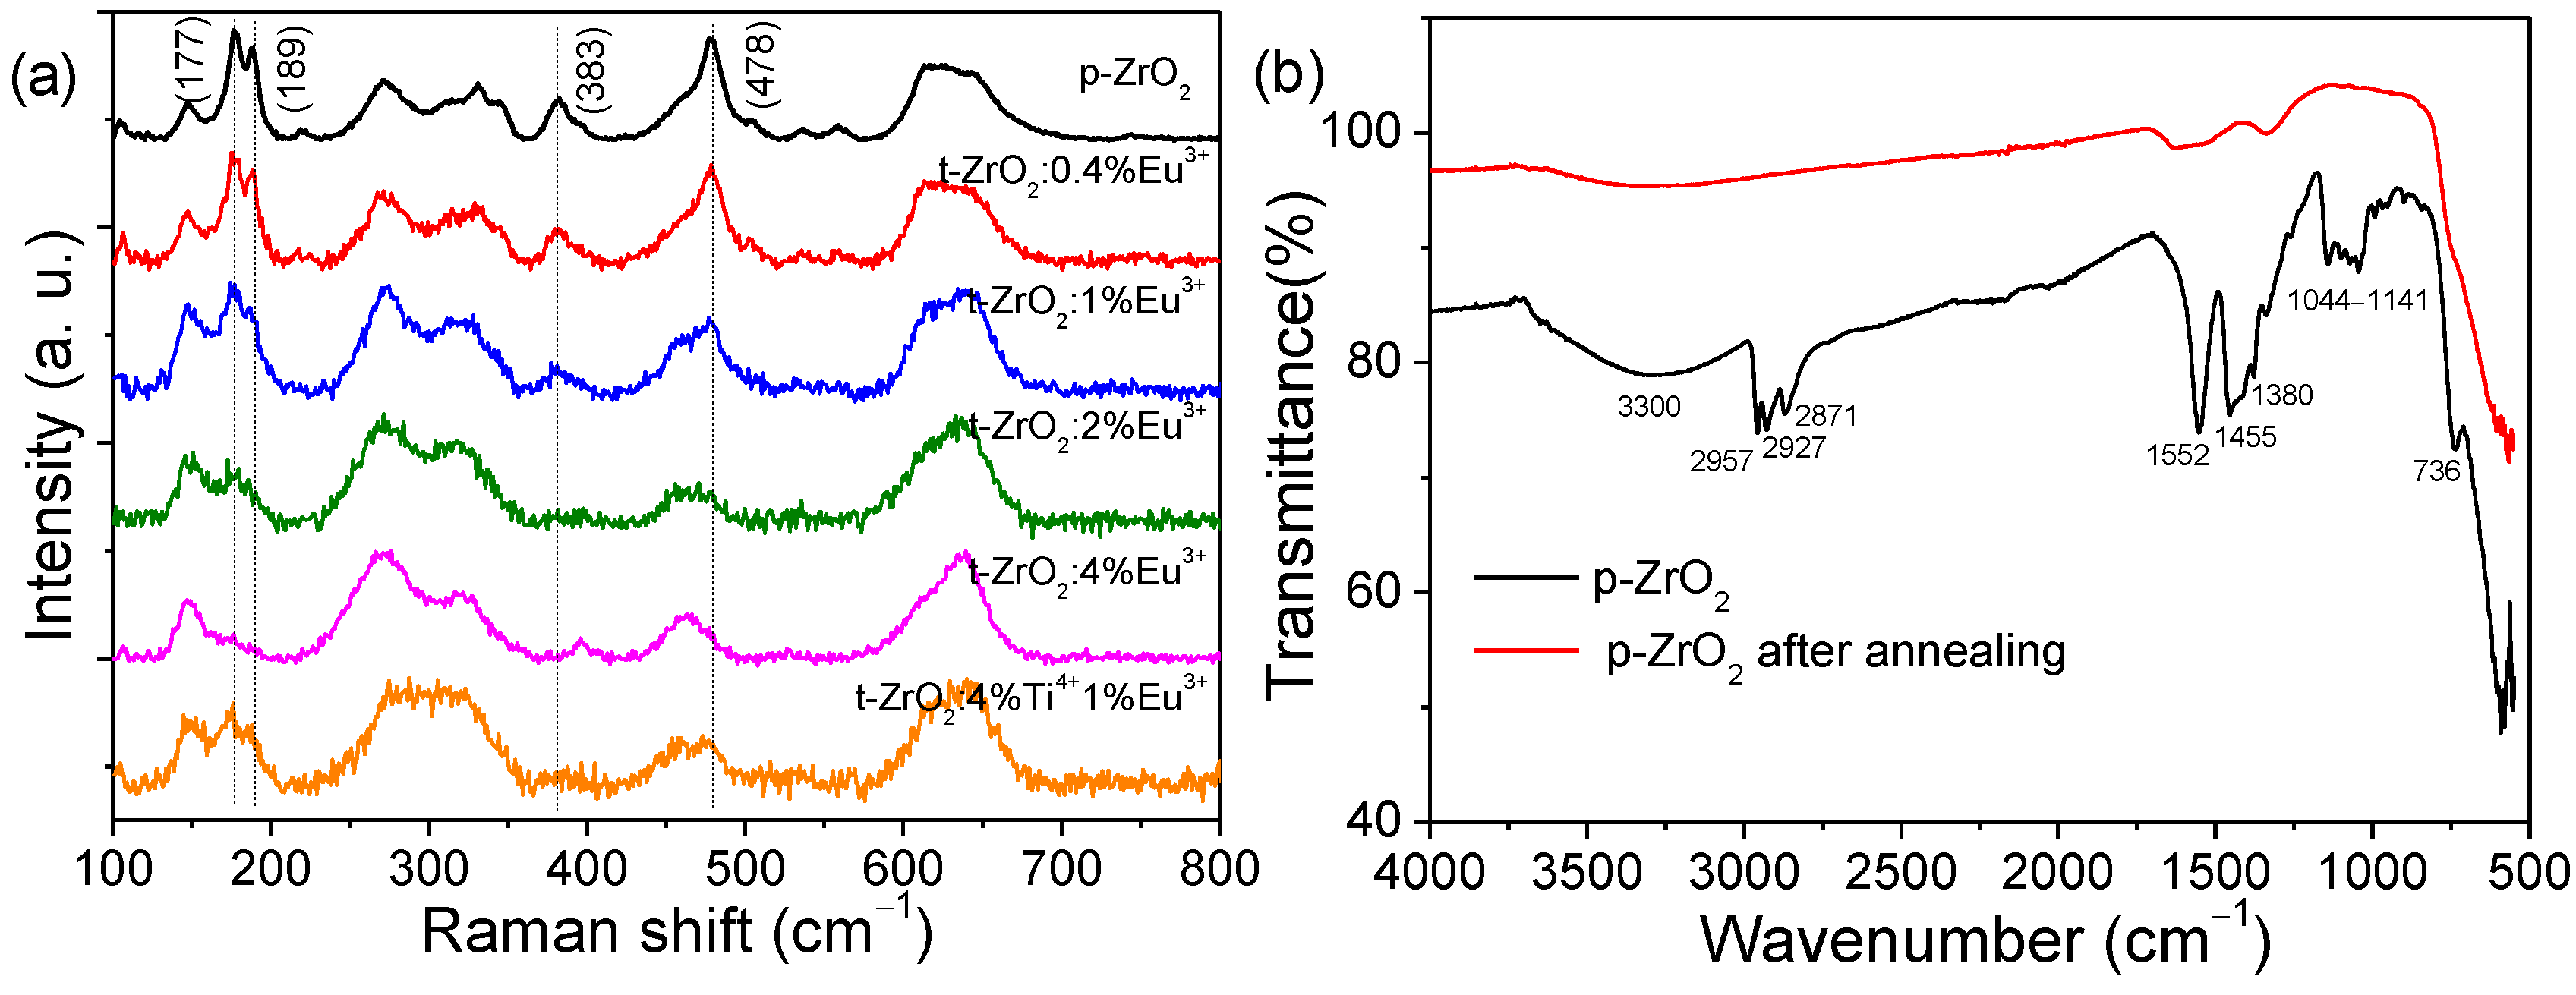
Raman spectroscopy is a powerful tool to determine phase compositions in the case of many transition metal oxides [31,39], which was further employed to verify the phase purity of the NCs prepared in this study. According to the group theory, six Raman active vibrational modes (A1g + 2B1g + 3Eg) of 18 normal modes were allowed for t-ZrO2 in the 100–800 cm−1 range while 18 of the 36 normal modes were allowed for Raman modes in the lower symmetry of m-ZrO2, among which the peaks at ~145, 270, and 650 cm−1 could be assumed as being characteristic of t-ZrO2, while a sharp doublet centered at ~180 cm−1 and a peak at ~478 cm−1 could be considered as the most sensitive analytical marks of the monoclinic phase [31,39]. Note that there was intense background luminescence when all as-synthesized particles were stimulated with a sub-bandgap laser at 325, 488, and 532 nm. Raman analysis was only possible with excitation at a longer wavelength of 830 nm by an argon-ion laser, but it showed much weaker Raman scattering. The background emissions were nearly quenched after thermal treatment at 400 °C in air. The Raman spectra of some typical samples (p-ZrO2, t-ZrO2:xEu3+, and t-ZrO2:4%Ti4+, 1%Eu3+) under investigation are reported in Figure 3a and Figure S2b. The characteristic Raman modes of m-ZrO2 appeared in p-ZrO2, but the peak intensity decreased greatly upon Eu3+ doping and almost disappeared in the 4 mol% Eu3+-doped sample. These observations of the evolution of phase purity closely followed the XRD analysis. By comparing the spectrum of t-ZrO2:1%Eu3+ with that of t-ZrO2:4%Ti4+, 1%Eu3+, it was found that the modes of m-ZrO2 were significantly weakened; this indicates that the extra Ti4+ doping suppressed the growth of m-ZrO2 NCs and favored the stabilization of t-ZrO2 NCs. Without creating oxygen vacancies, the stabilization of tetragonal ZrO2 bulk materials by undersized tetravalent dopants (Ti, Si, Ge, Sn, Ce, Th, and U) has been demonstrated previously [30].
The surface composition was characterized by FTIR spectroscopy. All of the as-synthesized ZrO2 NCs had similar spectral features. The typical FTIR spectra of p-ZrO2 before and after thermal treatment are shown in Figure 3b. For the as-obtained NCs, the presence of vibrational modes associated with hydrocarbon (~2957 (νas(CH3) C-CH3), 2927 (νas (CH2) C-CH2), 2871 (νs(CH3) C-CH3), and 1380 cm−1as(CH3)) and C-O (~1141 and 1044 cm−1)) species indicated that butoxyl groups were bound to the surface of NCs, which were most likely from the Zr source or the solvents [40]; meanwhile, the indicative absorption bands of carboxylate groups centered at ~1552 (COO antisymmetric stretch), 1455, and 1415 cm−1 (COO symmetric stretches) show that the acetate ligands (CH3COO) were definitely bonded to the NCs’ surface, since the only organic carboxylic acid involved in the synthetic procedure was acetic acid. These carboxyl groups were suggested to be coordinated to the zirconium atoms in a chelating mode given the small separation between asymmetric and symmetric stretches (Δν = νa(COO) − νs(COO) = 100 cm−1) [40]. In addition, the surface hydroxyl groups (O-H) characterized by a broad band in the 3000–3700 cm−1 range appeared in the samples. In the lower-frequency range, a peak centered at 736 cm−1 was assigned to Zr–O vibration. As shown in Figure 3b and Figure S2a, thermal treatment at 400 °C significantly removed these surface organic groups but slightly promoted the phase transformation to m-ZrO2.
The XPS analysis (Figure S3) was performed on a typical sample of t-ZrO2:4%Ti4+, 1%Eu3+ to further determine the surface composition of the as-grown NCs. From the XPS survey spectra (Figure S3a), peaks from Zr (3s, 3p, 3d, 4s and 4p), O 1s, and C 1s can be clearly seen. The doped metal elements of Ti and Eu were detected by the high-resolution XPS but with much weaker signals. As shown in Figure S3c,d, only one of the paired peaks could be clearly resolved for Ti and Eu, respectively. The peak-fitting was processed to analyze the chemical state and environment. The Ti 2p3/2 spectrum exhibited only one component at 458.7 eV, which could be assigned to Ti4+ in the oxides. No obvious extra components appeared at the lower-binding-energy side, commonly ascribed to Ti3+. This indicates that most of the Ti ions were doped in the form of a 4+ valency. As for the europium spectrum, the observed signals were mainly from Eu3+; the full width at half maximum (FWHM) of the 3d5/2 peak was approximately 6 eV, which was much greater than that of the host element of Zr (~1.5 eV, Figure S3b) and another dopant of Ti (~1.75 eV). Such a broadening is indicative of the appearance of a complex-site environment surrounding the Eu3+ immediately. The 3d5/2 peak can be further decomposed into two sub-peaks at 1133.0 and 1136.0 eV, implying that at least two types of Eu3+ ions occurred in the nanocrystals under investigation.

3.2. Optical Absorption

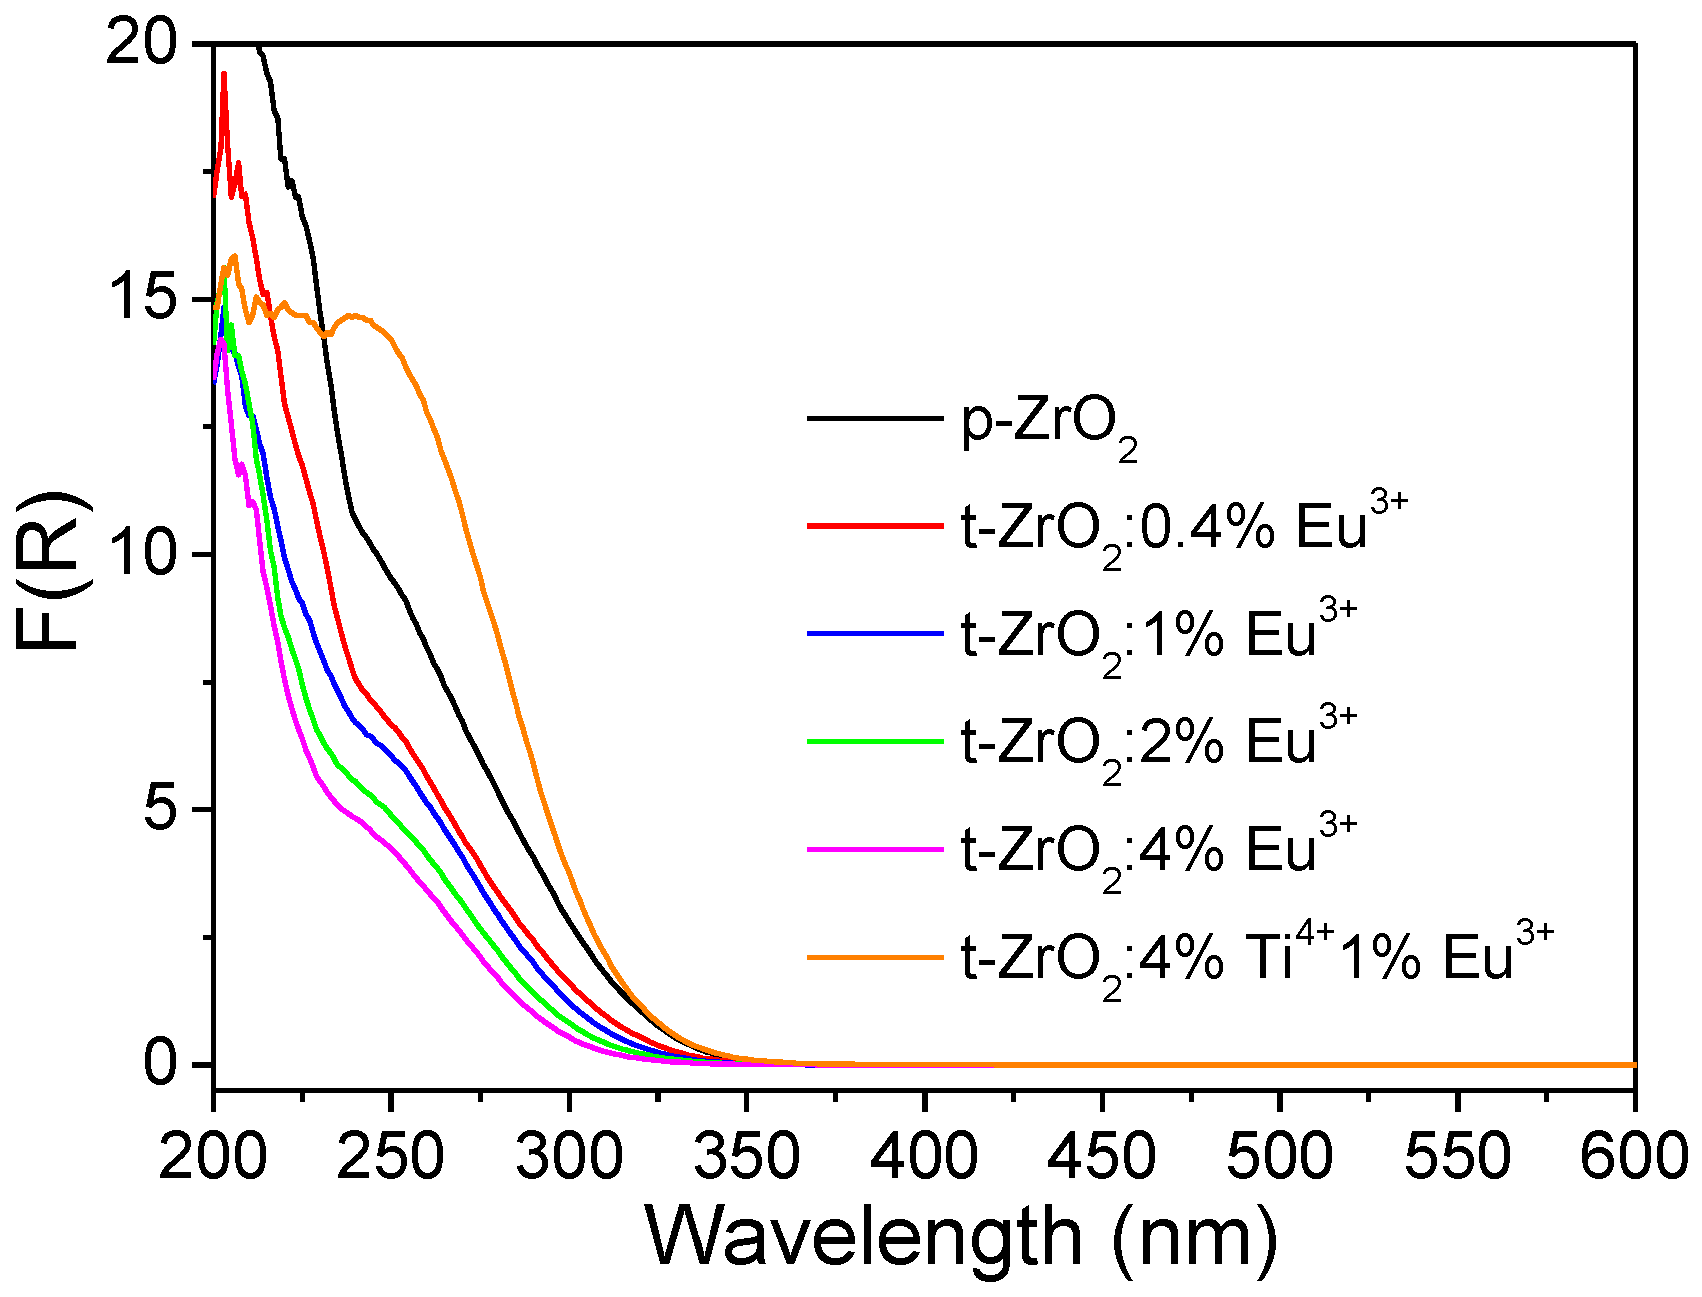
The absorption characteristics of the as-obtained NCs from 200 to 600 nm were studied by measuring the reflection of a plaque of the powders ≥1 mm thick. In the ultraviolet region, this sample thickness is sufficient to guarantee the measurement of R, i.e., the reflection at an “infinite” sample thickness [9,41]. The experimental spectra were replotted and are presented in the form of the Kubelka–Munk function F(R) vs. wavelength (Figure 4). F(R) is given by F(R)∝ (1−R)2/2R = K/S, where K and S are the phenomenological absorption and scattering coefficients, respectively [9,41].
In p-ZrO2, a weak absorption commenced in the visible region (~530 nm), followed by a steep edge developing rapidly to the shorter-wave UV region (Figure S4). Note that such intense absorption had an onset at ~350 nm (3.54 eV), and the corresponding optical absorption edge evaluation yielded a value of ~4.3 eV (this was performed following the case of a directly allowed electron transition which occurred in the tetragonal phase of ZrO2), which was much smaller than the experimentally determined intrinsic bandgap value (~5.78 eV) of t-ZrO2 [10,11,12,13]. Thus, the weaker visible absorption and stronger UV absorption were both located in the optically transparent region of the host matrix of t-ZrO2 and did not correspond to the electronic transitions from the valence band to the conduction band. These absorptions were then distinguished to correlate with some impurity ions or lattice defects, which commonly exhibit absorption below the optical band gap. The weaker visible absorption should be the main factor leading to the background luminescence encountered during Raman measurements and was suggested to arise from the carbon impurities, which were produced under the environment of a high temperature, a high pressure, and hypoxia in a sealed autoclave containing organic solvents, while the stronger UV absorption was considered to originate from the titanium impurity ions (Ti4+). We and other researchers have demonstrated previously that Ti impurities may be naturally present as traces in ZrO2 and unintentionally substitute Zr, since Zr is commonly extracted from Ti ores (e.g., ilmenite or rutile) [9,13]. The Ti impurities significantly affected the optical properties of the following experimentally reprocessed materials and induced much puzzle or debate when interpreting the optical behavior observed [9,13]. The high-purity ZrO2 reagent supplied by Aladdin Industrial Inc. (Shanghai, China) was recently evidenced to contain trace amounts of titanium impurities [9]. A corresponding charge transfer band (Ti4+ + O2−→Ti3+ + O, electron transitions from the valence O 2p states to those of the empty Ti4+ 3d orbitals) well below the fundamental absorption was observed in the pristine m-ZrO2, showing an onset at ~350 nm as well. Following this line, the Zr source of zirconium butoxide used in this study was also supposed to contain the titanium impurity. This was exactly confirmed by the ICP analysis, as a higher content of 1915.2 ppm Ti was determined in this commercial Zr source (with a Zr content of 211,108.4 ppm). The relative content of Ti to the sum of the metallic element of Zr and Ti was further determined to be ~0.9 wt% in mass percentage or ~1.7mol% in molar percentage, respectively. The above assignments are further discussed hereafter.
The doping of Eu3+ ions into inorganic oxides commonly involves additionally allowed transitions of CT (O2→Eu3+, an electron of O 2p states transitioning to the partially filled Eu3+ 4f orbitals) in the short-wave UV region. An increased absorption can then be expected, however, by comparison with the p-ZrO2; the addition of Eu3+ ions anomalously decreased the UV absorption continuously. We suggest that the degradation of the CT (O2→Ti4+) band was caused by the more competitive absorption from the CT (O2→Eu3+) transition but with a lower absorption coefficient, since both processes shared the electrons at the top of the valence band.
As shown in Figure 4 and Figure S4, additionally introducing Ti increased the absorption in both the visible and UV regions (t-ZrO2:4%Ti4+, 1%Eu3+). Obviously, the enhanced UV absorption (<350 nm) could be explained as being due to the incorporation of more Ti ions into the host lattice. The enhancement of the near-UV and visible absorption confirmed that the presence of such carbon impurities had more correlation with the titanium element.

3.3. Photoluminescence of p-ZrO2 NCs

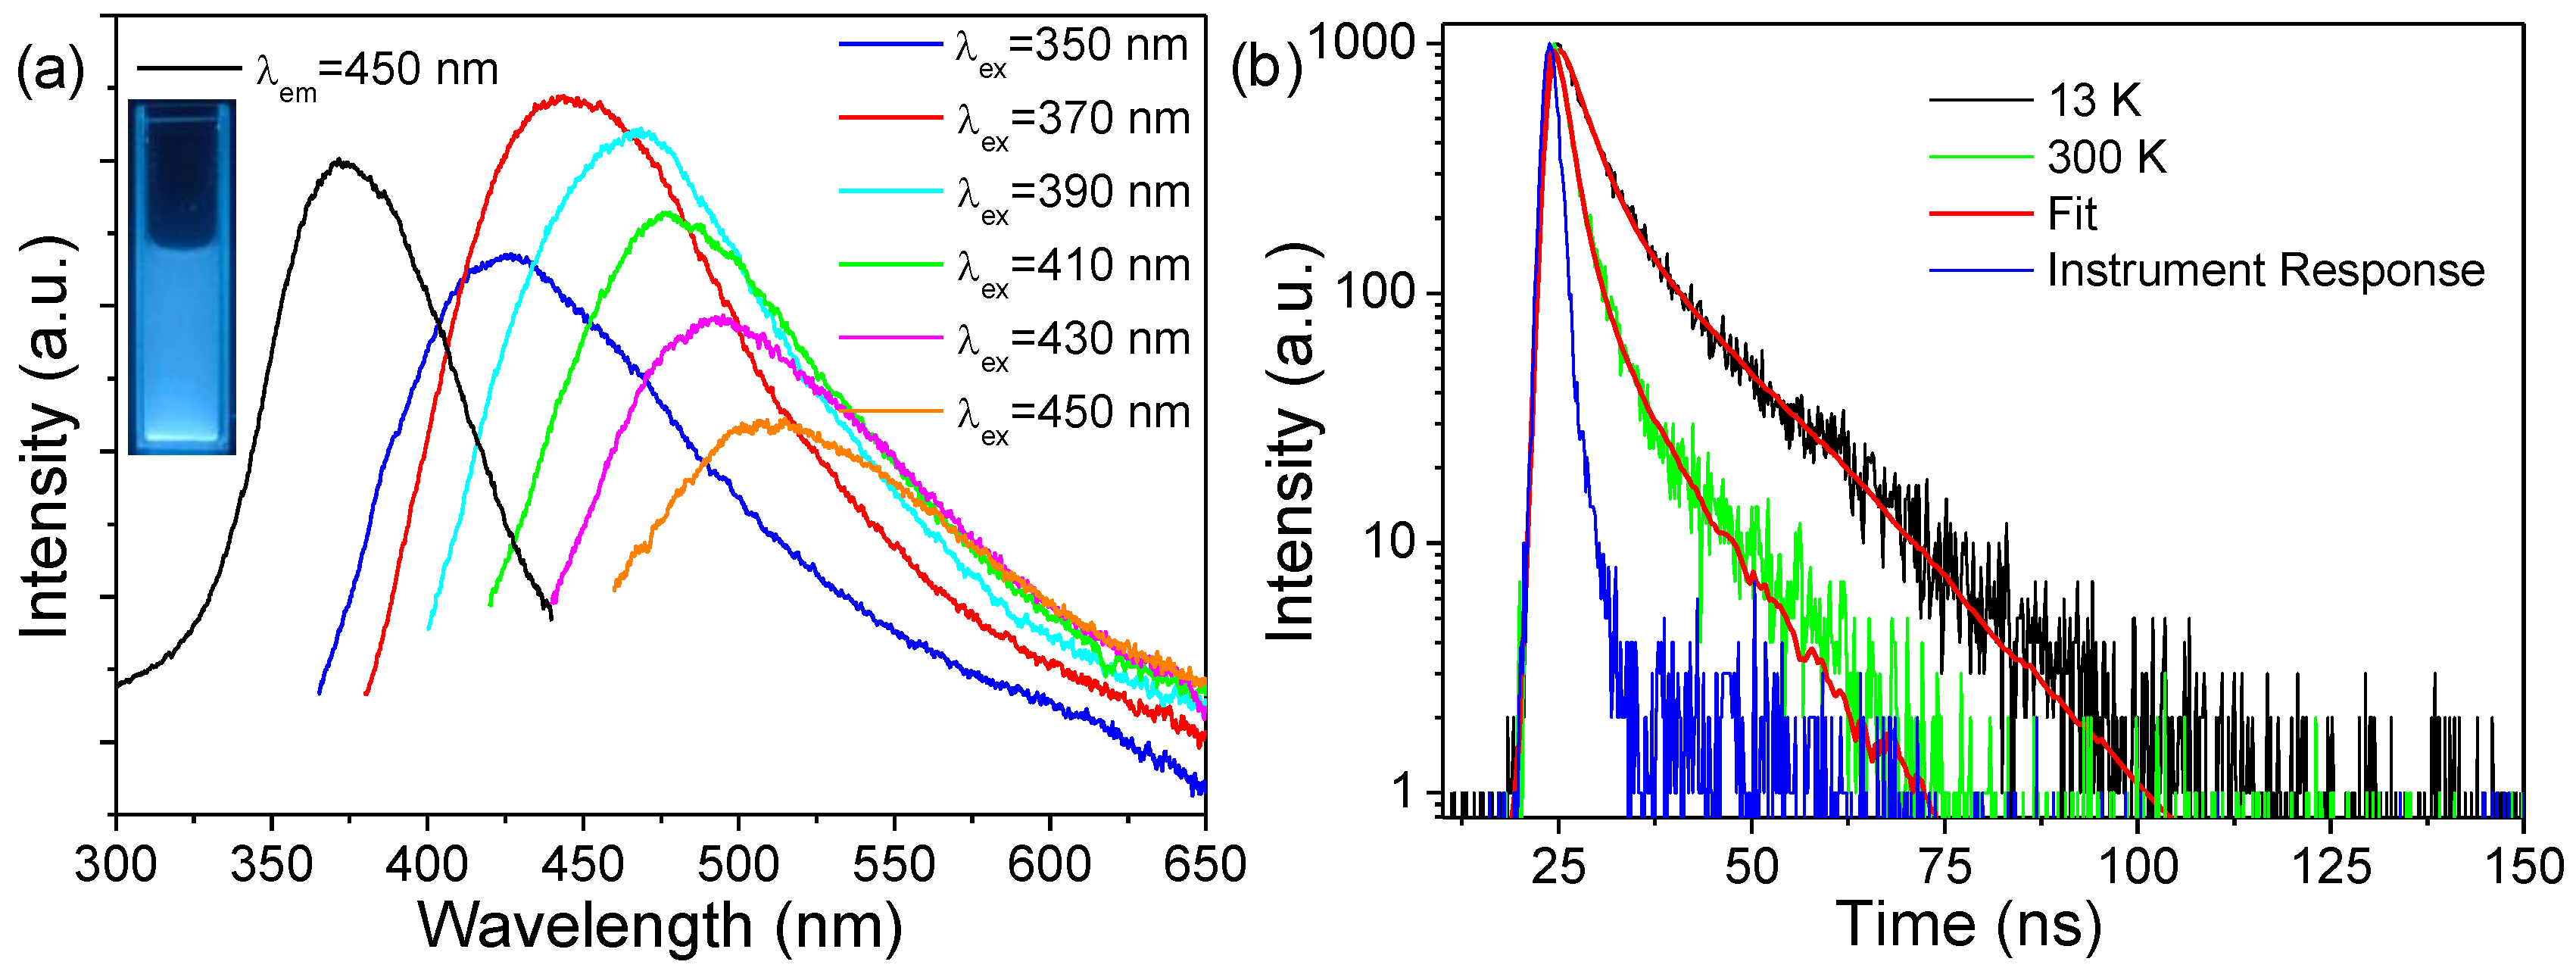
The as-synthesized p-ZrO2 NCs showed a bluish color under a hand-held UV lamp (inset of Figure 5a), which could be quenched after lower-temperature annealing at 400 °C for 4 h. In the fluorescence spectra (Figure 5a), p-ZrO2 NCs have optimal excitation and emission wavelengths at ~370 nm and 450 nm. The effective PL excitation ranged mainly from the long-wavelength UV-to-visible spectral region and did not display pronounced emissions under shorter-wave UV excitation. An excitation-dependent PL behavior was observed; as λex increased, the emission spectra were systematically displaced toward longer wavelengths and the intensity decreased with λex > 380 nm. The dependence of emission wavelength and intensity on λex has been identified as a generic feature of various types of carbon nanomaterials and silica xerogels [42,43]. These emissions feature a very small Stokes shift and lead to background luminescence during Raman measurements. The fluorescence decays (Figure 5b, λex = 370 nm, λem = 450 nm) displayed a non-exponential behavior and had a lifetime of a nanoseconds magnitude even at a lower temperature of 13 K. The faster fluorescence decays indicated that the electronic transitions in the present luminescent species had a full parity/spin-allowed character. The traces could be fitted into bi-exponential function as I(t) = A1 exp(−t/τ1) + A2 exp(−t/τ2), where τ1 and τ2 are the time constants corresponding to slow and fast components, and A1 and A2 represent the amplitudes of each component at t = 0, respectively. The yielded time constants had the values of τ1~12.1 (A1~0.024) and τ2~2.9 ns (A2~0.099) at 13 K, and τ1~6.8 (A1~0.016) and τ2~1.4 ns (A2~0.175) at 300 K. The prolonged average decay times at a lower temperature were attributed to the reduced nonradiative transitions via electron–phonon coupling or thermally activated energy migration or transfer to quenching centers. By considering the PL characteristics including long-wave UV excitation, excitation-dependent emission, smaller Stokes shift, and shorter fluorescence lifetimes, we assigned the luminescence to the trace amounts of carbon dopant impurities, as performed previously for the PL of sol–gel-derived pristine ZrO2 and Y2O3 nanoparticles [43]. The carbon dopant impurities could be readily formed during the solvothermal processes, where the high temperature and the high pressure acted upon the organic ligands and solvents and favored the incorporation of carbon impurities.
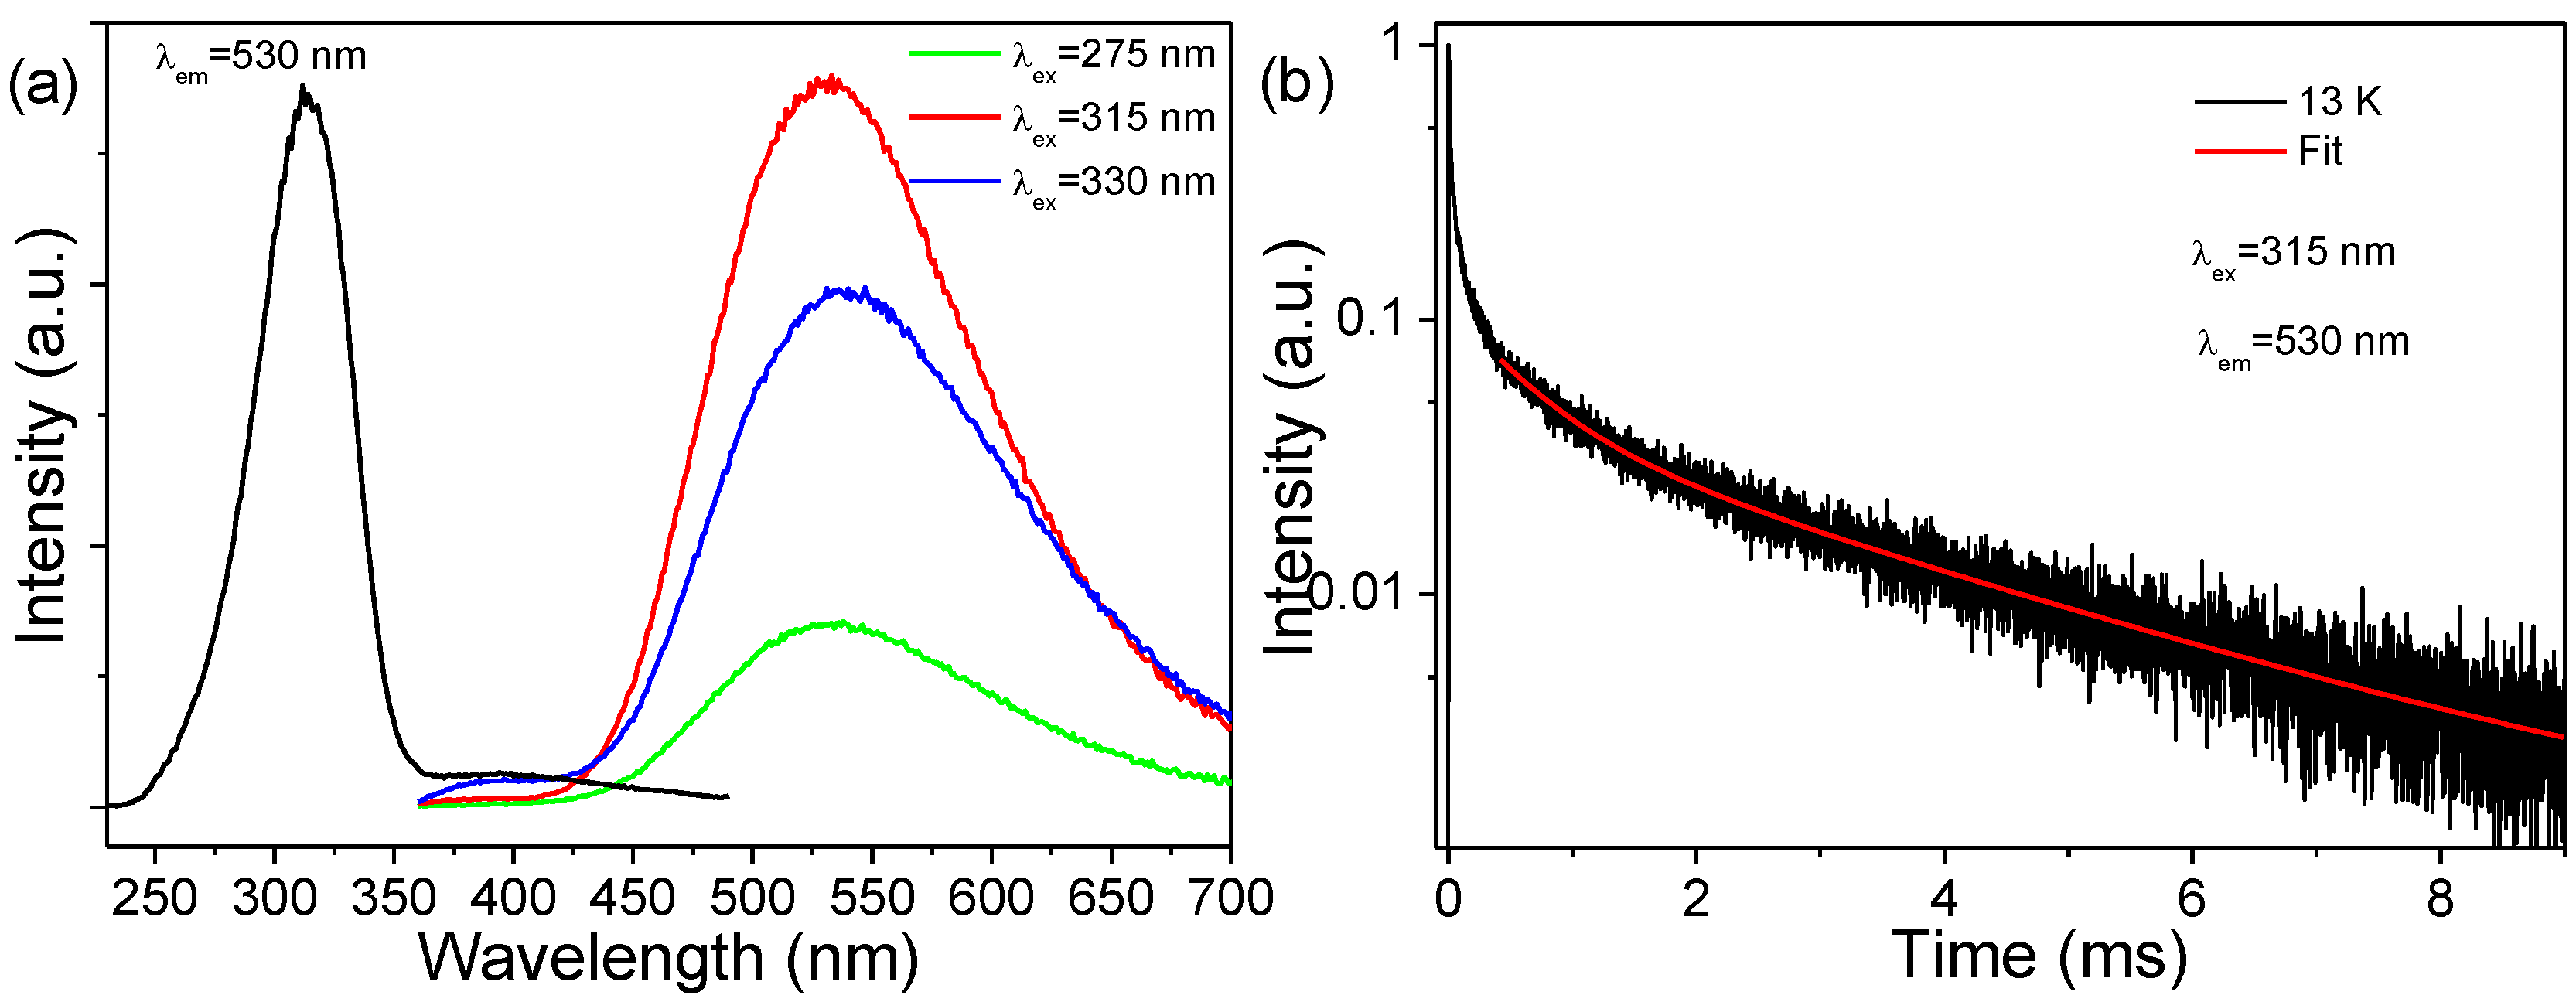
Figure 6a shows the PL excitation and emission spectra of the p-ZrO2 NCs at 13 K. In sharp contrast to the room-temperature PL, there existed an intense shorter-wave UV excitation band covering the 230–360 nm range (centered at 315 nm), which yielded bright broadband white luminescence in the 400–700 nm range (centered at 530 nm) with a large Stokes shift reaching ~13,000 cm−1 and an insignificant excitation-dependent emission. Such an excitation band coincides well with the observed strong absorption in Figure 4, which is, thus, ascribed to CT (O2→Ti4+) transitions in the titanate groups [9]. Note that the carbon impurities-related excitation was also observed in the range of 360–490 nm by reason of the spectral overlapping of PL emissions [43], but it was much weaker in intensity. In Figure 6b, the fluorescence decay shows a much longer lifetime in the scale of milliseconds. There exists an initial rapid non-exponential component, followed by a much slower component at later times. The rapid component corresponds to the luminescence of carbon impurities discussed above, which was slightly excited by the short-wave UV irradiation at a low temperature, while the slower one arose from the CT (Ti3+→O) emissions in the titanate groups, of which the long decay times at lower temperatures have been previously observed for Ti4+ in monoclinic hafnia (HfO2) [8], indicating that the emission results from a strongly forbidden transition, presumably a triplet state of a strong spin-forbidden character. The slow component in the trace is clearly two-exponential with the two resolved decay time constants having values of τ1~0.56 and τ2~2.98 ms, which are comparable with previous reports [8].

3.4. Photoluminescence of t-ZrO2:Eu3+ NCs

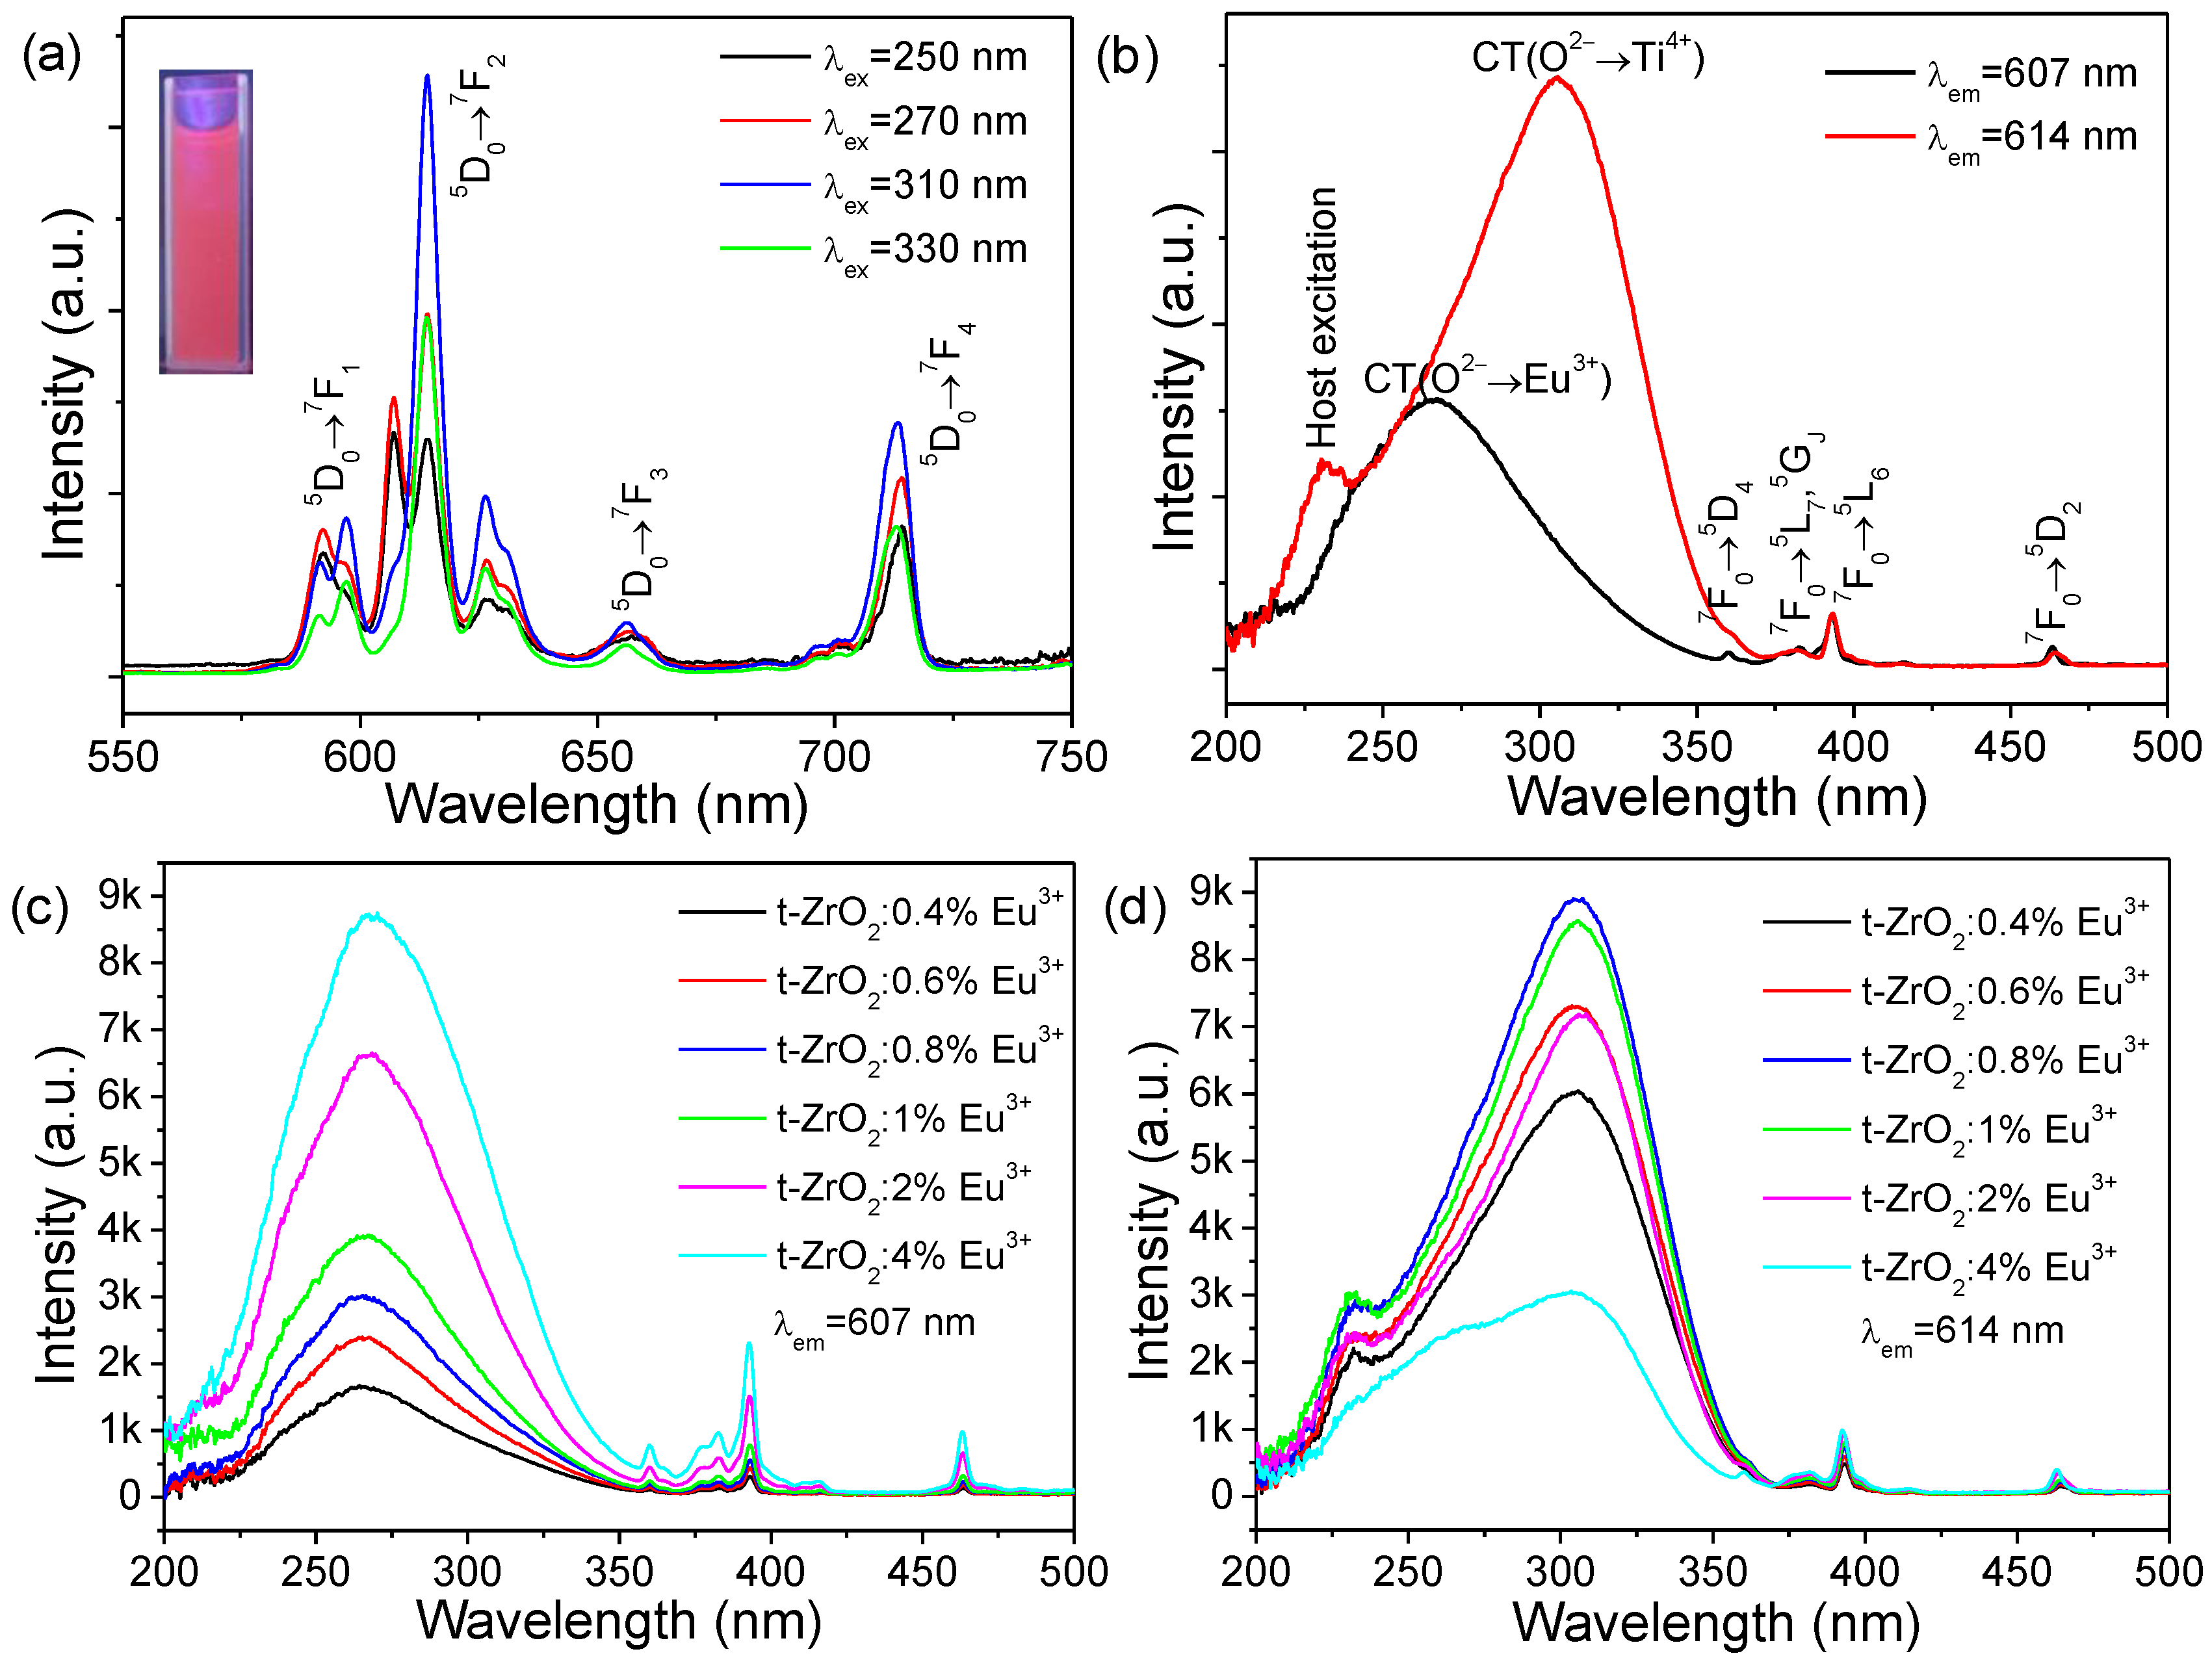
Since the general PL characteristic features of the sample series of t-ZrO2:xEu3+ (x = 0.4–4%) were experimentally found to be analogous at room temperature, the typical PL excitation and emission spectra from t-ZrO2:1 mol%Eu3+ were selected and are shown in Figure 7a,b. The emission of these nanophosphors exhibits the well-known Eu3+ emission lines from the 5D0 level to the 7F manifold; however, a closer inspection of the PL spectra recorded with different irradiations in the short-wave UV region (Figure 7a, λex = 250, 270, 310 and 330 nm) suggests that at least two sets of emissions, arising from two types of Eu3+ (designated as Eu(I) and Eu(II)), could be distinguished to be present in the samples, the assignment of which is tabulated in Table S1. The main emission lines for Eu(I) and Eu(II) are both from the 5D07F2 transitions and are located at ~607 and 614 nm, respectively. Clearly, the asymmetry ratio (R) of the integrated intensities of the 5D07F2 and 5D07F1 transitions (R = I(5D07F2)/I(5D07F1)) in Eu(II) is much larger than that of Eu(I) [15]. Due to the different intensity mechanisms, it is known that the R values can be considered indicative of the asymmetry of the coordination polyhedron of the Eu3+ ion. In particular, the lower the R value is, the higher the site symmetry of the Eu3+ ion [15]. It follows that Eu(II) occupies a noncentrosymmetric site with a much lower symmetry while Eu(I) experiences a much higher symmetry of the local surrounding. Noteworthy is the spectral features of the Eu(II) luminescence (number, relative intensities, and energetical positions of lines) which closely resemble those of bulky and nanocrystalline m-ZrO2 reported previously [9,15].
Figure 7b presents the excitation spectra of the emissions monitored at their relative maxima of Eu(I) (λem = 607 nm) and Eu(II) (λem = 614 nm). Both excitation spectra consist of a broad band covering the 200−370 nm range of wavelengths and some sharp lines of the intraconfigurational transitions of the 4f6 configuration of the Eu3+ ion. Obviously, the broad excitation bands both show an asymmetric profile, but they peak at different energetical positions, which are located at ~265 nm and 305 nm for Eu(I) and Eu(II), respectively. An additional shoulder (λex = 230 nm) could be clearly observed for Eu(II) on the high-energy side of the main band. This observation confirms the presence of two types of Eu3+. Upon a closer examination, the asymmetric broadband in the range of 220–360 nm has at least two components for Eu(I) and three components for Eu(II). If we fit such spectral curves to the Gauss function roughly, we could obtain two sub-bands peaking at 260 and 283 nm for Eu(I) (denoted as Eu(I)-G260 and Eu(I)-G283, respectively) and three sub-bands peaking at 232, 279, and 313 nm (denoted as Eu(II)-G232, Eu(II)-G279, and Eu(II)-G313, respectively), as shown in Figure S5. The small energy difference between Eu(I)-G283 and Eu(II)-G279 points to the same origin for both bands.
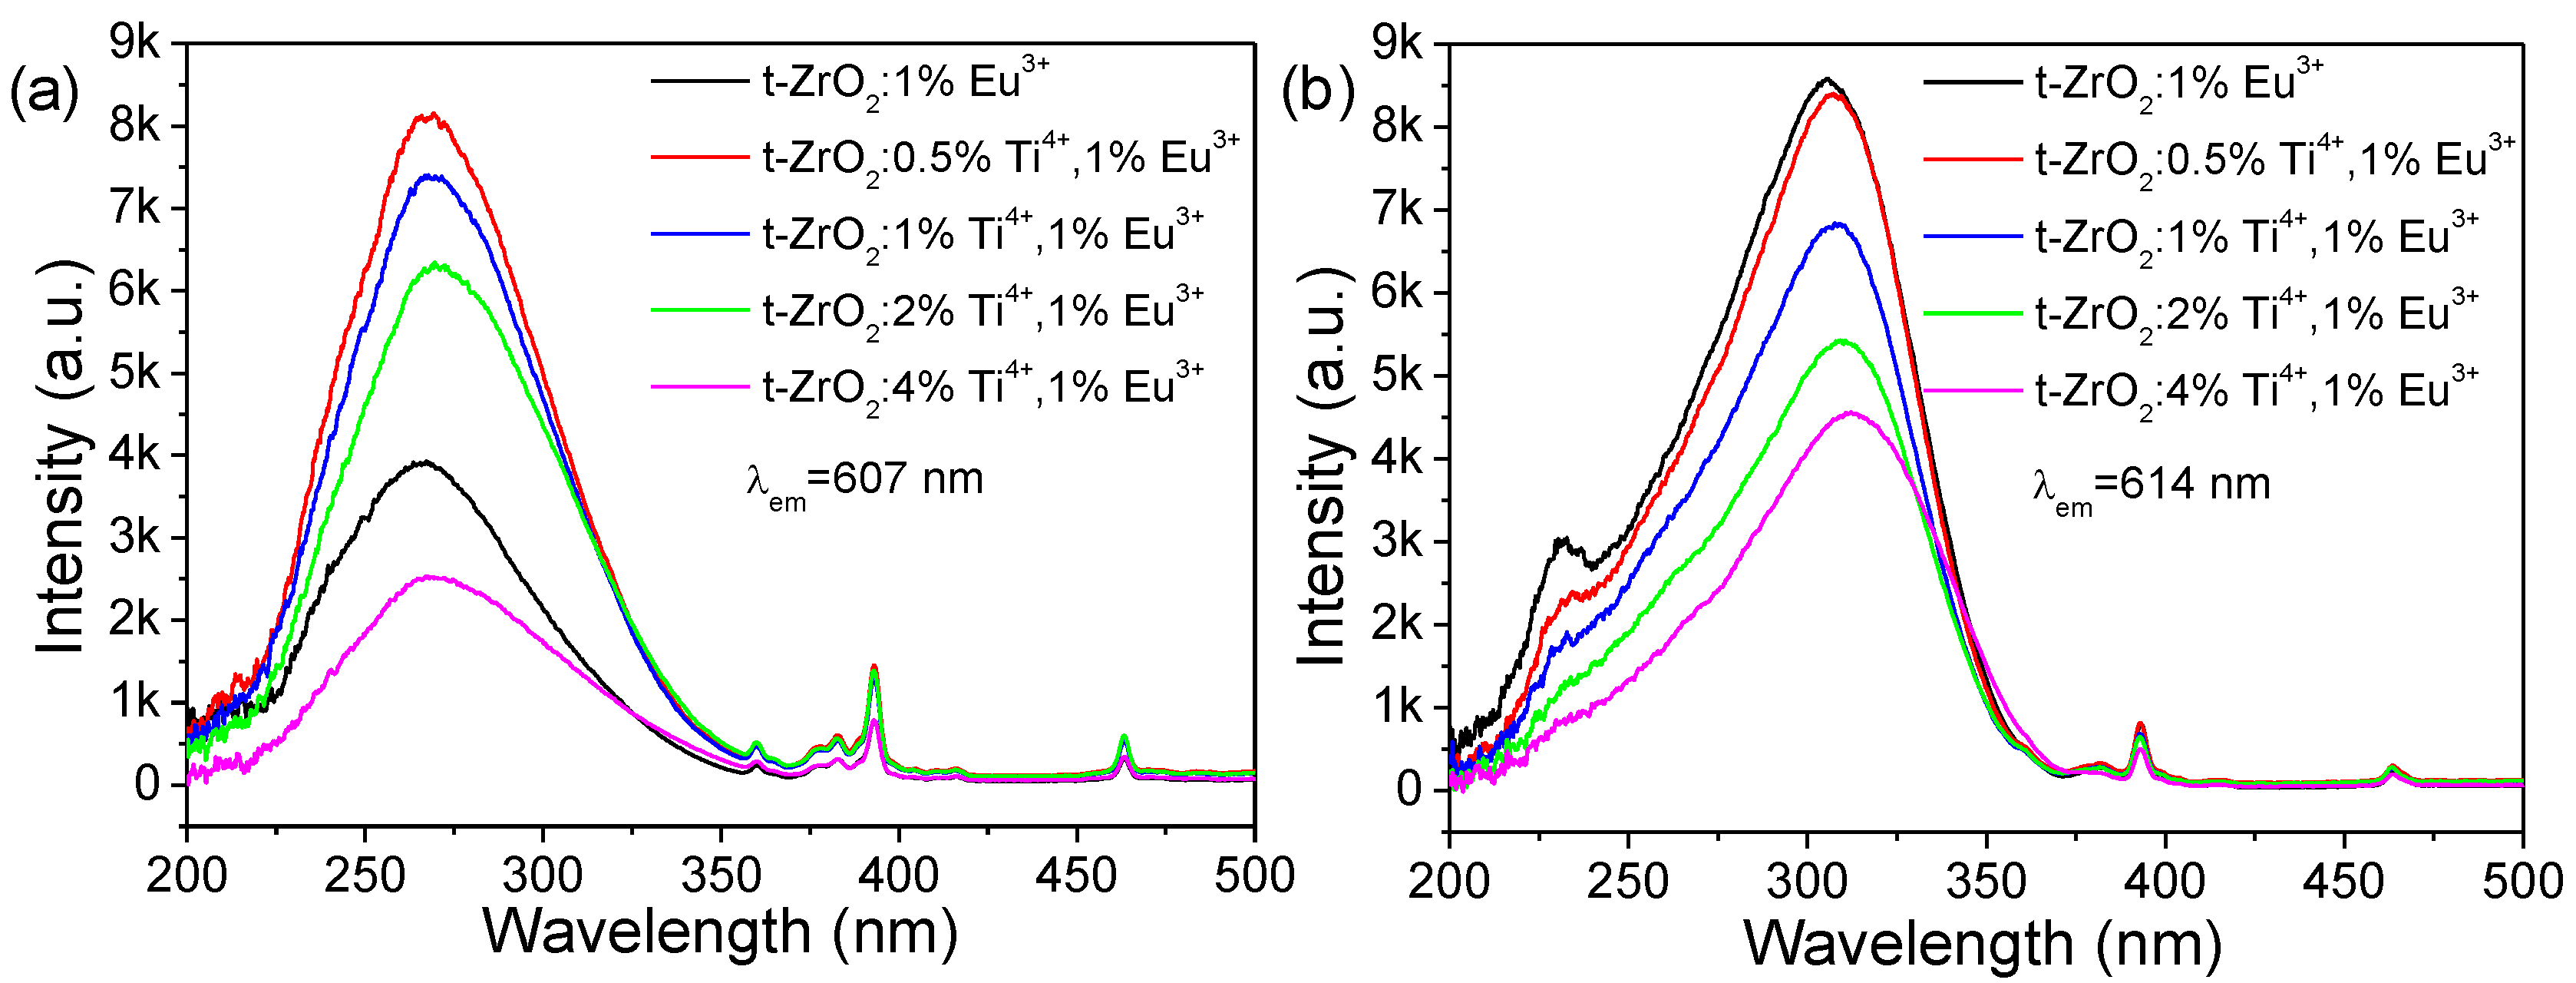
Figure 7c,d show a comparison of the excitation spectra of samples with different doping levels by monitoring the relative maxima of Eu(I) (λem = 607 nm) and Eu(II) (λem = 614 nm), respectively. Clearly, the broad excitation band of the λem = 607 nm emission intensified successively with the increasing Eu3+ concentration, while those of the λem = 614 nm emission reach a maximum intensity at x =0.8 mol % and then decrease. For Eu(I), the normalized spectra, as shown in Figure S6, indicate a slightly increased relative ratio of the Eu(I)-G283 sub-peak with increasing Eu3+ concentration.
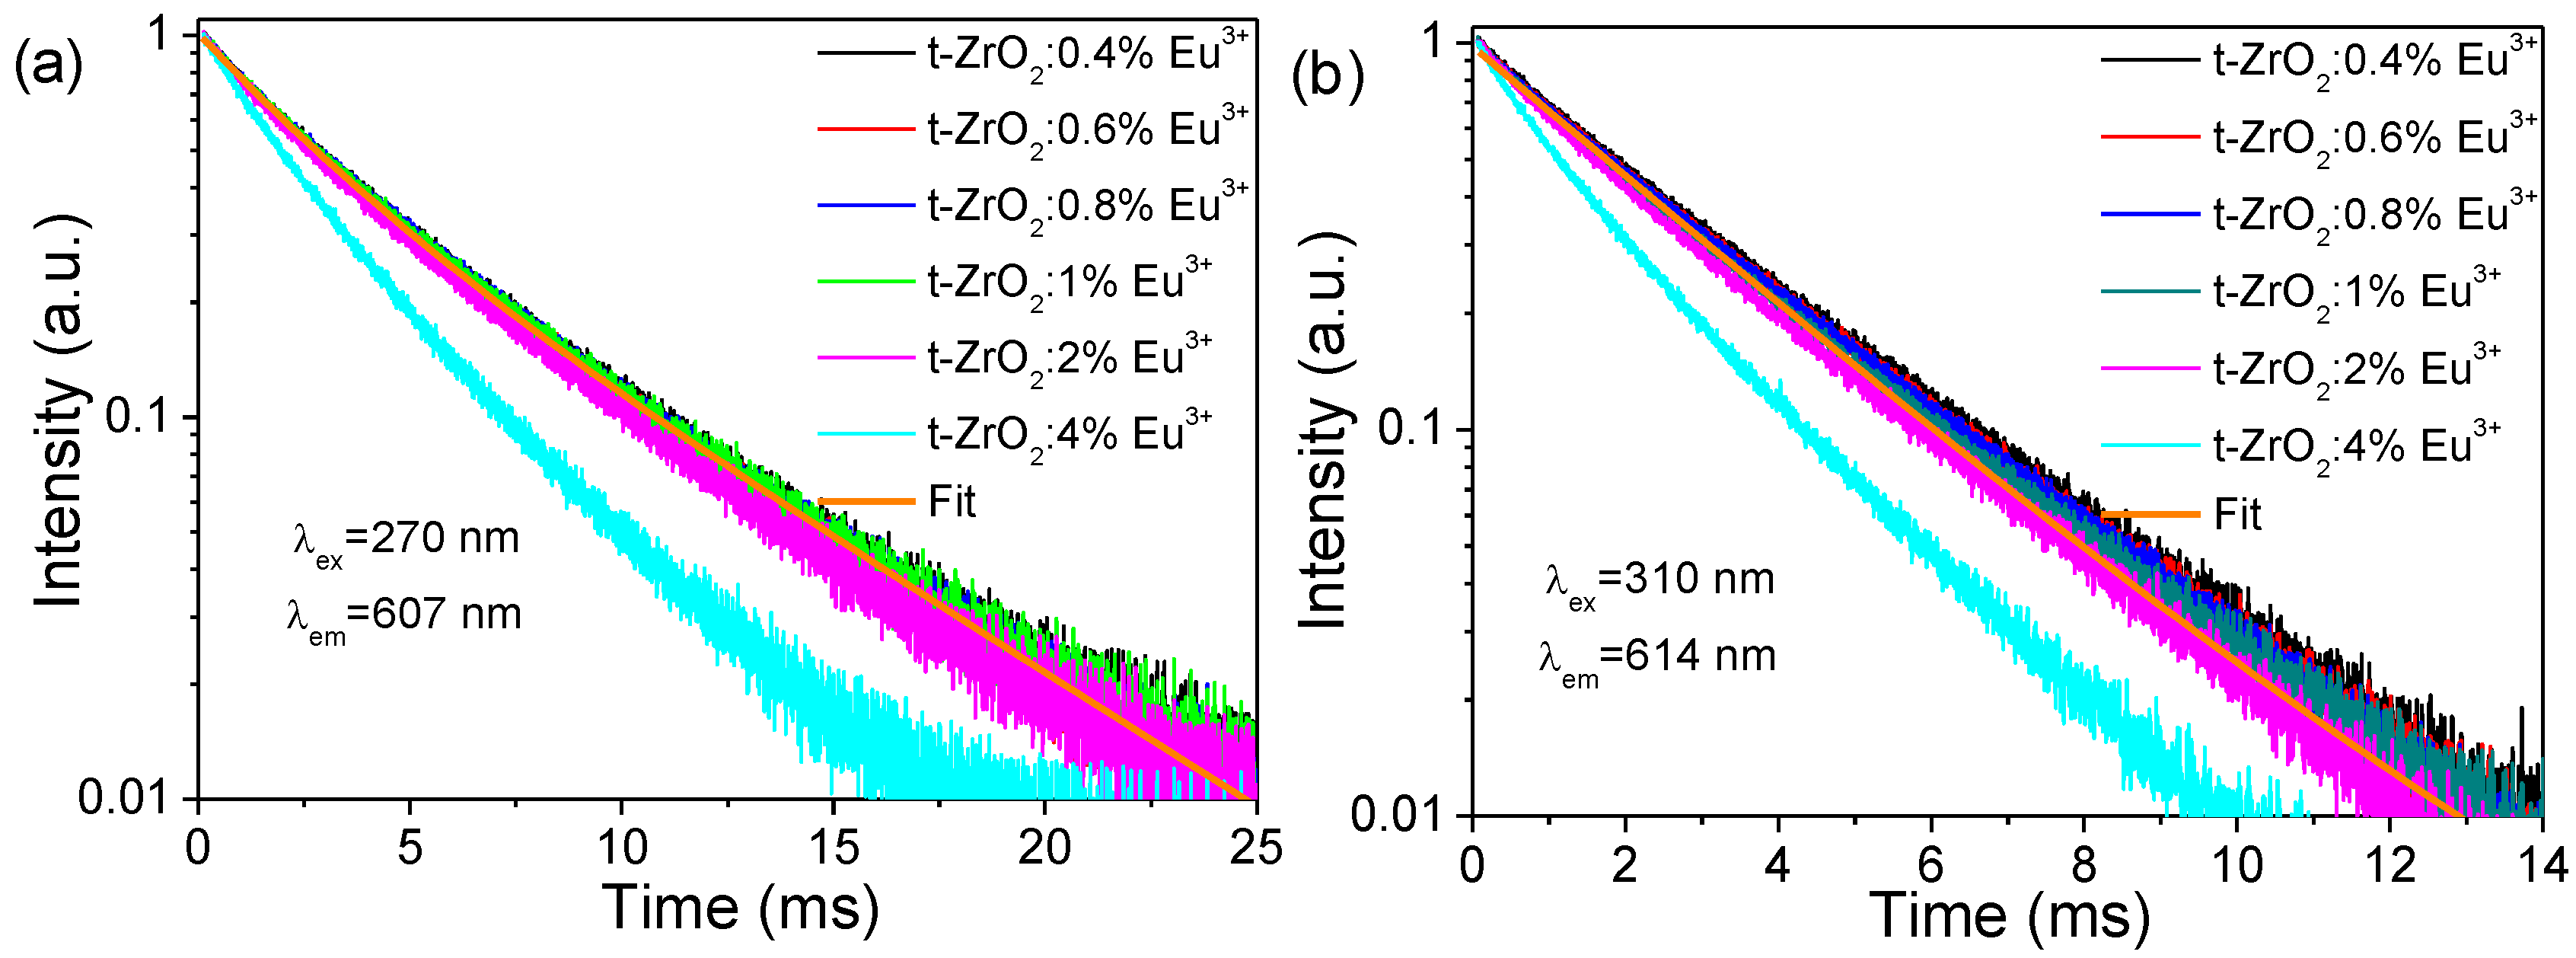
Figure 8a,b show the fluorescence decays of Eu(I) and Eu(II) in the t-ZrO2:xEu3+ (x = 0.4–4 mol%) samples. It can be seen that, regardless of Eu(I) or Eu(II), the traces almost superimpose with each other in the content range of 0.4–1 mol% and then decay much faster with increasing Eu3+ concentration. All of the traces are rarely pure single-exponential in character even at lower doping levels. For the t-ZrO2:xEu3+ (x = 0.4–1 mol%) samples, the experimental decays could be well approximated by the fit using the bi-exponential function, yielding the time constants of τ1~6.23 and τ2~2.54 ms, where the only differences are the relative contribution of the fast and slow components to the whole decay traces. For Eu(I), the slow component dominates the decays (Rel. 72.6%), while for Eu(II), the fast component dominates the decays (Rel. 91.8%). It is, thus, considered that Eu(I) and Eu(II) have a lifetime constant of ~6.23 and 2.54 ms, respectively; the non-exponential behaviors are due to spectral overlapping between the emissions of Eu(I) and Eu(II). Faster decays at the ≥2 mol% Eu3+ contents were caused by the concentration quenching, which occurred via energy migration through the lattice, or they were caused by the clustering of activators. Note that the lifetime constant of Eu(II) (≤2 mol%) was approximately 3.7-fold larger than that of Eu3+ in m-ZrO2 with a determined value of~0.68 ms [9].
As demonstrated in Section 3.2, there is little doubt that the absorption in the short-wave UV region was mainly from the host lattice, CT (O2→Eu3+), and CT (O2→Ti4+) transitions in titanate groups. The question we now face is the assignments of these sub-bands. Such a Eu(II)-G232 band could be ascribed to the excitation in the host lattice followed by energy transfer to the Eu(II) ion upon considering the higher-energy nature (~5.3 eV), which approach the bandgap value of ~5.78 eV [10]. The dependence of the Eu(I)-G260 sub-band on the Eu3+ concentration coincides with the analysis of the optical absorption and suggests that it is due to CT (O2→Eu3+) transitions (direct excitation of Eu3+ centers). The sum of the sub-bands of Eu(II)-G279 and Eu(II)-G313, thus, arose from the titanate groups’ excitation, as was further confirmed by the bright CT (Ti3+→O) emissions under such excitations at 13 K (Figure S7a, t-ZrO2:0.4%Eu3+). In addition, the spectral profile of such a room-temperature broad excitation band of the Eu3+ emissions closely followed the low-temperature excitation spectra of the CT (Ti3+→O) broadband emissions in p-ZrO2 and t-ZrO2:0.4%Eu3+ (Figure S7b; note that for the FLS 920 spectrofluorometer, the excitation radiation below about 250 nm is too weak to obtain reliable excitation spectra in the deep UV [8]). The indirect excitation of the Eu3+ centers by the naturally present Ti4+ indicated that an effective energy transfer from CT (O2→Ti4+) transitions to Eu3+ centers occurred, which was previously observed in m-ZrO2:Ti4+,Eu3+ bulk phosphors [9]. Alternatively, some previous studies on the solution-synthesized ZrO2: Eu3+ NCs have attributed the broad UV excitation band to host excitation, such as the study by X. Chen et al. [16], and to the only CT (O2→Eu3+), such as the study by A. Speghini et al. [15],and their spectroscopic analyses neglected the effects of naturally occurring Ti4+ ions on the PL of the Eu3+-doped on purpose. In this study, we present more evidence to perform the assignment of the above excitation bands. It follows that the excitation of Eu(I) was dominated by the CT (O2→Eu3+) transitions, with a minor but increasing contribution from CT (O2→Ti4+) transitions at a higher Eu3+ concentration, while the inverse case occurred for Eu(II), where the excitation by CT (O2→Eu3+) transitions were negligibly small. This indicates that Eu(II) is particularly closely correlated with the Ti impurities in the host lattices, while Eu(I) is not.
We now turn to the distribution of Eu(I) and Eu(II), and some questions arise. Were Eu(I) and Eu(II) both built into the lattice structure of t-ZrO2 NCs together, that is, was most of the red luminescence emitted by the dominant phase of t-ZrO2? Or did Eu(I) and Eu(II) enter into two segregated crystalline phases, that is, Eu(I) in the dominant t-ZrO2 while Eu(II) in the m-ZrO2, given the presence of the m-ZrO2 NCs’ impurities in the lower-doping systems and the high similarity of PL emission in the case of the m-ZrO2 phase? Herein, we ruled out the second question upon the following consideration. First, the m-ZrO2 NCs impurities were of a small amount (<10 vol%), even in the less-doped samples (≤2 mol%), but a substantial intensity was invariably observed, which was more intense than that of Eu(I) up to 2 mol% under the peak excitation of the UV broadband (see Figure 7 and Figure 8). Even in the high purity of t-ZrO2:4%Eu3+ NCs, the Eu(II) emissions remained to be observed. Then, the color of the PL emissions was homogeneous across the whole body of the powders upon a careful observation under UV irradiation, which is unexpected if the resulting samples are a mechanical mixture based on a tiny amount of m-ZrO2:Eu(II) and a large fraction of t-ZrO2:Eu(I) NCs. One may argue that XRD is not sensitive enough to detect the many impurity phases of m-ZrO2 NCs and that Raman spectra (see Figure 3a) are more powerful and precise, where an intense Raman peak of a sharp doublet appeared in the samples (x = 0.4 and 1 mol%). This could be explained by the fact that monoclinic zirconia had stronger Raman signals than tetragonal zirconia under equivalent situations, as claimed by Kim et al. [44]. A third and an effective host excitation observed when monitoring Eu(II) emissions also indicated that the volume amount of the host materials should be large. The last is the much longer PL decay by a factor of ~3.7 for Eu(II) than that of Eu3+ in bulk monoclinic zirconia. This is exactly contrary to our common expectation, that is, its fluorescence lifetime constant is suggested to be much shorter than that of the bulk ones (~0.68 ms) because of the enhanced nonradiative transfer to the many quenching centers, if the Eu(II) is actually located in m-ZrO2 NCs. Fluorescence decay commonly has much more fingerprint characteristics for PL identification. Alternatively, the presence of two distinct sites in the tetragonal Ce0.2Zr0.8O2 bulk materials was observed in the literature using EXAFS and Eu3+ as a structural probe, respectively [45,46]. It is, thus, rational to reach the conclusion that most of the photoluminescent Eu3+ ions were incorporated into the t-ZrO2 NCs but located at different symmetries of sites.
Following the above elucidation on the Eu3+ distribution, we could further conclude that the Ti4+ impurities are distributed somewhat non-randomly over the sites normally occupied by Zr in the nanocrystalline matrix but approach Eu(II) ions, where the CT (O2→Ti4+) absorption in the titanate groups is more competitive to that of the direct CT (O2→Eu3+) ones. As a consequence, the indirect sensitization luminescence of Eu3+ by the titanate groups is more effective than that of the direct excitation of the Eu3+ centers. In contrast, the Ti4+ and Eu(I) ions are proposed to be a bit far apart since the energy transfer is distance-dependent; the following sensitization process is not more competitive, and then the CT (O2→Eu3+) transitions dominate the excitation of the Eu(I) centers. It is reasonable that more Eu(I) approached the Ti4+ ions upon increasing the Eu3+ concentration, and a much greater luminescence contribution from the process of the sensitization of CT (O2→Ti4+) was then observed. At present, the underlying mechanism responsible for the dopant distribution, however, remains unclear.
The regular tetragonal structure cannot explain the presence of more than one site. The following question is why there exists two types of Eu3+ in the predominant t-ZrO2 NCs. In the crystalline lattice of t-ZrO2, the Zr4+ ion is situated in octo-coordinated sites (ZrO8) of a D2d symmetry [15,47] where the Eu3+ could find itself, and for this symmetry, the 7F1 and 7F2 multiplets are split in two and four levels [15], respectively, and then two peaks in the 590–600 nm region assigned to the 5D07F1 transition and four peaks in the 600–630 nm region assigned to the 5D07F2 transition should be observed commonly. The luminescence spectra of Eu(I) and Eu(II) observed (see Table S1), however, are not fully compatible with an emitting Eu3+ ion in the D2d symmetry. It seems, therefore, that in the t-ZrO2 NCs, the incorporation of the Eu3+ on a Zr4+ site distorts the surroundings of the cations. This fact could be readily understandable by considering the effect of O2− vacancies near the Eu3+ ion, which might be produced during the nucleation of NCs as mentioned in the Introduction section, and is yielded by the need for charge compensation. Obviously, one isolated oxygen vacancy would significantly affect its nearest and next nearest neighbors directly by their relative positions acting on cationic sites and would create four sevenfold coordination (CN7) sites in its first cationic coordination shell and 28 cationic sites of an eightfold coordination (CN8) in the second cationic shell. In addition, the O2− vacancies would further modify the cationic site symmetry indirectly by means of ion relaxation [47]. The removal of one O2− ion would cause the displacement of the nearest-neighbor oxygens and the secondary relaxation of oxygens in the different directions. These displacements of atoms from their position in the “ideal” position, in turn, change the symmetry of cationic sites. Moreover, the longer-range interactions such as vacancy–vacancy, cation–vacancy, or cation–cation may also occur [47]. Finally, the common nature of nanocrystals including a larger surface stress and disorder also favors the formation of at least two types of Eu3+ in t-ZrO2 NCs. Herein, we cannot find a more precise description of the lattice distortions with our experimental data and simply suggest that the high site symmetry of Eu(I) ions are of an eightfold coordination, while the low site symmetry of Eu(I) ions are of a sevenfold coordination, like in the m-ZrO2 (Figure S8). The predominated PL from Eu(II) shown in the lower doping level of the samples suggests a preferential occupancy of vacancy first-neighbor sites (CN7) by Eu3+ in these samples. The oxygen vacancy played an important role in the growth and stabilization of tetragonal ZrO2 NCs [48,49]; for the p-ZrO2 and t-ZrO2:Eu3+ NCs with a low content of Eu3+, the oxygen vacancies could be considered as the“pristine” nucleated ones (referred to as pristine vacancy), while for the highly doped samples, most of the vacancies are produced by the need for a charge compensation (referred to as compensated vacancy). On the basis of the above observation, we come to the reasoning that the two types of oxygen vacancies differ in the association with the dopants of Eu3+; the pristine vacancy prefers to be located in the close vicinity of Eu3+, while the compensated vacancy and Eu3+ ions tend to be far apart. The latter was demonstrated previously by EXAFS [50]: it was found that vacancies introduced by oversized dopants of lanthanides (Y and Gd) are located as the nearest neighbors to Zr atoms, leaving an eightfold oxygen coordination to dopant cations. The above discussion is consistent with the XPS analysis of the Eu3+ spectrum. It is known that positively charged oxygen vacancies are able to strongly localize/trap one or two extra electrons near the vacant site, producing a singly charged or neutral vacancy. Upon simply considering the additional influence of localized electrons on the core levels of the neighboring Eu3+ (CN7), it was suggested that the lower binding energy component (1133.0 eV) of the 3d5/2 peak of Eu3+ corresponds to Eu3+ (CN7), while the higher binding energy component (1136.0 eV) corresponds to Eu3+ (CN8).

3.5. Photoluminescence of t-ZrO2:Ti4+, Eu3+ NCs

Besides the naturally present Ti impurities (1.7 mol%), extra Ti4+ ions were deliberately introduced into the t-ZrO2 NCs for PL characterization. It was found that such an additional doping did not induce any pronounced changes in the spectral energy distribution of the emission upon excitation into the UV broadband at a fixed wavelength (not shown), except for the luminescence intensity. Figure 9a,b display the PL excitation spectra of t-ZrO2:xTi4+, 1%Eu3+NCs (where x indicates the molar percentage of extra titanium) upon monitoring the Eu(I) (λem = 607 nm) and Eu(II) (λem = 614 nm) emissions. In both cases, the spectral profile closely follows that of the t-ZrO2:1%Eu3+ NCs except the slight red shift in the longer-wave side of the UV broadband (see Figure S9). In particular, for Eu(I), the PL was found to be enhanced first with increasing Ti concentration and reached the maximum at x = 0.5% under the peak excitation of the UV broadband, followed by a successive decrease; relative to the CT (O2→Eu3+) sub-band, an increased excitation contribution from the titanate groups (CT (O2→Ti4+) sub-band) could be distinguished clearly upon adding more Ti4+ ions (see Figure S9a). This indicates that more Ti4+ occupied the sites near Eu(I), allowing for an enhanced energy transfer to Eu(I) ions and suppressed CT (O2→Eu(I)3+) excitation. For Eu(II), a progressive decrease in PL was observed for the peak excitation of the UV broadband. In both cases, the decrease in the excitation of the titanate groups (CT (O2→Ti4+) sub-band) was caused by the concentration quenching of Ti4+. Ti4+ was demonstrated to have a lower luminescence quenching concentration in bulk m-ZrO2 (0.2%) [9]. In t-ZrO2 NCs, the Ti4+ ions may aggregate to clusters at a higher concentration, which play the role of killer sites. In addition, in clusters, the interaction between the Ti ions would be enhanced greatly, and a degree of delocalization of the excited 3d1 electron would then occur, which would, consequently, shift the absorption of the titanate groups to the red. The fluorescence dynamics studies (see Figure S10) indicate that the extra doping of Ti4+ ions did not have any substantial effects on the decays of both Eu(I) and Eu(II).

3.6. Temperature Dependence of PL and Optical Thermometry

As demonstrated in the preceding section, at low temperatures, energy transfer-derived dual emissions were observed in t-ZrO2:Eu3+ NCs upon excitation into the naturally occurring titanate groups: the white broadband CT (Ti3+→O) emissions and red sharp Eu(II) emissions. The former was temperature-sensitive and was almost quenched nonradiatively at room temperature, while the latter was somewhat stable against temperature; the efficient sensitization and the following intense characteristic emission of Eu3+ centers were observed even at room temperature. This fact showed that Eu(II) ions were much more effective to nonradiatively trap the excitation energy than the other radiationless processes occurring at the titanate groups after optical absorption. This agrees well with the preceding illustration of the specific association of Eu(II) with Ti4+ ions in the crystalline lattice of NCs.
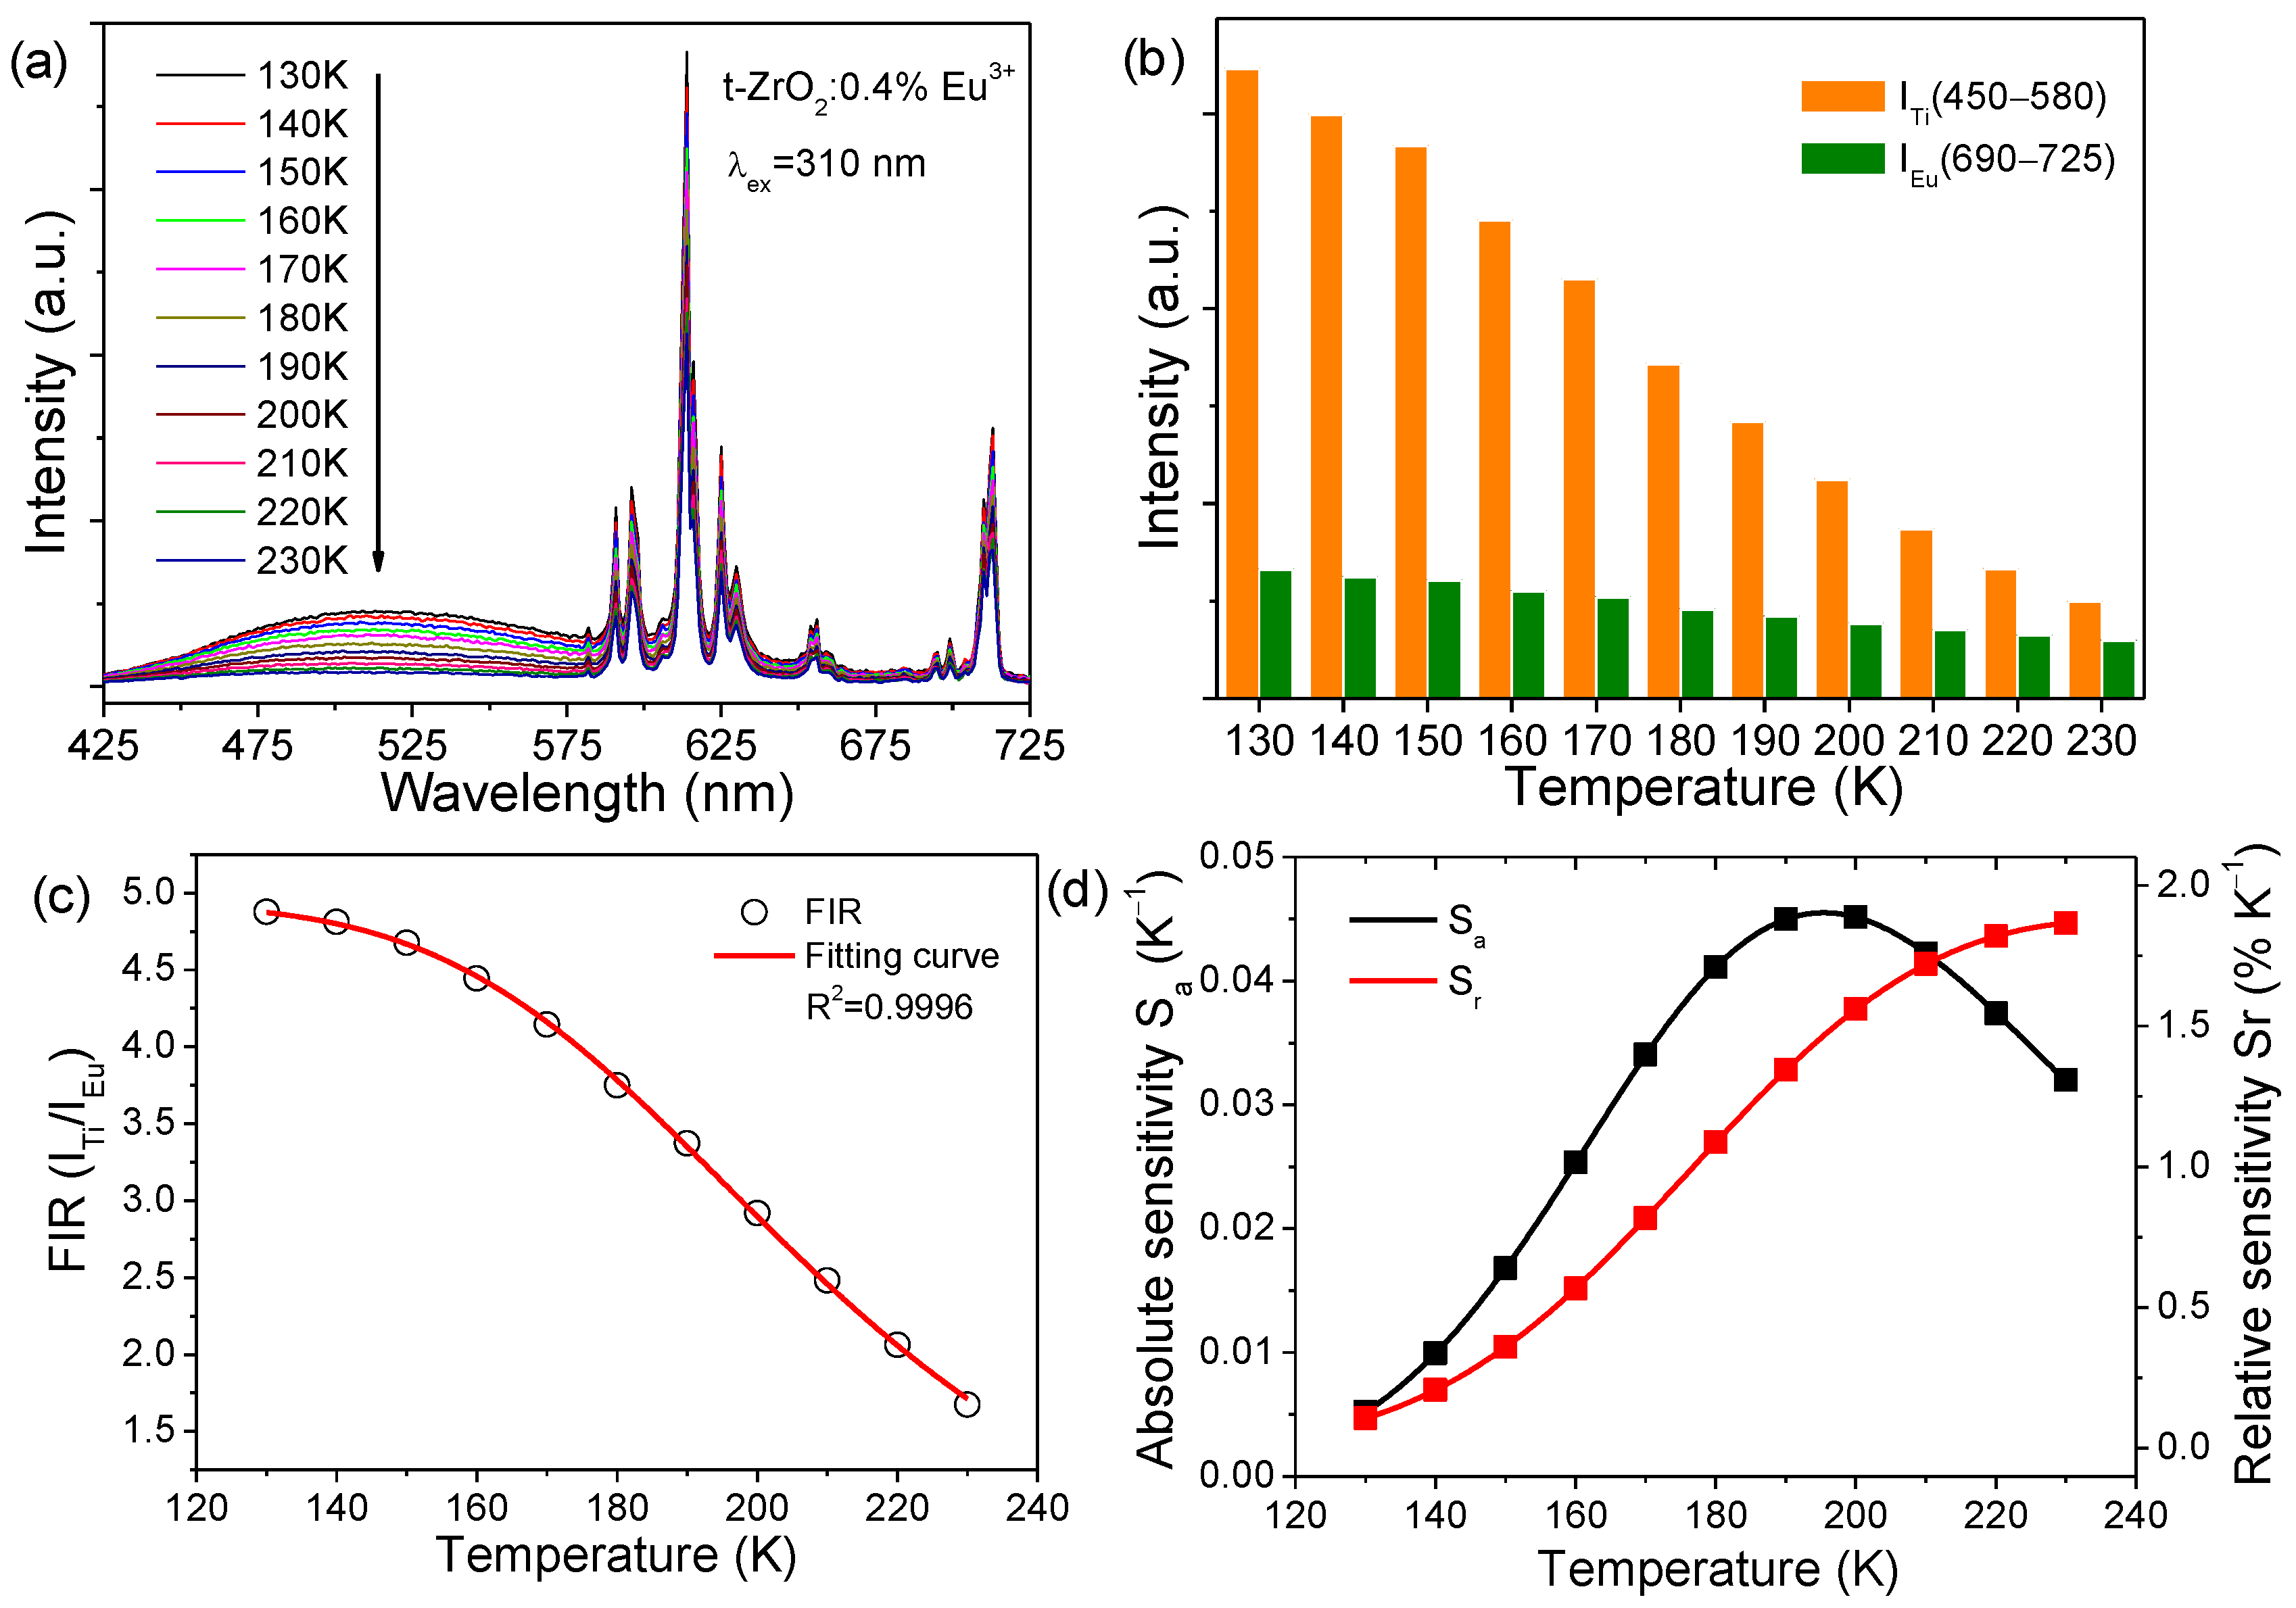
The different temperature sensitivities of PL enables t-ZrO2:Eu3+ nanophosphors to have promising potential for ratiometric self-referencing optical thermometry upon single-wavelength excitation, with titanate luminescence as temperature signals and Eu3+ luminescence as an internal reference. The temperature dependence (130–230 K) of the luminescence of typical t-ZrO2:0.4%Eu3+ NCs was examined upon 310 nm excitation for temperature sensing, as shown in Figure 10a. Note that the peak intensity of the broadband luminescence of titanate groups was much weaker than that of Eu3+ emissions at each temperature, which was caused by the efficient energy transfer from the titanate groups to Eu3+ and the higher content of the naturally occurring Ti4+ ions in the NCs. It was anticipated that such peak intensity would be greatly enhanced if the concentration quenching was suppressed by decreasing the corresponding Ti4+ content via the use of a high-purity reagent of a Zr source and the stoichiometric addition of a Ti source, which would be favorable for the temperature sensing. The luminescence in a spectral region of 450–580 nm was extracted as signals for the titanate groups (ITi), while the luminescence in the range of 690–725 nm was detected for Eu3+ (IEu). The temperature-dependent integrated intensity in such spectral regions is calculated according to the following:
I T i = 580 450 I λ , T d λ
I E u = 725 690 I λ , T d λ
where λ is the wavelength, and T is the corresponding temperature. Figure 10b shows a histogram of the above calculated integrated intensity. Clearly, the signals from the titanate groups weakened quickly with increasing temperature, whereas those from Eu3+ decreased much more slowly. The FIR (ITi/IEu) was found to closely follow the Arrhenius-type Mott equation [37]:
F I R = I T i I E u = 580 450 I λ , T d λ 725 690 I λ , T d λ = I 0 1 + A × exp E 0 k T
where I0 is the initial intensity, A is a constant, E0 is the activation energy for thermal quenching, and k is the Boltzmann constant. As shown in Figure 10c, the calculated FIR (ITi/IEu) values could be well approximated by the fitting using Equation (3), which could be specifically written as F I R = 4.93 1 + 1339.67 × e 1510.54 T . The absolute sensitivity (Sa) and relative sensitivity (Sr) of optical thermometric materials can be expressed as below [9,37]:
S a = d F I R d T = 9981996.35 1 + 1339.67 × e 1510.54 T 2 × e 1510.54 T T 2
S r = 100 % × 1 F I R d F I R d T = 100 % × 2023625.12 1 + 1339.67 × e 1510.54 T × e 1510.54 T T 2
The Sa and Sr parameters were determined using Equations (4) and (5) and are plotted in Figure 10d. The maximal Sa and Sr of the sensing materials of t-ZrO2:0.4%Eu3+ NCs were ~0.045 K−1 (at 190 K) and ~1.9% K−1 (at 230 K), respectively.
The temperature uncertainty (or resolution) δT of the present thermometer can be calculated by the following Equation (6) [9,37]:
δ T = 1 S r δ F I R F I R
As shown in Figure S11, the present optical thermometric material of t-ZrO2:0.4%Eu3+ NCs has a high resolution within ~0.2 K in the temperature range of 160–230 K, indicating a high precision towards temperature sensing. The repeatability and reversibility of this thermometry was checked through seven cycling experiments. Figure S12 shows the plot of FIR at specific temperatures. It is found that the data only show a small deviation from the corresponding average values (dashed lines) for the schemes, indicating a high durability and reproducibility for optical thermometry.

4. Conclusions

Summarizing, pristine and intentionally doped zirconium oxide (ZrO2) nanocrystals (NCs) with Eu3+ or Ti/Eu3+ ions were prepared by the solvothermal method, and their composition, structure, morphology, and optical properties were characterized by various techniques with extensive discussions. The as-obtained ZrO2 NCs were mostly round-shaped with a size of ~5 nm and high dispersivity; doping with Eu3+ or extra Ti4+ did not show significant effects on the resulting size and morphology. The crystalline structure was dominated by a tetragonal polymorph, and trace amounts of m-ZrO2 NCs were detected in the p-ZrO2 and low concentrations of the Eu3+-doped samples. High-purity t-ZrO2 NCs could be synthesized at Eu3+ contents ≥ 2 mol %. The as-obtained ZrO2 NCs were found to contain some naturally present Ti4+ ions originating from precursors and some carbon impurities produced during synthesis. The potential Ti4+ impurities were often neglected during the spectroscopic analysis, yielding much puzzle or debate on the luminescence origin or assignments in previous publications. It was found that the Ti and carbon impurities showed distinct photoluminescence (PL) properties. The Ti4+ ions exhibited bright white emission only at low temperatures via a charge transfer transition, larger Stokes shift, and longer fluorescence lifetime in the millisecond scale, and they could further transfer the excitation energy efficiently to Eu3+ after co-doping; meanwhile, the carbon species could luminesce at room temperature, with excitation wavelength-dependent PL emissions and a shorter fluorescence lifetime in the order of magnitude of nanoseconds.
Following the phase purity-dependent photoluminescence, at least two types of Eu3+ were identified to build into t-ZrO2 NCs together rather than in two segregated crystalline phases: one with a high site symmetry (CN8), and another with a lower site symmetry (CN7). Distinct spectroscopic properties in PL excitation, emission, and fluorescence dynamics were observed for the two types of Eu3+ centers. It was further found that the Ti4+ impurities were distributed somewhat non-randomly over the sites normally occupied by Zr in the nanocrystalline matrix but were preferentially located near the Eu3+ centers of a low site symmetry; the indirect sensitization luminescence of Eu3+ by the titanate groups was then more effective than that of the direct excitation of Eu3+ centers by CT (O2→Eu3+). An inverse case was observed for the high site symmetry of Eu3+. The mechanism driving such dopant distribution characteristics remains an open question.
The different temperature sensitivities of the PL of the titanate groups and the Eu3+ centers enable t-ZrO2:Eu3+nanophosphors to be used for ratiometric self-referencing optical thermometry on the basis of a dual-emitting combination strategy. As a proof of concept, NCs of t-ZrO2:0.4%Eu3+ were demonstrated to be FIR-type optical temperature-sensing materials with a working range of 130–230 K and a maximum relative sensitivity of ~1.9%K−1. The FIR(ITi/IEu) was extracted by using luminescence in a selective spectral region of 450–580 nm for naturally present titanate groups (ITi) and that in a spectral region of 690–725 nm for Eu3+ (IEu).

Supplementary Materials

The following are available online at https://www.mdpi.com/article/10.3390/chemosensors12040062/s1, Table S1: The assignment of the observed emission lines for Eu3+ in the t-ZrO2 NCs and fluorescence decay constants; Figure S1: TEM image of t-ZrO2:4%Ti4+, 1%Eu3+ NCs; Figure S2: Powder XRD patterns and Raman spectra of p-ZrO2 NCs before and after annealing at 400 °C; Figure S3: XPS spectra of t-ZrO2:4%Ti4+, 1%Eu3+ NCs. Figure S4: The enlarged diffuse reflection–UV–visible spectra of the as-synthesized p-ZrO2 and t-ZrO2:4%Ti4+, 1%Eu3+ NCs in the F(R) range of 0.0–0.04; Figure S5: PL excitation spectra of t-ZrO2:1%Eu3+ NCs by monitoring the relative maxima of Eu(I) and Eu(II) and their spectral decomposition of the corresponding broadband with Gauss-type peaks; Figure S6: Normalized PL excitation spectra of t-ZrO2:xEu3+ NCs; Figure S7: (a) The PL emissions of CT (Ti3+→O) transitions in t-ZrO2:0.4%Eu3+ NCs upon excitation into titanate groups at 13 K, together with the spectral superimposition of stronger sharp line emissions of Eu3+; (b) Normalized PL excitation spectra of p-ZrO2 and t-ZrO2:0.4%Eu3+ NCs upon monitoring the peak of the broadband emissions at 530 nm; Figure S8: The scheme of oxygen coordination spheres of Eu(I)and Eu (II) in t-ZrO2 NCs; Figure S9: Normalized PL excitation spectra of t-ZrO2:xTi4+, 1%Eu3+ NCs by monitoring the relative maxima of Eu(I) and Eu(II); Figure S10: Fluorescence decay traces of t-ZrO2:xTi4+, 1%Eu3+ NCs by monitoring the relative maxima of Eu(I) and Eu(II); Figure S11: Temperature resolution δT of t-ZrO2:0.4%Eu3+ NCs temperature-sensing material in the temperature range of 130 to 230 K; Figure S12: Temperature-induced switching of the FIR between the titanate groups signals (ITi) (450–580 nm) and Eu3+singals (690–725 nm) (IEu).

Author Contributions

Conceptualization, X.Q. and G.-H.P.; validation, L.L.; formal analysis, G.-H.P. and J.H.J.; investigation, L.L., X.Q., G.-H.P. and J.H.J.; resources, X.Q., G.-H.P. and J.H.J.; data curation, L.L., X.Q. and G.-H.P.; writing—original draft preparation, L.L. and G.-H.P.; writing—review and editing, X.Q., G.-H.P. and J.H.J.; visualization, L.L., G.-H.P. and J.H.J.; supervision, X.Q. and G.-H.P.; project administration, X.Q. and G.-H.P.; funding acquisition, X.Q., G.-H.P. and J.H.J. All authors have read and agreed to the published version of the manuscript.

Funding

This research was funded by National Natural Science Foundation of China (Grant No. 12074374, 51402284 and 51202019), Natural Science Foundation of Jilin Province (Grant No. 20230101123JC and SKL202302024), and the Graduate Innovation Project of Changchun Normal University (Grant No. 086).

Institutional Review Board Statement

Not applicable.

Informed Consent Statement

Not applicable.

Data Availability Statement

Data is contained within the article or Supplementary Materials.

Conflicts of Interest

The authors declare no conflicts of interest.

References

  1. Gai, S.; Li, C.; Yang, P.; Lin, J. Recent progress in rare earth micro/nanocrystals: Soft chemical synthesis, luminescent properties, and biomedical applications. Chem. Rev. 2014, 114, 2343–2389. [Google Scholar] [CrossRef] [PubMed]
  2. Marin, R.; Jaque, D. Doping Lanthanide ions in colloidal semiconductor nanocrystals for brighter photoluminescence. Chem. Rev. 2021, 121, 1425–1462. [Google Scholar] [CrossRef] [PubMed]
  3. Ji, Y.; Xu, W.; Rasskazov, I.L.; Liu, H.; Hu, J.; Liu, M.; Zhou, D.; Bai, X.; Ågren, H.; Song, H. Perovskite photonic crystal photoelectric devices. Appl. Phys. Rev. 2022, 9, 041319. [Google Scholar] [CrossRef]
  4. An, R.; Liang, Y.; Deng, R.; Lei, P.; Zhang, H. Hollow nanoparticles synthesized via Ostwald ripening and their upconversion luminescence-mediated Boltzmann thermometry over a wide temperature range. Light Sci. Appl. 2022, 11, 217. [Google Scholar] [CrossRef] [PubMed]
  5. Jaque, D.; Vetrone, F. Luminescence nanothermometry. Nanoscale 2012, 4, 4301–4326. [Google Scholar] [CrossRef] [PubMed]
  6. Boles, M.A.; Ling, D.; Hyeon, T.; Talapin, D.V. The surface science of nanocrystals. Nat. Mater. 2016, 15, 141–153. [Google Scholar] [CrossRef] [PubMed]
  7. Diaz, A.L. Progress in understanding host-sensitized excitation processes in luminescent materials. ECS J. Solid State Sci. Technol. 2019, 8, R14–R26. [Google Scholar] [CrossRef]
  8. Fiaczyk, K.; Wojtowicz, A.J.; Zych, E. Photoluminescent Properties of monoclinic HfO2:Ti sintered seramics in 16–300 K. J. Phys. Chem. C 2015, 119, 5026–5032. [Google Scholar] [CrossRef]
  9. Pan, G.-H.; Zhang, L.; Wu, H.; Qu, X.; Wu, H.; Hao, Z.; Zhang, L.; Zhang, X.; Zhang, J. On the luminescence of Ti4+ and Eu3+ in monoclinic ZrO2: High performance optical thermometry derived from energy transfer. J. Mater. Chem. C 2020, 8, 4518–4533. [Google Scholar] [CrossRef]
  10. French, R.H.; Glass, S.J.; Ohuchi, F.S.; Xu, Y.-N.; Ching, W.Y. Experimental and theoretical determination of the optical properties and electronic structure of three phases of ZrO2. Phys. Rev. B 1994, 49, 5133–5142. [Google Scholar] [CrossRef]
  11. Kirm, M.; Aarik, J.; Jürgens, M.; Sildos, I. Thin films of HfO2 and ZrO2 as potential scintillators. Nucl. Instrum. Meth. A 2005, 537, 251–255. [Google Scholar] [CrossRef]
  12. Aarik, J.; Mändar, H.; Kirm, M. Spectroscopic characterization of ZrO2 thin films grown by atomic layer deposition. Proc. Estonian Acad. Sci. Phys. Math. 2003, 52, 289–298. [Google Scholar] [CrossRef]
  13. Lafargue-Dit-Hauret, W.; Schira, R.; Latouche, C.; Jobic, S. Theoretical calculations Meet experiment to explain the luminescence properties and the presence of defects in m-ZrO2. Chem. Mater. 2021, 33, 2984–2992. [Google Scholar] [CrossRef]
  14. Chen, L.; Liu, Y.; Li, Y. Preparation and characterization of ZrO2:Eu3+ phosphors. J. Alloys Compd. 2004, 381, 266–271. [Google Scholar] [CrossRef]
  15. Speghini, A.; Bettinelli, M.; Riello, P.; Bucella, S.; Benedetti, A. Preparation, structural characterization, and luminescence properties of Eu3+-doped nanocrystalline ZrO2. J. Mater. Res. 2005, 20, 2780–2791. [Google Scholar] [CrossRef]
  16. Liu, Y.; Zhou, S.; Tu, D.; Chen, Z.; Huang, M.; Zhu, H.; Ma, E.; Chen, X. Amine-functionalized lanthanide-doped zirconia nanoparticles: Optical spectroscopy, time-resolved fluorescence resonance energy transfer biodetection, and targeted imaging. J. Am. Chem. Soc. 2012, 134, 15083–15090. [Google Scholar] [CrossRef] [PubMed]
  17. Furasova, A.D.; Ivanovski, V.; Yakovlev, A.V.; Milichko, V.A.; Vinogradov, V.V.; Vinogradov, A.V. Inkjet fabrication of highly efficient luminescent Eu-doped ZrO2 nanostructures. Nanoscale 2017, 9, 13069–13078. [Google Scholar] [CrossRef]
  18. De la Rosa-Cruz, E.; Diaz-Torres, L.A.; Salas, P.; Rodríguez, R.A.; Kumar, G.A.; Meneses, M.A.; Mosiño, J.F.; Hernández, J.M.; Barbosa-García, O. Luminescent properties and energy transfer in ZrO2:Sm3+ nanocrystals. J. Appl. Phys. 2003, 94, 3509–3515. [Google Scholar] [CrossRef]
  19. Gupta, S.K.; Chandrasekhar, D.; Kadam, R.M. Tetragonal ZrO2:Nd3+nanosphere: Combustion synthesis, luminescence and photoacoustic spectroscopy. J. Mol. Struct. 2015, 1102, 141–145. [Google Scholar] [CrossRef]
  20. Trexler, M.M.; Zhang, D.; Kelly, L.; Sample, J. Crystal structure and optical properties of erbium- and neodymium-doped zirconia nanoparticles. J. Mater. Res. 2010, 25, 500–509. [Google Scholar] [CrossRef]
  21. Opalinska, A.; Hreniak, D.; Lojkowski, W.; Strek, W.; Presz, A.; Grzanka, E. Structure, morphology and luminescence properties of Pr-doped nanocrystalline ZrO2 obtained by hydrothermal method. Solid State Phenom. 2003, 94, 141–144. [Google Scholar] [CrossRef]
  22. Lovisa, L.X.; Araújo, V.D.; Tranquilin, R.L.; Longo, E.; Li, M.S.; Paskocimas, C.A.; Bomio, M.R.D.; Motta, F.V. White photoluminescence emission from ZrO2 co-doped with Eu3+, Tb3+ and Tm3+. J. Alloys Compd. 2016, 674, 245–251. [Google Scholar] [CrossRef]
  23. Das, S.; Yang, C.-Y.; Lu, C.-H. Structural and optical properties of tunable warm-white light-emitting ZrO2: Dy3+-Eu3+ nanocrystals. J. Am. Ceram. Soc. 2013, 96, 1602–1609. [Google Scholar] [CrossRef]
  24. Smits, K.; Olsteins, D.; Zolotarjovs, A.; Laganovska, K.; Millers, D.; Ignatans, R.; Grabis, J. Doped zirconia phase and luminescence dependence on the nature of charge compensation. Sci. Rep. 2017, 7, 44453. [Google Scholar] [CrossRef] [PubMed]
  25. Zhang, H.; Fu, X.; Niu, S.; Xin, Q. Blue emission of ZrO2:Tm nanocrystals with different crystal structure under UV excitation. J. Non-Cryst. Solids 2008, 354, 1559–1563. [Google Scholar] [CrossRef]
  26. Patra, A.; Ghosh, P.; Chowdhury, P.S.; Alencar, M.A.R.C.; Lozano, B.W.; Rakov, N.; Maciel, G.S. Red to blue tunable upconversion in Tm3+-noped ZrO2 nanocrystals. J. Phys. Chem. B 2005, 109, 10142–10146. [Google Scholar] [CrossRef] [PubMed]
  27. Cong, Y.; Li, B.; Yue, S.; Fan, D.; Wang, X.-J. Effect of oxygen vacancy on phase transition and photoluminescence properties of nanocrystalline zirconia synthesized by the one-pot reaction. J. Phys. Chem. C 2009, 113, 13974–13978. [Google Scholar] [CrossRef]
  28. García-Hipólito, M.; Falcony, C.; Aguilar-Frutis, M.A.; Azorín- Nieto, J. Synthesis and characterization of luminescent ZrO2:Mn, Cl powders. Appl. Phys. Lett. 2001, 79, 4369. [Google Scholar] [CrossRef]
  29. Wang, S.F.; Gu, F.; Lü, M.K.; Zou, W.G.; Liu, S.W.; Zhou, G.J.; Xu, D.; Yuan, D.R. Optical properties of Ni2+ in ZrO2 nanocrystals. Opt. Mater. 2004, 27, 269–272. [Google Scholar] [CrossRef]
  30. Li, P.; Chen, I.-W.; Penner-Hahn, J.E. Effect of dopants on zirconia stabilization—An X-ray absorption study: II, tetravalent dopants. J. Am. Ceram. Soc. 1994, 77, 1281–1288. [Google Scholar] [CrossRef]
  31. Robinson, R.D.; Tang, J.; Steigerwald, M.L.; Brus, L.E.; Herman, I.P. Raman scattering in HfxZr1−xO2 nanoparticles. Phys. Rev. B 2005, 71, 115408. [Google Scholar] [CrossRef]
  32. Sato, K.; Abe, H.; Ohara, S. Selective growth of monoclinic and tetragonal zirconia nanocrystals. J. Am. Chem. Soc. 2010, 132, 2538–2539. [Google Scholar] [CrossRef]
  33. Liu, C.; Hajagos, T.J.; Chen, D.; Chen, Y.; Kishpaugh, D.; Pei, Q. Efficient One-pot synthesis of colloidal zirconium oxide nanoparticles for high-refractive-index nanocomposites. ACS Appl. Mater. Interfaces 2016, 8, 4795–4802. [Google Scholar] [CrossRef] [PubMed]
  34. Mondal, A.; Ram, S. Enhanced phase stability and photoluminescence of Eu3+ modified t-ZrO2 nanoparticles. J. Am. Ceram. Soc. 2008, 91, 329–332. [Google Scholar] [CrossRef]
  35. Marciniak, L.; Kniec, K.; Elżbieciak-Piecka, K.; Trejgis, K.; Stefanska, J.; Dramićanin, M. Luminescence thermometry with transition metal ions. A review. Coordin. Chem. Rev. 2022, 469, 214671–214702. [Google Scholar] [CrossRef]
  36. Gao, D.; Chen, B.; Sha, X.; Zhang, Y.; Chen, X.; Wang, L.; Zhang, X.; Zhang, J.; Cao, Y.; Wang, Y.; et al. Near infrared emissions from both high efficient quantum cutting (173%) and nearly-pure-color upconversion in NaY(WO4)2:Er3+/Yb3+ with thermal management capability for silicon-based solar cells. Light Sci. Appl. 2024, 13, 17. [Google Scholar] [CrossRef]
  37. Gu, A.; Pan, G.-H.; Wu, H.; Zhang, L.; Zhang, L.; Wu, H.; Zhang, J. Microstructure and photoluminescence of ZrTiO4:Eu3+ phosphors: Host-sensitized energy transfer and optical thermometry. Chemosensors 2022, 10, 527. [Google Scholar] [CrossRef]
  38. Zhou, J.; Lei, R.; Wang, H.; Hua, Y.; Li, D.; Yang, Q.; Deng, D.; Xu, S. A new generation of dual-mode optical thermometry based on ZrO2:Eu3+ nanocrystals. Nanophotonics 2019, 8, 2347–2358. [Google Scholar] [CrossRef]
  39. Livraghi, S.; Olivero, F.; Paganini, M.C.; Giamello, E. Titanium ions dispersed into the ZrO2 matrix spectroscopic properties and photoinduced electron transfer. J. Phys. Chem. C 2010, 114, 18553–18558. [Google Scholar] [CrossRef]
  40. Pan, G.-H.; Hayakawa, T.; Nogami, M.; Hao, Z.; Zhang, X.; Qu, X.; Zhang, J. Zinc titanium glycolate acetate hydrate and its transformation to zinc titanate microrods: Synthesis, characterization and photocatalytic properties. RSC Adv. 2015, 5, 88590–88601. [Google Scholar] [CrossRef]
  41. Jeziorowski, H.; Knozinger, H. Raman and ultraviolet spectroscopic characterization of molybdena on alumina catalysts. J. Phys. Chem. 1979, 83, 1166–1173. [Google Scholar] [CrossRef]
  42. Krysmann, M.J.; Kelarakis, A.; Dallas, P.; Giannelis, E.P. Formation mechanism of carbogenic nanoparticles with dual photoluminescence emission. J. Am. Chem. Soc. 2012, 134, 747–750. [Google Scholar] [CrossRef]
  43. Zhang, C.; Lin, J. Defect-related luminescent materials: Synthesis, emission properties and applications. Chem. Soc. Rev. 2012, 41, 7938–7961. [Google Scholar] [CrossRef] [PubMed]
  44. Kim, B.-K.; Hahn, J.-W.; Han, K.R. Quantitative phase analysis in tetragonal-rich tetragonal/monoclinic two phase zirconia by Raman spectroscopy. J. Mater. Sci. Lett. 1997, 16, 669–671. [Google Scholar] [CrossRef]
  45. Vlaic, G.; Fornasiero, P.; Geremia, S.; Kaspar, J.; Graziani, M. Relationship between the zirconia-promoted reduction in the Rh-loaded Ce0.5Zr0.5O2 mixed oxide and the Zr–O local structure. J. Catal. 1997, 168, 386–392. [Google Scholar] [CrossRef]
  46. Montini, T.; Speghini, A.; De Rogatis, L.; Lorenzut, B.; Bettinelli, M.; Graziani, M.; Fornasiero, P. Identification of the structural phases of CexZr1−xO2 by Eu(III) luminescence studies. J. Am. Chem. Soc. 2009, 131, 13155–13160. [Google Scholar] [CrossRef]
  47. Dexpert-Ghys, J.; Faucher, M.; Caro, P. Site selective spectroscopy and structural analysis of yttria-doped zirconias. J. Solid State Chem. 1984, 54, 179–192. [Google Scholar] [CrossRef]
  48. Tani, E.; Yoshimura, M.; Somiya, S. Formation of ultrafine tetragonal ZrO2 powder under hydrothermal conditions. J. Am. Ceram. Soc. 1983, 66, 11–14. [Google Scholar] [CrossRef]
  49. Srinivasan, R.; Rice, L.; Davis, B.H. Critical particle size and phase transformation in zirconia transmission: Electron microscopy and X-ray diffraction studies. J. Am. Ceram. Soc. 1990, 73, 3528–3530. [Google Scholar] [CrossRef]
  50. Li, P.; Chen, I.-W.; Penner-Hahn, J.E. Effect of dopants on zirconia stabilization—An X-ray absorption study I, Trivalent dopants. J. Am. Ceram. Soc. 1994, 77, 118–128. [Google Scholar] [CrossRef]
Figure 1. Powder XRD patterns of p-ZrO2 and t-ZrO2:xEu3+ (x = 0.4%, 1%, 2%, and 4%) (a), as well as t-ZrO2:xTi4+, 1%Eu3+ (x =0, 0.5%, 1%, 2% and 4%) NCs (b), along with the reference PDF patterns of m-ZrO2 (PDF#86-1451) and t-ZrO2 (PDF#88-1007).
Chemosensors 12 00062 g001
Figure 2. (a) TEM image, (b) histogram of the size distribution, (c,d) high-resolution TEM images, and (e) SAED of the as-synthesized p-ZrO2 NCs.
Chemosensors 12 00062 g002
Figure 3. (a) Raman spectra of the as-synthesized NCs (p−ZrO2 and p-ZrO2:xEu3+ (x = 0.4%, 1%, and 4%)); the dashed lines indicate the modes of m-ZrO2; (b) FTIR spectra of p-ZrO2 before and after annealing at 400 °C.
Chemosensors 12 00062 g003
Figure 4. Diffuse reflection–UV–visible spectra of the as-synthesized NCs (p-ZrO2, t-ZrO2:xEu3+ (x = 0.4%, 1%, and 4%)) and t-ZrO2:4%Ti4+, 1%Eu3+.
Chemosensors 12 00062 g004
Figure 5. (a) PL excitation and emission spectra of the as-synthesized p-ZrO2 NCs at room temperature; the inset of Figure 5a is the photograph showing the PL of an ethanolic dispersion of p-ZrO2 NCs under 365 nm UV irradiation; a 370 nm long-wave passed filter was used when recording the excitation spectrum, while no optical filter was used when recording the PL emission spectra. (b) 13 K and room temperature fluorescence decay traces of the p-ZrO2 NCs and the fitting with bi-exponential function (λex = 370 nm, λem = 450 nm); the instrument response function (IRF) of the measured system is included (λex = 370 nm, λem = 370 nm).
Chemosensors 12 00062 g005
Figure 6. (a) PL excitation and emission spectra of the p-ZrO2 NCs at 13 K; (b) fluorescence decay trace of the p-ZrO2 NCs at 13 K and the tail fitting with a bi-exponential function.
Chemosensors 12 00062 g006
Figure 7. (a) PL emission and excitation (b) spectra of the t-ZrO2:1%Eu3+ NCs at room temperature; the inset of Figure 7a is the photograph showing the PL of an ethanolic dispersion of t-ZrO2:1%Eu3+NCs under 254 nm UV irradiation; (c,d) PL excitation spectra of t-ZrO2:xEu3+ (x = 0.4%, 0.6%, 0.8%, 1%, 2%, and 4%) NCs by monitoring the relative maxima of Eu(I) (7c, λem = 607 nm) and Eu(II) (7d, λem = 614 nm).
Chemosensors 12 00062 g007
Figure 8. Fluorescence decay traces of t-ZrO2:xEu3+ (x = 0.4%, 0.6%, 0.8%, 1%, 2%, and 4%) NCs by monitoring the relative maxima of Eu(I) ((a), λex = 270 nm, λem = 607 nm) and Eu(II) ((b), λex = 310 nm, λem = 614 nm).
Chemosensors 12 00062 g008
Figure 9. PL excitation spectra of t-ZrO2:xTi4+, 1%Eu3+ (x = 0, 0.5%, 1%, 2%, and 4%) NCs by monitoring the relative maxima of Eu(I) ((a), λem = 607 nm) and Eu(II) ((b), λem = 614 nm).
Chemosensors 12 00062 g009
Figure 10. (a) Temperature-dependent PL spectra (λex = 310 nm) of the t-ZrO2:0.4%Eu3+ NCs recorded from 130 to 230 K; (b) temperature-dependent integrated spectral intensity for the titanate group signals (ITi) (450–580 nm) and Eu3+signals (IEu) (690–725 nm); (c) temperature dependence of the experimental FIR (ITi/IEu) values and the fitting curves using Equation (3); (d) absolute sensitivity value Sa and relativity sensitivity value Sr at different temperatures.
Chemosensors 12 00062 g010
Disclaimer/Publisher’s Note: The statements, opinions and data contained in all publications are solely those of the individual author(s) and contributor(s) and not of MDPI and/or the editor(s). MDPI and/or the editor(s) disclaim responsibility for any injury to people or property resulting from any ideas, methods, instructions or products referred to in the content.

