Article

Upcycled Graphene Oxide Nanosheets for Reversible Room Temperature NO2 Gas Sensor

1
School of Engineering, RMIT University, Melbourne, VIC 3000, Australia
2
Key Laboratory of Advanced Technologies of Materials, Ministry of Education, School of Materials Science and Engineering, Southwest Jiaotong University, Chengdu 610031, China
*
Authors to whom correspondence should be addressed.
Chemosensors 2024, 12(6), 108; https://doi.org/10.3390/chemosensors12060108
Submission received: 8 May 2024 / Revised: 27 May 2024 / Accepted: 7 June 2024 / Published: 10 June 2024

Abstract

:
Graphene oxide (GO) nanosheets, as one of the most studied graphene derivatives, have demonstrated an intrinsically strong physisorption-based gas–matter behavior, owing to its enhanced volume–surface ratio and abundant surface functional groups. The exploration of efficient and cost-effective synthesis methods for GO is an ongoing task. In this work, we explored a novel approach to upcycle inexpensive polyethylene terephthalate (PET) plastic waste into high-quality GO using a combination of chemical and thermal treatments based on a montmorillonite template. The obtained material had a nanosheet morphology with a lateral dimension of around ~2 µm and a thickness of ~3 nm. In addition, the GO nanosheets were found to be a p-type semiconductor with a bandgap of 2.41 eV and was subsequently realized as a gas sensor. As a result, the GO sensor exhibited a fully reversible sensing response towards ultra-low-concentration NO2 gas with a limit of detection of ~1.43 ppb, without the implementation of an external excitation stimulus including elevating the operating temperature or bias voltages. When given a thorough test, the sensor maintained an impressive long-term stability and repeatability with little performance degradation after 5 days of experiments. The response factor was estimated to be ~11% when exposed to 1026 ppb NO2, which is at least one order of magnitude higher than that of other commonly seen gas species including CH4, H2, and CO2.

1. Introduction

Two-dimensional (2D) materials, composed of single or a few atomic layers, have emerged as promising options for gas sensing applications due to their outstanding sensitivity, superior selectivity, and minimal power consumption [1,2,3,4,5,6]. The interaction between gas molecules and the surface of 2D materials is likely distinct from the traditional chemisorption mechanism, as it appears to adhere more closely to the physisorption model, with no participation from adsorbed oxygen [1,6,7]. Specifically, the direct interaction between gas molecules and the surface of a material instigates the formation of electrical dipoles at the interface between the gas and the material, facilitated by mechanisms of charge transfer [1,3,7,8,9]. The quantity of gas molecules adhering to the surface hinges upon the adsorption energy of the two-dimensional (2D) material, whereas the extent and direction of charge transfer are contingent upon the positions of electronic bands within the 2D material relative to those of the gas molecules [7,8,9]. As a consequence, the emergence of interfacial electrical dipoles prompts a significant reorganization of charge carriers within the ultra-thin 2D material matrix, ultimately resulting in discernible fluctuations in electrical resistance, which serve as the transduction output signal [1,6,7,8,9]. The early exploration of graphene and its derivatives demonstrated the potential of developing such physisorption-based gas sensors that operate at room temperature [2,10,11,12]. However, the high surface adsorption energies of these materials often result in extended periods for desorption or, in certain instances, failure during the recovery phase of targeted gas molecules. This renders the sensors permanently nonfunctional or exhibiting impractically long recovery kinetics [10,13,14,15].
The gas reactivity of low-dimensional carbon materials, such as carbon nanotubes and graphene, is heavily reliant on the density of defects induced by surface functionalization with oxygen groups. These groups play a pivotal role in the electrical response to gas molecules [16,17,18]. Consequently, precise control over the introduction of oxygen functional groups is essential for enhancing the performance of graphene-based sensors, as it amplifies the adsorbate binding energy and promotes charge transfer at reactive sites, since pristine graphene gas sensors often encounter challenges during the recovery process in room temperature experiments without thermal treatment or light excitation [14,19,20,21]. A method for optimizing the oxidation degree as well as the homogeneous distribution of oxygen groups on graphene surfaces remains to be fully established. Nonetheless, the most popular synthesis method for graphene oxide (GO) until now is Hummer’s method, which was developed back in 1958 [22]. In this method, the oxidization of graphite is achieved through the harsh treatment of graphite powder with a concentrated H2SO4 solution containing KMnO4 and NaNO3 [2,23,24,25]. The disadvantages of this method include a complex procedure and the use of relatively expensive carbon sources. The flash graphene method is an emerging synthesis approach for upcycling inexpensive carbon sources, such as coal, carbon black, rubber tires, and mixed plastic wastes, into high-quality graphene and its derivatives with a flash joule heating process in less than one second [26,27,28]. Despite its high efficiency, the flash graphene method involves high-voltage electric discharge with large capacitor banks, which introduces potential safety risks into conversion operations [29,30,31]. Different from the Flash Joule Heating method, solvolysis is carried out through nucleophilic substitutions involving an excess of solvent molecules. Plastic solvolysis has been conducted using various solvent systems, such as methanol, polyols, and ammonia, typically at temperatures around 300 degrees Celsius, with the addition of a catalyst to facilitate depolymerization [32,33,34]. This process yields a complex mixture of products including alcohols, aldehydes, and others, leading to challenges in separation due to their diverse chemical properties and similar boiling points [35,36,37].
In this work, we successfully synthesized graphene oxide nanosheets through a combination of chemical and thermal treatments using a montmorillonite template. Different from the Hummers method, inexpensive PET plastic wastes such as plastic bags and beverage bottles instead of graphite powder are used as the carbon sources in this novel synthesis method. Subsequently, the morphology, crystalline system, chemical composition, semiconductor characteristics, and material band structures of the obtained GO nanosheets were all investigated and extensively discussed in this work. Finally, the material was realized as a gas sensor to further explore its physisorption-based gas–matter interaction. As a result, the GO sensor exhibited an excellent room temperature sensing performance towards ultra-low-concentration NO2 gas in a fully recoverable manner, reaching a limit of detection (LOD) of 1.43 ppb. When given a thorough test, the sensor demonstrated extraordinary long-term stability and selectivity [38].

2. Materials and Methods

2.1. Material Synthesis and Preparation

The synthesis of graphene oxide (GO) followed a multi-step process. Initially, PET plastic was extracted from plastic beverage bottles, and the central, thin portions were obtained by removing the head and tail rigid segments (Figure S1). The subsequent cleaning involved stirring the waste fragments in a 500 mg/L NaOH solution, followed by triple washing with deionized water and vacuum drying at 80 °C for 5 h. The cleaned waste fragments were then combined with 16 g of organically modified montmorillonite (OMMT-N30), and the mixture was subjected to heating at a rate of 15 °C/min to 700 °C (Figure S2). Refluxing with fuming nitric acid at 110 °C for 3 h and then going through another thermal treatment at 400 °C resulted in a product consisting of montmorillonite and graphene oxide, which was confirmed by XRD and Raman analysis (Figure S3).

2.2. Material Characterization

The lateral dimensions and thicknesses of the GO flakes were measured using Bruker Atomic Force Microscopy Dimension Icon (Bruker Corporation, Billerica, MA, USA) equipped with a Multi75E-G tip. The GO crystal structure was characterized using a JEOL 2100F equipped with an EDS detector at an accelerating voltage of 200 kV. XRD was characterized using a Bruker D4 ENDEAVOR (Bruker, Billerica, MA, USA) equipped with a monochromatic Cu Kα radiation source (λ = 0.154 nm). HAADF-STEM images were obtained using a JEM-ARM300F GRAND ARM microscope operating at an acceleration voltage of 300 kV. Raman spectra were acquired using a HORIBA LabRAM HR Evolution spectrometer with an excitation wavelength of 532 nm, while photoluminescence (PL) spectra were recorded using a diode laser with an excitation wavelength of 405 nm. Additionally, X-ray photoelectron spectroscopy (XPS) and its valence data were collected using a Thermo Scientific K-Alpha XPS spectrometer equipped with a monochromatic Al Kα X-ray source (hυ = 1486.7 eV). Additionally, ultraviolet–visible (UV–Vis–NIR) spectroscopy was performed using a Cary 500 spectrometer, and Tauc plots of the samples from the UV–Vis data were calculated to identify the optical bandgap.

2.3. Sensor Fabrication and Measurements

The transducing substrates utilized in this study comprised 200 pairs of gold interdigital electrodes (IDEs) purchased from HORX Sensortech, Melbourne, Australia. Before drop-casting onto the transducing substrate, a solution of graphene oxide (GO) was prepared in 10 mL of ethanol and sonicated for 10 min to ensure the uniform dispersion of the nanoflakes in the ethanol solution. Subsequently, a suspension containing 12 mg/mL of graphene oxide black powder was drop-casted onto the transducing substrate to create the NO2 sensor. This deposition was performed within a 4.2 mm diameter exposed area while maintaining a temperature of 25 °C to keep the electrical conductivities of the samples within the measurable range using a multimeter. Gas sensing measurements were conducted at room temperature in a dark environment. The sensor’s resistance was monitored during the gas sensing experiments using an Agilent 34401A digital multimeter, facilitated by a minimized probe stage built inside a customized gas chamber. Additionally, a computerized multi-channel gas calibration system was used to regulate the incoming gas stream at a constant flow rate of approximately 100 standard cubic centimeters per minute (sccm) into the gas chamber through the inlet. To maintain a gas pressure of 1 standard atmosphere within the chamber, a back pressure regulator (Hy-Lok Oceania, Melbourne, Australia) was connected to the outlet.

2.4. Statistical Analysis

A smoothing technique involving a five-data-point average window was employed on the raw XPS data to create the fitted curve. The limit of detection (LOD) was determined using the formula (3.3 × σ)/S, where σ represents the standard deviation of the signal-to-noise response, and S denotes the slope of the calibration curve for the dynamic response.

3. Results

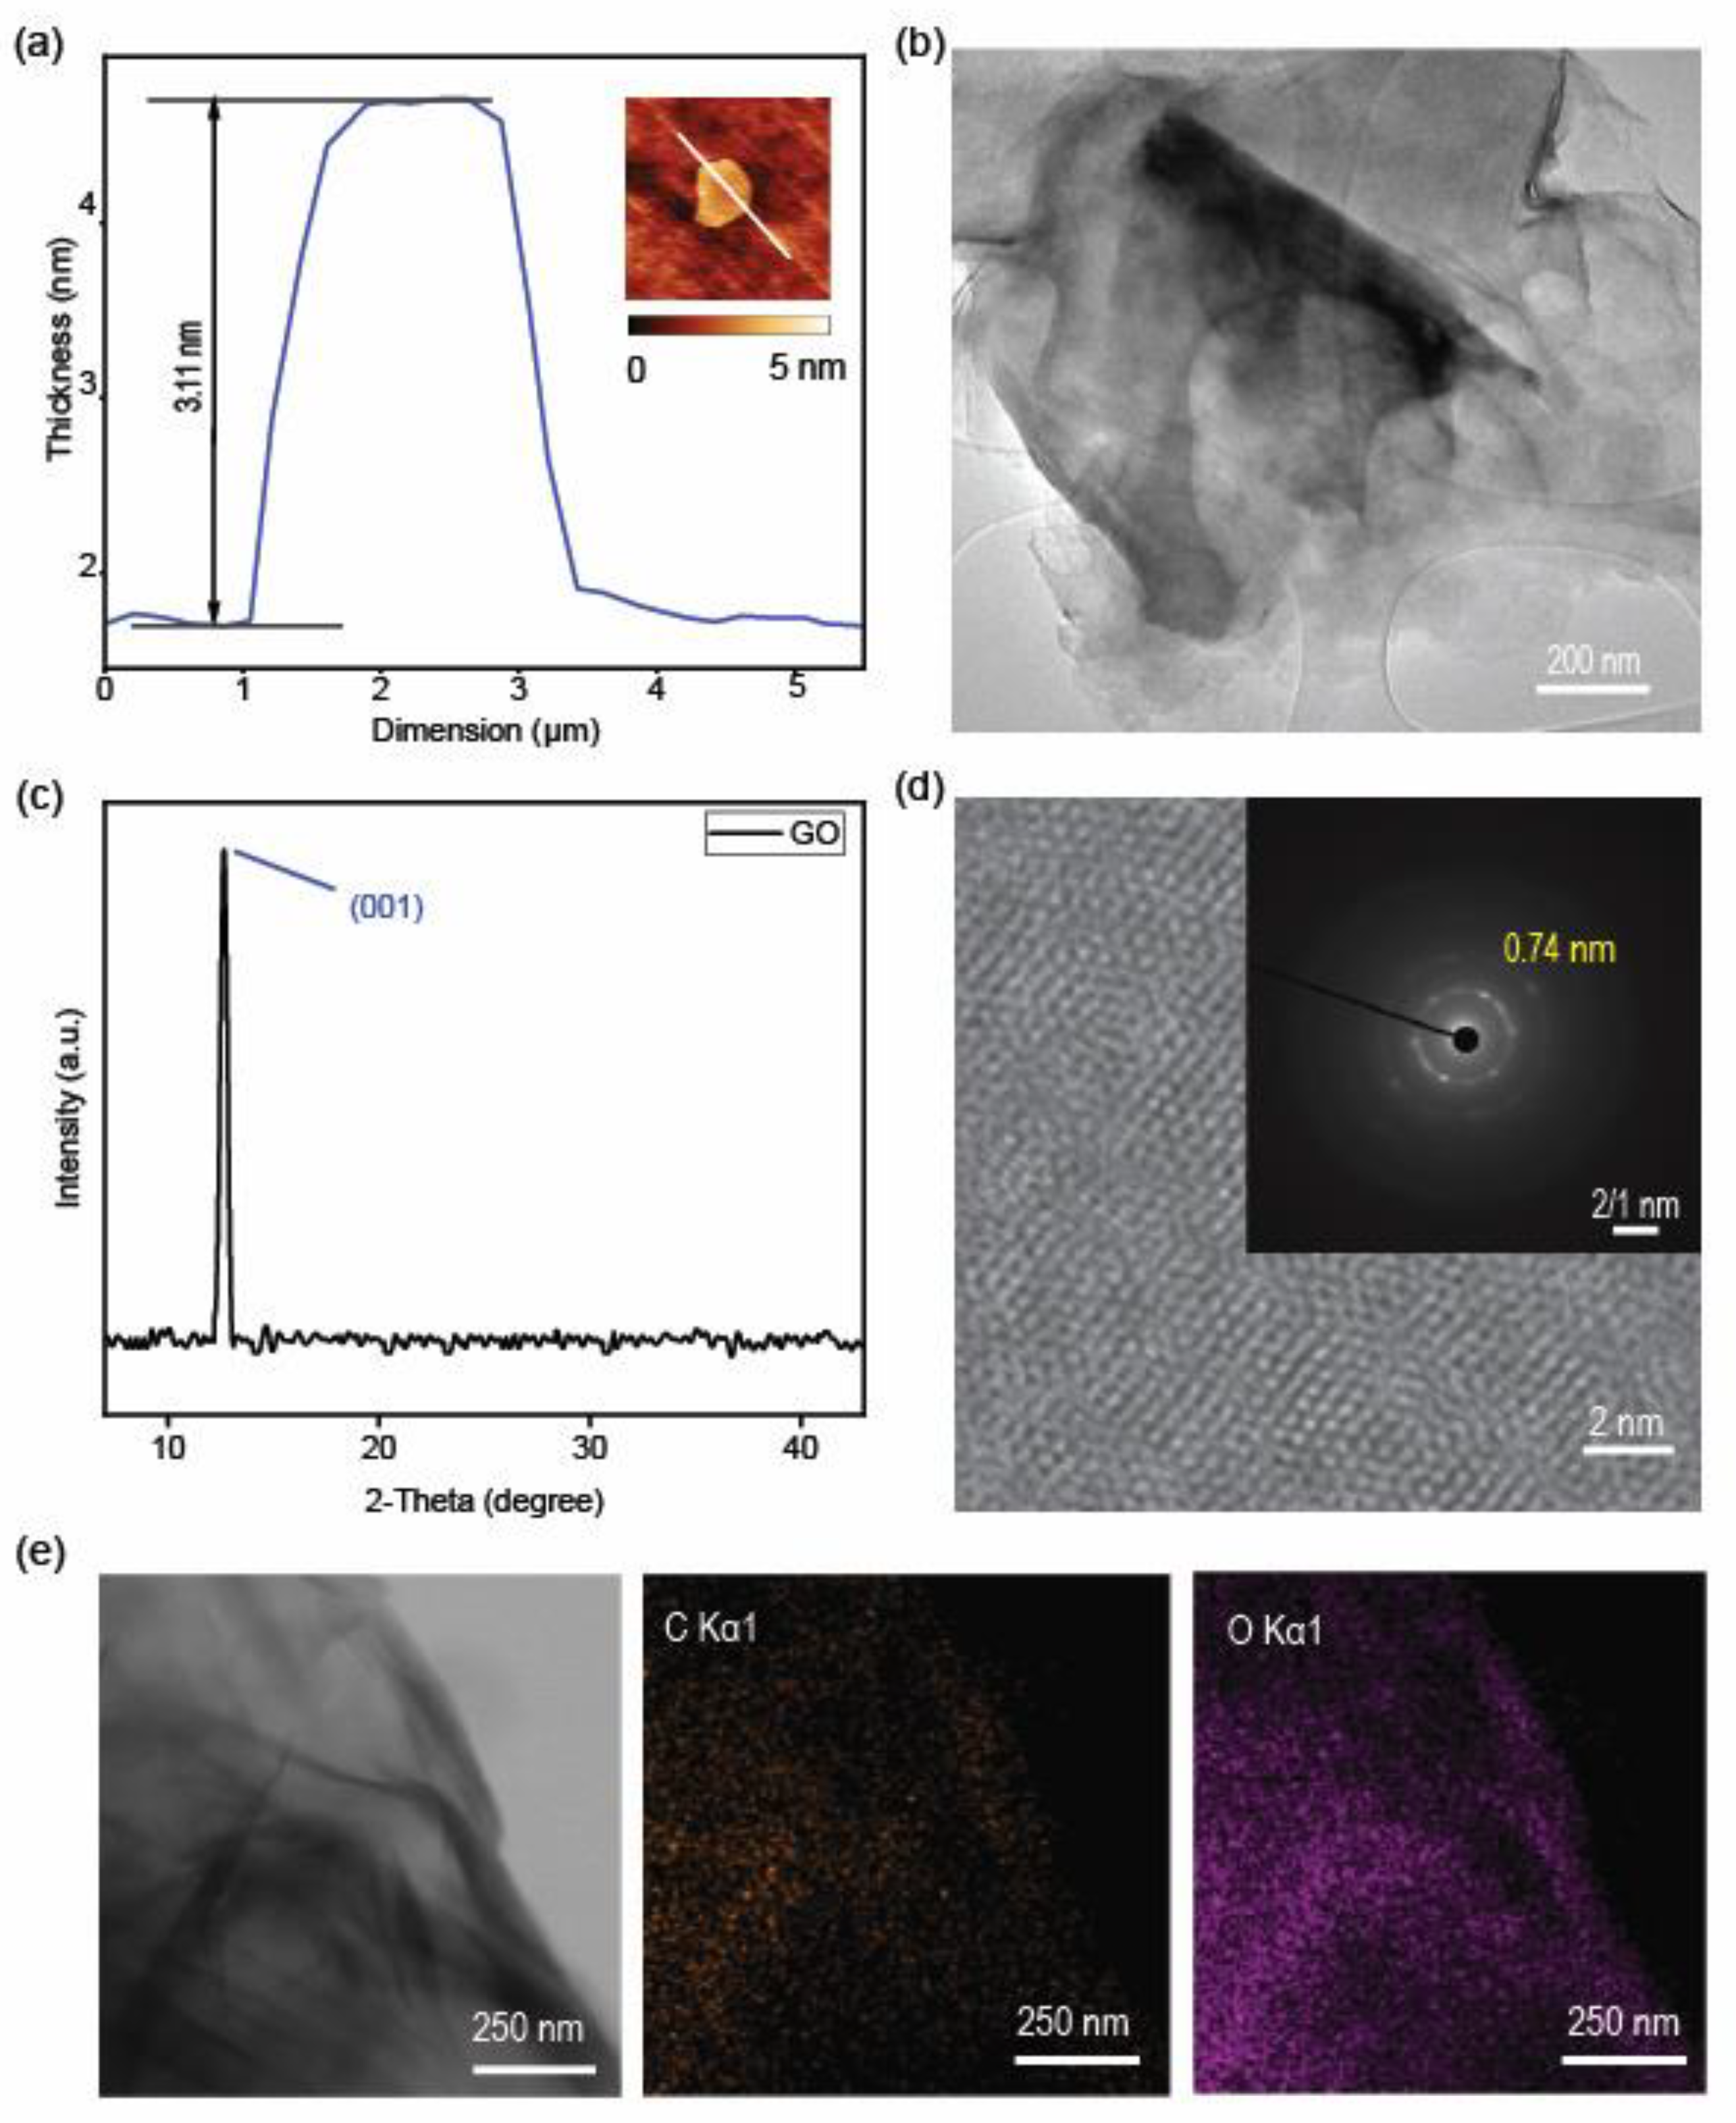
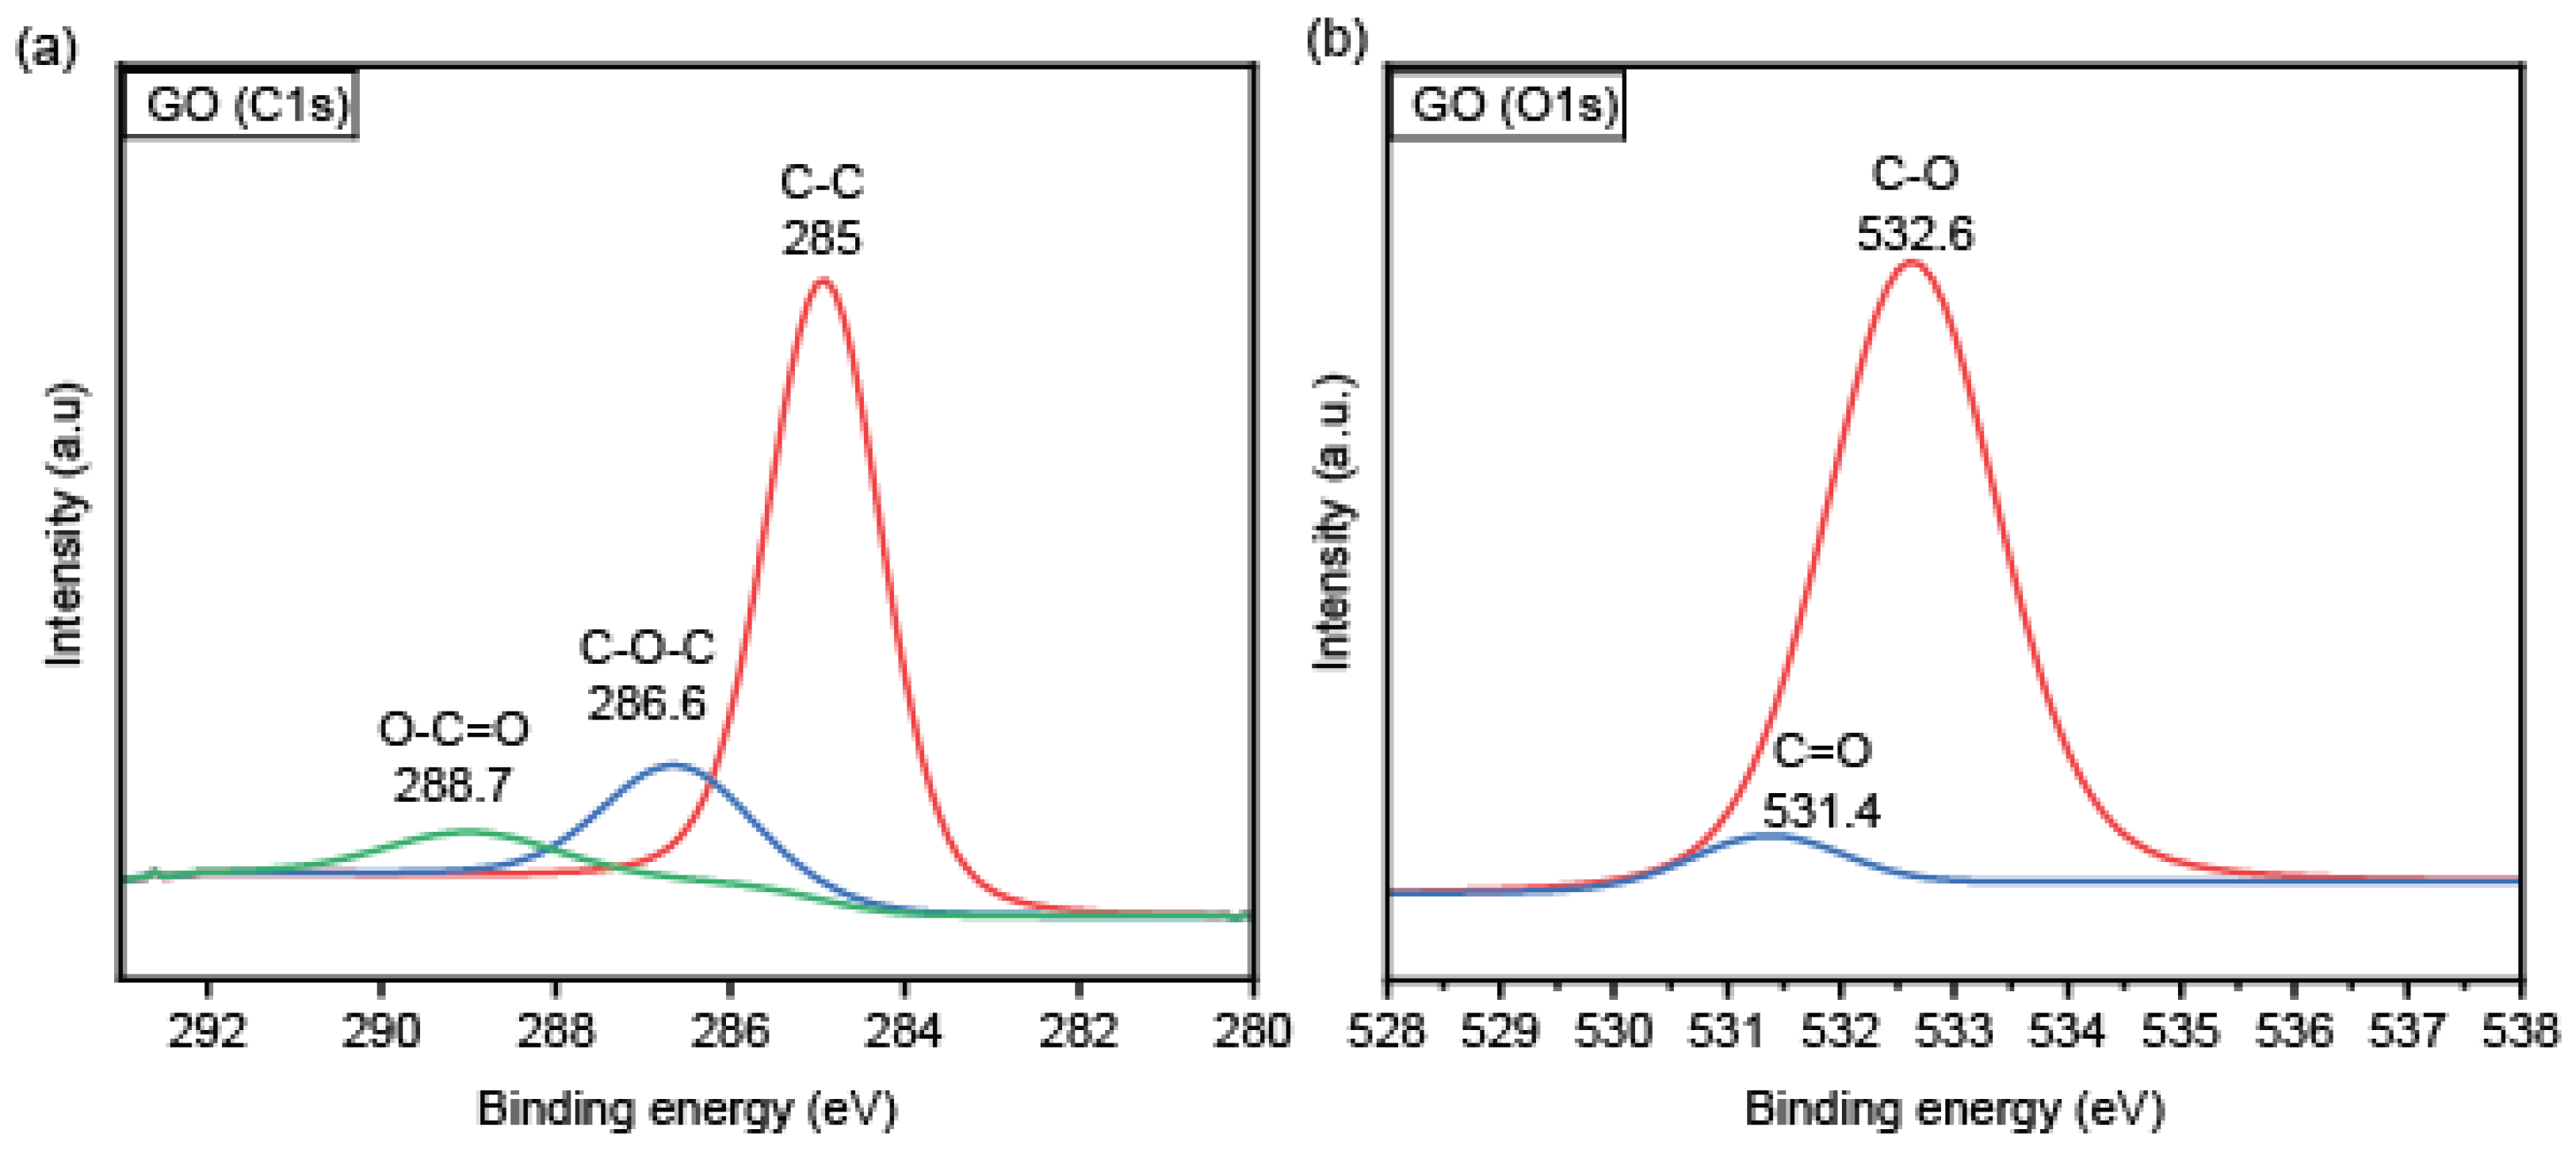
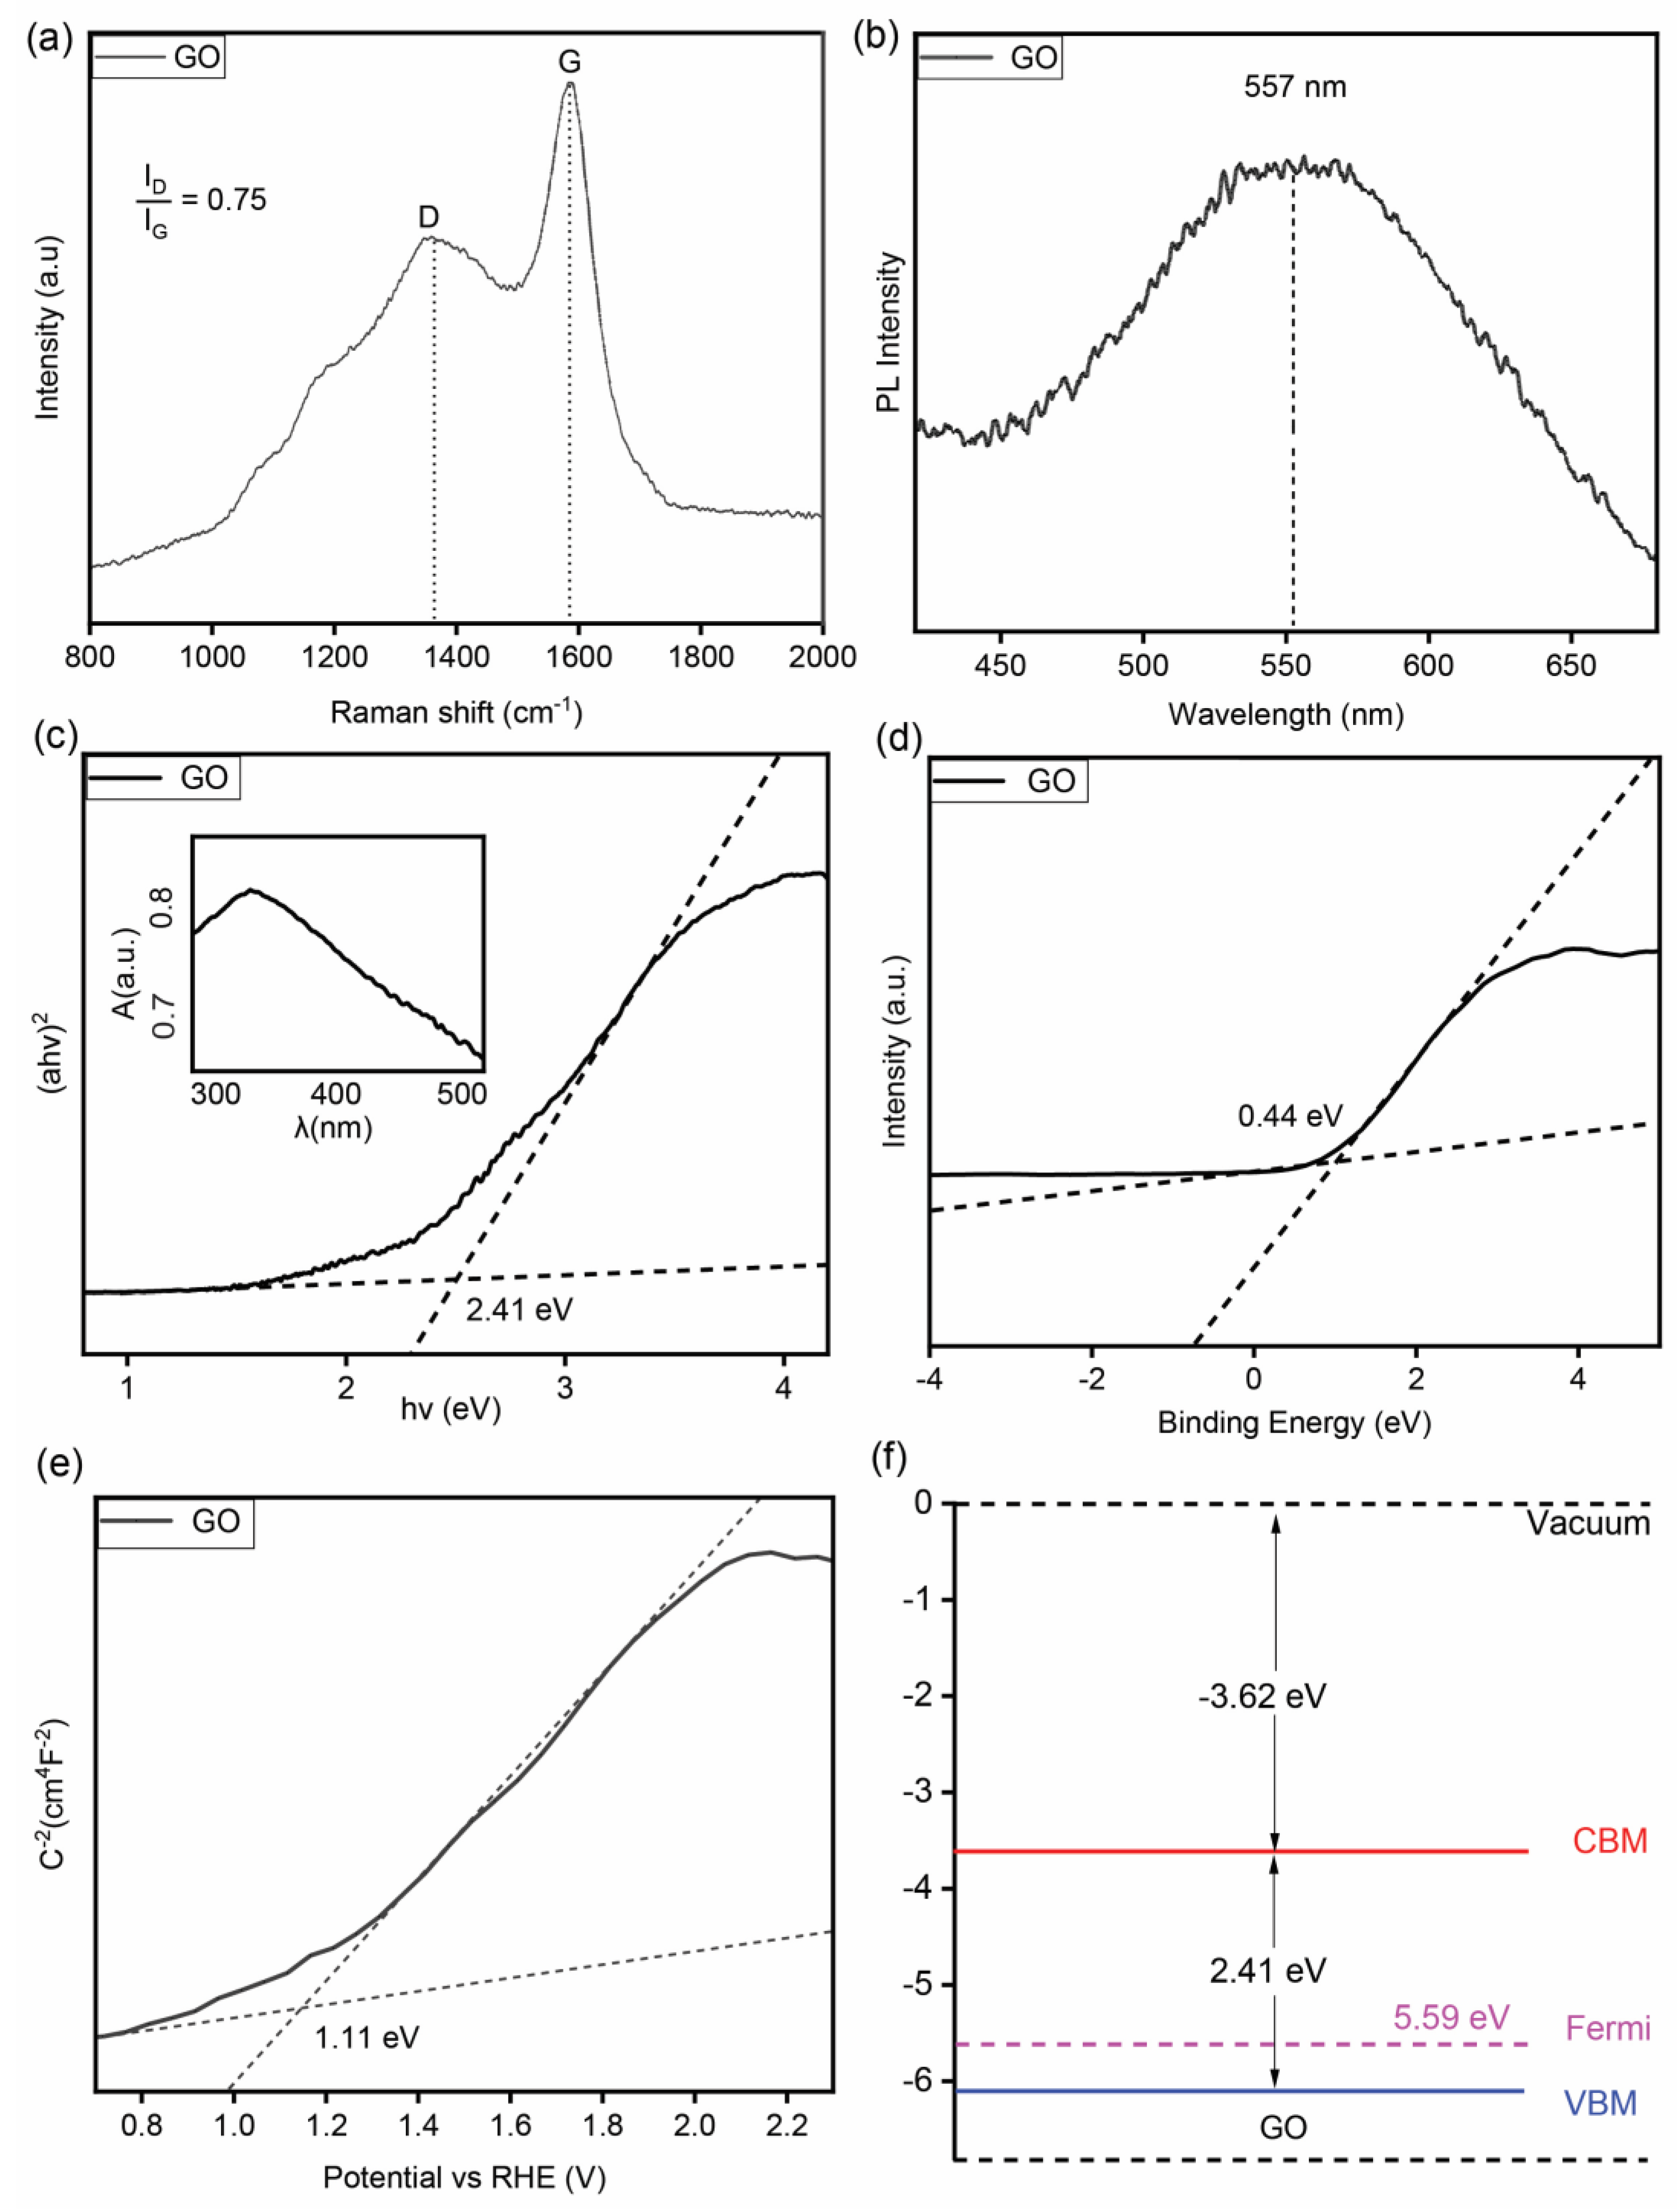
3.1. Material Characterization

The graphene oxide (GO) nanosheets were synthesized from plastic wastes through chemical reactions (details are presented in the Material Synthesis and Preparation section). From the atomic force microscopy (AFM) image shown in Figure 1a, a typical GO nanosheet showed an ultra-thin sheet morphology with a lateral dimension of ~2 µm and a thickness of ~3.11 nm, which falls into the main range of statistical distribution between 1.8 and 2.3 µm for the lateral dimension and between 2 and 4 nm for thickness (Figure S4). Such a sheet-like morphology was further confirmed by the transmission electron microscope (TEM) image shown in Figure 1b. An X-ray diffraction analysis (XRD) was utilized to study the crystal structure of the obtained GO; as shown in Figure 1c, a substantial sharp peak was found at ~12° of 2-theta, which can be associated with the (001) plane [39,40,41,42]. From the high-resolution transmission electron microscopy (HRTEM) image with the corresponding selected area electron diffraction (SAED) pattern (Figure 1d and the inset), the GO nanosheet exhibited a polycrystalline nature with a d-spacing of 0.74 nm, measured as the (001) plane, which is in good agreement with previous studies as well as our XRD result [40,41,42,43,44]. The elemental composition of the material was investigated using electron spectroscopy (EDS); as shown in Figure 1e, the EDS mappings of C and O elements were identified and matched well with the electron image (Figure 1e), revealing that the formed graphene nanosheet was simultaneously oxidized during the synthesis process, eventually converting it to graphene oxide.
X-ray photoelectron spectroscopy (XPS) was conducted to study the chemical compounds in the GO nanosheet (Figure 2). In the C 1s spectrum shown in Figure 2a, three peaks were observed at the binding energies of ~285, ~286.6, and ~288.9 eV, which can be assigned to the non-oxygenated ring C–C, the carbonyl C=O, and the carboxylate carbon O=C–O, respectively [39,45,46,47]. On the other hand, according to the O 1s spectrum shown in Figure 2b, the XPS peaks of the C=O and C-O bonds were found at ~531.1 and ~532.4 eV, respectively. Before deconvolution, Shirley’s background subtraction method was employed. This step was necessary due to the occurrence of inelastic scattering events that are experienced by the photoelectrons during their transit from the excitation point to the sample surface. These events contribute to the inelastic background intensity, which must be subtracted to isolate the areas corresponding to the individual peaks. The XPS spectra of C 1s and O 1s were fitted using Gaussian–Lorentzian (GL30) functions to delineate the respective components, utilizing the characteristic binding energy (BE) values for carbon and oxygen 1s photoelectrons obtained from the relevant literature [45,47,48,49,50]. It is worth noting that the energy peak of C-O was significantly larger than that of the C=O peak, suggesting that a single bond between carbon and oxygen atoms considerably outweighs a double bond in graphene oxide, which is consistent with previous reports [51,52,53,54].
Throughout history, Raman spectroscopy has served as a tool for investigating the structural and electronic properties of graphite materials. It offers valuable insights into defects, represented by the D band, and the in-plane vibration of sp2 carbon atoms, denoted by the G band. According to the Raman spectrum shown in Figure 3a, the graphene oxide nanosheet exhibited a D band and G band at 1370 and 1593 cm−1, respectively, which can be ascribed to the vibrational mode of A1g and E2g for the graphene oxide [55,56,57,58]. Furthermore, the Raman spectrum of the GO revealed that the intensity of the D band was slightly less than that of the G band, indicating a moderate structural disorders due to the harsh oxidation condition in the novel synthesis process [59]. Given the presence of D band peaks in the Raman spectra, defects and impurities were anticipated, and the calculated ID/IG ratio in this study was estimated to be approximately 0.75, leading to a lack of the pristine hexagonal structure of graphene, which is consistent with the findings of prior studies [59,60].
To further study its semiconductor characteristics, a photo luminescence (PL) measurement was conducted on the GO nanosheet, revealing a sharp PL intensity peak at ~557 nm (Figure 3b). According to the UV–Vis spectra shown in the inset of Figure 3c, the GO nanosheet showed a broad optical absorption peak at ~350 nm with an extended tail covering the range of the visible light spectrum. From the corresponding Tauc plot, derived from the optical absorption coefficient (αhv)2 against the optical energy hv (Figure 3c), the energy band gap of the GO sheet was calculated to be ~2.41 eV, which is in a good agreement with the estimation of the PL result shown in Figure 3b. In addition, based on the valance band spectra shown in Figure 3d, the energy gap between the Fermi level and the valence band maximum (VBM) was determined to be 0.44 eV, suggesting that the obtained GO sample is a p-type semiconductor [61,62,63]. Given the Mott–Schottky plot shown in Figure 3e, the energy level of the conduction band minimum (CBM) for the GO nanosheet was further estimated to be ~0.2 eV vs. a reversible hydrogen electrode (RHE), resulting in the overall energy band structures for the GO sample that are presented in Figure 3f [3,61,62,63].

3.2. Room Temperature Reversible Gas Sensor

To confirm the gas sensing performance of the sample, a graphene oxide sensor was fabricated by depositing ~40 μL of material solution on a silicon-based interdigital transducer (IDT) substrate, in which 200 pairs of interdigital electrodes (IDEs) were designed with 10 µm gaps to further enhance the gas–matter interaction behavior of the nanosheet material (more details are given in the Materials and Methods section). An air-tight chamber was custom-designed to house the prepared sensor substrate. Within this chamber, a set of programmable mass flow controllers (MFCs) was connected to the inlet, allowing for adjustable gas flow from the target gas cylinders into the chamber (refer to Figure S5). The chamber’s exhaust was directed to a fume hood through a ¼ inch Teflon tube. Simultaneously, the electrical resistance of the sensor was continuously measured using a high-resolution multimeter via the integrated probe stages within the chamber. The assessment of the gas sensing performance was conducted using a response factor, which was calculated using the formula (Ranalyte − Rbalance)/Rbalance × 100%, in which Ranalyte signifies the electrical resistance of the sensor when exposed to the analyte gas species, while Rbalance represents the baseline resistance in ambient air [64,65,66].
The sensor was tested at room temperature without any additional stimulus including excitonic light sources or bias voltages. In this work, NO2 was chosen as the analyte gas owing to its intrinsic paramagnetic nature originating from its unique open-shell electron configuration [1,21,67,68]. From the dynamic response shown in Figure 4a, the GO sensor demonstrated an excellent recoverable sensing response towards ultra-low-concentration NO2 gas ranging from 315 ppb to 1026 ppb at room temperature. The response exhibited in an almost linear trend, reaching a response factor of ~11% at 1026 ppb NO2. Given its significantly enlarged surface–volume ratio and abundant oxygen functional groups such as hydroxyl (-OH) and carboxyl (-COOH) groups, the GO nanosheets act as electron acceptors with a strong affinity for electrons from the polar NO2 molecules in the ambient environment, forming interfacial dipole moments between the material surface and gas molecules. Such a physisorption-based gas–matter interaction behavior causes a significant re-distribution of the charge density on the material surface, resulting in a reduction in electrical resistance for the GO sensor corresponding to the concentration of the adsorbed NO2 gas molecules [1,6,7]. As the NO2 gas desorbed from the sensor, its resistance gradually returned to the base level during the recovery phase (Figure 4a). Despite the absence of an external stimulus, the sensor still demonstrated complete response and recovery patterns when exposed to the low-concentration NO2 gas at a reasonably fast rate. From Figure 4b, the sensor’s response/recovery time were measured as the elapsed time until a 90% change in the full magnitude of the response factor, reaching approximately 27 and 115 min for the response and recovery, respectively, when the sensor was exposed to 315 ppb NO2. The sensor was further tested with other commonly seen gas species at industrially meaningful concentrations, including CH4 (1%), H2 (1%), and CO2 (1%), under the same test conditions as NO2. According to Figure 4c, the GO sensor was highly selective to NO2 gas compared to the other gas species, which is probably due to its pure physisorption-based sensing mechanism as well as the distinct electronegativities of different kinds of gas molecules [1,6,7]. From the long-term stability and repeatability results shown in Figure 4d and 4e, respectively, the sensor demonstrated little performance degradation after the 5-day long-term stability test and an almost identical response towards 1026 ppb of NO2 gas during three cycles of continuous experiments over 12 h. In addition, the sensor’s limit of detection (LOD), derived from three times the ratio of the noise level to the response slope of NO2 gas, was estimated to be 1.43 ppb (Figure 4f). The response slope was calculated from a linear regression model established based on the response datasets of the sensors under various NO2 concentrations [1,6,7].

4. Conclusions

We successfully obtained 2D graphene oxide nanoflakes through the chemical and thermal treatment of a carbon source in a controlled environment. Through morphological analysis, ultra-thin graphene oxide, with the predominant size being around 2 µm, exhibited a thickness of about 3.11 nm. According to the structural and chemical composition analysis, most of the C atoms in the pristine graphite framework were broken down and invaded by O atoms after experiencing high electric discharge from the capacitor bank and thermal annealing, leading to a crystal phase transition from an initially hexagonal to polycrystal coordination. The bandgap energy of the flash graphene oxide was expanded to ~1.43 eV, which was wider compared to the zero bandgap of pure graphene. To evaluate the gas sensing performances, the change in electrical resistance of annealed graphene oxide was investigated upon the exposure to NO2 gas at room temperature without the application of external stimuli including light excitation and voltage biasing. A response factor of ~11.84% was found for 0.000126% NO2 gas with an almost linear trend for concentrations between 0.0000315% and 0.000126%. In addition, a high degree of repeatability and full reversibility were demonstrated. Furthermore, the response magnitude of 0.000126% NO2 was at least one order of magnitude larger than that of several commonly seen gases including H2 (1%), CH4 (1%), and CO2 (1%), revealing the excellent selectivity for NO2, which is rarely seen in pure semiconducting gas sensors. We believe that the physisorption mechanism governing the gas adsorption behavior over the surface of the ultra-thin annealed graphene oxide produced from the flash method enabled the fully reversible, highly selective, and room-temperature NO2 gas sensing performance, similar to the observations of the gas interactions with many types of 2D graphene oxide. This work demonstrated the great potential of annealed graphene oxide in high-performance physisorption-based gas sensing, indicating that it could be a suitable for use in developing low-cost and power-saving devices for Internet of Things (IoT) applications.

Supplementary Materials

The following supporting information can be downloaded at: https://www.mdpi.com/article/10.3390/chemosensors12060108/s1, Figure S1: Plastic beverage bottles made of PET material were acquired, the hard parts at both ends were removed, and the thin middle section was cut into pieces; Figure S2: Plastic fragments were vacuum dried after the chemical treatment; Figure S3: Graphene oxide black powder obtained after thermal treatments; Figure S4: The statistical distribution of the lateral dimension (a) and thickness (b), in which the thickness distribution had a peak at ~3 nm and the lateral size mainly ranged between 1.8 and 2.3 µm; Figure S5: Gas sensing platform used for room temperature gas sensing experiment.

Author Contributions

Conceptualization, V.T., K.X. and J.Z.O.; data curation, V.T. and K.X.; formal analysis, V.T. and K.X.; methodology, K.X. and V.T.; validation, V.T., K.X., H.Y., N.H., Y.H., M.W.K., R.O., Y.L., J.Z., Q.M., G.R. and J.Z.O.; investigation, V.T., H.Y., N.H., Y.H., M.W.K., R.O., Y.L., J.Z., Q.M., G.R. and J.Z.O.; writing—original draft, V.T.; writing—review and editing, K.X., G.R. and J.Z.O.; visualization, K.X. and V.T.; supervision, K.X., G.R. and J.Z.O.; funding acquisition, J.Z.O. All authors have read and agreed to the published version of the manuscript.

Funding

This research received no external funding.

Institutional Review Board Statement

Not applicable.

Informed Consent Statement

Not applicable.

Data Availability Statement

Data are contained within the article and Supplementary Materials.

Acknowledgments

V.T. would like to acknowledge the Australian Government Research Training Program (RTP) and RMIT University, School of Engineering (SoE), for financial support. The authors would like to acknowledge the facilities and the scientific and technical assistance of the RMIT Micro Nano Research Facility (MNRF) and the RMIT Microscopy and Microanalysis Facility (RMMF).

Conflicts of Interest

The authors declare no conflicts of interest.

References

  1. Ou, J.Z.; Ge, W.; Carey, B.; Daeneke, T.; Rotbart, A.; Shan, W.; Wang, Y.; Fu, Z.; Chrimes, A.F.; Wlodarski, W. Physisorption-based charge transfer in two-dimensional SnS2 for selective and reversible NO2 gas sensing. ACS Nano 2015, 9, 10313–10323. [Google Scholar] [CrossRef] [PubMed]
  2. Chung, M.G.; Lee, H.M.; Kim, T.; Choi, J.H.; kyun Seo, D.; Yoo, J.-B.; Hong, S.-H.; Kang, T.J.; Kim, Y.H. Highly sensitive NO2 gas sensor based on ozone treated graphene. Sens. Actuators B Chem. 2012, 166, 172–176. [Google Scholar] [CrossRef]
  3. Xu, K.; Zhang, B.Y.; Mohiuddin, M.; Ha, N.; Wen, X.; Zhou, C.; Li, Y.; Ren, G.; Zhang, H.; Zavabeti, A. Free-standing ultra-thin Janus indium oxysulfide for ultrasensitive visible-light-driven optoelectronic chemical sensing. Nano Today 2021, 37, 101096. [Google Scholar] [CrossRef]
  4. Cho, B.; Yoon, J.; Lim, S.K.; Kim, A.R.; Kim, D.-H.; Park, S.-G.; Kwon, J.-D.; Lee, Y.-J.; Lee, K.-H.; Lee, B.H. Chemical sensing of 2D graphene/MoS2 heterostructure device. ACS Appl. Mater. Interfaces 2015, 7, 16775–16780. [Google Scholar] [CrossRef] [PubMed]
  5. Jannat, A.; Haque, F.; Xu, K.; Zhou, C.; Zhang, B.Y.; Syed, N.; Mohiuddin, M.; Messalea, K.A.; Li, X.; Gras, S.L. Exciton-driven chemical sensors based on excitation-dependent photoluminescent two-dimensional SnS. ACS Appl. Mater. Interfaces 2019, 11, 42462–42468. [Google Scholar] [CrossRef] [PubMed]
  6. Alkathiri, T.; Xu, K.; Zhang, B.Y.; Khan, M.W.; Jannat, A.; Syed, N.; Almutairi, A.F.; Ha, N.; Alsaif, M.M.; Pillai, N. 2D palladium sulphate for visible-light-driven optoelectronic reversible gas sensing at room temperature. Small Sci. 2022, 2, 2100097. [Google Scholar] [CrossRef]
  7. Xu, K.; Ha, N.; Hu, Y.; Ma, Q.; Chen, W.; Wen, X.; Ou, R.; Trinh, V.; McConville, C.F.; Zhang, B.Y. A room temperature all-optical sensor based on two-dimensional SnS2 for highly sensitive and reversible NO2 sensing. J. Hazard. Mater. 2022, 426, 127813. [Google Scholar] [CrossRef] [PubMed]
  8. Zhou, C.; Yang, W.; Zhu, H. Mechanism of charge transfer and its impacts on Fermi-level pinning for gas molecules adsorbed on monolayer WS2. J. Chem. Phys. 2015, 142, 214704. [Google Scholar] [CrossRef] [PubMed]
  9. Cheng, Y.; Li, Z.; Tang, T.; Xu, K.; Yu, H.; Tao, X.; Hung, C.M.; Hoa, N.D.; Fang, Y.; Ren, B. 3D micro-combs self-assembled from 2D N-doped In2S3 for room-temperature reversible NO2 gas sensing. Appl. Mater. Today 2022, 26, 101355. [Google Scholar] [CrossRef]
  10. Long, H.; Harley-Trochimczyk, A.; Pham, T.; Tang, Z.; Shi, T.; Zettl, A.; Carraro, C.; Worsley, M.A.; Maboudian, R. High surface area MoS2/graphene hybrid aerogel for ultrasensitive NO2 detection. Adv. Funct. Mater. 2016, 26, 5158–5165. [Google Scholar] [CrossRef]
  11. Mao, S.; Cui, S.; Lu, G.; Yu, K.; Wen, Z.; Chen, J. Tuning gas-sensing properties of reduced graphene oxide using tin oxide nanocrystals. J. Mater. Chem. 2012, 22, 11009–11013. [Google Scholar] [CrossRef]
  12. Deng, S.; Tjoa, V.; Fan, H.M.; Tan, H.R.; Sayle, D.C.; Olivo, M.; Mhaisalkar, S.; Wei, J.; Sow, C.H. Reduced graphene oxide conjugated Cu2O nanowire mesocrystals for high-performance NO2 gas sensor. J. Am. Chem. Soc. 2012, 134, 4905–4917. [Google Scholar] [CrossRef] [PubMed]
  13. Huang, Y.; Jiao, W.; Chu, Z.; Wang, S.; Chen, L.; Nie, X.; Wang, R.; He, X. High sensitivity, humidity-independent, flexible NO2 and NH3 gas sensors based on SnS2 hybrid functional graphene ink. ACS Appl. Mater. Interfaces 2019, 12, 997–1004. [Google Scholar] [CrossRef] [PubMed]
  14. Kang, I.-S.; So, H.-M.; Bang, G.-S.; Kwak, J.-H.; Lee, J.-O.; Won Ahn, C. Recovery improvement of graphene-based gas sensors functionalized with nanoscale heterojunctions. Appl. Phys. Lett. 2012, 101, 123504. [Google Scholar] [CrossRef]
  15. Gautam, M.; Jayatissa, A.H. Ammonia gas sensing behavior of graphene surface decorated with gold nanoparticles. Solid-State Electron. 2012, 78, 159–165. [Google Scholar] [CrossRef]
  16. Xuan, Y.; Wu, Y.; Shen, T.; Qi, M.; Capano, M.A.; Cooper, J.A.; Ye, P. Atomic-layer-deposited nanostructures for graphene-based nanoelectronics. Appl. Phys. Lett. 2008, 92, 013101. [Google Scholar] [CrossRef]
  17. Robinson, J.A.; Snow, E.S.; Bădescuu, Ş.C.; Reinecke, T.L.; Perkins, F.K. Role of defects in single-walled carbon nanotube chemical sensors. Nano Lett. 2006, 6, 1747–1751. [Google Scholar] [CrossRef] [PubMed]
  18. Lee, G.; Lee, B.; Kim, J.; Cho, K. Ozone adsorption on graphene: Ab initio study and experimental validation. J. Phys. Chem. C 2009, 113, 14225–14229. [Google Scholar] [CrossRef]
  19. Huang, S.; Panes-Ruiz, L.A.; Croy, A.; Löffler, M.; Khavrus, V.; Bezugly, V.; Cuniberti, G. Highly sensitive room temperature ammonia gas sensor using pristine graphene: The role of biocompatible stabilizer. Carbon 2021, 173, 262–270. [Google Scholar] [CrossRef]
  20. Dan, Y.; Lu, Y.; Kybert, N.J.; Luo, Z.; Johnson, A.C. Intrinsic response of graphene vapor sensors. Nano Lett. 2009, 9, 1472–1475. [Google Scholar] [CrossRef]
  21. Leenaerts, O.; Partoens, B.; Peeters, F. Adsorption of H2O, NH3, CO, NO2, and NO on graphene: A first-principles study. Phys. Rev. B 2008, 77, 125416. [Google Scholar] [CrossRef]
  22. Brodie, B.C. XIII. On the atomic weight of graphite. Philos. Trans. R. Soc. Lond. 1859, 149, 249–259. [Google Scholar]
  23. Toda, K.; Furue, R.; Hayami, S. Recent progress in applications of graphene oxide for gas sensing: A review. Anal. Chim. Acta 2015, 878, 43–53. [Google Scholar] [CrossRef] [PubMed]
  24. Li, X.; Cai, W.; An, J.; Kim, S.; Nah, J.; Yang, D.; Piner, R.; Velamakanni, A.; Jung, I.; Tutuc, E. Large-area synthesis of high-quality and uniform graphene films on copper foils. Science 2009, 324, 1312–1314. [Google Scholar] [CrossRef]
  25. Schedin, F.; Geim, A.K.; Morozov, S.V.; Hill, E.W.; Blake, P.; Katsnelson, M.I.; Novoselov, K.S. Detection of individual gas molecules adsorbed on graphene. Nat. Mater. 2007, 6, 652–655. [Google Scholar] [CrossRef] [PubMed]
  26. Luong, D.X.; Bets, K.V.; Algozeeb, W.A.; Stanford, M.G.; Kittrell, C.; Chen, W.; Salvatierra, R.V.; Ren, M.; McHugh, E.A.; Advincula, P.A. Gram-scale bottom-up flash graphene synthesis. Nature 2020, 577, 647–651. [Google Scholar] [CrossRef] [PubMed]
  27. Algozeeb, W.A.; Savas, P.E.; Luong, D.X.; Chen, W.; Kittrell, C.; Bhat, M.; Shahsavari, R.; Tour, J.M. Flash graphene from plastic waste. ACS Nano 2020, 14, 15595–15604. [Google Scholar] [CrossRef] [PubMed]
  28. Advincula, P.A.; Luong, D.X.; Chen, W.; Raghuraman, S.; Shahsavari, R.; Tour, J.M. Flash graphene from rubber waste. Carbon 2021, 178, 649–656. [Google Scholar] [CrossRef]
  29. Stanford, M.G.; Bets, K.V.; Luong, D.X.; Advincula, P.A.; Chen, W.; Li, J.T.; Wang, Z.; McHugh, E.A.; Algozeeb, W.A.; Yakobson, B.I. Flash graphene morphologies. ACS Nano 2020, 14, 13691–13699. [Google Scholar] [CrossRef]
  30. Barbhuiya, N.H.; Kumar, A.; Singh, A.; Chandel, M.K.; Arnusch, C.J.; Tour, J.M.; Singh, S.P. The future of flash graphene for the sustainable management of solid waste. ACS Nano 2021, 15, 15461–15470. [Google Scholar] [CrossRef]
  31. Wang, L.J.; El-Kady, M.F.; Dubin, S.; Hwang, J.Y.; Shao, Y.; Marsh, K.; McVerry, B.; Kowal, M.D.; Mousavi, M.F.; Kaner, R.B. Flash converted graphene for ultra-high power supercapacitors. Adv. Energy Mater. 2015, 5, 1500786. [Google Scholar] [CrossRef]
  32. Yao, L.; King, J.; Wu, D.; Chuang, S.S.; Peng, Z. Non-thermal plasma-assisted hydrogenolysis of polyethylene to light hydrocarbons. Catal. Commun. 2021, 150, 106274. [Google Scholar] [CrossRef]
  33. Jiang, J.; Shi, K.; Zhang, X.; Yu, K.; Zhang, H.; He, J.; Ju, Y.; Liu, J. From plastic waste to wealth using chemical recycling: A review. J. Environ. Chem. Eng. 2022, 10, 106867. [Google Scholar] [CrossRef]
  34. Pillain, B.; Loubet, P.; Pestalozzi, F.; Woidasky, J.; Erriguible, A.; Aymonier, C.; Sonnemann, G. Positioning supercritical solvolysis among innovative recycling and current waste management scenarios for carbon fiber reinforced plastics thanks to comparative life cycle assessment. J. Supercrit. Fluids 2019, 154, 104607. [Google Scholar] [CrossRef]
  35. Chen, X.; Wang, Y.; Zhang, L. Recent progress in the chemical upcycling of plastic wastes. ChemSusChem 2021, 14, 4137–4151. [Google Scholar] [CrossRef] [PubMed]
  36. Zheng, K.; Wu, Y.; Hu, Z.; Wang, S.; Jiao, X.; Zhu, J.; Sun, Y.; Xie, Y. Progress and perspective for conversion of plastic wastes into valuable chemicals. Chem. Soc. Rev. 2023, 52, 8–29. [Google Scholar] [CrossRef] [PubMed]
  37. Amundarain, I.; López-Montenegro, S.; Fulgencio-Medrano, L.; Leivar, J.; Iruskieta, A.; Asueta, A.; Miguel-Fernández, R.; Arnaiz, S.; Pereda-Ayo, B. Improving the Sustainability of Catalytic Glycolysis of Complex PET Waste through Bio-Solvolysis. Polymers 2024, 16, 142. [Google Scholar] [CrossRef]
  38. Yamazoe, N.; Shimanoe, K. Receptor function and response of semiconductor gas sensor. J. Sens. 2009, 2009. [Google Scholar] [CrossRef]
  39. Stobinski, L.; Lesiak, B.; Malolepszy, A.; Mazurkiewicz, M.; Mierzwa, B.; Zemek, J.; Jiricek, P.; Bieloshapka, I. Graphene oxide and reduced graphene oxide studied by the XRD, TEM and electron spectroscopy methods. J. Electron Spectrosc. Relat. Phenom. 2014, 195, 145–154. [Google Scholar] [CrossRef]
  40. Shahriary, L.; Athawale, A.A. Graphene oxide synthesized by using modified hummers approach. Int. J. Renew. Energy Environ. Eng 2014, 2, 58–63. [Google Scholar]
  41. Krishnamoorthy, K.; Mohan, R.; Kim, S.-J. Graphene oxide as a photocatalytic material. Appl. Phys. Lett. 2011, 98, 244101. [Google Scholar] [CrossRef]
  42. Wang, G.; Sun, X.; Liu, C.; Lian, J. Tailoring oxidation degrees of graphene oxide by simple chemical reactions. Appl. Phys. Lett. 2011, 99, 053114. [Google Scholar] [CrossRef]
  43. Krishnamoorthy, K.; Veerapandian, M.; Yun, K.; Kim, S.-J. The chemical and structural analysis of graphene oxide with different degrees of oxidation. Carbon 2013, 53, 38–49. [Google Scholar] [CrossRef]
  44. Gupta, V.; Sharma, N.; Singh, U.; Arif, M.; Singh, A. Higher oxidation level in graphene oxide. Optik 2017, 143, 115–124. [Google Scholar] [CrossRef]
  45. Lin, Z.; Yao, Y.; Li, Z.; Liu, Y.; Li, Z.; Wong, C.-P. Solvent-assisted thermal reduction of graphite oxide. J. Phys. Chem. C 2010, 114, 14819–14825. [Google Scholar] [CrossRef]
  46. Lee, S.W.; Mattevi, C.; Chhowalla, M.; Sankaran, R.M. Plasma-assisted reduction of graphene oxide at low temperature and atmospheric pressure for flexible conductor applications. J. Phys. Chem. Lett. 2012, 3, 772–777. [Google Scholar] [CrossRef]
  47. Shim, S.H.; Kim, K.T.; Lee, J.U.; Jo, W.H. Facile method to functionalize graphene oxide and its application to poly (ethylene terephthalate)/graphene composite. ACS Appl. Mater. Interfaces 2012, 4, 4184–4191. [Google Scholar] [CrossRef] [PubMed]
  48. Crist, B.V. XPS in industry—Problems with binding energies in journals and binding energy databases. J. Electron Spectrosc. Relat. Phenom. 2019, 231, 75–87. [Google Scholar] [CrossRef]
  49. Butenko, Y.V.; Krishnamurthy, S.; Chakraborty, A.; Kuznetsov, V.; Dhanak, V.; Hunt, M.; Šiller, L. Photoemission study of onionlike carbons produced by annealing nanodiamonds. Phys. Rev. B 2005, 71, 075420. [Google Scholar] [CrossRef]
  50. Moulder, J.F.; Stickle, W.F.; Sobol, P.E.; Bomben, K.D. Handbook of X-ray Photoelectron Spectroscopy: A Reference Book of Standard Spectra for Identification and Interpretation of XPS Data; Perkin-Elmer Corporation: Waltham, MA, USA, 1992; Volume 40, p. 221. [Google Scholar]
  51. Fan, L.-Z.; Liu, J.-L.; Ud-Din, R.; Yan, X.; Qu, X. The effect of reduction time on the surface functional groups and supercapacitive performance of graphene nanosheets. Carbon 2012, 50, 3724–3730. [Google Scholar] [CrossRef]
  52. Yang, D.; Velamakanni, A.; Bozoklu, G.; Park, S.; Stoller, M.; Piner, R.D.; Stankovich, S.; Jung, I.; Field, D.A.; Ventric, C.A., Jr. Chemical analysis of graphene oxide films after heat and chemical treatments by X-ray photoelectron and Micro-Raman spectroscopy. Carbon 2009, 47, 145–152. [Google Scholar] [CrossRef]
  53. Hong, W.G.; Kim, B.H.; Lee, S.M.; Yu, H.Y.; Yun, Y.J.; Jun, Y.; Lee, J.B.; Kim, H.J. Agent-free synthesis of graphene oxide/transition metal oxide composites and its application for hydrogen storage. Int. J. Hydrogen Energy 2012, 37, 7594–7599. [Google Scholar] [CrossRef]
  54. Zangmeister, C.D.; You, R.; Lunny, E.M.; Jacobson, A.E.; Okumura, M.; Zachariah, M.R.; Radney, J.G. Measured in-situ mass absorption spectra for nine forms of highly-absorbing carbonaceous aerosol. Carbon 2018, 136, 85–93. [Google Scholar] [CrossRef]
  55. Wei, G.; Yu, J.; Gu, M.; Tang, T.B. Dielectric relaxation and hopping conduction in reduced graphite oxide. J. Appl. Phys. 2016, 119, 224102. [Google Scholar] [CrossRef]
  56. Tuinstra, F.; Koenig, J.L. Raman spectrum of graphite. J. Chem. Phys. 1970, 53, 1126–1130. [Google Scholar] [CrossRef]
  57. Kudin, K.N.; Ozbas, B.; Schniepp, H.C.; Prud’Homme, R.K.; Aksay, I.A.; Car, R. Raman spectra of graphite oxide and functionalized graphene sheets. Nano Lett. 2008, 8, 36–41. [Google Scholar] [CrossRef] [PubMed]
  58. Ferrari, A.C.; Robertson, J. Interpretation of Raman spectra of disordered and amorphous carbon. Phys. Rev. B 2000, 61, 14095. [Google Scholar] [CrossRef]
  59. Fowler, J.D.; Allen, M.J.; Tung, V.C.; Yang, Y.; Kaner, R.B.; Weiller, B.H. Practical chemical sensors from chemically derived graphene. ACS Nano 2009, 3, 301–306. [Google Scholar] [CrossRef] [PubMed]
  60. Pei, S.; Cheng, H.-M. The reduction of graphene oxide. Carbon 2012, 50, 3210–3228. [Google Scholar] [CrossRef]
  61. Gelderman, K.; Lee, L.; Donne, S. Flat-band potential of a semiconductor: Using the Mott–Schottky equation. J. Chem. Educ. 2007, 84, 685. [Google Scholar] [CrossRef]
  62. Shen, Y.; Yang, S.; Zhou, P.; Sun, Q.; Wang, P.; Wan, L.; Li, J.; Chen, L.; Wang, X.; Ding, S. Evolution of the band-gap and optical properties of graphene oxide with controllable reduction level. Carbon 2013, 62, 157–164. [Google Scholar] [CrossRef]
  63. Tu, N.D.K.; Choi, J.; Park, C.R.; Kim, H. Remarkable conversion between n-and p-type reduced graphene oxide on varying the thermal annealing temperature. Chem. Mater. 2015, 27, 7362–7369. [Google Scholar] [CrossRef]
  64. Quan, W.; Hu, X.; Min, X.; Qiu, J.; Tian, R.; Ji, P.; Qin, W.; Wang, H.; Pan, T.; Cheng, S. A highly sensitive and selective ppb-level acetone sensor based on a Pt-doped 3D porous SnO2 hierarchical structure. Sensors 2020, 20, 1150. [Google Scholar] [CrossRef] [PubMed]
  65. Lin, T.; Lv, X.; Hu, Z.; Xu, A.; Feng, C. Semiconductor metal oxides as chemoresistive sensors for detecting volatile organic compounds. Sensors 2019, 19, 233. [Google Scholar] [CrossRef] [PubMed]
  66. Krivetsky, V.; Ponzoni, A.; Comini, E.; Rumyantseva, M.; Gaskov, A. Selective modified SnO2-based materials for gas sensors arrays. Procedia Chem. 2009, 1, 204–207. [Google Scholar] [CrossRef]
  67. Liu, B.; Chen, L.; Liu, G.; Abbas, A.N.; Fathi, M.; Zhou, C. High-performance chemical sensing using Schottky-contacted chemical vapor deposition grown monolayer MoS2 transistors. ACS Nano 2014, 8, 5304–5314. [Google Scholar] [CrossRef]
  68. Huang, Y.; Jiao, W.; Chu, Z.; Ding, G.; Yan, M.; Zhong, X.; Wang, R. Ultrasensitive room temperature ppb-level NO2 gas sensors based on SnS2/rGO nanohybrids with P–N transition and optoelectronic visible light enhancement performance. J. Mater. Chem. C 2019, 7, 8616–8625. [Google Scholar] [CrossRef]
Figure 1. (a) Height profile of typical GO flakes along the white line on the AFM image. (b) TEM image of the GO nanoflakes with a scale bar of 200 nm. (c) XRD pattern of the 2D GO flakes. (d) High-resolution TEM image with an SAED image of the GO sample inset. (e) EDS image of GO flakes demonstrating carbon and oxygen elements in reference to a dark field image.
Chemosensors 12 00108 g001
Figure 2. X-ray photoelectron spectroscopy C-1s (a) and O-1s (b) spectra of GO.
Chemosensors 12 00108 g002
Figure 3. (a) Raman spectra of ultra-thin GO. The graph shows the Raman intensity peaks at 1370 and 1593 cm−1, which are ascribed to the vibrational mode of A1g and E2g for the graphene oxide. (b) PL spectra. The main peaks of annealed GO are at 557 nm. (c) Tauc plots generated from UV–Vis–NIR absorption spectra indicate a band gap of 2.41 eV for graphene oxide, with the UV–Vis–NIR absorption spectra plot shown in the inset. (d) XPS valence band spectra depict the energy gaps between the Fermi level and valence band maximum for GO, which is shown in black with a 0.44 eV energy gap. (e) Mott–Schottky plots show the working potentials relative to Ag/AgCl, in reference to the Reversible Hydrogen Electrode (RHE), in which the flat-band potentials of GO were determined at 1.11 eV at a frequency of 1 k Hz. (f) Energy band structures of GO.
Chemosensors 12 00108 g003
Figure 4. The gas sensing performance of graphene oxide. (a) Dynamic sensing performance of GO flakes towards NO2 gas at concentrations ranging from 315 ppb to 1026 ppb in a dark environment at room temperature. (b) Response time and recovery time at a change of 90% of the full magnitude change of the gas response factor. (c) Measured crosstalk of graphene oxide sensor towards CH4, H2, CO2, and NO2 (1026 ppb). (d) Long-term stability test. (e) Repeatability. (f) Limit of detection (LOD) calculation based on four groups of experimental datasets, in which the detection limit of GO was estimated to be 1.43 ppb.
Chemosensors 12 00108 g004
Disclaimer/Publisher’s Note: The statements, opinions and data contained in all publications are solely those of the individual author(s) and contributor(s) and not of MDPI and/or the editor(s). MDPI and/or the editor(s) disclaim responsibility for any injury to people or property resulting from any ideas, methods, instructions or products referred to in the content.

