Article

All-Solid-State Potentiometric Sensor Based on Graphene Oxide as Ion-to-Electron Transducer for Nitrate Detection in Water Samples

by
Renato L. Gil
*,
Laura Rodriguez-Lorenzo
,
Begoña Espiña
and
Raquel B. Queirós
International Iberian Nanotechnology Laboratory, Avenida Mestre José Veiga, 4715-330 Braga, Portugal
*
Author to whom correspondence should be addressed.
Chemosensors 2024, 12(6), 86; https://doi.org/10.3390/chemosensors12060086
Submission received: 15 April 2024 / Revised: 11 May 2024 / Accepted: 20 May 2024 / Published: 22 May 2024

Abstract

:
Graphene oxide (GO) was used as an ion-to-electron transducer for all-solid-state nitrate electrodes based on an alkyl ammonium salt as the sensing element. Commercially available carbon screen-printed electrodes modified with GO were used as conductive substrates, whose morphology and distribution along the surface were evaluated by scanning electron microscopy and Raman spectroscopy. The potentiometric performance of the GO-based electrodes revealed a Nernstian slope of −53.5 ± 2.0 mV decade−1 (R2 = 0.9976 ± 0.0015) in the range from 3.0 × 10⁻⁶ to 10−2 M and a lower limit of detection of 1.9 × 10⁻⁶ M. An impressive reproducibility between equally prepared electrodes (n = 15) was demonstrated by a variation of <6% for the calibration parameters. Constant current chronopotentiometry and water layer tests were used to evaluate the potential signal stability, providing similar performance to previously published works with graphene-based ion-selective electrodes. Notably, the GO-based sensors showed the absence of a water layer, a long-term drift of 0.3 mV h−1, and a stable performance (LOD and sensitivity) over 3 months. The applicability of the proposed sensors was demonstrated in determining nitrate levels in water samples with great accuracy, yielding recovery values from 87.8 to 107.9%, and comparable (p > 0.05) results to a commercial nitrate probe. These findings demonstrate the use of GO as an alternative ion-to-electron transducer for the fabrication of all-solid-state potentiometric electrodes.

Graphical Abstract

1. Introduction

Nitrate ions (NO3) are primary compounds involved in the biogeochemical nitrogen (N) cycle that occurs in natural ecosystems like soils and aquatic environments [1]. However, the development of modern agriculture has expanded the use of inorganic fertilizers, increasing the levels of NO3 in surface and groundwater resources [2]. This contamination causes disturbances in the ecological N cycle, and excessive nutrient concentration in aquatic systems leads to uncontrolled algae growth, resulting in oxygen depletion and poor water quality [3]. This phenomenon, known as eutrophication, has negative consequences for biodiversity, fisheries, and recreational activities. On the other hand, the presence of NO3 in natural waters at levels higher than 50 mg L−1, which is the guideline value defined by the European Union (EU) [4], makes them inappropriate for consumption. Their ingestion may cause severe adverse effects on human health, including reproductive problems, methemoglobinemia, colorectal cancer, and thyroid disease [5,6]. NO3 content is thus a critical water quality indicator, and its monitoring is crucial for water ecosystem preservation, aquaculture system efficiency, and human safety.
Current standard analytical methodologies for determining NO3 are based on liquid chromatography, capillary electrophoresis, or spectrophotometry [7,8]. However, these methods require expensive instrumentation and laborious sample pre-treatment, increasing the time and cost per analysis. Electrochemical sensors are an exciting approach to overcoming these issues, particularly potentiometric ion-selective electrodes (ISEs), due to their simplicity of use, cost-effectivity, wide linear analytical range, short response time, and applicability in turbid samples [9,10,11,12]. Despite their successful use since the 1970s [13,14,15], the presence of an internal filling solution limited their application in decentralized measurements due to high maintenance and complications with miniaturization. These early ISEs evolved into all-solid-state ISEs by replacing the inner liquid solution with a solid substrate between the ion-selective membrane (ISM) and the conductive wire, paving the way for miniaturization and incorporation into portable platforms [11,16]. However, the lack of a thermodynamically well-defined electrochemical interface and/or the formation of a thin water layer between the ISM and the inner electron conductive substrate results in potential drift and poor reproducibility, restricting their long-term application [17,18,19]. These issues have led to significant research into ion-to-electron transducers that have been incorporated directly into the ISM or introduced as intermediate layers between the ISM and the conductive substrate [20,21].
Among the available materials, conducting polymers (CPs) have widespread popularity as they are inexpensive, possess good electrical properties, and their conductivity can be readily tuned via structural modifications or doping with ions [22]. Poly(3-octylthiophene), polypyrrole, and polyaniline are the most representative examples [23,24,25]. However, they are usually vulnerable to light, redox species, CO2, and O2, and their hydrophilicity is prone to generating a water layer, which may result in a potential drift [16,26]. On the other hand, poly(3,4-ethylenedioxythiophene) (PEDOT) is insensitive to light, oxidation, and pH [27], but it has been formed onto the electrode’s surface by electropolymerization, which is a tedious fabrication process compared to the easy and scalable process of drop-casting [28]. Despite the unquestionable benefits of CPs’ application as transducers, the field is open for other materials to ensure stable potential readings of all-solid-state potentiometric sensors.
A new generation of solid-contact transducers has recently emerged based on the use of nanostructured materials [29], such as carbon nanotubes [26], macroporous carbon [30], gold nanoparticles [31], and graphene [32]. Their inherent advantages, such as insensitivity to redox species, light, and hydrophobicity, are crucial characteristics for in situ measurements [33]. While carbon nanotubes [26,34] and reduced graphene oxide [35,36,37] have been investigated as solid-contact transducer materials in NO3 potentiometric sensors, graphene oxide (GO) in its native form has not been reported yet. The insulating properties and relative hydrophilicity [38] open up the question of a possible effect on the potential stability and electrochemical parameters of all-solid-state sensors. Nevertheless, GO can be an attractive material for application as a transducer in potentiometric sensors due to an additional pseudo-capacitance effect of attached oxygen-containing functional groups compared with graphene [39]. Moreover, the potentialities of GO increase if the functional groups can exchange ions in the ISM, as already demonstrated for CPs [23], carbon nanotubes [40], and carboxy-functionalized graphene [41].
Herein, this work presents an all-solid-state NO3–ISE based on GO as an ion-to-electron transducer and a plasticized membrane based on a quaternary ammonium salt as a sensing material. Commercially available carbon screen-printed electrodes (CSPE) modified with GO were used as conductive substrates. The analytical performance and electrochemical properties were compared with those obtained from the CSPE modified only with the sensing membrane. The proposed sensors were used to determine NO3 in drinking and groundwater samples.

2. Materials and Methods

2.1. Chemicals and Solutions

All chemicals were of analytical reagent grade and were purchased from Sigma-Aldrich (Portugal): sodium nitrate (NaNO3, ref. S5506), sodium nitrite (NaNO2, ref. S2252), sodium chloride (NaCl, ref. S9625), sodium carbonate (Na2CO3, ref. 223530), sodium sulfate (Na2SO4, ref. 239313), disodium hydrogen phosphate (Na2HPO4, ref. S9763), sodium dihydrogen phosphate (NaH2PO4, ref. 71505), sodium bromide (NaBr, ref. 220345), sodium iodide (NaI, ref. 217638), sodium perchlorate (NaClO4, ref. 310514), sodium hydroxide (NaOH, ref. S5881 71690), and phosphoric acid (H3PO4, ref. W290017). The materials to prepare the ISMs were of Selectophore grade, namely tetradodecylammonium nitrate (TDDA-NO3, ref. 87252), bis(2-ethylhexyl)sebacate (DOS, ref. 84818), poly (vinyl chloride) (PVC, ref. 81395), and tetrahydrofuran (THF, ref. 87369).
All solutions were prepared by dissolving the appropriate salts in 18.2 MΩ cm−1 double-deionized water (Milli-Q water systems, Merck Millipore, Algés, Portugal). The stock standard solution of NO3 was prepared at a concentration level of 1 M and stored at room temperature. The calibration working solutions were prepared by dilution to the final concentration of 10−3 and 10−1 M. The influence of pH on sensor response was investigated by adjusting the pH value with concentrated H3PO4 or NaOH (measured with a SevenCompact™ S210 pH Meter, Metter Toledo, Cornellà de Llobregat, Barcelona, Spain).

2.2. Preparation of All-Solid-State NO3–ISEs

The all-solid-state ISEs were based on commercially available carbon screen-printed electrodes (CSPE, ref. DRP-110) and CSPE modified with graphene oxide (CSPE/GO, ref. 110GPHOX), which were purchased from Metrohm Dropsens (Gomensoro Potencial Zero, Lisbon, Portugal).
The ISM for the NO3 was prepared by dissolving 4.0 wt% TDDA-NO3, 31.0 wt% PVC, and 65.0 wt% DOS in 3 mL THF (total mass of 300 mg). The ISM cocktail was drop-casted (4 × 5 µL) onto the conductive surface relative to the working electrode (CSPE/GO/ISM). Each layer was allowed to dry for 10 min at room temperature for THF evaporation. For comparison, all-solid-state ISEs without GO were also prepared by coating the bare CSPE with the ISM directly on the carbon working area (CSPE/ISM). Finally, all electrodes were conditioned overnight in 10−3 M NaNO3 solution before the measurements (~12 h). When not in use, they were stored dry at room temperature and protected from the light. Five identical electrodes were prepared and examined for each type of sensor configuration. Ten additional electrodes of the CSPE/GO/ISM configuration were prepared for a critical assessment of the reproducibility between electrodes.

2.3. Characterization of GO Solid-Contact

Raman spectroscopy was performed using an Alpha 300R Access Witec miniconfocal Raman microscope (WITec, Ulm, Germany). The Raman spectra were acquired in six locations on the bare CSPE and CSPE/GO for 0.5 s and 20 accumulations using a 633 nm excitation laser line, 300 line mm−1 grating, and a 20x objective. Raman spectra were processed by correcting the baseline and cosmic ray removal as well as obtaining the average spectrum from 3 to 6 single spectra using WITec Project 5.2 software and Spectragryph v1.2.16.1 software.
Scanning electron microscopy (SEM) analysis was performed on the bare CSPE and CSPE/GO using a FEI Quanta 650 FEG field emission microscope and an accelerating voltage of 10 kV. Energy-dispersive X-ray spectroscopy (EDX) was also executed to generate information about the chemical composition of the electrode’s surface.
Electrochemical characterization was carried out by cyclic voltammetry (CV) using an EmStat4S potentiostat connected to a computer equipped with PSTrace software 5.9 version (PalmSens BV, Houten, The Netherlands). The measurements were performed in a solution of 5 × 10⁻³ M ferro/ferricyanide prepared in 10−2 M PBS using a three-electrode electrochemical cell composed of a single junction Ag/AgCl/KCl 3 M (MF-2056, BASI Inc., West Lafayette, IN, USA) as a reference electrode, a platinum wire (MW-1032, BASI Inc., USA) as an auxiliary electrode, and bare CSPE or CSPE/GO as a working electrode. CV cycles were recorded between −0.5 and +0.5 V at a scan rate of 100 mV s−1. All experiments were performed at a controlled room temperature (20 ± 1 °C).

2.4. Evaluation of All-Solid-State NO3–ISEs

The potentiometric measurements were performed using the EmStat4S potentiostat (PalmSens BV, Houten, The Netherlands) at a controlled room temperature (20 ± 1 °C). PS Trace software 5.9 version was also used for data acquisition and visualization. The electromotive force (EMF) was measured in stirred solutions (every 1 s) by the potential difference between the all-solid-state NO3–ISEs and the Ag/AgCl/KCl 3 M reference electrode. The former was connected to the potentiostat using a flexible cable (ref. CAC) acquired from Metrohom Dropsens (Gomensoro Potencial Zero, Algés, Portugal). Dynamic calibration curves were constructed for NO3 in the ion concentration range from 10−7 to 10−2 M. Activity coefficients were calculated using the Debye–Hückel approximation to transform experimental concentrations into activities [42]. The measured EMF at the steady state was plotted against each logarithmic activity to determine the sensitivity (slope), intercept (standard potential, E0), and linear range of response (LRR). The lower limit of detection (LOD) was calculated as the activity related to the cross point between extrapolation of the lines defining the non-responsive range and LLR of the electrode [43]. All the calibrations were carried out in triplicate (i.e., three subsequent calibrations using the same electrode).
The response time was determined as the time that elapses between the instant when the activity of the target ions is changed and the first instant when the ∆ E /∆t becomes equal to 1.0 mV min−1 [43]. The potentiometric selectivity coefficients were evaluated using the fixed interference method (FIM) at two interfering concentration levels (10−4 and 10−2 M) [44]. The reversibility was evaluated by switching the NO3 concentration between 10−4 and 10−3 M and performing calibration curves from higher to lower concentrations and vice versa. The influence of pH on the potentiometric response was investigated at 10−3 M NaNO3 solution by measuring the EMF after changing the pH value from 2 to 11 with the addition of concentrated H3PO4 or NaOH.
The formation of a water layer between the ISM and the underneath conductive substrate was carried out on both CSPE/ISM and CSPE/GO/ISM configurations [19], which were previously conditioned overnight (~12 h) in 10−1 M NaNO3 solution. The EMF was firstly measured in 10−1 M NaNO3 solution for 2 h, then in 10−1 M NaCl solution for 2 h, and finally in 10−1 M NaNO3 solution for 16 h (i.e., long-term drift). The potential stability was also evaluated by changes in the general analytical parameters after the repetitive calibration for 12 weeks.
The capacitance of the all-solid-state-ISEs was evaluated along with the short-term potential stability by reversed-current chronopotentiometry in a 10−1 M NaNO3 solution using phosphate buffer as the electrolyte (10−1 M and pH 5.0) [45]. A constant current of +1 nA was applied on the working electrode for 60 s, followed by −1 nA current for another 60 s, while the EMF was continuously recorded. The resistance in charge transfer was studied in the same NaNO3 solution by EIS in the frequency range from 0.1 Hz to 100 kHz with a potential amplitude of 10 mV at the open-circuit potential. All impedance spectra were fitted to equivalent electrical circuits using PSTrace software 5.9. The same EmStat4S potentiostat, together with the Ag/AgCl/KCl 3 M reference electrode and the platinum wire as an auxiliary electrode, were used for these measurements.

2.5. Water Samples Analysis

The determination of NO3 content was carried out in different water samples: three groundwater samples were collected from different wells located in the North of Portugal, one tap water sample was collected directly from our research institution, and commercial water was purchased in a local supermarket. The NO3 concentrations were measured as soon as collected (on the same day). The well water samples were filtered through 0.45 μm pore size filters coupled to syringes before the analysis, while the others were directly tested. The CSPE/GO/ISM sensors were calibrated in a 10−1 M phosphate buffer to ensure an adequate performance. After calibrating, the EMF was measured in each sample three times and interpolated in the previous calibration plots.
A commercial NO3–ISE inner filling solution (perfectIONTM, ref. 51344727) connected to a pH/Ion meter S220 (SevenCompactTM, ref. 30019028) from Metter-Toledo was used as a comparative instrument. The measurements followed the manufacturer’s recommendations for proper functioning and ion determination.

3. Results and Discussion

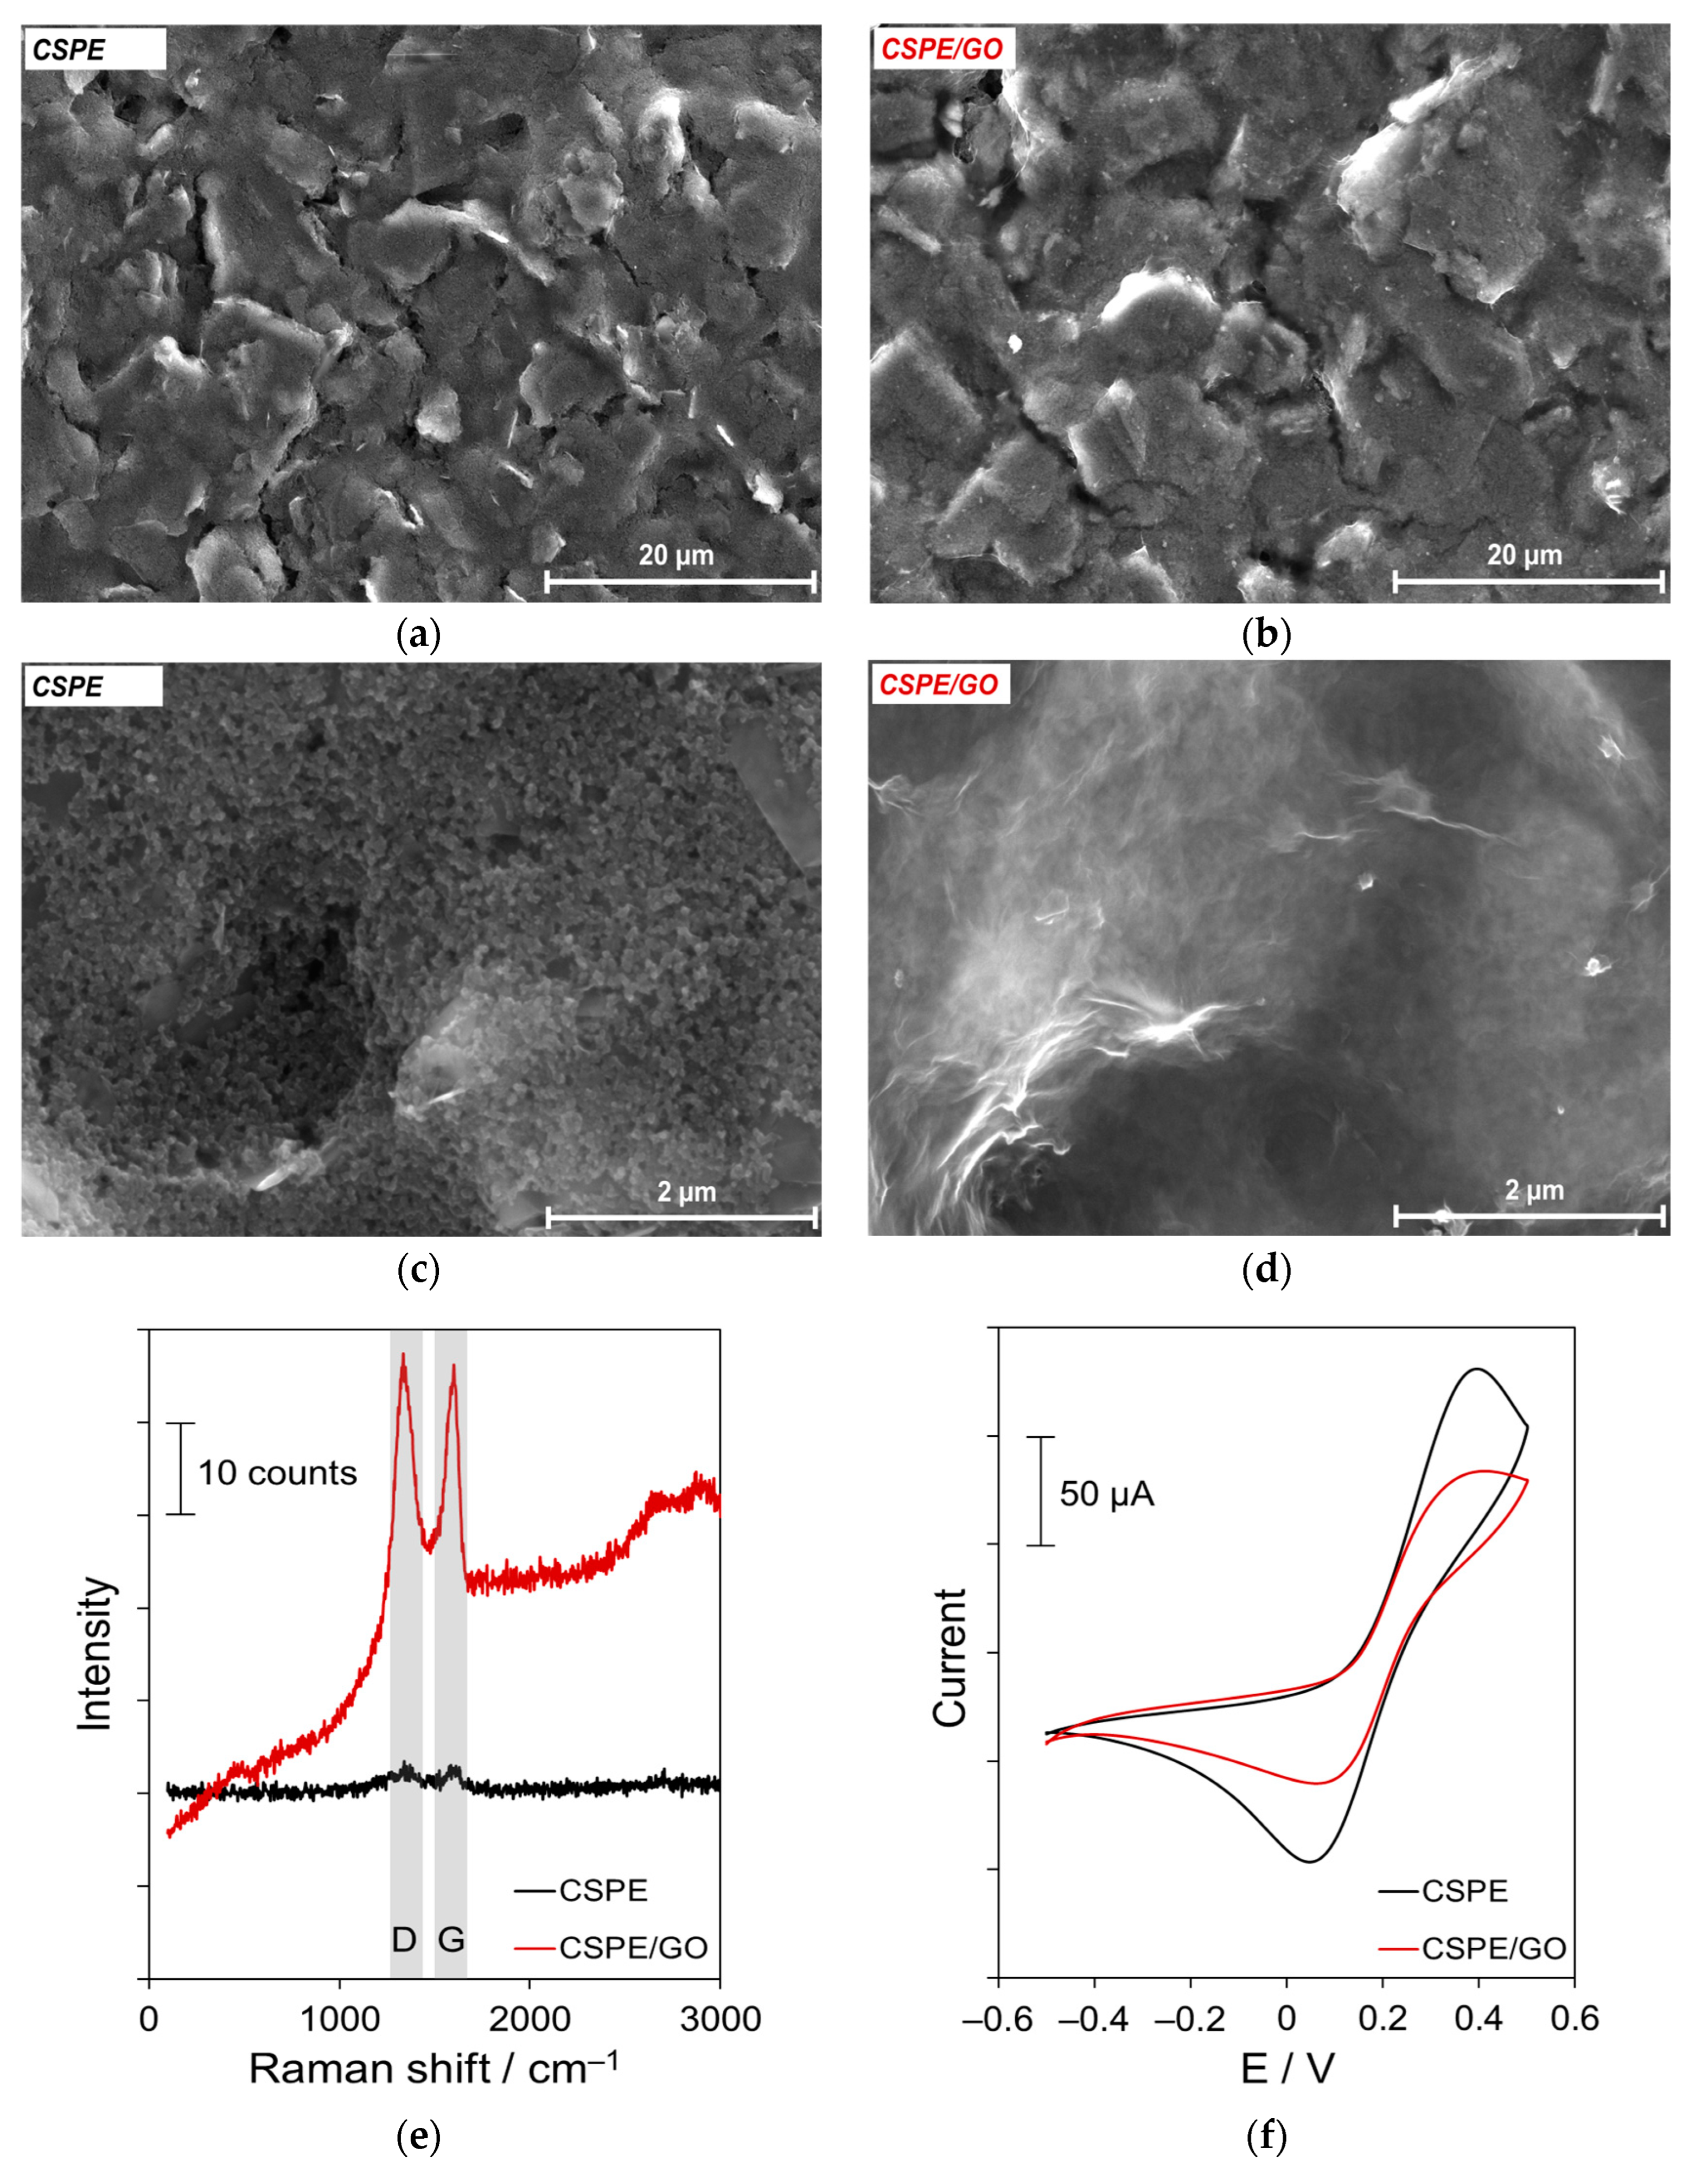
3.1. Characterization of GO Layer

The surface morphology of the CSPE and CSPE/GO bare electrodes was characterized by SEM observation. As shown in Figure 1a, the surface of the bare CSPE is porous and displays a typical sheet layer structure. In comparison, small particles and fewer sheet-like structures are observed on the CSPE/GO (Figure 1b). Notably, a clear change was observed at the 50,000x magnification, in which the granular appearance on the CSPE (Figure 1c) highly contrasts with the smoother build-up of thin sheets on the CSPE/GO electrode (Figure 1d). Additionally, the EDX analysis revealed the presence of oxygen and carbon atoms in the CSPE/GO electrode, typical of the GO material, while only carbon atoms were found in the bare CSPE (Figure S1).
Raman analysis was performed to evaluate the presence and distribution of GO on the surface in comparison with the bare CSPE. The Raman spectra of the CSPE/GO displayed prominent D and G bands, which are typical of graphitic materials [46], in contrast with the CSPE based only on amorphous carbon (Figure 1e). These bands arise from graphene lattice defect sites (D band) and in-plane vibrations of sp2-carbon atoms (G band) [47]. The D band at 1332 cm−1, with comparable intensity to the G band at 1595 cm−1, indicates significant structural disorders in the electrode surface due to oxygen functional groups typical of GO. The intensity ratio of the D and G bands (ID/IG) was calculated as 1.00 ± 0.03, close to those reported by other authors [46,48]. Notably, the Raman results were similar over different sampling locations (Table S1), proving the distribution of GO along the surface.
The electrochemical characterization of the GO layer was performed through cyclic voltammetry (CV) in a 5 × 10⁻³ M ferro/ferricyanide solution. The cyclic voltammograms presented in Figure 1f show a decrease in oxidation–reduction current peaks in CSPE/GO, which is related to the insulating properties of GO, already reported by other authors [38]. This translates into a lower electroactive surface area, calculated from the Randles–Sevcik equation [49], for the CSPE/GO (0.08 ± 0.01 cm2) in comparison with the bare CSPE (0.12 ± 0.01 cm2). Nevertheless, the key aim of this work is to assess the applicability of GO, in its native form, as a new ion-to-electron transducer and an alternative material for the preparation of stable and robust all-solid-state potentiometric ISEs.

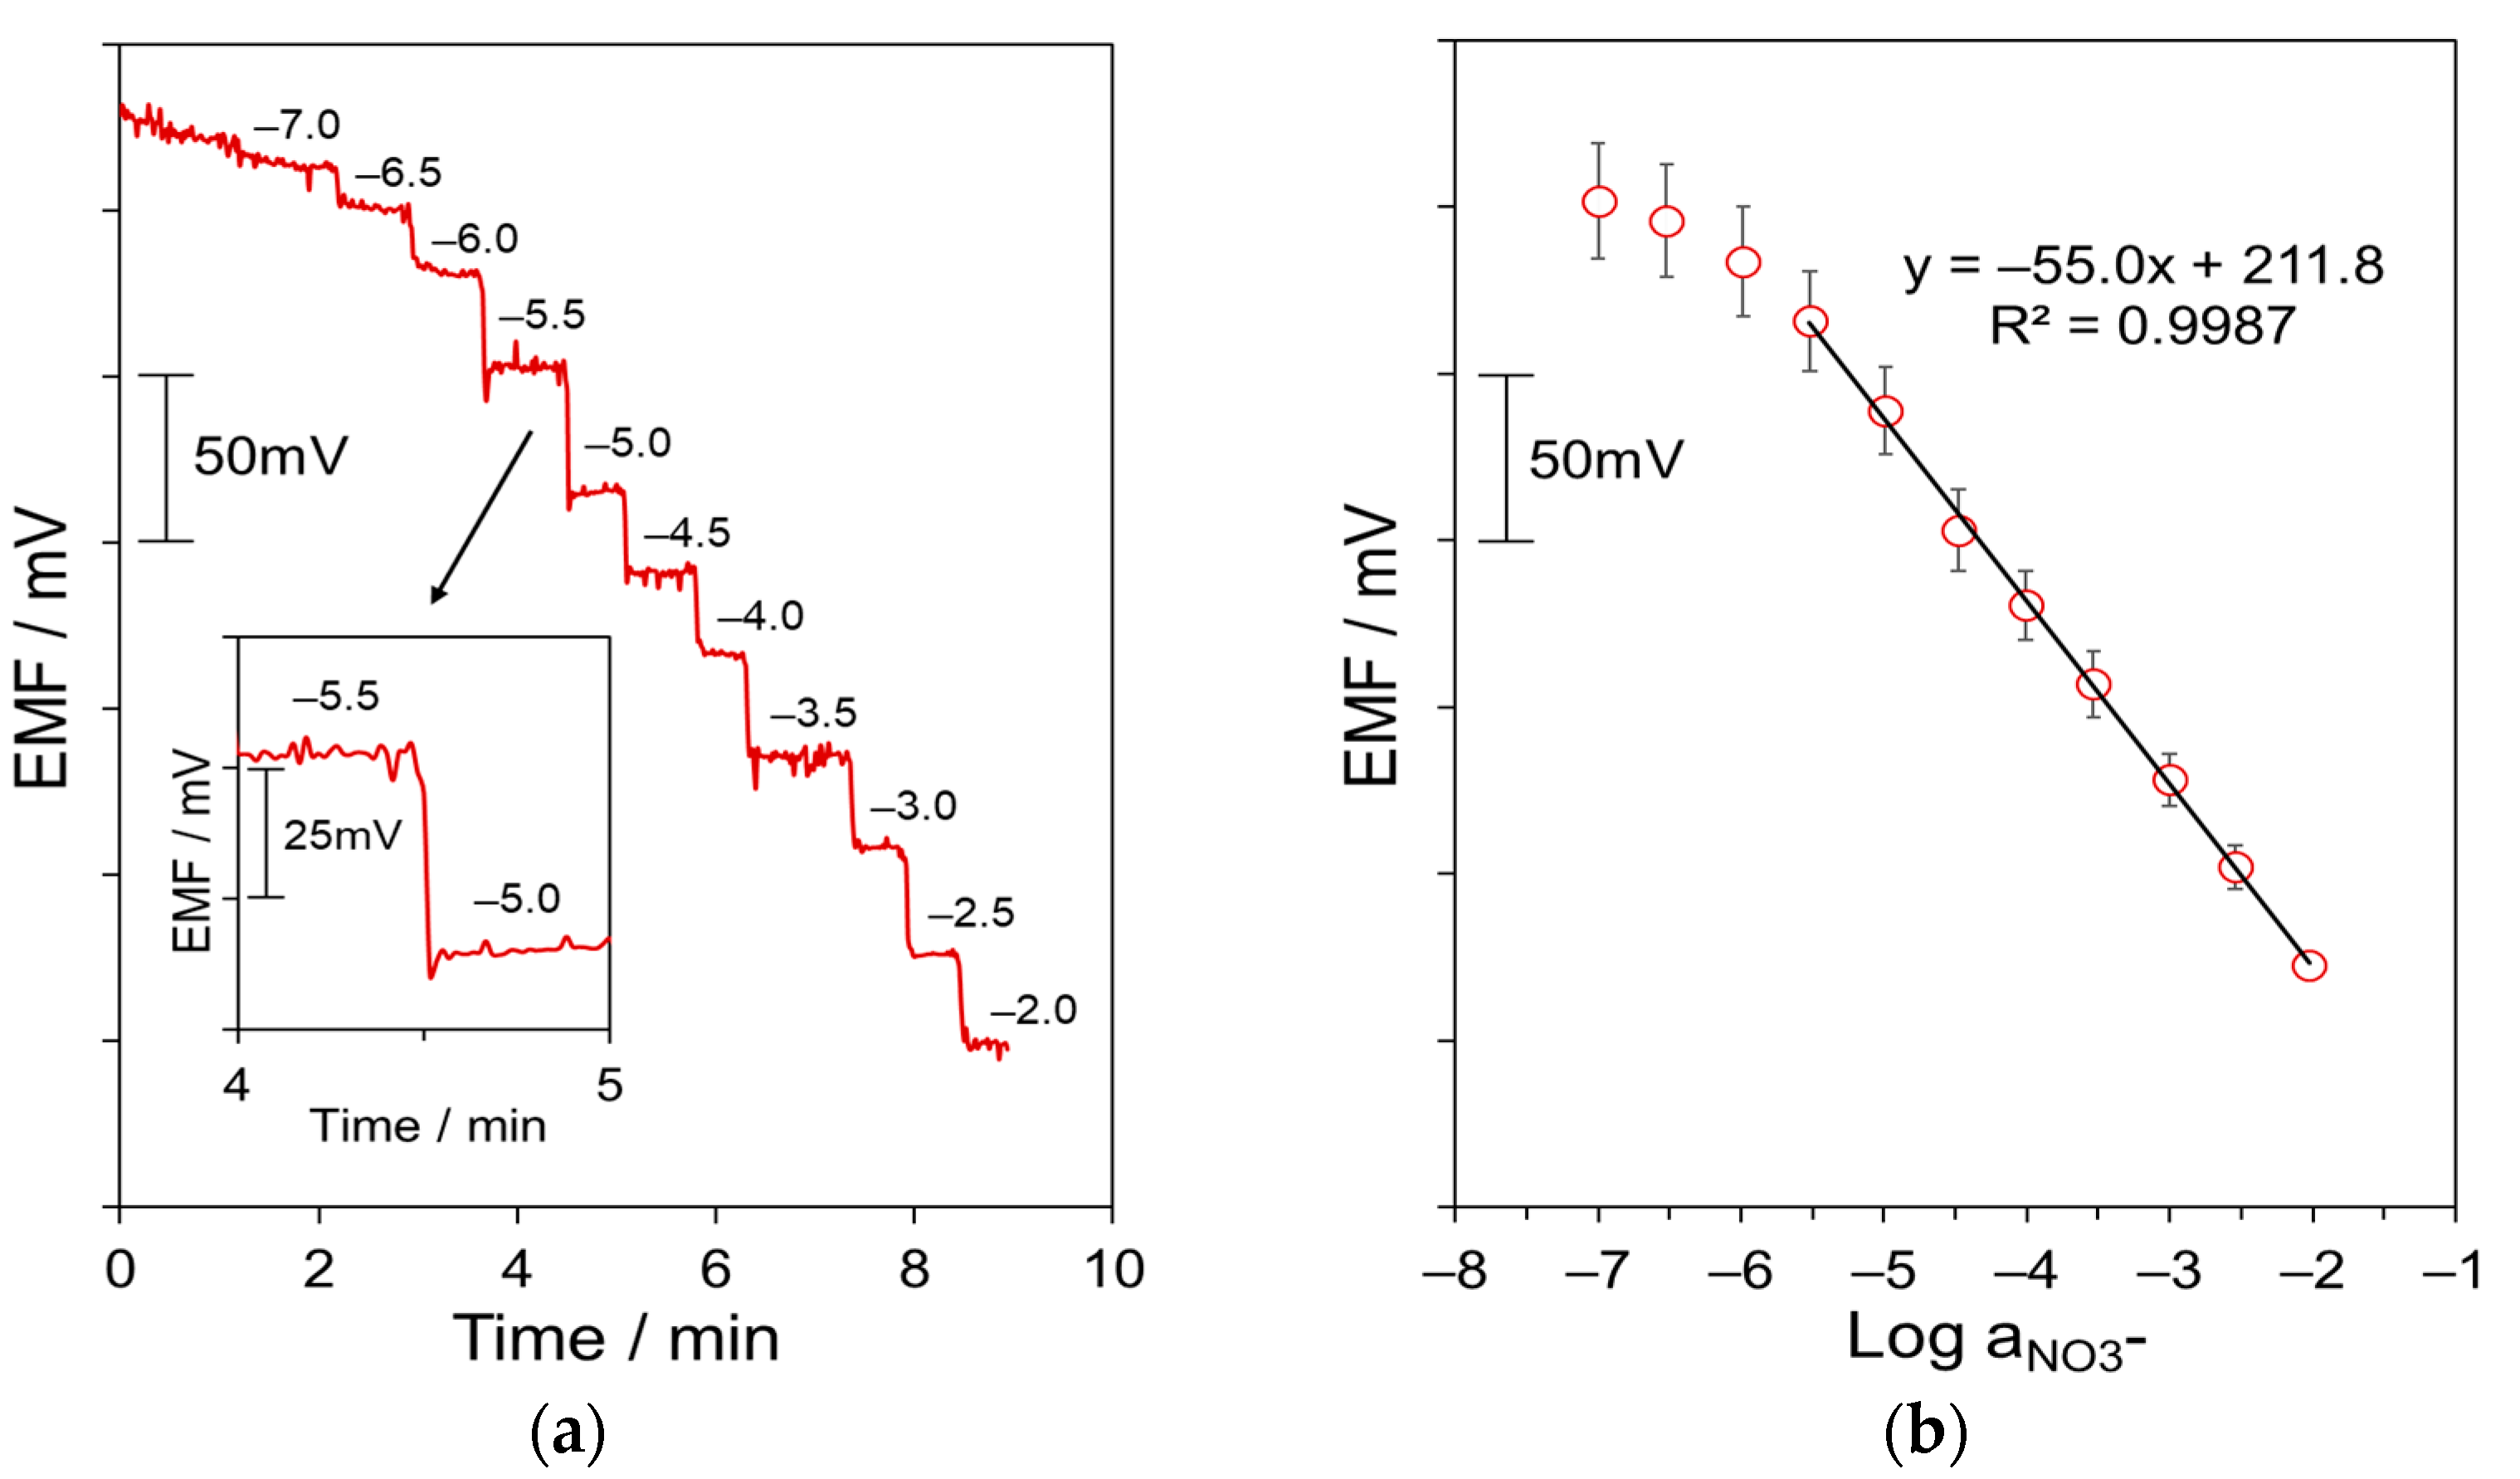
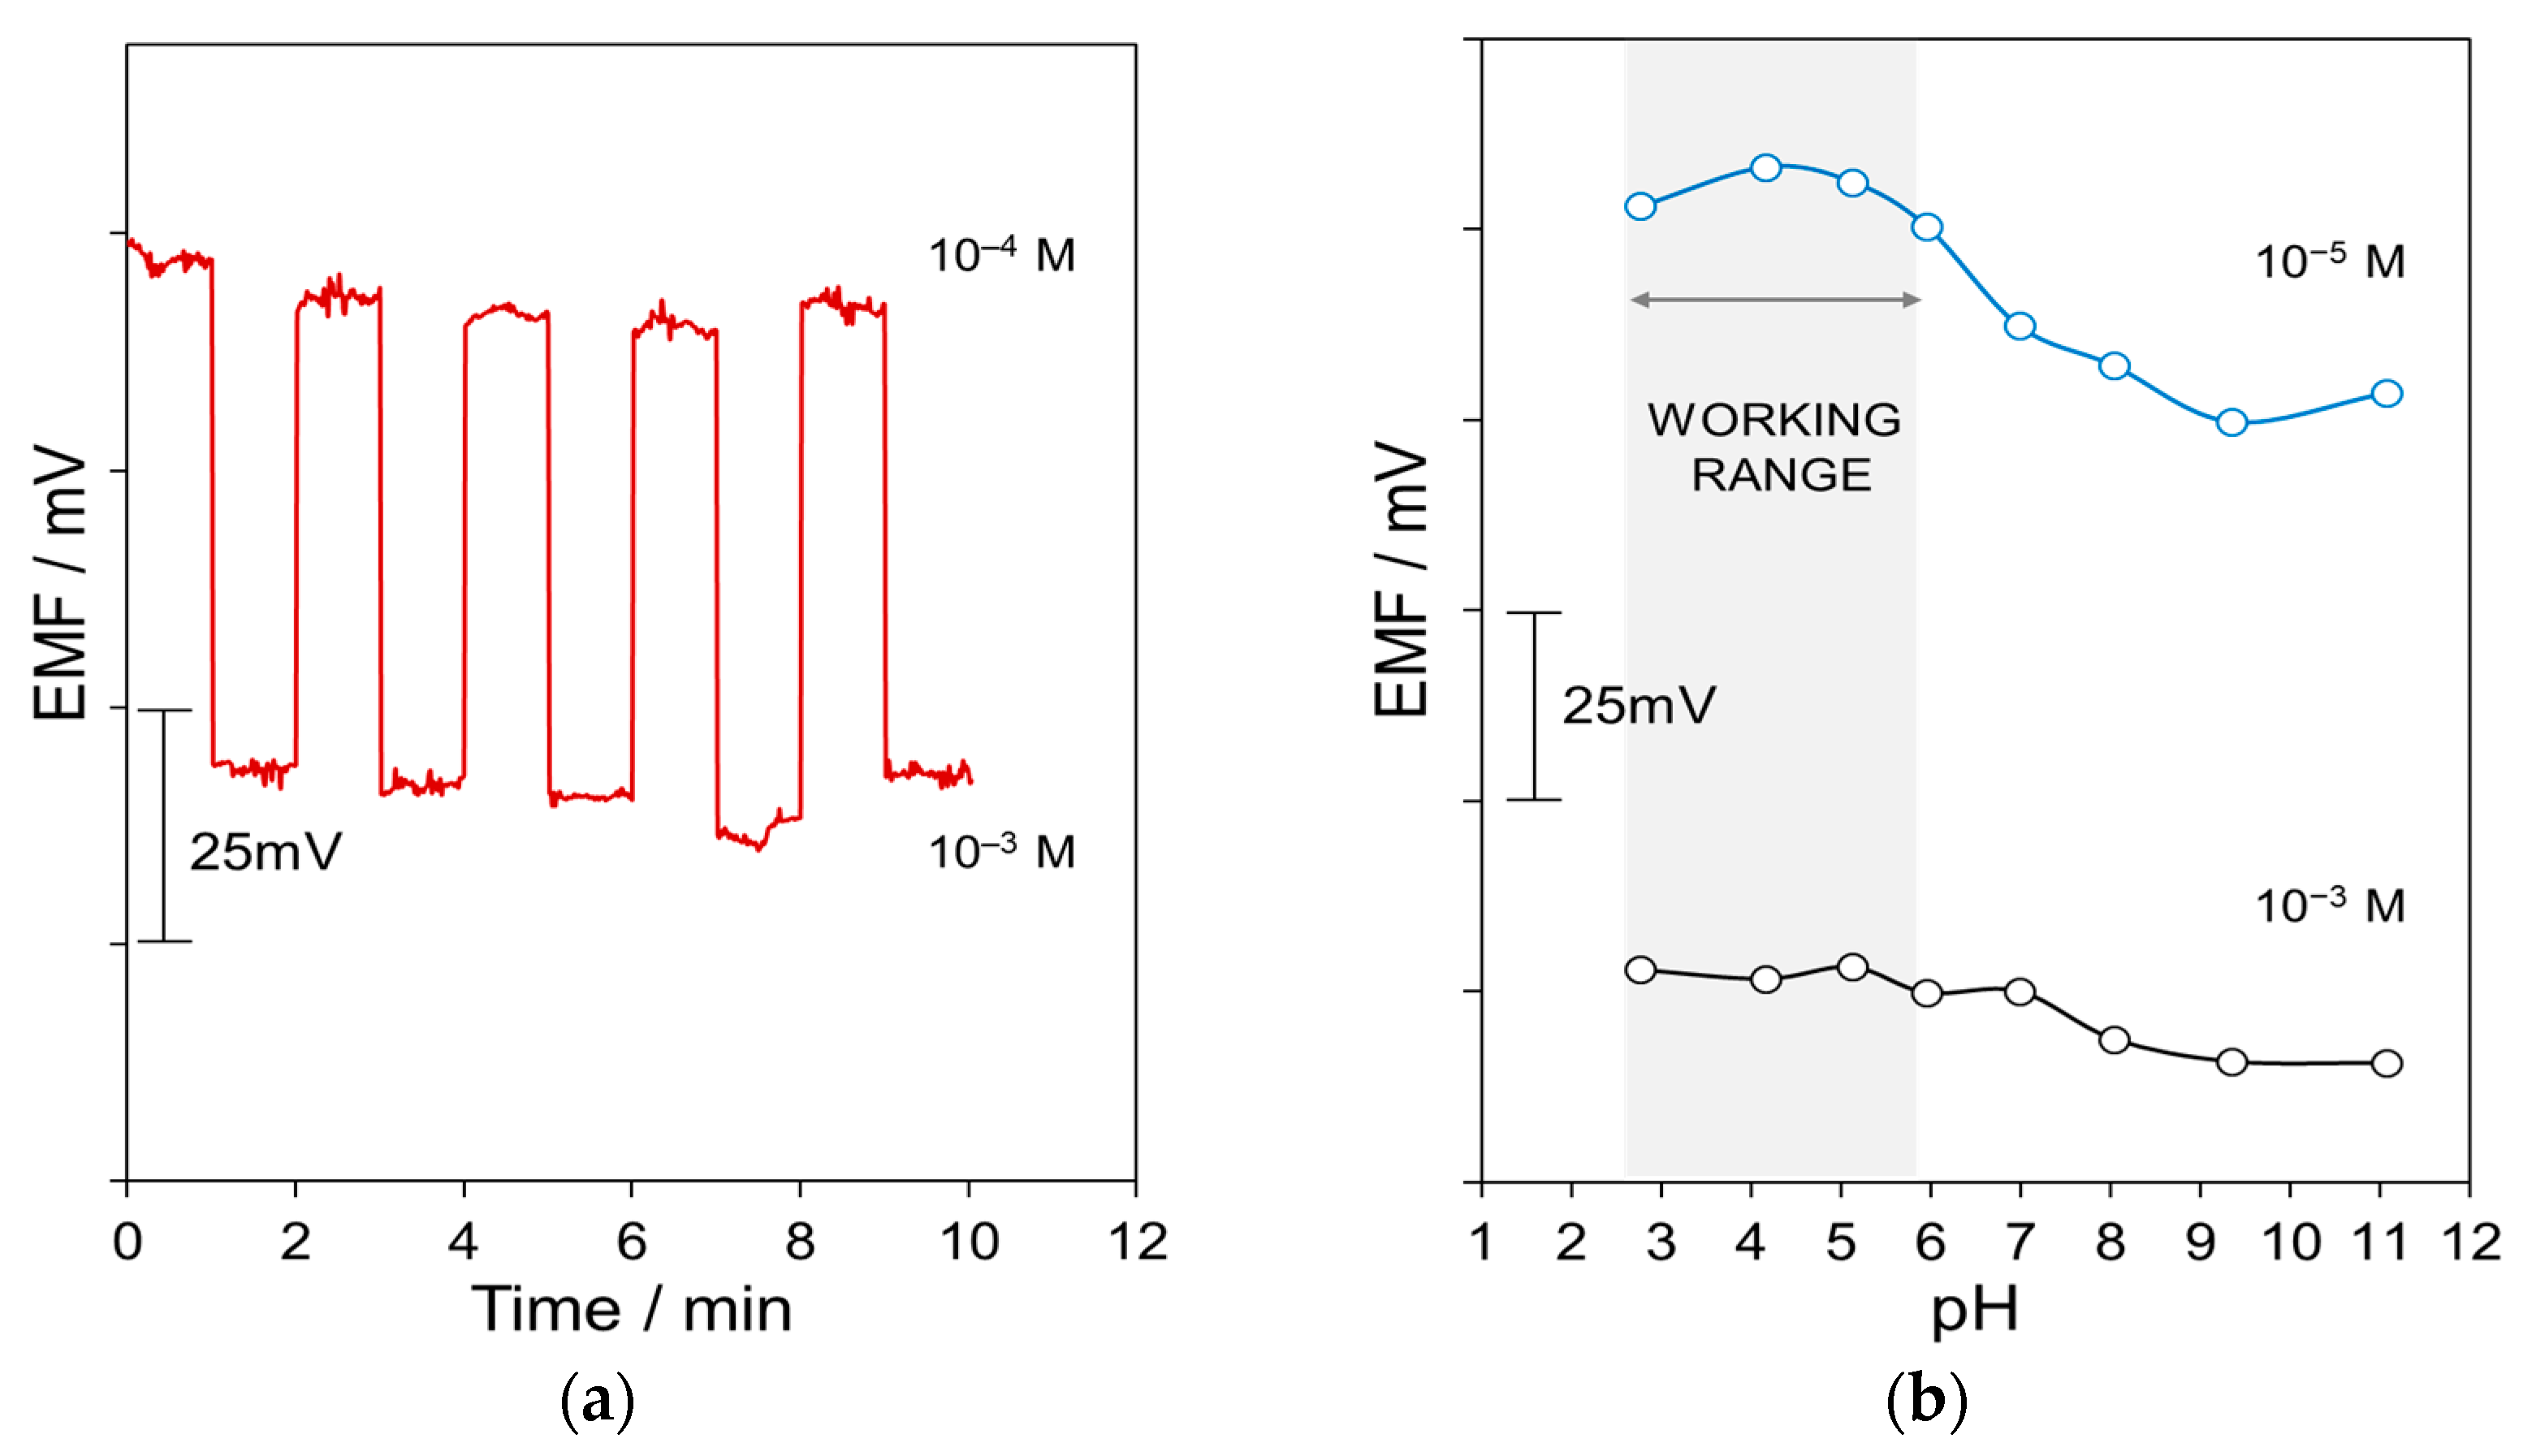
3.2. Potentiometric Response of GO-Based All-Solid-State NO3–ISEs

The analytical performance of the CSPE/GO/ISM sensors was evaluated under steady-state conditions against a commercial Ag/AgCl reference electrode. The dynamic potentiometric response was recorded by the progressive addition of different amounts of NO3 within the concentration range from 10−7 to 10−2 (Figure 2a). The EMF at the steady state was plotted against the corresponding logarithmic activity, revealing Nernstian behavior (Figure 2b). The slope calculated from the calibration plots (n = 15 from three calibrations on five identical electrodes) was −53.5 ± 2.0 mV decade−1 (R2 = 0.9976 ± 0.0015) over the linear range of response (LRR) from 3.0 × 10⁻⁶ to 10−2 M, with coefficients of variation (CV) < 3.8% for the calibration parameters. The lower limit of detection (LOD) was 1.9 × 10⁻⁶ M [43]. Notably, the great repeatability of the potentiometric response, assessed by subsequent calibrations of the same electrode, was demonstrated by a variation <5.8% for the slope and the intercept (Table S2). Additionally, the calibration parameters were found to be impressively reproducible for equally prepared electrodes (slope of −52.3 ± 1.5 mV decade−1 and intercept of 223.9 ± 12.1 mV, n = 15 from one calibration on fifteen sensor units), with CV < 5.4% (Table S3). Analogous analytical parameters (Table 1), but with a slight shift in the E0, were achieved with the CSPE/ISM sensors: the slope of −55.4 ± 5.0 mV dec−1, LRR from 3.0 × 10⁻⁶ to 10−2 M, and LOD of 2.2 × 10⁻⁶ M (n = 15 from three calibrations on five identical electrodes).
The response time ranged between 10 and 20 s for changes at high (10−3 M) and low (10−5.5 M) NO3 concentrations, respectively (inset of Figure 2a). The proposed CSPE/GO/ISM sensors exhibited enhanced potential reversibility (Figure 3a) when conducting the repetitive cycles between 10−4 and 10−3 M NaNO3 solutions (standard deviation of 2.5 and 2.8 mV for the lower and high concentrations, respectively). Additionally, the reversibility was evaluated by performing calibration curves from low to high NO3 concentrations and vice versa (Figure S2). A very reproducible response was evidenced by the standard deviation of 0.3 mV and 1.0 mV for slope and intercept, respectively.
The influence of pH on the potentiometric response was evaluated at two concentration levels of NO3 (Figure 3b). A stable response (i.e., EMF variation lower than ±5 mV) was obtained over the wide pH range from 3 to 11 at 10−3 M NaNO3 solution, which is equivalent to the guideline value for groundwater and drinking water in Europe (50 mg L−1 [4]). Nevertheless, at the lower concentration (10−5 M NaNO3), a slight decrease in the EMF was observed when the pH values increased over six units, which may worsen the LOD of the proposed sensors. Therefore, the working pH range was defined as optimal between 3 and 6 units to reach the detection of low levels of NO3.
All potentiometric characteristics for the investigated all-solid-state-ISEs are summarized in Table 1. Since the slope and lower detection limit are mainly defined by ISM composition, comparable analytical performance was observed. Notably, an improved reproducibility for the intercept value was found for the CSPE/GO/ISM sensors, proving the great impact of the GO layer as an ion-to-electron transducer.
The potentiometric selectivity coefficients ( K N O 3 , X P o t ) of the all-solid-state NO3–ISEs were determined by the fixed interference method (FIM), following the equation (Equation (1)):
K N O 3 , X P o t = a N O 3 a X z N O 3 z X ,
where a N O 3 and a X are the activities of the primary (NO3) and interfering ion ( X ), respectively, and z are the respective charge numbers [44]. The ion concentration of X remained constant (10−4 and 10−2 M), while the NO3 concentration varied from 10−7 to 10−2 M (Figure S3). The K N O 3 , X P o t values summarized in Table 2 demonstrate a selectivity behavior governed by the ion lipophilicity, which is typical for potentiometric sensors based exclusively on an ion exchanger immobilized in a plasticized PVC membrane [50]. Therefore, the selectivity followed the Hofmeister series [51], exhibiting minimal response to CO32−, SO42−, and HPO42− and enhanced response to I and ClO4. Even when the concentration of the interfering ions decreased to 10−4 M, these last two anions showed substantial interference (Figure S4 and Table 2). Nevertheless, the selectivity coefficients were similar to the ones reported for a similar ISM composition, either in electrodes with an inner liquid configuration [52,53] or with different solid-contact transducers [37,54]. This indicates that the selectivity of the studied sensors is a function of the ISM composition rather than the nature of the inner transducing element.

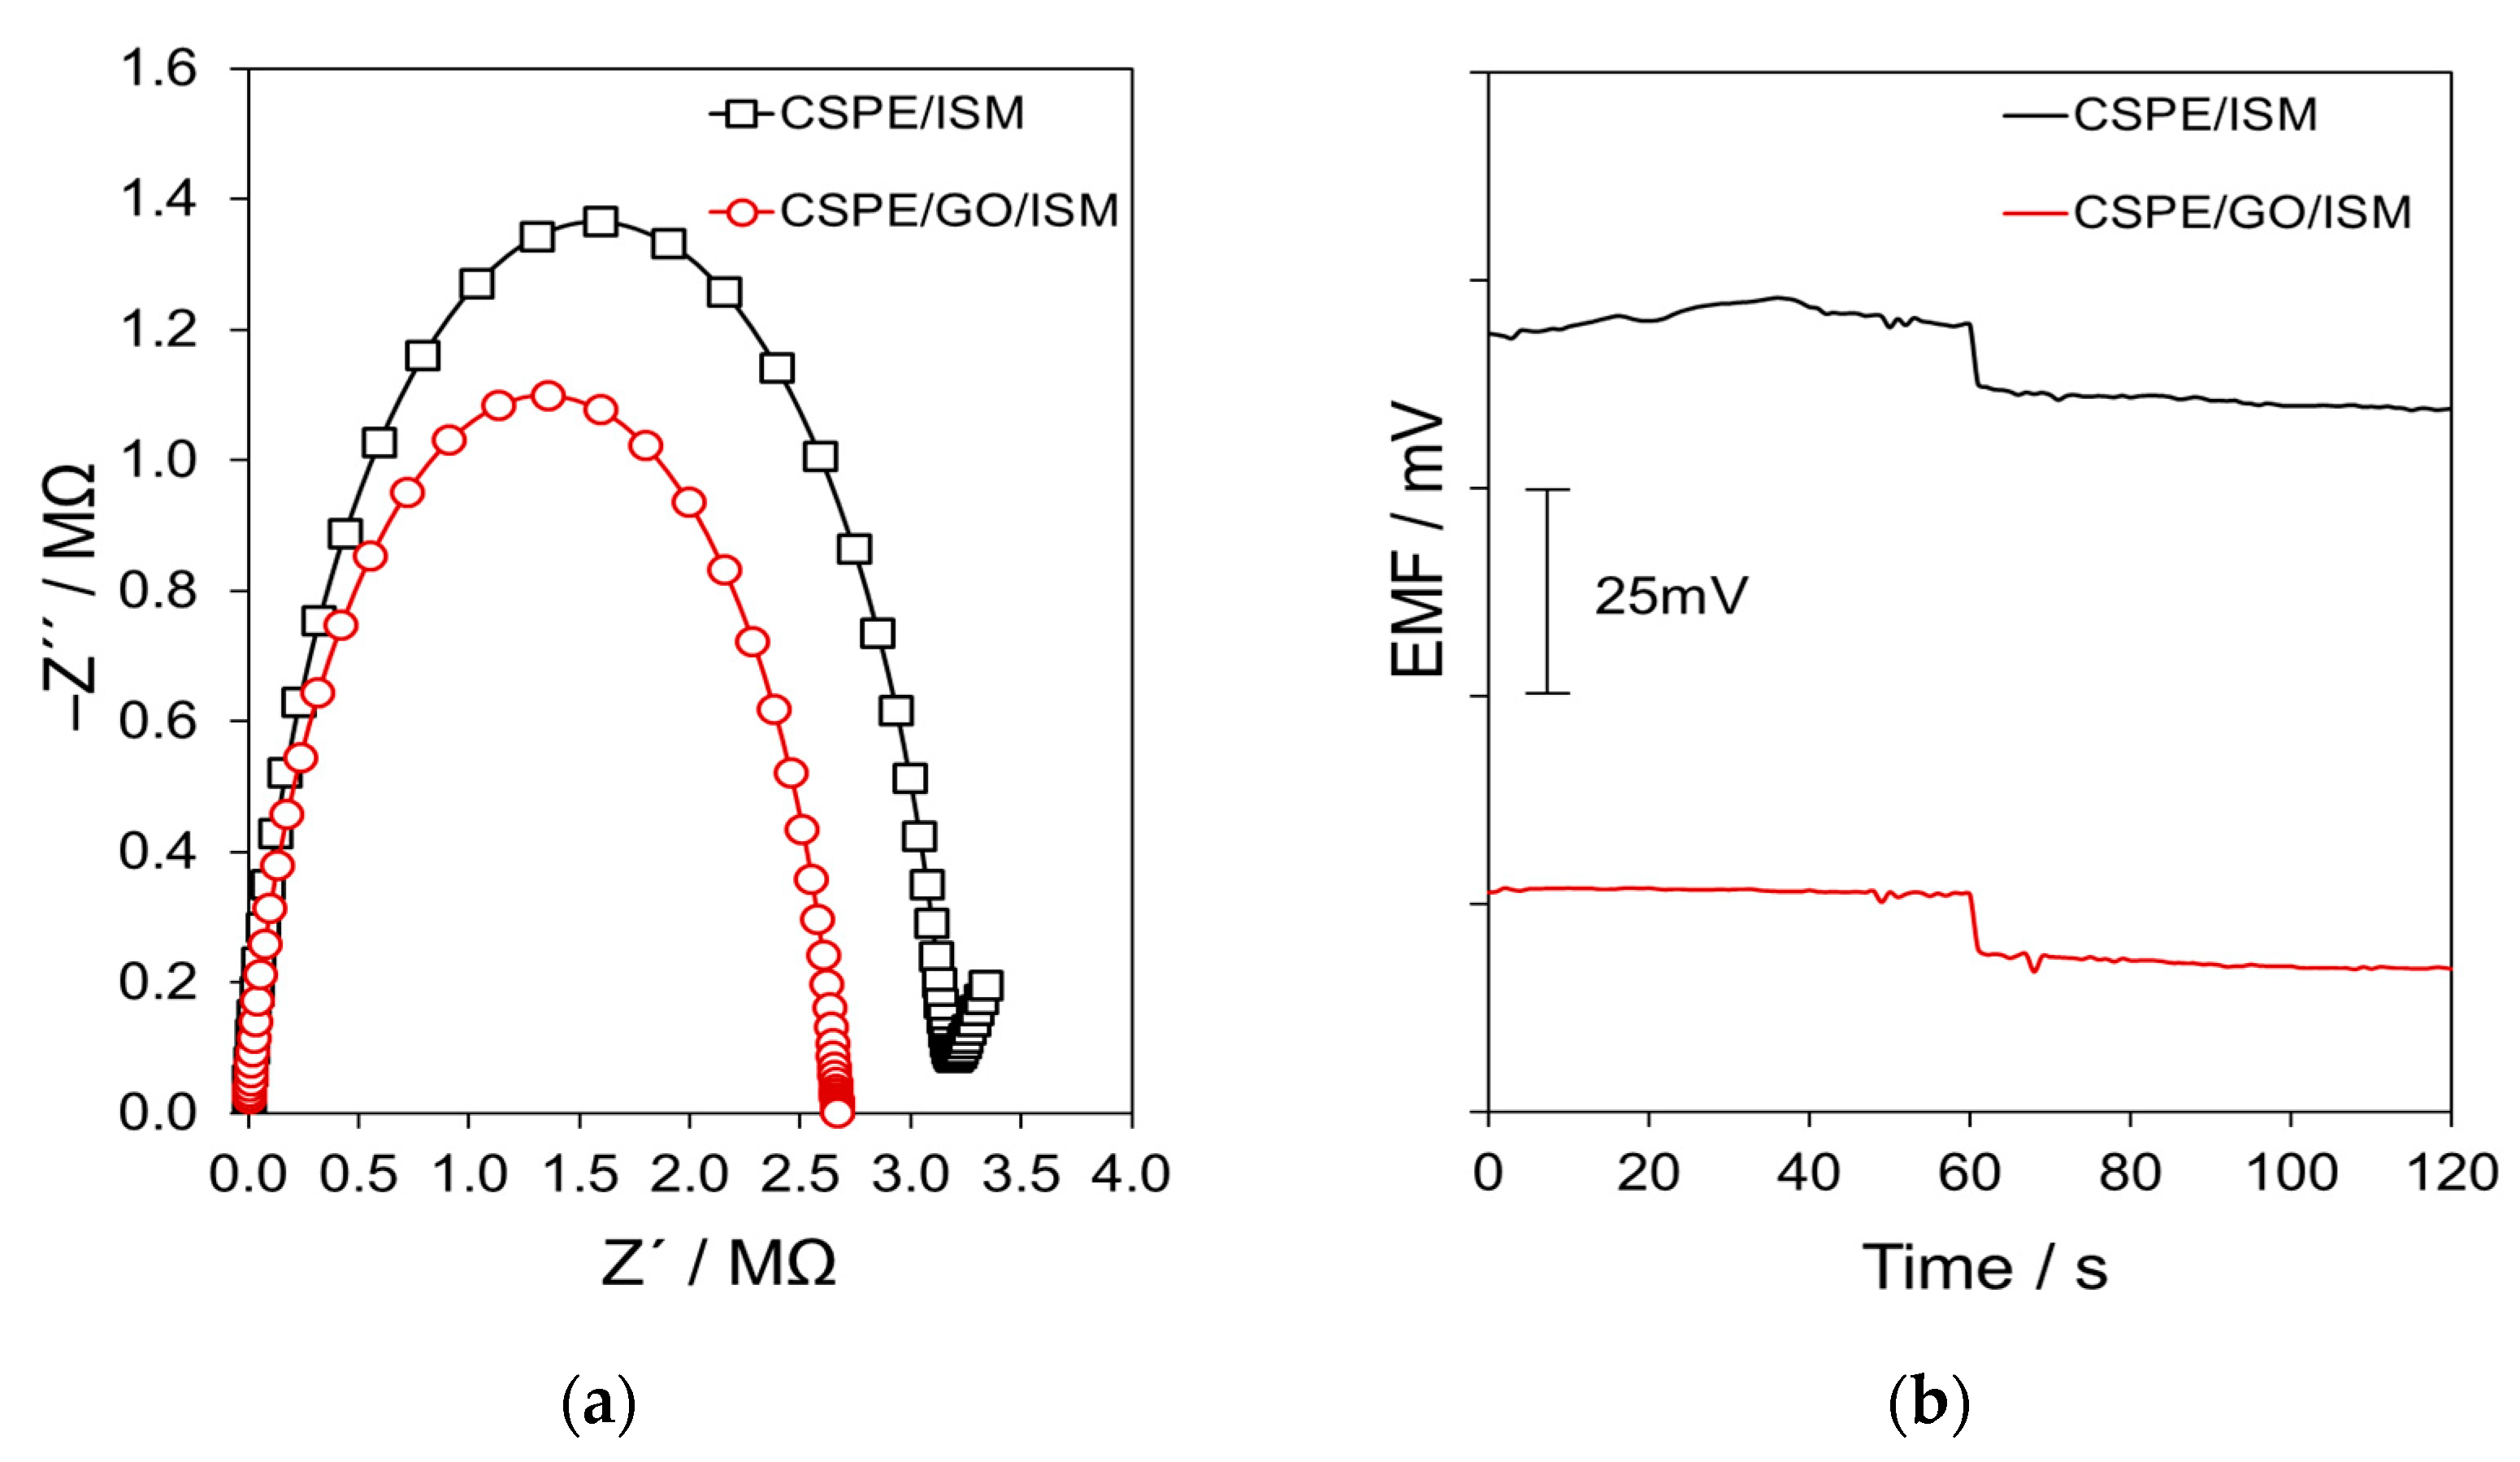
3.3. Electrochemical Studies

EIS experiments evaluated the charge transfer resistance and the transduction mechanism of the proposed all-solid-state-ISEs in 10−1 M NaNO3 solution. The impedance spectrum (i.e., Nyquist plot) of the CSPE/GO bare electrode was first examined, showing a capacitive line down to low frequencies (0.1 Hz) and a deviation from the capacitive element at high frequencies, still indicating a fast transduction across the GO film/electrolyte solution (Figure S5). When compared with the impedance spectra of CSPE/ISM and CSPE/GO/ISM sensors (Figure 4a), the signal at high frequencies becomes mainly dominated by the bulk ISM resistance coupled with the contact resistance between the electrode surface and ISM. The diameter of the semicircle was similar in both sensor configurations: 3.1 ± 0.3 MΩ and 2.7 ± 0.9 MΩ for the CSPE/ISM and CSPE/GO/ISM configuration, respectively (average of three sensor units). On the other hand, the absence of a low-frequency semicircle shows that the ion-to-electron transduction occurs properly in both configurations. Notably, a clear difference is observed at low frequencies, whereas the impedance spectrum of the CSPE/GO/ISM comes closer to the real impedance axis than the CSPE/ISM configuration, which results from the increase in the low-frequency capacitance given by the GO. These findings are corroborated by analyzing the Bode plots (Figure S6). The impedance was almost independent of frequency in the range from 0.1 to 103 Hz, while the phase angle was close to zero. This demonstrates that recorded impedance was practically equal to resistance, particularly the ohmic resistance of the PVC-based ISM [55]. For frequencies higher than 103 Hz, the impedance starts to decrease, and the negative value of the phase angle significantly increases. This indicates the growing role of a capacitive element—in this case, the geometric capacitance ( C g ) of the PVC-based ISM, which is connected to the ohmic resistance [45]. The C g , estimated from the impedance ( Z ) recorded for a phase angle close to −80°, can be calculated by Equation (2):
C g = 1 2 π f Z ,
where f is frequency. The estimated C g is around 10−11 F, consistent with other data reported for PVC-based membranes [45].
On the other hand, the capacitance of the solid contact, which characterizes the ion-to-electron transduction ability, is related to the low-frequency semicircle of the impedance spectrum and was evaluated along with the short-term potential stability using reversed-current chronopotentiometry [45]. The potential jump ( E ) in the chronopotentiograms (Figure 4b) was used to calculate the total resistance ( R T o t ) of the ISEs from Equation (3):
R T o t = E I ,
where I is the applied current (1 nA). The calculated R T o t was 7.1 ± 1.0 and 6.5 ± 1.9 MΩ for the CSPE/ISM and CSPE/GO/ISM, respectively. From the slope (∆ E /∆t), the potential drift was 41.6 ± 18.5 and 30.7 ± 2.3 µV s−1, respectively. The low-frequency capacitance ( C L F ) was calculated from Equation (4) [45]:
C L F = I E t ,
as 32.6 ± 2.4 µF for the CSPE/GO/ISM, which is slightly higher than the obtained value for the CSPE/ISM sensors (27.2 ± 11.0 µF). The capacity values reported herein are overall better than those obtained with reduced graphene oxide [36,56] and comparable (or at least in the same order of magnitude) with those obtained for carbon nanotubes- [34,57] or graphene-based [41,58] sensors. These findings prove the successful use of GO as a reliable solid-contact transducer material for all-solid-state electrode design.

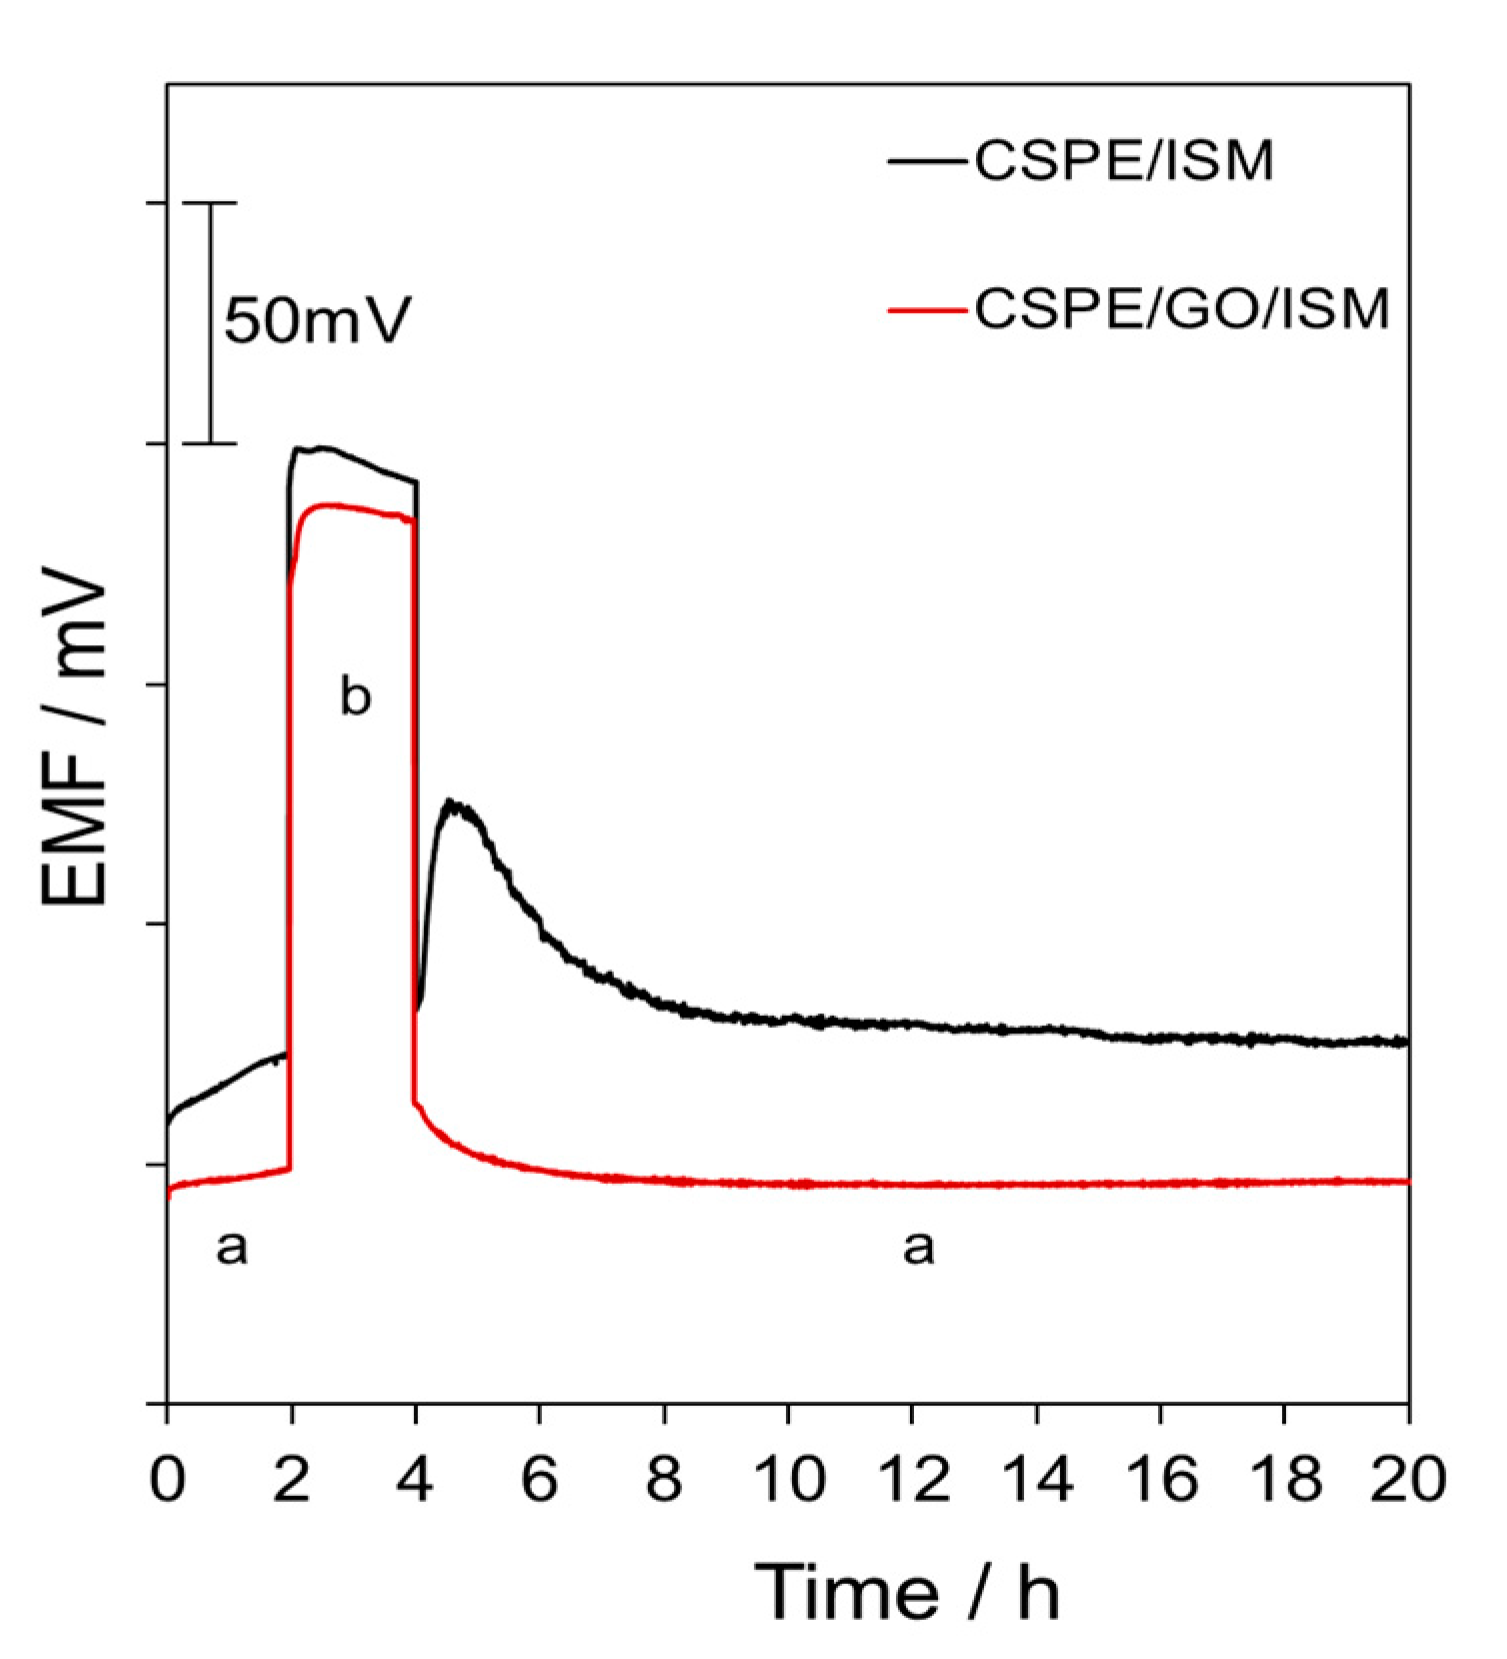
3.4. Water Layer Test and Potential Stability

The formation of a water layer between the ISM and the conductive surface leads to long equilibration times, sensor reading drift, and sensitivity to CO2 partial pressure [18]. Over time, this water layer can continue to spread over the interface, affecting the ISM’s adhesion and ultimately leading to delamination. The introduction of GO could avoid the formation of this inner aqueous layer, which was assessed using the water layer test proposed by Fibbioli et al. [19]. Briefly, the sensors were initially conditioned overnight in the primary ion solution (10−1 M NaNO3) and then exposed to an interfering ion solution (10−1 M NaCl) for 2 h. The fast EMF shift when changing solutions is caused by the change in phase boundary potential at the ISM/solution interface and is a function of the selectivity coefficient and the concentrations of the primary and interfering ions (Figure 5). After 2 h, the initial primary ion solution replaced the interfering ion solution, and the EMF was restored to the initial value. The continuous recording for nearly 16 h revealed excellent long-term stability for the CSPE/GO/ISM sensor, whose potential drift was 0.32 mV h−1. Under the same conditions, the potential drift observed in the CSPE/ISM (1.87 mV h−1) could be related to the formation of the water layer, as similarly reported earlier for this type of electrode [18].
The potential stability and sensor longevity of GO-based all-solid-state NO3 electrodes were studied in detail by performing repetitive calibration curves for 12 weeks and assessing the changes in the analytical parameters. The electrodes were stored dry and conditioned overnight in 10−3 M NaNO3 solution before use. Both sensor configurations exhibit stable ion sensitivity within the linear range from 10−5 to 10−2 M, with variations in the slope of −55.9 ± 3.0 and −54.5 ± 2.8 mV decade−1 for the CSPE/GO/ISM and CSPE/ISM sensors, respectively. However, the drift of the recorded EMF values from calibration to calibration was much higher for the CSPE/ISM sensors, with coefficients of variation (CV) of 13.7 and 14.7% for the lower and higher limits of the linear range, respectively. Notably, the corresponding values obtained with the CSPE/GO/ISM sensors ranged from 6.8 and 7.9%. These findings corroborated the formation of the aforementioned water layer in the CSPE/ISM sensors and revealed higher potential stability with the CSPE/GO/ISM sensors. This is ultimately demonstrated by the lower variation of the E0 (213.4 ± 20.1 mV, CV of 10%) compared to the observed in the CSPE/ISM sensors (167.0 ± 43.0 mV, CV of 20%). Additionally, the lower limit of detection remained stable for the CSPE/GO/ISM sensors (2.3 ± 0.8 µM) over the 12 weeks, while it became worse for the CSPE/ISM sensors (4.9 ± 3.2 µM). The significantly higher stability in the sensors prepared with GO highlights its use as a transducer in potentiometric all-solid-state electrodes.

3.5. Analytical Application of GO-Based All-Solid-State NO3 Electrodes

To assess the applicability of the proposed GO-based all-solid-state NO3 electrodes, NO3 calibrations in phosphate buffer (10−1 M) were first performed to adjust the ionic strength to 10−1 M and mimic high electrolyte backgrounds (Figure S7 and Table S5). No significant difference was observed compared with the dynamic response and the respective calibration curve obtained with those found in Milli-Q water (Figure 2 and Table 1). Additionally, the NO3 calibration curves in the real sample matrix (Figure S8), namely domestic (DW) and agriculture (AW) well water, similar to those obtained in phosphate buffer, proved the nonexistence of matrix interference. Recovery studies were accomplished by the analysis of spiked real samples with 2.0 × 10⁻³ (DW.1 and AW.1) and 6.9 × 10⁻³ M (DW.2 and AW.2) NO3 concentrations, which are equivalent to 123.8 and 430.9 mg L−1, respectively. Each sample was analyzed in triplicate using the proposed CSPE/GO/ISM sensors and a commercial electrode of the inner filling solution. The recoveries were calculated according to Equation (5):
R e c o v e r y   % = N O 3   F o u n d N O 3   I n i t i a l N O 3   A d d e d × 100 % ,
where N O 3   F o u n d is the concentration of N O 3   measured in the spiked sample, N O 3   I n i t i a l is the concentration of N O 3 found in the water sample, and N O 3   A d d e d is the amount of N O 3   added to the sample. The recovery percentages were acceptable for both ISEs, showing the appropriate accuracy of the CSPE/GO/ISM sensor (Table 3).
Finally, the feasibility of the proposed all-solid-state electrodes for determining NO3 concentration in different water samples was investigated. Well, tap, and commercial water samples were analyzed by direct immersion of the ISEs into the sample, including the commercial one, for comparison. Before the analysis, each sensor was calibrated from 10−5 to 10−2 M NO3 in a phosphate buffer background to ensure proper functioning. In all cases, the difference in NO3 concentrations provided by the two ISEs was lower than 8.5% (Table 4). This agreement was evidenced by the obtained p-values (>0.05) from a t-test analysis at the 95% confidence level.
Regarding water safety, the NO3 levels found in the commercial, tap, and domestic well samples were below the guideline value defined by the EU (50 mg L−1 [4]) for drinking water, making them acceptable for consumption without risk to human health. However, higher levels were found in waters from the agriculture well, which could be explained by the runoff of inorganic fertilizers from the soil to the groundwater [59]. Nevertheless, these agriculture wells are included in a geographical area already considered a Nitrate Vulnerable Zone by the Portuguese Government [60], defined by the EU as an area of land that drains into polluted waters or waters at risk of pollution from agricultural activities [4]. Overall, the highly accurate and precise results demonstrate the reliability of the CSPE/GO/ISM sensors for NO3 measurements without any pre-treatment.

3.6. Comparison of GO-Based All-Solid-State NO3 Electrode with Previously Reported Electrodes

The electrochemical and analytical performance of the herein proposed GO-based electrode were compared with relevant NO3 all-solid-state potentiometric sensors reported in the literature (Table S4). The linear response range, the lower limit of detection, and the sensitivity are comparable with earlier reported sensors. Notably, the fast response time recorded as 10 s, the long-term potential stability (0.3 mV h−1), and the impressive lifetime of 3 months outperform the most recently reported NO3 electrodes. Regarding the electrochemical performance, the proposed sensor exhibits a capacitance value better than reduced graphene oxide [36,56] and comparable (or at least in the same order of magnitude) with those obtained for carbon nanotubes- [34,57] or graphene-based [41,61] sensors. Overall, these findings prove the successful use of GO as a reliable and alternative carbon solid-contact transducer for all-solid-state electrode design.

4. Conclusions

This work used graphene oxide (GO) as an ion-to-electron transducer to develop all-solid-state nitrate electrodes. The analytical performance of the proposed electrodes (LOD, sensitivity, selectivity coefficients, and long-term drift) is comparable with those of other solid-contact arrangements. The proposed sensors exhibited improved potential stability and the absence of a water layer compared to the carbon bare electrodes (using the same sensing membrane). The applicability was demonstrated by accurately determining nitrate levels in water samples. These results expand the scope of graphene-based sensors, particularly by implementing GO as an alternative transducer for constructing stable and durable all-solid-state ISEs, which hold great promise for routine sensing applications.

Supplementary Materials

The following supporting information can be downloaded at: https://www.mdpi.com/article/10.3390/chemosensors12060086/s1, Figure S1: EDS analysis of the (A) CSPE bare electrode, (B) nanosheet and (C) particle in the CSPE/GO bare electrode, Figure S2: (A) Reversibility of CSPE/GO/ISM sensor by calibration from low to high analyte activities and vice-versa. (B) Corresponding calibrations graphs, Figure S3: Potentiometric response of CSPE/ISM (A) and CSPE/GO/ISM (B) sensors towards the nitrate ion in the presence of different interfering anions at fixed concentration (10−2 M), Figure S4: Potentiometric response of CSPE/GO/ISM sensors towards the nitrate ion in the presence of different interfering anions at fixed concentration (10−4 M), Figure S5: Nyquist plot of CSPE/GO bare electrode in 10−1 M NaNO3 solution. Frequency range: 0.1 Hz to 100 kHz; E DC: OCP; ΔE AC: 10 mV, Figure S6: Electrochemical impedance bode plots for (A) impedance magnitude (Log Z) and (B) phase angle vs. Log frequency ( f ) in 10−1 M NaNO3 solution. Frequency range: 0.1 Hz to 100 kHz; E DC: OCP; ΔE AC: 10 mV, Figure S7: (A) Dynamic response of one CSPE/GO/ISM sensor in steady-state mode at increasing NO3 concentrations and using the commercial Ag/AgCl reference electrode (logarithmic concentrations are indicated above each trace). (B) Corresponding calibration graph whose error bars refer to the average of three successive calibrations. Background: phosphate buffer 10−1 M at pH 5.0 (I = 10−1 M), Figure S8: Dynamic calibration curves of CSPE/GO/ISM sensors towards the nitrate ion in different backgrounds (phosphate buffer and well water samples); Table S1: ID/IG ratios for CSPE/GO obtained from different surface zones, Table S2: Repeatability assessment of the potentiometric response of five equally prepared CSPE/GO/ISM sensors (three subsequent calibrations on the same sensor unit), Table S3: Reproducibility assessment of the potentiometric response of fifteen equally prepared CSPE/GO/ISM sensors (one calibration on each sensor unit), Table S4: Comparison of the proposed all-solid-state NO3 ISE based on GO with published reports using different transducers, Table S5: Potentiometric response characteristics of the proposed CSPE/GO/ISM sensors in 10−1 M phosphate buffer background (pH 5.0).

Author Contributions

Conceptualization, R.L.G. and R.B.Q.; Methodology, R.L.G. and R.B.Q.; Validation, R.L.G.; Formal analysis, R.L.G. and R.B.Q.; Investigation, R.L.G. and L.R.-L.—Raman analysis; Resources, B.E. and R.B.Q.; Writing—original draft preparation, R.L.G.; Writing—review and editing, L.R.-L., B.E. and R.B.Q.; Visualization, R.L.G.; Supervision, R.B.Q.; Project administration, B.E. and R.B.Q.; Funding acquisition, B.E. and R.B.Q. All authors have read and agreed to the published version of the manuscript.

Funding

This research was funded by EEA (European Economic Area) Grants Portugal through the funded project PT-INN-0076—OPTIRAS. The authors acknowledge the financial support of the project NGS-New Generation Storage, with the reference n.º C644936001-00000045, co-funded by Component C5—Capitalisation and Business Innovation under the Portuguese Resilience and Recovery Plan, through the NextGenerationEU Fund. Laura R.-L. acknowledges funding to FCT (Fundação para a Ciência e Tecnologia) for the Scientific Employment Stimulus Program (2020.04021.CEECIND).

Institutional Review Board Statement

Not applicable.

Informed Consent Statement

Not applicable.

Data Availability Statement

The original contributions presented in the study are included in the article/Supplementary Material; further inquiries can be directed to the corresponding author.

Conflicts of Interest

The authors declare no conflicts of interest.

References

  1. Wetzel, R.G. (Ed.) The nitrogen cycle. In Limnology, 3rd ed.; Academic Press: San Diego, CA, USA, 2001; pp. 205–237. [Google Scholar]
  2. Fields, S. Global nitrogen: Cycling out of control. Environ. Health Perspect. 2004, 112, A556–A563. [Google Scholar] [CrossRef]
  3. Pięk, M.; Piech, R.; Paczosa-Bator, B. Improved nitrate sensing using solid contact ion selective electrodes based on TTF and its radical salt. J. Electrochem. Soc. 2015, 162, B257–B263. [Google Scholar] [CrossRef]
  4. Directive, C. 91/676/EEC of 12 December 1991 concerning the protection of waters against pollution caused by nitrates from agricultural sources. Off. J. 1991, 34, 375. [Google Scholar]
  5. Ward, M.H.; Jones, R.R.; Brender, J.D.; de Kok, T.M.; Weyer, P.J.; Nolan, B.T.; Villanueva, C.M.; van Breda, S.G. Drinking water nitrate and human health: An updated review. Int. J. Environ. Res. Public Health 2018, 15, 1557. [Google Scholar] [CrossRef] [PubMed]
  6. de Vries, W. Impacts of nitrogen emissions on ecosystems and human health: A mini review. Curr. Opin. Environ. Sci. Health 2021, 21, 100249. [Google Scholar] [CrossRef]
  7. Wang, Q.-H.; Yu, L.-J.; Liu, Y.; Lin, L.; Lu, R.-G.; Zhu, J.-P.; He, L.; Lu, Z.-L. Methods for the detection and determination of nitrite and nitrate: A review. Talanta 2017, 165, 709–720. [Google Scholar] [CrossRef] [PubMed]
  8. Singh, S.; Anil, A.G.; Kumar, V.; Kapoor, D.; Subramanian, S.; Singh, J.; Ramamurthy, P.C. Nitrates in the environment: A critical review of their distribution, sensing techniques, ecological effects and remediation. Chemosphere 2022, 287, 131996. [Google Scholar] [CrossRef]
  9. Gil, R.; Amorim, C.G.; Araújo, A.N.; Montenegro, M.C.B.S.M. Process analysis: Electroanalytical techniques. In Encyclopedia of Analytical Science, 3rd ed.; Worsfold, P., Poole, C., Townshend, A., Miró, M., Eds.; Elsevier: Amsterdam, The Netherlands, 2018; pp. 384–388. [Google Scholar]
  10. Alahi, M.E.E.; Mukhopadhyay, S.C. Detection methods of nitrate in water: A review. Sens. Actuators A Phys. 2018, 280, 210–221. [Google Scholar] [CrossRef]
  11. Ryu, H.; Thompson, D.; Huang, Y.; Li, B.; Lei, Y. Electrochemical sensors for nitrogen species: A review. Sens. Actuators Rep. 2020, 2, 100022. [Google Scholar] [CrossRef]
  12. Jiang, C.; He, Y.; Liu, Y. Recent advances in sensors for electrochemical analysis of nitrate in food and environmental matrices. Analyst 2020, 145, 5400–5413. [Google Scholar] [CrossRef]
  13. Nielsen, H.J.; Hansen, E.H. New nitrate ion-selective electrodes based on quaternary ammonium compounds in nonporous polymer membranes. Anal. Chim. Acta 1976, 85, 1–16. [Google Scholar] [CrossRef]
  14. Simeonov, V.; Andreev, G.; Stoianov, A. Microdetermination of nitrate nitrogen in lake waters by potentiometry with an ion-selective electrode. Fresenius Z. Anal. Chem. 1979, 297, 418. [Google Scholar] [CrossRef]
  15. Ruzicka, J.; Hansen, E.H.; Zagatto, E.A. Flow injection analysis: Part VII. Use of ion-selective electrodes for rapid analysis of soil extracts and blood serum. Determination of potassium, sodium and nitrate. Anal. Chim. Acta 1977, 88, 1–16. [Google Scholar] [CrossRef]
  16. Cuartero, M.; Crespo, G.A. All-solid-state potentiometric sensors: A new wave for in situ aquatic research. Curr. Opin. Electrochem. 2018, 10, 98–106. [Google Scholar] [CrossRef]
  17. Lindner, E.; Gyurcsányi, R.E. Quality control criteria for solid-contact, solvent polymeric membrane ion-selective electrodes. J. Solid State Electrochem. 2009, 13, 51–68. [Google Scholar] [CrossRef]
  18. De Marco, R.; Veder, J.P.; Clarke, G.; Nelson, A.; Prince, K.; Pretsch, E.; Bakker, E. Evidence of a water layer in solid-contact polymeric ion sensors. Phys. Chem. Chem. Phys. 2008, 10, 73–76. [Google Scholar] [CrossRef]
  19. Fibbioli, M.; Morf, W.E.; Badertscher, M.; de Rooij, N.F.; Pretsch, E. Potential drifts of solid-contacted ion-selective electrodes due to zero-current ion fluxes through the sensor membrane. Electroanalysis 2000, 12, 1286–1292. [Google Scholar] [CrossRef]
  20. Hu, J.; Stein, A.; Bühlmann, P. Rational design of all-solid-state ion-selective electrodes and reference electrodes. TrAC Trends Anal. Chem. 2016, 76, 102–114. [Google Scholar] [CrossRef]
  21. Michalska, A. All-solid-state ion selective and all-solid-state reference electrodes. Electroanalysis 2012, 24, 1253–1265. [Google Scholar] [CrossRef]
  22. Lyu, Y.; Gan, S.; Bao, Y.; Zhong, L.; Xu, J.; Wang, W.; Liu, Z.; Ma, Y.; Yang, G.; Niu, L. Solid-contact ion-selective electrodes: Response mechanisms, transducer materials and wearable sensors. Membranes 2020, 10, 128. [Google Scholar] [CrossRef]
  23. Bobacka, J. Conducting polymer-based solid-state ion-selective electrodes. Electroanalysis 2006, 18, 7–18. [Google Scholar] [CrossRef]
  24. Michalska, A. Optimizing the analytical performance and construction of ion-selective electrodes with conducting polymer-based ion-to-electron transducers. Anal. Bioanal. Chem. 2006, 384, 391–406. [Google Scholar] [CrossRef] [PubMed]
  25. Bieg, C.; Fuchsberger, K.; Stelzle, M. Introduction to polymer-based solid-contact ion-selective electrodes-basic concepts, practical considerations, and current research topics. Anal. Bioanal. Chem. 2017, 409, 45–61. [Google Scholar] [CrossRef]
  26. Yuan, D.; Anthis, A.H.C.; Ghahraman Afshar, M.; Pankratova, N.; Cuartero, M.; Crespo, G.A.; Bakker, E. All-solid-state potentiometric sensors with a multiwalled carbon nanotube inner transducing layer for anion detection in environmental samples. Anal. Chem. 2015, 87, 8640–8645. [Google Scholar] [CrossRef]
  27. Fan, X.; Nie, W.; Tsai, H.; Wang, N.; Huang, H.; Cheng, Y.; Wen, R.; Ma, L.; Yan, F.; Xia, Y. PEDOT:PSS for flexible and stretchable electronics: Modifications, strategies, and applications. Adv. Sci. 2019, 6, 1900813. [Google Scholar] [CrossRef]
  28. Ozer, T.; Agir, I.; Henry, C.S. Rapid prototyping of ion-selective electrodes using a low-cost 3D printed internet-of-things (IoT) controlled robot. Talanta 2022, 247, 123544. [Google Scholar] [CrossRef]
  29. Yin, T.; Qin, W. Applications of nanomaterials in potentiometric sensors. Trends Anal. Chem. 2013, 51, 79–86. [Google Scholar] [CrossRef]
  30. Lai, C.-Z.; Fierke, M.A.; Stein, A.; Bühlmann, P. Ion-selective electrodes with three-dimensionally ordered macroporous carbon as the solid contact. Anal. Chem. 2007, 79, 4621–4626. [Google Scholar] [CrossRef] [PubMed]
  31. Woźnica, E.; Wójcik, M.M.; Wojciechowski, M.; Mieczkowski, J.; Bulska, E.; Maksymiuk, K.; Michalska, A. Dithizone modified gold nanoparticles films for potentiometric sensing. Anal. Chem. 2012, 84, 4437–4442. [Google Scholar] [CrossRef]
  32. Ping, J.; Wang, Y.; Wu, J.; Ying, Y. Development of an all-solid-state potassium ion-selective electrode using graphene as the solid-contact transducer. Electrochem. Commun. 2011, 13, 1529–1532. [Google Scholar] [CrossRef]
  33. Crespo, G.A. Recent advances in ion-selective membrane electrodes for in situ environmental water analysis. Electrochim. Acta 2017, 245, 1023–1034. [Google Scholar] [CrossRef]
  34. Hassan, S.S.M.; Eldin, A.G.; Amr, A.E.E.; Al-Omar, M.A.; Kamel, A.H.; Khalifa, N.M. Improved solid-contact nitrate ion selective electrodes based on multi-walled carbon nanotubes (MWCNTs) as an ion-to-electron transducer. Sensors 2019, 19, 3891. [Google Scholar] [CrossRef] [PubMed]
  35. Tang, W.; Ping, J.; Fan, K.; Wang, Y.; Luo, X.; Ying, Y.; Wu, J.; Zhou, Q. All-solid-state nitrate-selective electrode and its application in drinking water. Electrochim. Acta 2012, 81, 186–190. [Google Scholar] [CrossRef]
  36. Liu, Y.; Liu, Y.; Meng, Z.; Qin, Y.; Jiang, D.; Xi, K.; Wang, P. Thiol-functionalized reduced graphene oxide as self-assembled ion-to-electron transducer for durable solid-contact ion-selective electrodes. Talanta 2020, 208, 120374. [Google Scholar] [CrossRef] [PubMed]
  37. Kim, M.-Y.; Lee, J.-W.; Park, D.J.; Lee, J.-Y.; Myung, N.V.; Kwon, S.H.; Lee, K.H. Highly stable potentiometric sensor with reduced graphene oxide aerogel as a solid contact for detection of nitrate and calcium ions. J. Electroanal. Chem. 2021, 897, 115553. [Google Scholar] [CrossRef]
  38. Li, D.; Wang, T.; Li, Z.; Xu, X.; Wang, C.; Duan, Y. Application of graphene-based materials for detection of nitrate and nitrite in water-a review. Sensors 2019, 20, 54. [Google Scholar] [CrossRef]
  39. Xu, B.; Yue, S.; Sui, Z.; Zhang, X.; Hou, S.; Cao, G.; Yang, Y. What is the choice for supercapacitors: Graphene or graphene oxide? Energy Environ. Sci. 2011, 4, 2826–2830. [Google Scholar] [CrossRef]
  40. Düzgün, A.; Zelada-Guillén, G.A.; Crespo, G.A.; Macho, S.; Riu, J.; Rius, F.X. Nanostructured materials in potentiometry. Anal. Bioanal. Chem. 2011, 399, 171–181. [Google Scholar] [CrossRef]
  41. Jaworska, E.; Lewandowski, W.; Mieczkowski, J.; Maksymiuk, K.; Michalska, A. Critical assessment of graphene as ion-to-electron transducer for all-solid-state potentiometric sensors. Talanta 2012, 97, 414–419. [Google Scholar] [CrossRef] [PubMed]
  42. Meier, P.C. Two-parameter debye-hückel approximation for the evaluation of mean activity coefficients of 109 electrolytes. Anal. Chim. Acta 1982, 136, 363–368. [Google Scholar] [CrossRef]
  43. Buck, R.P.; Lindner, E. Recomendations for nomenclature of ion-selective electrodes (IUPAC Recommendations 1994). Pure Appl. Chem. 1994, 66, 2527–2536. [Google Scholar] [CrossRef]
  44. Umezawa, Y.; Buhlmann, P.; Umezawa, K.; Tohda, K.; Amemiya, S. Potentiometric selectivity coefficients of ion-selective electrodes Part I. Inorganic cations—(Technical report). Pure Appl. Chem. 2000, 72, 1851–2082. [Google Scholar] [CrossRef]
  45. Bobacka, J. Potential stability of all-solid-state ion-selective electrodes using conducting polymers as ion-to-electron transducers. Anal. Chem. 1999, 71, 4932–4937. [Google Scholar] [CrossRef] [PubMed]
  46. Hafiz, S.M.; Ritikos, R.; Whitcher, T.J.; Razib, N.M.; Bien, D.C.S.; Chanlek, N.; Nakajima, H.; Saisopa, T.; Songsiriritthigul, P.; Huang, N.M.; et al. A practical carbon dioxide gas sensor using room-temperature hydrogen plasma reduced graphene oxide. Sens. Actuators B Chem. 2014, 193, 692–700. [Google Scholar] [CrossRef]
  47. Ni, Z.; Wang, Y.; Yu, T.; Shen, Z. Raman spectroscopy and imaging of graphene. Nano Res. 2008, 1, 273–291. [Google Scholar] [CrossRef]
  48. Mehta, J.S.; Faucett, A.C.; Sharma, A.; Mativetsky, J.M. How reliable are raman spectroscopy measurements of graphene oxide? J. Phys. Chem. C 2017, 121, 16584–16591. [Google Scholar] [CrossRef]
  49. Elgrishi, N.; Rountree, K.J.; McCarthy, B.D.; Rountree, E.S.; Eisenhart, T.T.; Dempsey, J.L. A practical beginner’s guide to cyclic voltammetry. J. Chem. Educ. 2018, 95, 197–206. [Google Scholar] [CrossRef]
  50. Bakker, E.; Pretsch, E.; Buhlmann, P. Selectivity of potentiometric ion sensors. Anal. Chem. 2000, 72, 1127–1133. [Google Scholar] [CrossRef]
  51. Wojciechowski, K.; Kucharek, M.; Wroblewski, W.; Warszynski, P. On the origin of the Hofmeister effect in anion-selective potentiometric electrodes with tetraalkylammonium salts. J. Electroanal. Chem. 2010, 638, 204–211. [Google Scholar] [CrossRef]
  52. Kim, D.-W.; Jung, D.-H.; Cho, W.-J.; Sim, K.-C.; Kim, H.-J. On-site water nitrate monitoring system based on automatic sampling and direct measurement with ion-selective electrodes. J. Biosyst. Eng. 2017, 42, 350–357. [Google Scholar] [CrossRef]
  53. Jung, D.H.; Kim, H.J.; Kim, J.Y.; Park, S.H.; Cho, W.J. Water nitrate remote monitoring system with self-diagnostic function for ion-selective electrodes. Sensors 2021, 21, 2703. [Google Scholar] [CrossRef]
  54. Zhang, L.; Zhang, M.; Ren, H.; Pu, P.; Kong, P.; Zhao, H. Comparative investigation on soil nitrate-nitrogen and available potassium measurement capability by using solid-state and PVC ISE. Comput. Electron. Agric. 2015, 112, 83–91. [Google Scholar] [CrossRef]
  55. De Marco, R.; Jee, E.; Prince, K.; Pretsch, E.; Bakker, E. Synthesis and characterization of high-integrity solid-contact polymeric ion sensors. J. Solid State Electrochem. 2009, 13, 137–148. [Google Scholar] [CrossRef] [PubMed]
  56. Chen, M.; Zhang, M.; Wang, X.; Yang, Q.; Wang, M.; Liu, G.; Yao, L. An all-solid-state nitrate ion-selective electrode with nanohybrids composite films for in-situ soil nutrient monitoring. Sensors 2020, 20, 2270. [Google Scholar] [CrossRef]
  57. Crespo, G.A.; Macho, S.; Rius, F.X. Ion-selective electrodes using carbon nanotubes as ion-to-electron transducers. Anal. Chem. 2008, 80, 1316–1322. [Google Scholar] [CrossRef] [PubMed]
  58. Li, F.; Ye, J.; Zhou, M.; Gan, S.; Zhang, Q.; Han, D.; Niu, L. All-solid-state potassium-selective electrode using graphene as the solid contact. Analyst 2012, 137, 618–623. [Google Scholar] [CrossRef]
  59. Abascal, E.; Gómez-Coma, L.; Ortiz, I.; Ortiz, A. Global diagnosis of nitrate pollution in groundwater and review of removal technologies. Sci. Total Environ. 2022, 810, 152233. [Google Scholar] [CrossRef]
  60. DGADR. Zonas Vulneráveis. Available online: https://www.dgadr.gov.pt/diretiva-nitratos/zonas-vulneraveis (accessed on 27 September 2023).
  61. Hjort, R.G.; Soares, R.R.A.; Li, J.; Jing, D.; Hartfiel, L.; Chen, B.; Van Belle, B.; Soupir, M.; Smith, E.; McLamore, E.; et al. Hydrophobic laser-induced graphene potentiometric ion-selective electrodes for nitrate sensing. Mikrochim. Acta 2022, 189, 122. [Google Scholar] [CrossRef]
Figure 1. SEM images of the morphology of the CSPE (a,c) and CSPE/GO electrodes (b,d) at 5000x and 50,000x magnification, respectively. (e) Average Raman spectra of CSPE and CSPE/GO electrodes displaying the typical D and G bands located at 1332 and 1595 cm−1, respectively. (f) Cyclic voltammograms of CSPE and CSPE/GO electrodes recorded between −0.5 V and +0.5 V in 5 × 10⁻³ M ferro/ferricyanide solution at a scan rate of 100 mV s−1.
Chemosensors 12 00086 g001
Figure 2. (a) Dynamic response of one CSPE/GO/ISM sensor in steady-state mode at increasing NO3 concentrations and using the commercial Ag/AgCl reference electrode (logarithmic concentrations are indicated above each trace). Inset: Response time at 10−5 M NaNO3. (b) Corresponding calibration graph whose error bars refer to the average of three successive calibrations. Background: Milli-Q water.
Chemosensors 12 00086 g002
Figure 3. (a) Repetitive cycles of CSPE/GO/ISM sensor between 10−4 and 10−3 M NaNO3 solutions by monitoring the EMF continuously. (b) Effect of pH on CSPE/GO/ISM sensor response at 10−5 and 10−3 M NaNO3 solutions (dots for experimental data and continuous line for simulated EMF).
Chemosensors 12 00086 g003
Figure 4. (a) Nyquist plots of CSPE/ISM and CSPE/GO/ISM sensors in 10−1 M NaNO3 solution. Frequency range: 0.1 Hz to 100 kHz; E DC: OCP; ΔE AC: 10 mV. (b) Chronopotentiograms of CSPE/ISM and CSPE/GO/ISM sensors in 10−1 M NaNO3 solution. Applied current: +1 nA for 60 s and −1 nA for 60 s.
Chemosensors 12 00086 g004
Figure 5. Water layer test of CSPE/ISM and CSPE/GO/ISM sensors in 10−1 M NaNO3 primary ion solution (a), switched with 10−1 M NaCl solution (b), and return to 10−1 M NaNO3 primary ion solution (a).
Chemosensors 12 00086 g005
Table 1. Potentiometric response characteristics of the proposed all-solid-state electrodes for detection of NO3 (n = 15 calibrations from five identical electrodes).
ParameterCSPE/GO/ISMCSPE/ISM
Slope (mV dec−1)−53.5 ± 2.4−55.4 ± 5.0
Intercept (mV)215.2 ± 7.3174.2 ± 33.0
Coefficient of determination (R2)0.9976 ± 0.00150.9950 ± 0.0058
Linear range of response (M)3.0 × 10⁻⁶–10−23.0 × 10⁻⁶–10−2
Limit of detection (M)1.9 × 10−62.2 × 10−6
Working range (pH)3–63–6
Response time (s)10–2010–20
Reproducibility slope (SD, mV)
Intra-electrode 1<3.1<4.1
Inter-electrode 22.05.0
Reproducibility intercept (SD, mV)
Intra-electrode 1<3.8<16.6
Inter-electrode 27.333.0
1 Three consecutive calibrations performed on the same sensor; 2 Fifteen calibrations performed from five equally prepared sensors. SD—Standard deviation.
Table 2. Potentiometric selectivity coefficients ( K N O 3 , X P o t ) of the proposed all-solid-state NO3 electrodes.
Interfering   Ion   ( X ) L o g K N O 3 , X P o t
CSPE/GO/ISMCSPE/ISM
10−4 M10−2 M10−4 M10−2 M
CO32−−3.2−4.0ND.−4.5
SO42−−3.2−4.2ND.−4.5
HPO42−−3.2−4.3ND.−4.5
Cl−1.3−2.7ND.−2.7
NO2−1.2−1.8ND.−1.9
Br−0.8−1.1ND.−1.2
NO3--ND.-
I1.10.5 1ND.0.5 1
ClO41.2 10.5 1ND.0.5 1
1 No Nernstian response was observed for these interfering ions at the examined concentrations and, thus, the selectivity coefficients presented should be considered minimum values. ND.—not determined.
Table 3. Recovery values of the proposed CSPE/GO/ISM sensors and a commercial electrode in spiked water samples.
SampleAdded
(mg L−1)
CSPE/GO/ISMCommercial ISE
Found 1
(mg L−1)
CV 2
(%)
Recovery (%)Found 1
(mg L−1)
CV 2
(%)
Recovery (%)
DW034.9 ± 1.02.8-37.8 ± 2.36.0-
DW.1123.8160.8 ± 11.47.1101.7160.5 ± 5.83.699.1
DW.2431.1500.1 ± 30.06.0107.9488.7 ± 5.41.1104.6
AW078.5 ± 3.84.9-81.0 ± 1.92.3-
AW.1123.8187.2 ± 11.76.387.8200.1 ± 8.94.596.2
AW.2431.1543.5 ± 26.64.9107.9551.7 ± 30.65.5109.2
1 Average ± standard deviation (n = 3); 2 Coefficient of variation.
Table 4. Quantification of nitrate levels in different water samples using the proposed CSPE/GO/ISM sensor and the commercial ISE.
SampleNO3 (mg L−1) 1% Differencep-Value 2
CSPE/GO/ISMCommercial ISE
Commercial4.7 ± 0.34.7 ± 0.20.40.370
Tap4.3 ± 0.54.5 ± 0.16.00.443
Domestic well34.9 ± 1.037.8 ± 2.38.50.129
Agriculture well 150.5 ± 6.351.4 ± 0.21.90.152
Agriculture well 278.5 ± 3.881.0 ± 1.03.30.932
1 Average ± standard deviation (n = 3); 2 p-value calculated from the bilateral t-test with a 95% confidence level.
Disclaimer/Publisher’s Note: The statements, opinions and data contained in all publications are solely those of the individual author(s) and contributor(s) and not of MDPI and/or the editor(s). MDPI and/or the editor(s) disclaim responsibility for any injury to people or property resulting from any ideas, methods, instructions or products referred to in the content.

