Article

Response Time Dynamics of a Membrane-Based Microfluidic Gas Sensor

by
Sreerag Kaaliveetil
1,
Najamuddin Naveed Khaja
1,
Niranjan Haridas Menon
1 and
Sagnik Basuray
1,2,*
1
Department of Chemical and Materials Engineering, New Jersey Institute of Technology, Newark, NJ 07102, USA
2
Department of Biomedical Engineering, New Jersey Institute of Technology, Newark, NJ 07102, USA
*
Author to whom correspondence should be addressed.
Chemosensors 2024, 12(7), 127; https://doi.org/10.3390/chemosensors12070127
Submission received: 8 June 2024 / Revised: 25 June 2024 / Accepted: 1 July 2024 / Published: 3 July 2024
(This article belongs to the Special Issue Chemical Sensors Based on Low-Dimensional Semiconductors)

Abstract

:
Practical gas–liquid interfacing is paramount in microfluidic technology, particularly in developing microfluidic gas sensors. We have created an easily replicable membrane-based closed microfluidic platform (MB-MP) to achieve in situ gas–liquid contact for low-resource settings. We have fabricated the MB-MP using readily available materials like double-sided tape or parafilm without conventional soft lithographic techniques. The response characteristics of the MB-MP are studied using CO2 as the model gas and bromothymol blue dye as the sensing material. The dye’s color change, indicative of pH shifts due to CO2 absorption, is captured with a digital microscope and analyzed via the ImageJ software package v1.54g. The response shows saturation and regeneration parts when cycled between CO2 and N2, respectively. Experiments are conducted to investigate the response characteristics and saturation rate under different conditions, including changes in volumetric flow rate, gas stream velocity, and dye solution volume. We observe experimentally that an increase in volumetric flow rate decreases the delay and increases the saturation rate of the response, surpassing the impact of the gas stream’s increased velocity. Furthermore, increasing the dye volume results in an exponential decrease in the saturation rate and an increase in the delay. These insights are essential for optimizing the platform’s response for point-of-use applications.

1. Introduction

Microfluidics has found wide applications in the field of sensors. Microfluidics has been widely used to develop liquid sensors for detecting biological analytes [1,2,3,4,5], heavy metal ions [6,7,8,9,10], and other contaminants [11,12,13,14,15]. Recently, the use of microfluidics has expanded to gas sensing. For example, it plays a crucial role in the development of various types of gas sensors [16,17], including metal oxide semiconductor sensors [18,19,20], sensors based on surface-enhanced Raman spectroscopy [21,22,23], electrochemical sensors [24,25,26], and field-effect transistor-based sensors [27].
The use of liquid electrolytes in microfluidics-based gas sensors has been limited due to the inherent challenge of achieving gas–liquid contact, even though highly sensitive liquid materials for use as capture materials in gas sensors exist, such as ionic liquids, which can be specifically tailored for increased selectivity towards certain gases [26,28,29,30]. However, their application in microfluidic-based gas sensors is constrained due to difficulties in facilitating gas–liquid contact within the microfluidic framework. This obstacle has been circumvented by designing gas sensors based on an open microfluidic architecture. This design features microfluidic channels exposed to the ambient atmosphere, wherein the liquid is retained within these channels under both flow and stationary conditions by the liquid’s surface tension at the free surface interface [21]. Piorek et al. developed a surface-enhanced Raman scattering (SERS)-based microfluidic gas sensor that uses a colloidal solution of silver nanoparticles as the sensing material to detect 4-amino benzene thiol [22]. The target analyte in the air diffuses through the liquid and comes in contact with the colloidal particles in the solution, producing a characteristic SERS peak. Hussain et al. have developed an open microfluidics-based gas sensor containing an array of microfluidic channels in gold microdisk electrodes for detecting hydrogen gas using ionic liquids [24]. In this case, the ionic liquid, which acts as the sensing material and the electrolyte, is drop-cast on the microchannel array. The hydrogen gas in the atmosphere (target gas in this case) diffuses through the ionic liquid. It reacts with the anions in the ionic liquid to undergo a redox reaction, and the corresponding current can be detected using cyclic voltammetry (CV) or amperometry. However, there are two main limitations associated with open microfluidics-based architecture: (1) The target analyte present in the atmosphere needs to diffuse through the air to come in contact with the liquid sensing material, which can decrease the sensitivity and response time of the gas sensor. (2) An open microfluidics-based architecture can be used as an experimental setup to achieve gas–liquid contact, but it is not a practical design from a commercialization point of view as there are constraints in installing this design for use in different applications.
An alternative approach to developing gas–liquid contact in microfluidics-based gas sensors is bubble/droplet-based microfluidics technology [31,32]. In bubble-based microfluidics technology, liquid and gas streams intersect at a T-junction to produce bubbles in a continuous liquid phase. Leveraging this phenomenon, Bulbul et al. developed a bubble-based microfluidic gas sensor for discriminating between different gases based on the size of the bubbles in the liquid stream [31,33]. However, a principal constraint of this design and its detection methodology is the prerequisite for the target gas to be isolated from the gaseous mixture before its detection. Similarly, in droplet-based microfluidic systems, as in bubble-based microfluidics, droplet formation is facilitated through the controlled flow of liquids (mixed with reactants) and gases via a T-Junction [32,34]. However, a gas or another immiscible fluid assumes the role of the continuous phase, while liquids constitute the dispersed phase. The liquid droplets thus generated act as microreactors for capturing gas vapors. Tirandazi et al. developed a droplets-based microfluidics platform for detecting ammonia using Nessler’s reagent [32]. However, the development of such sensors is complicated as it requires the development of intricate devices featuring precision-engineered junctions, coupled with the need for precise control over fluid dynamics and surface chemistry [35]. Further, such sensors can only be used for colorimetric or non-traditional detection methods, which tend to be less selective and sensitive. Thus, there is a tremendous need to develop gas–liquid contact in microfluidic devices for gas-sensing applications.
Researchers have used a hydrophobic membrane to achieve gas–liquid contact in microfluidic platforms by separating liquid and gas microchannels. Several studies have been performed to enhance the mass transfer across the gas–liquid interface [36,37,38,39]. Femmer et al. have developed a microfluidic platform with a staggered herringbone mixer (SHM) [36]. Compared to a straight microchannel, using a liquid microchannel with SHM increased the mass transfer of oxygen. Jani et al. used a micro-grooved hydrophobic membrane, which provided a shear-free gas–liquid interface, thereby reducing the mass transfer limitations [38]. Malankowska et al. developed a microfluidic platform with a meander-shaped double-sided membrane contactor for blood oxygenation [39]. The oxygen transfer efficiency is increased by increasing the oxygen concentration in the feed gas stream, decreasing the membrane thickness, and reducing the liquid microchannel width. In all of these studies, both the liquid and gas streams are in a dynamic state. These works focus on applications such as blood oxygenation and gas capture/removal, where the liquid feed needs to be continuously replenished. However, if regeneration is possible, liquid replenishment may not be necessary for gas-sensing applications. Hence, the liquid will be stationary in such systems, with continuous gas flow through the gas microchannel. A thorough exploration of the dynamics of such a system is imperative. This can fundamentally change the gas–liquid dynamics across the membrane, which is studied in detail here.
To this end, a membrane-based microfluidic platform (MB-MP) is developed in this manuscript to achieve gas–liquid contact where the liquid is in a stationary phase. This platform markedly differs from the traditional open microfluidic and bubble/droplet-based systems, as it incorporates a hydrophobic membrane between gas and liquid microchannels to achieve in situ gas–liquid contact. Such an architecture allows the construction of a closed-microfluidic platform using readily available materials like double-sided tape or parafilm, as shown in this manuscript, eliminating the necessity for conventional soft lithography techniques. Previous sensors built out of these materials have been used to sense emerging contaminants in water and biomolecules in biofluids [1,6,11]. The response characteristic of MB-MP is studied in detail to understand and optimize for any transport limitations present in the platform due to the introduction of the membrane. A mass flow controller setup is developed to precisely control the gas concentration and flow rate to achieve an active flow through the microfluidic platform and facilitate this investigation. CO2 is used as the model target gas for this study, and an aqueous solution of bromothymol is used as the sensing liquid. A digital microscope recorded the color change in the bromothymol blue solution due to the CO2 absorption; subsequent image analysis is used to quantify the sensor’s response. Interestingly, two response characteristics are observed when cycling between CO2 and N2, namely the saturation and regeneration phases, which can be attributed to the absorption and stripping of CO2 from the liquid. Further, understanding the effect of gas volumetric flow rate, gas stream velocity, and dye volume on the sensor’s response elucidated the transport limitations and provided insights into their optimization. The fundamental insights obtained here will be used to optimize the response of MB-MP to detect toxic gases and volatile organic compounds (VOCs) while having a small footprint. This will allow us to interface this gas–liquid microfluidic sensor with other spectroscopic methods like electrochemical/optical strategies. Further, this paves the way for using highly sensitive liquids like room temperature ionic liquids with micro-electrodes for electrochemical detection.

2. Materials and Methods

2.1. Reagents and Instruments

Standard glass slides (product no: 1301, Globe Scientific, Mahwah, NJ, USA) for assembling the device are obtained from Fisher Scientific. Hydrophobic Polytetrafluoroethylene (PTFE) membranes (product no: RS40413) with a pore size of 0.45 µm and thickness of 200 µm were obtained from Tisch Scientific, Cleves, OH, USA. Double-sided pressure-sensitive tape with thicknesses of 25 µm (ARclear 44110), 51 µm (ARclear 42020), 81 µm (ARcare 90445Q), and 140 µm (ARcare 90106NB) was obtained from Adhesives Research, Glen Rock, PA, USA and used to fabricate the microchannel. Parafilm M with a thickness of 130 µm was obtained from Sigma-Aldrich, St. Louis, MA, USA and also used to fabricate microchannels. The 0.04% Bromothymol blue solution was obtained from Aldon Corporation, Avon, NY, USA via amazon.com. Loctite epoxy resin and hardener used to make epoxy glue was purchased from amazon.com. Nitrogen (N2, ultra-high purity) and carbon dioxide (CO2, bone dry) were obtained from Airgas, Levittown, PA, USA. MKS G-series mass flow controllers control the flow and concentration of gases. Polypropylene plastic tubing with 1/8-inch inner diameter (ID) and 1/4-inch outer diameter (OD) purchased from McMaster-Carr, Robbinsville, NJ, USA were used for connecting the MFCs. Push-to-connect valves (product no: 4717N12) used in the MFC setup were purchased from McMaster-Carr. The syringe pump, NE-1000, used to inject the bromothymol blue solution into the microfluidic channel was obtained from New Era Pump Systems INC, East Farmingdale, NY, USA. The 3 mL BD Luer-lock syringe used to contain the bromothymol blue solution was obtained from Fisher Scientific, Waltham, MA, USA. Luer lock compatible with 1/16-inch ID tubing was obtained from Amazon. The 1/16-inch ID, 3/16-inch OD Tygon tubing (product no: 6516T62) made of PVC plastic was obtained from McMaster-Carr and used to connect the syringe to the microfluidic platform. Plastic barbed tube fittings compatible with 1/16-inch ID tubing (product no: 5117K41) obtained from McMaster-Carr were modified to be used as inlet and outlet ports for liquid and gas microchannels. Elikliv Digital Microscope purchased from amazon.com was used to record color changes in the dye solution due to gas permeation.

2.2. Structure and Fabrication of Membrane-Based Microfluidic Platform

The structure of the membrane-based microfluidic platform is shown in Figure 1a. The bottom glass substrate has an inlet and outlet port for injecting the electrolyte/liquid sensing material. The second layer is a microfluidic channel in a double-sided tape or parafilm substrate for confining the liquid sensing material. The third layer is a hydrophobic PTFE membrane, which will prevent the outflow of the liquid from the bottom microchannel while allowing the gas to come into contact with the sensing material. The fourth layer is again a microfluidic channel that enables the flow of gases. The top layer is a glass substrate with an inlet and outlet port for injecting the gases into the top microfluidic channel.

2.2.1. Fabrication Using Double-Sided Tape

The fabrication steps involved in creating the MB-MP using double-sided tape are shown in Figure S1. Initially, inlet and outlet holes are drilled into the top and bottom glass slide using a 1 mm drill bit. Then, a microchannel with a width of 500 µm, thickness of 140 µm, and length of 2.54 cm is cut into a strip of double-sided tape using the Cricut machine. This is then affixed to the bottom glass substrates so that the inlet and outlet holes fall within the microfluidic channel. Then, the top layer of the double-sided tape is peeled off, and a hydrophobic PTFE membrane is placed on top of the microchannel. It is important to note that the hydrophobic PTFE membrane used has a polypropylene (PP) support layer, creating sides with different textures. The side with the soft texture is PTFE and has better hydrophobicity than the rough texture/PP side. The PTFE side should face the liquid side to ensure that the liquid remains confined in the fluid channel. Next, the double-sided tape with gas microchannel is placed on the top of the membrane to align the top and bottom microchannel perfectly. To assist the alignment, a light illuminates from the bottom so that the edges of the bottom microchannel can be seen through the membrane. Finally, the top glass slides with the holes for inlet and outlet ports are affixed on top of the gas microchannel so the holes align within the microchannel. During this step, pressure is exerted by hand throughout the glass slide to ensure the tightness of the chip. After this step, the flow ports (with 1 mm opening) for the inlet and outlet are fixed on the top and bottom glass slide using double-sided tape. Finally, the entire device is sealed using epoxy glue (epoxy resin and hardener mixed in a 1:1 ratio) to enhance the tightness of the chip.
Double-sided tape with 4 different thicknesses is available: these are 25 µm, 51 µm, 81 µm, and 140 µm. MB-MP with different gas or liquid microchannel thicknesses is prepared either by using double-sided tape with these different inherent thicknesses or by stacking multiple strips of double-sided tape together. For example, MB-MP with a 25 µm thick liquid microchannel is obtained by using a double-sided tape with an inherent thickness of 25 µm. On the other hand, MB-MP with a 280 µm thick gas microchannel is obtained by stacking two strips of 140 µm thick double-sided tape. All the MB-MPs in this manuscript are developed by utilizing double-sided tape of varying thicknesses, which facilitates precise control over the thickness of gas/liquid microchannels.

2.2.2. Fabrication Using Parafilm

Li et al. previously showed that parafilm can create microfluidic channels and devices [40,41]. For the first time, this manuscript shows how to make a membrane-based microfluidic platform using parafilm. The steps in assembling different layers in the parafilm-based membrane device are like those discussed in the previous section. Once the other layers are aligned, the device is put on top of a hot plate at 70 °C for 6 min, and throughout the process, constant pressure is applied using a 500 g weight. This ensures that the wax in the parafilm melts and binds the different layers, thereby holding the device together. It is important to note that to achieve a proper seal between the gas microchannel layer and the liquid microchannel layer, the width of the membrane should be as small as possible. Using parafilm to fabricate MB-MP will simplify the alignment of the liquid and gas microchannels in contrast to double-sided tape. Double-sided tape adheres immediately upon contact with a surface, prohibiting any alignment adjustments. Conversely, parafilm does not adhere entirely upon contact with a surface, thereby permitting corrections in alignment. Nonetheless, the downside of using parafilm is the additional heating step required in the fabrication process, which may lead to slight deformations in the microchannel.

2.3. Leak Test and Gas Permeation Study

Bromothymol blue dye is introduced into the liquid microchannel and observed for micro leaks using a digital microscope to conduct the leak test. This dye also serves as a pH indicator, exhibiting a transition pH range from 6 to 7.6, and is utilized in conducting gas permeation studies. Initially, a 0.04% bromothymol blue solution with a pH of 7 is injected into the liquid microchannel, introducing CO2 through the gas microchannel. The diffusion of CO2 across the membrane and its dissolution in the solution results in a color transition of the indicator from greenish blue to yellow. This color change is attributed to the formation of carbonic acid, a product of CO2 interaction with water molecules, leading to a reduction in the pH of the solution [42,43]. The chemical equation for this process is presented below [44,45].
C O 2 + H 2 O H 2 C O 3 H C O 3 + H +

2.4. Response Characteristics

The sensor’s response characteristics are studied using a mass flow controller setup, a digital microscope, and an image analysis algorithm. The following section explains these three components.

2.4.1. Mass Flow Controller and Digital Microscope Setup

The experimental setup used for the experiments is shown in Figure 2. In this setup, there are three mass flow controllers (MFCs). MFC 1 is connected to the N2 cylinder, and MFC 2 is connected to the CO2 cylinder. The concentration of CO2 can be controlled by adjusting the flow rates of MFC 1 and MFC 2. MFC 3 controls the flow rate of the gas stream entering the microfluidic platform. The full-scale flow rate of MFC 3 is from 1 to 10 sccm, and the lowest flow rate achievable is 2% of the full-scale flow rate. All three mass flow controllers are connected to a computer via ethernet and controlled using a LabView interface. A three-way valve is placed just before the microfluidic platform. In the experiments performed in the manuscript, the gas stream flows through the microfluidic system when the valve is opened. This reduces the time it takes for the gas to reach the microfluidic platform, thereby reducing the system delay. Before passing any gas through the microfluidic platform, the liquid microchannel is filled with bromothymol blue solution (with pH 7) with the help of the syringe pump. Once the microchannel is filled, the pumping is stopped. The bromothymol blue solution’s color change (as CO2 passes through the gas microchannel) is recorded using a digital microscope. The entire microfluidic platform is placed inside a black box to avoid interference from other light sources.

2.4.2. Video and Image Analysis

The video and image analysis uses Adobe Media Encoder v24.5 and ImageJ software v1.54g. This analysis is schematically shown in Figure S2. Initially, the digital microscope-captured video is processed through Adobe Media Encoder to decompose it into discrete frames at 25 frames per second. Subsequently, every 25th frame of this sequence is imported into the ImageJ software package as an image sequence. This sequence then undergoes a cropping procedure, ensuring the focus remains solely on the region of interest, specifically the microchannel containing the bromothymol blue solution. Following this, the cropped sequence, comprising RGB images, is split into its constituent channels—red, green, and blue. The subsequent step involves calculating the mean pixel value for the frames attributed to the red channel. This value serves as an indicator of the average pixel intensity within a designated region. The sensor’s response is visualized as a plot depicting the mean pixel value against frame number or time.

3. Results and Discussion

The results of the leak test are shown in Figure 1b,c. Figure 1b shows the liquid microchannel filled with bromothymol blue solution, and Figure 1c shows the magnified image of the liquid microchannel. From the magnified image, it is clear that there are no micro leaks in the liquid microchannel. Next, CO2 is passed through the gas microchannel to perform the gas permeation test. The color of the dye changes from green to yellow, as shown in Figure 1c,d, suggesting the effective gas permeation through the membrane.

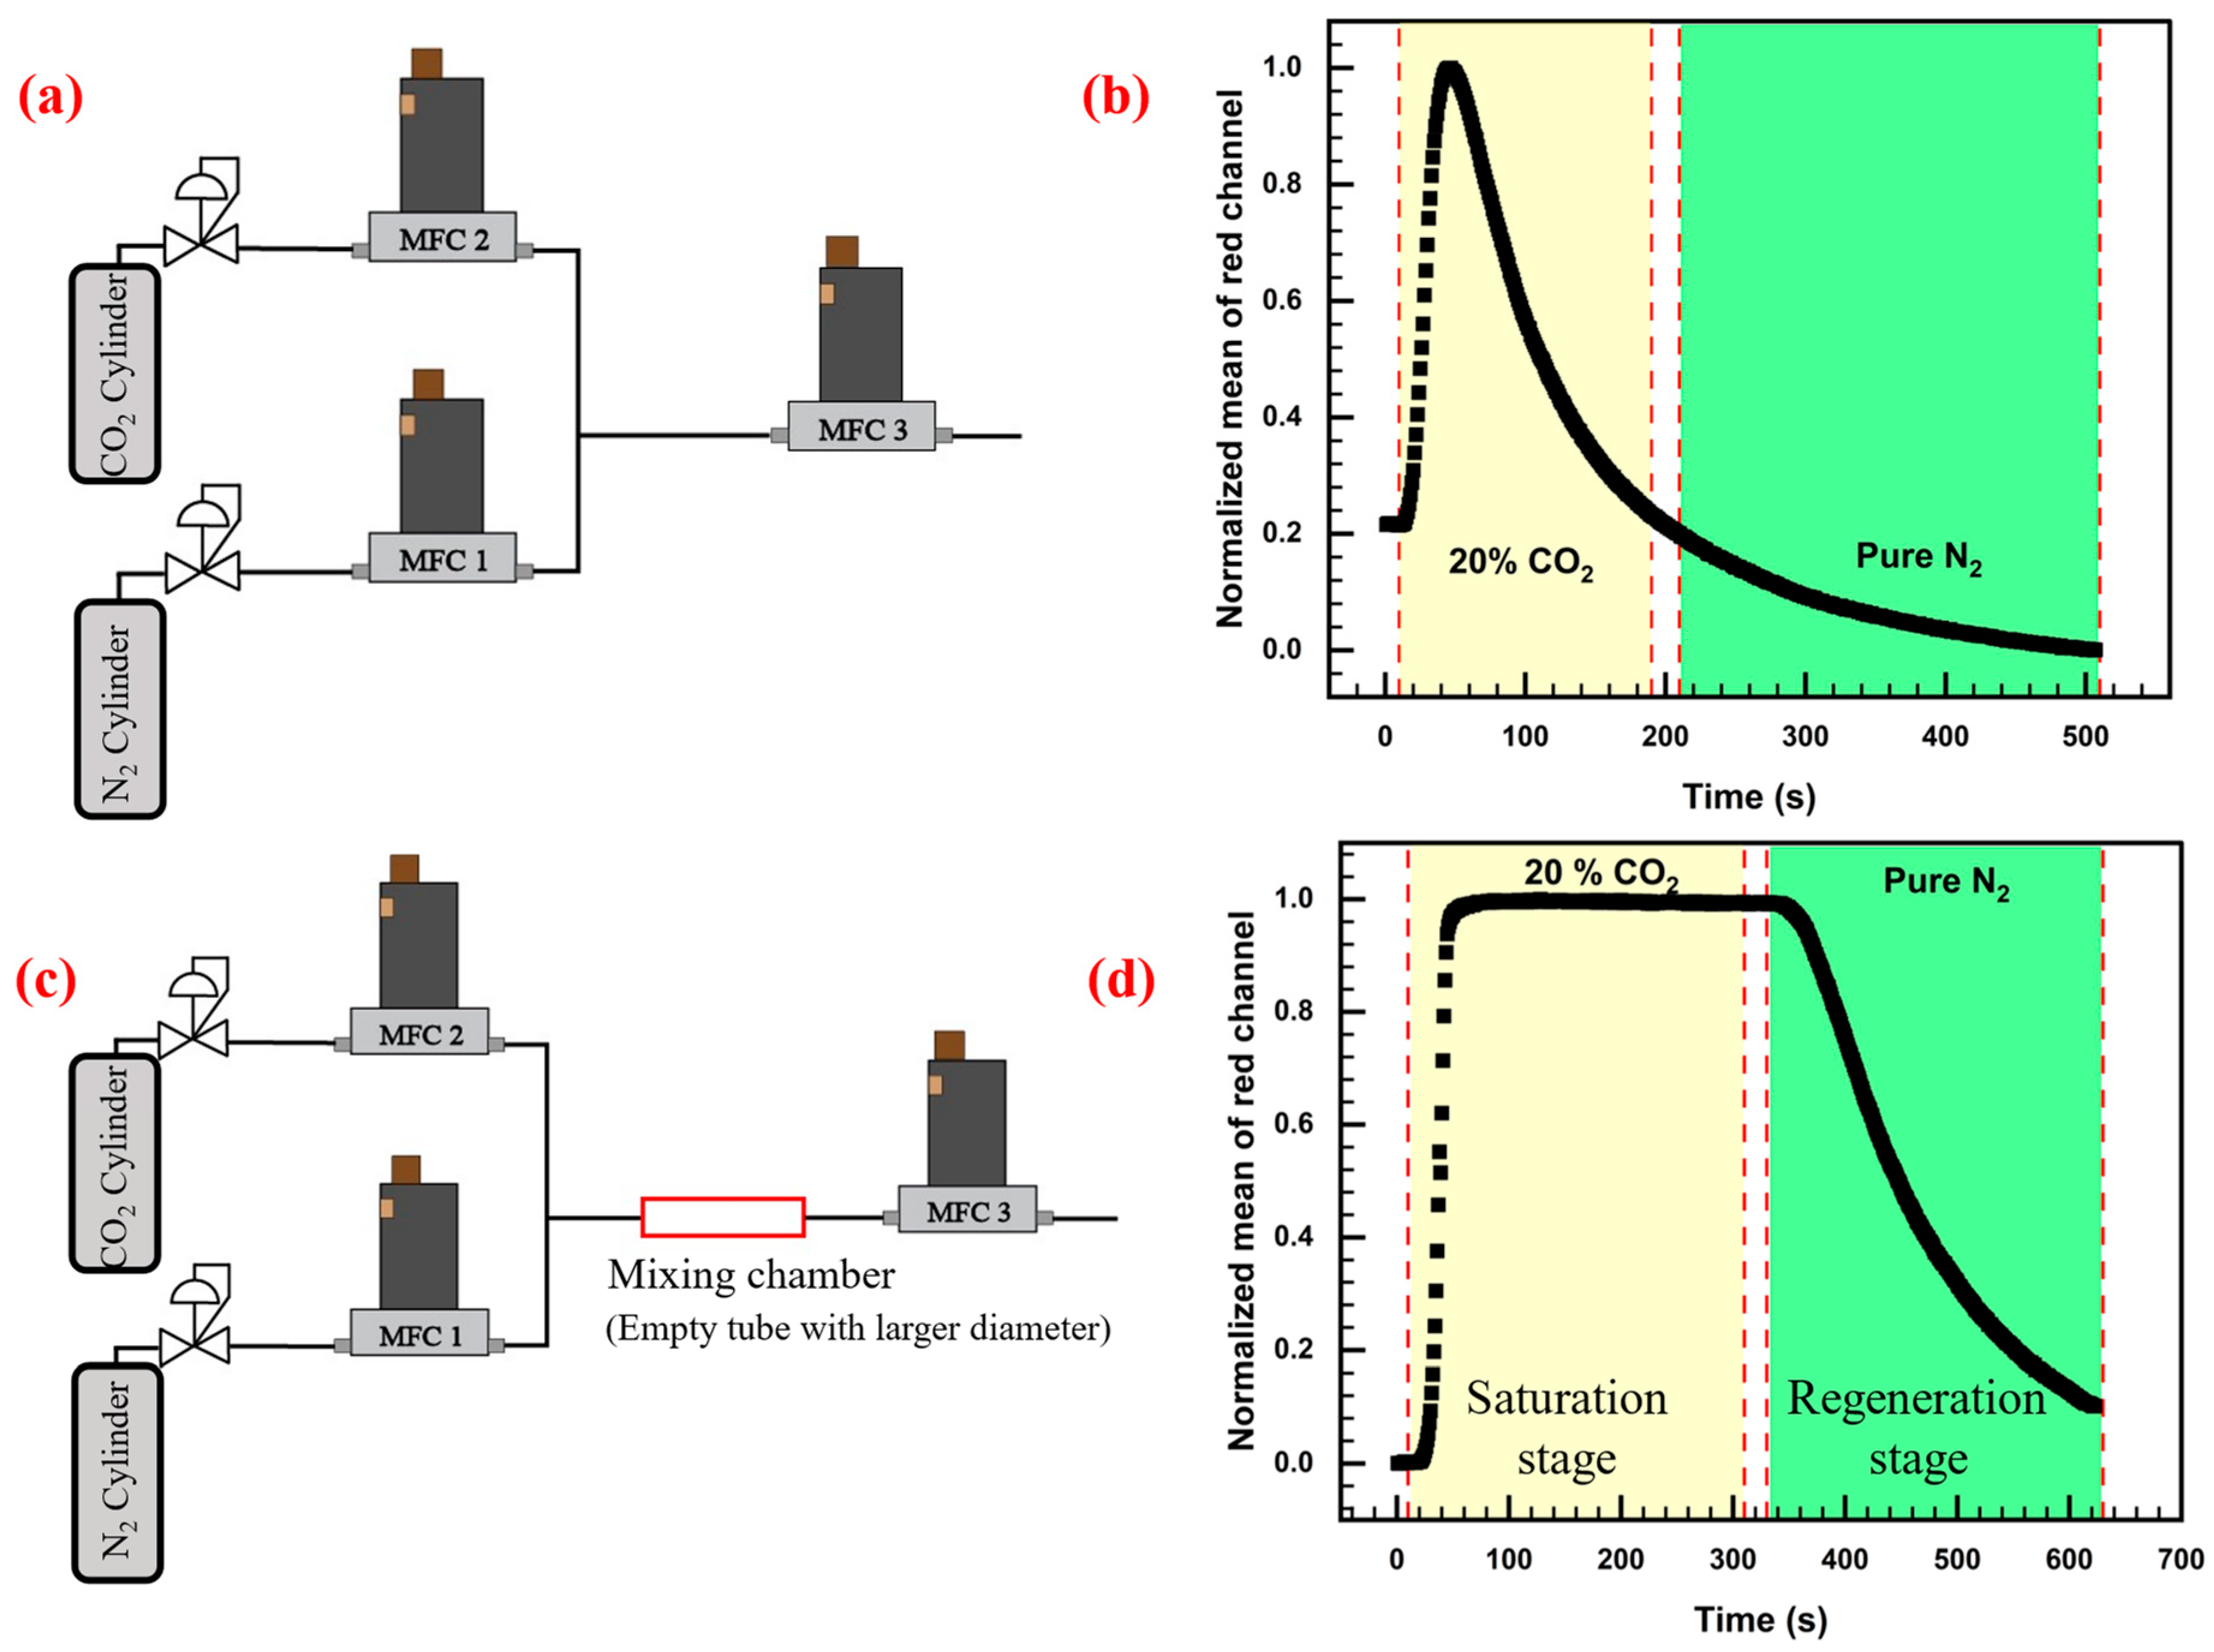
3.1. Gas Mixing Problem

It is interesting to note that gas mixing emerged as a significant problem. This potential problem can occur when the target gas is mixed with inert gas to develop calibration curves. Also, most research papers do not discuss this problem when describing MFC setups. Initially, an experiment is performed using the MFC setup shown in Figure 3a, where 20% CO2 is passed through the microfluidic platform (containing bromothymol blue solution) for 3 min, followed by pure N2. The result obtained after the image analysis is shown in Figure 3b. Passing 20% CO2 through the microfluidic device is expected to change the color of bromophenol blue to yellow for the first 3 min and then change to green as the N2 replaces the CO2 dissolved in the bromophenol blue. However, though the color initially changed to yellow, it changed to green even while 20% CO2 passed through the microfluidic platform. This signifies that the gas is not mixed correctly when it enters the microfluidic platform. Knowing how the MFCs are operated is imperative to understand this mixing problem. First, the MFC 2 corresponding to CO2 is opened as it has the lowest flow rate. Then, MFC 1 corresponding to N2 is opened immediately. Then, MFC 3 is opened, and the gas flows through the microfluidic platform. Since MFC 2 is opened first, the CO2 in the tube passes through the microfluidic platform to produce the initial change in color. However, since there is no proper gas mixing between CO2 and N2 and as the volumetric flow rate of N2 is significantly higher than CO2, only N2 passes through the gas microchannel, causing gas stripping (explained in Section 3.2). In gas stripping, the color of the dye changes to green. The issue of gas mixing arises from the notably low Reynolds number (~2), which can be attributed to the small diameter of the tube (~3 mm). This can be resolved by employing a tube with a larger diameter that promotes gas mixing. In this case, a tube with a 14.7 mm diameter and 120 mm length having a Reynolds number of 10 is sufficient to promote efficient mixing. The setup with this mixing chamber (empty tube) and the response of the microfluidic platform are shown in Figure 3d. It is worth noting in Figure 3d that after using the mixing chamber, there is no change in the dye color once it reaches saturation unless pure nitrogen is passed through the system.

3.2. Response Characteristics of the Sensor

The characteristic response of the sensor obtained using image analysis is shown in Figure 3d. This type of response is expected in gas sensors and is reported in many works [20,24,46,47]. The sensor response has two stages when cycling between CO2 and N2, namely saturation and regeneration, as shown in Figure 3d. In the saturation stage, the CO2 from the gas microchannel diffuses through the membrane and dissolves in the aqueous solution with pH 7. The reaction of CO2 with H2O produces carbonic acid, decreasing the pH of the aqueous solution and changing the indicator’s color from green to yellow. The transition in color captured using the digital microscope and quantified by image analysis produces the saturation stage shown in Figure 3d (yellow region).
However, when N2 is introduced into the microfluidic system, the dye slowly reverts to its original color, as shown in Figure 3d (green region). It is hypothesized that this is due to the process called gas stripping. Gas stripping occurs when inert gases like N2 are passed through a gas–liquid interface; it removes the dissolved gas from the liquid [48]. It is important to note that there is an inevitable time delay in both the saturation and stripping stages. The delay and rate of change can be quantified for both the saturation and the stripping stages by fitting the response of each stage separately using a sigmoid function. The rationale for employing the sigmoid function stems from its resemblance to the observed response characteristics. The specific sigmoid function used is given by Equation (1).
y = a 1 + e k t t c
Here, k is the slope of rise/fall seen in the response in Figure 3d and represents the rate at which saturation/regeneration occurs. a is the final value the function achieves after the rise or fall, t is the time, and tc is the offset or delay in the response.
It is imperative to note that multiple processes, including transport and reaction rate-limiting steps, can cause a delay and lead to a finite rate (as opposed to instantaneous saturation). The transport limitations include the following: (i) The finite time the gas stream takes to reach the microfluidic platform. This should chiefly affect the offset tc and significantly contribute to the delay. (ii) The gas stream’s volumetric flow rate will affect the k and tc. (iii) The residence time of the gas stream in the gas microchannel. The greater the residence time, the more the gas molecules can diffuse through the membrane and react with the solution. The residence time is inversely proportional to the velocity of the gas stream. (iv) The fourth parameter is the volume of dye solution present in the liquid microchannel. (v) Finally, the time it takes for the gas to diffuse through the membrane. This can be calculated using the equation t = l2/D, where D is the diffusion coefficient of the CO2 through the membrane and l is the thickness of the membrane. The value of the diffusion coefficient of CO2 through the membrane is generally between 10−5 and 10−6 m2/s, depending on the type and properties of the membrane [49,50]. This gives a t value of 10−3 to 10−2 s. Hence, the delay from the membrane side is expected to be negligible. The reaction rate can also affect the saturation rate and delay in the response. However, experimental observations indicate that the color change in the aqueous bromothymol blue solution after CO2 exposure is nearly instantaneous. Hence, the reaction rate limitations can be neglected.
First, the impact of the volumetric flow rate on k and tc is investigated by recording the response of the MB-MP at various volumetric flow rates. This experiment uses a device with a gas and a liquid microchannel thickness of 140 µm. The results of this experiment are shown in Figure 4a. First, the saturation part of the response is fitted using a sigmoid function (shown in Figure S3), and the values of k (rate of saturation) and tc (delay in response) are obtained. The results of this are shown in Figure 4b,c. As the flow rate increases, the k increases following a quadratic trend, as shown in Equation (2).
k 1 = 0.02 0.012 x + 0.008 x 2
Here, k1 is the saturation rate as a function of the flow rate, x. Based on this trend, increasing the flow rate further could increase the saturation rate significantly. However, it is noted experimentally that gas flow rates above 10 sccm would push the liquid out of the liquid microchannel. Hence, in this case, even though the optimum flow rate could be above 10 sccm, technical constraints hinder its attainment. As for the delay parameter tc, it shows an exponential decay as the flow rate increases, eventually converging to an asymptotic value at 10 sccm. This trend is described using Equation (3).
t c 1 = 50.97 + 135.76 e x / 2.51
Here, tc1 is the delay as a function of flow rate, x. It is important to note that the volumetric flow rate and velocity are related by the equation Q = A × v, where Q is the volumetric flow rate, A is the cross-sectional area of the gas microchannel, and v is the velocity of the gas stream. This equation is valid in this situation due to the established understanding that compressibility effects are negligible in fluid flow scenarios characterized by a Mach number less than 0.3 [51,52,53]. In the present case, the highest Mach number computes to 0.6/342 = 0.001 (at 10 sccm volumetric flow rate or 0.6 m/s velocity), thus validating the use of equation Q = A × v. According to the equation, increasing the volumetric flow rate increases the velocity of the gas stream. An increase in velocity decreases the residence time of the gas stream in a gas microchannel, which should increase the delay and decrease the saturation rate. However, as this is not observed, it indicates that the influence of an increased volumetric flow rate supersedes the effects attributable to an increased velocity.
The regeneration stage of the response can also be expressed as a sigmoid function. Even though the offset shows an exponential decay with an increase in flow rate (Figure 4d), the rate does not follow any trend. However, from Figure 4a, it is clear that the regeneration process occurs more rapidly as the flow rate increases. During the experiments, it is observed that the regeneration stage does not show enough reproducibility to accurately quantify the rate and delay in regeneration. This could be due to the poor response of the dye to the regeneration process (due to high sensitivity to CO2) or due to the variations in pore distribution between different membrane samples, which need to be analyzed in detail.
Next, the impact of gas stream velocity on the k and tc is investigated by varying the gas microchannel thickness while maintaining a constant volumetric flow rate of 10 sccm and a liquid microchannel thickness of 140 µm. The velocity of the gas stream changes as v = Q/A, where v, Q, and A are the velocities, volumetric flow rate, and area of the microchannel cross-section, respectively. The increase in the gas microchannel thickness increases the cross-sectional area, which results in a concomitant decrease in the velocity of the gas stream, as shown in Figure 5b. The response of the microfluidic platform with different gas microchannel thicknesses is shown in Figure 5a. Each response is fitted using the sigmoid function (shown in Figure S4) to extract the values of k and tc. As shown in Figure 5c, increased gas velocity decreases the rate at which the MB-MP reaches saturation. It is found that the saturation rate shows an exponential decrease as the velocity of the gas stream increases, eventually reaching an asymptotic value at 102 µm gas microchannel thickness. This trend is demonstrated by Equation (4).
k 2 = 0.37 + 2.11 e v / 0.46
Here, k2 is the saturation rate as a function of velocity, v. Further, the offset/delay increases linearly with an increase in velocity, as shown in Equation (5).
t C 2 = 48.97 + 7.18 v
Here, tc2 is the delay as a function of velocity, v. An increase in velocity is expected to lead to a concomitant decrease in the residence time of the gas stream in the gas microchannel. This leads to increasing resistance to the diffusion of CO2, increasing the delay, and decreasing the saturation rate of the response.
Finally, the impact of the volume of the dye on the saturation rate, k, and delay, tc, is studied by varying the thickness of the liquid microchannel. The result of this experiment is shown in Figure 6a. It should be noted that altering the width of the liquid microchannel is not feasible, as this would necessitate a corresponding change in the width of the gas microchannel, impacting the gas stream velocity. The values of k and tc are obtained by fitting the response of the saturation region with a sigmoid function (Figure S5), as shown in Figure 6b. The saturation rate shows an exponential decrease as the volume of the microchannel increases, reaching an asymptotic value. This trend is given by Equation (6).
k 3 = 0.17 + 2.58 e V / 0.51
Here, k3 is the saturation rate as a function of the volume of liquid, V. Further, increasing the volume of liquid microchannel increases the delay in response, as shown in Figure 6b. With increasing volume, more CO2 is needed to saturate the liquid. Since the gas flow rate is constant (for different liquid microchannel volumes), it takes more time to start and complete the saturation process. It can be clearly understood from the regeneration part of the response that the higher the volume, the greater the time it takes for the liquid to regenerate. This is expected since the amount of dissolved CO2 that needs to be stripped from a saturated solution increases as the volume of the liquid increases.

4. Conclusions

This work presents the development of a closed microfluidic platform to achieve in situ gas–liquid contact, followed by studying response characteristics to understand and optimize transport limitations. The platform uses readily available materials like parafilm/double-sided tape without conventional soft lithographic techniques. In situ gas–liquid contact is achieved by separating the gas and the liquid microchannel by a hydrophobic gas-permeable PTFE membrane. CO2 is used as the model gas, and an aqueous solution of bromothymol blue is used as the colorimetric sensing liquid for analyzing the response characteristics of the sensor. The sensor’s response showed a saturation and a regeneration stage when cycled between CO2 and N2. The saturation stage is attributed to the diffusion of CO2 through the membrane, followed by its dissolution in the liquid. Meanwhile, it is postulated that the regeneration phase results from gas stripping phenomena due to the flow of N2. An analysis of the saturation stage reveals several vital findings: (i) Increasing the volumetric flow rate from 2 to 10 sccm leads to a quadratic increase in the saturation rate and an exponential decrease in the delay of the sensor. Further, the effect of increased volumetric flow rate supersedes the impact attributable to an increase in the velocity or decrease in the residence time of the gas stream. (ii) Increasing the velocity of the gas stream by keeping the volumetric flow rate constant decreases the saturation rate exponentially and shows a linear increase in the delay. This is because of the decrease in residence time of the gas stream, which decreases the diffusion rate. (iii) Similarly, increasing the dye volume decreases the saturation rate exponentially and increases the delay in the sensor. (iv) The diffusion limitation associated with the membrane can be neglected as the diffusion time of CO2 through the membrane is calculated to be in the range of 10−3 to 10−2 s, which is much less compared to the delay in response of the sensor. The regeneration stage followed a similar trend except for some outliers. Thus, the transport limitations can be minimized, and an optimum sensor response can be obtained by increasing the volumetric flow rate and decreasing the gas stream’s velocity and the dye solution’s volume.

Supplementary Materials

The following supporting information can be downloaded at: https://www.mdpi.com/article/10.3390/chemosensors12070127/s1, Figure S1: Image sequence describing the assembly of the membrane-based microfluidic platform. (a) Cutting the Microchannels in double-sided tape using a Cricut machine. (b) Cleaned glass slides (with holes for inlet and outlet), double-sided tape, and hydrophobic PTFE membrane. (c) Double-sided tape stuck to the glass slides. One acts as a microchannel for gas flow. The other microchannel is used to contain the liquid. (d) PTFE membrane (with the smooth side facing the liquid microchannel) is stuck to the double-sided tape with the liquid microchannel. (e) Glass slide containing the gas microchannel is aligned with the liquid microchannel and stuck together. (f) Flow ports are placed in the inlets and completely sealed using epoxy; Figure S2: Schematic of image analysis; Figure S3: Results from fitting (with sigmoid function) the saturation part of the response produced by flow rate (a) 2 sccm, (b) 4 sccm, (c) 6 sccm, (d) 8 sccm, and (e) 10 sccm; Figure S4: Results from fitting (with sigmoid function) the saturation part of the response produced by a device with gas microchannel thickness (a) 102 µm, (b) 140 µm, (c) 280 µm, and (d) 420 µm; Figure S5: Results from fitting (with sigmoid function) the saturation part of the response produced by a device with liquid microchannel thickness (a) 25 µm, (b) 81 µm, (c) 140 µm, and (d) 280 µm.

Author Contributions

Conceptualization, S.K. and S.B.; methodology, S.K. and S.B.; investigation, S.K. and N.N.K.; writing—original draft preparation, S.K. and N.N.K.; writing—review and editing, S.K., N.H.M. and S.B.; visualization, S.K. and N.H.M.; supervision, S.B.; project administration, S.B.; funding acquisition, S.B. All authors have read and agreed to the published version of the manuscript.

Funding

This manuscript is supported by Sagnik Basuray’s NSF grant # 1751759, Career: “ASSURED” electrochemical platform for multiplexed detection of Cancer Biomarker Panel using Shear Enhanced Nanoporous Capacitive Electrodes; NJIT 2022 Technology Innovation Translation and Acceleration (TITA) Program Seed Grant Award; a DHS SBIR Phase II grant, #DHS221-001 “Low-cost Diagnostic for Animal and Zoonotic Diseases”; USGS Grant, #G23AC00115 “A rapid, robust, cost-effective field-based platform technology for the selective and sensitive determination of PFAS in source water”.

Institutional Review Board Statement

Not applicable.

Informed Consent Statement

Not applicable.

Data Availability Statement

The data presented in this study are available on request from the authors.

Conflicts of Interest

The authors declare no conflicts of interest.

References

  1. Cheng, Y.-H.; Kargupta, R.; Ghoshal, D.; Li, Z.; Chande, C.; Feng, L.; Chatterjee, S.; Koratkar, N.; Motkuri, R.K.; Basuray, S. ESSENCE–A rapid, shear-enhanced, flow-through, capacitive electrochemical platform for rapid detection of biomolecules. Biosens. Bioelectron. 2021, 182, 113163. [Google Scholar] [CrossRef] [PubMed]
  2. Cheng, Y.-H.; Chande, C.; Zhenglong, L.; Kaaliveetil, S.; Basuray, S. Sensitive and Selective Determination of multiple Diagnostic Targets using a Modular, ASSURED POC Platform called ESSENCE. In Proceedings of the 2022 IEEE Healthcare Innovations and Point of Care Technologies (HI-POCT), Houston, TX, USA, 10–11 March 2022. [Google Scholar]
  3. Ferguson, B.S.; Buchsbaum, S.F.; Swensen, J.S.; Hsieh, K.; Lou, X.; Soh, H.T. Integrated microfluidic electrochemical DNA sensor. Anal. Chem. 2009, 81, 6503–6508. [Google Scholar] [CrossRef] [PubMed]
  4. Robin, P.; Barnabei, L.; Marocco, S.; Pagnoncelli, J.; Nicolis, D.; Tarantelli, C.; Tavilla, A.C.; Robortella, R.; Cascione, L.; Mayoraz, L.; et al. A DNA biosensors-based microfluidic platform for attomolar real-time detection of unamplified SARS-CoV-2 virus. Biosens. Bioelectron. X 2023, 13, 100302. [Google Scholar] [CrossRef] [PubMed]
  5. Chittuam, K.; Jampasa, S.; Vilaivan, T.; Tangkijvanich, P.; Chuaypen, N.; Avihingsanon, A.; Sain, M.; Panraksa, Y.; Chailapakul, O. Electrochemical capillary-driven microfluidic DNA sensor for HIV-1 and HCV coinfection analysis. Anal. Chim. Acta 2023, 1265, 341257. [Google Scholar] [CrossRef] [PubMed]
  6. Li, Z.; Cheng, Y.-H.; Chande, C.; Chatterjee, S.; Basuray, S. A highly sensitive, easy-and-rapidly-fabricable microfluidic electrochemical cell with an enhanced three-dimensional electric field. Anal. Chim. Acta 2022, 1232, 340488. [Google Scholar] [CrossRef] [PubMed]
  7. Liang, Y.; Ma, M.; Zhang, F.; Liu, F.; Lu, T.; Liu, Z.; Li, Y. Wireless microfluidic sensor for metal ion detection in water. ACS Omega 2021, 6, 9302–9309. [Google Scholar] [CrossRef] [PubMed]
  8. Shen, L.-L.; Zhang, G.-R.; Li, W.; Biesalski, M.; Etzold, B.J. Modifier-free microfluidic electrochemical sensor for heavy-metal detection. ACS Omega 2017, 2, 4593–4603. [Google Scholar] [CrossRef]
  9. Filippidou, M.K.; Kanaris, A.I.; Aslanidis, E.; Rapesi, A.; Tsounidi, D.; Ntouskas, S.; Skotadis, E.; Tsekenis, G.; Tsoukalas, D.; Tserepi, A. Integrated Plastic Microfluidic Device for Heavy Metal Ion Detection. Micromachines 2023, 14, 1595. [Google Scholar] [CrossRef] [PubMed]
  10. Zhou, M.; Li, J.; Yuan, S.; Yang, X.; Lu, J.; Jiang, B. A centrifugal microfluidic system for automated detection of multiple heavy metal ions by aptamer-based colorimetric assay. Sens. Actuators B Chem. 2024, 403, 135210. [Google Scholar] [CrossRef]
  11. Cheng, Y.H.; Barpaga, D.; Soltis, J.A.; Shutthanandan, V.; Kargupta, R.; Han, K.S.; McGrail, B.P.; Motkuri, R.K.; Basuray, S.; Chatterjee, S. Metal–organic framework-based microfluidic impedance sensor platform for ultrasensitive detection of perfluorooctanesulfonate. ACS Appl. Mater. Interfaces 2020, 12, 10503–10514. [Google Scholar] [CrossRef]
  12. Tahirbegi, I.B.; Ehgartner, J.; Sulzer, P.; Zieger, S.; Kasjanow, A.; Paradiso, M.; Strobl, M.; Bouwes, D.; Mayr, T. Fast pesticide detection inside microfluidic device with integrated optical pH, oxygen sensors and algal fluorescence. Biosens. Bioelectron. 2017, 88, 188–195. [Google Scholar] [CrossRef]
  13. Campaña, A.L.; SFlorez, L.; Noguera, M.J.; Fuentes, O.P.; Puentes, P.R.; Cruz, J.C.; Osma, J.F. Enzyme-based electrochemical biosensors for microfluidic platforms to detect pharmaceutical residues in wastewater. Biosensors 2019, 9, 41. [Google Scholar] [CrossRef] [PubMed]
  14. Feng, S.; Lin, Y.; Xu, J.; Lu, X. Inertial microfluidic-assisted rapid detection of chemical contaminant in foods using quantum dots-based molecularly imprinted sensor. Sens. Actuators B Chem. 2023, 394, 134342. [Google Scholar] [CrossRef]
  15. Li, T.; Guo, G.; Xing, H.; Tang, S.; Hu, H.; Wang, L.; Qian, X.; Chen, D. Construction of fluorescent sensor array and three-dimensional microfluidic paper based analytical device for specific identification and visual determination of antibiotics in food. Food Chem. 2023, 429, 136947. [Google Scholar] [CrossRef]
  16. Azhdary, P.; Janfaza, S.; Fardindoost, S.; Tasnim, N.; Hoorfar, M. Highly selective molecularly imprinted polymer nanoparticles (MIP NPs)-based microfluidic gas sensor for tetrahydrocannabinol (THC) detection. Anal. Chim. Acta 2023, 1278, 341749. [Google Scholar] [CrossRef]
  17. Ollé, E.P.; Farré-Lladós, J.; Casals-Terré, J.; Martínez, J.A.L. Enhanced selectivity of a 3D-printed microfluidic gas detector towards different volatile organic compounds (VOCs) for the effective monitoring of indoor air quality in vehicles. Environ. Technol. Innov. 2024, 33, 103481. [Google Scholar] [CrossRef]
  18. Hossein-Babaei, F.; Zare, A.H. The selective flow of volatile organic compounds in conductive polymer-coated microchannels. Sci. Rep. 2017, 7, 42299. [Google Scholar] [CrossRef]
  19. Paknahad, M.; Mcintosh, C.; Hoorfar, M. Selective detection of volatile organic compounds in microfluidic gas detectors based on “like dissolves like”. Sci. Rep. 2019, 9, 161. [Google Scholar] [CrossRef] [PubMed]
  20. Ghazi, M.; Janfaza, S.; Tahmooressi, H.; Tasnim, N.; Hoorfar, M. Selective detection of VOCs using microfluidic gas sensor with embedded cylindrical microfeatures coated with graphene oxide. J. Hazard. Mater. 2022, 424, 127566. [Google Scholar] [CrossRef]
  21. Piorek, B.D.; Lee, S.J.; Moskovits, M.; Meinhart, C.D. Free-surface microfluidics/surface-enhanced Raman spectroscopy for real-time trace vapor detection of explosives. Anal. Chem. 2012, 84, 9700–9705. [Google Scholar] [CrossRef]
  22. Piorek, B.D.; Lee, S.J.; Santiago, J.G.; Moskovits, M.; Banerjee, S.; Meinhart, C.D. Free-surface microfluidic control of surface-enhanced Raman spectroscopy for the optimized detection of airborne molecules. Proc. Natl. Acad. Sci. USA 2007, 104, 18898–18901. [Google Scholar] [CrossRef] [PubMed]
  23. Yang, K.; Zong, S.; Zhang, Y.; Qian, Z.; Liu, Y.; Zhu, K.; Li, L.; Li, N.; Wang, Z.; Cui, Y. Array-assisted SERS microfluidic chips for highly sensitive and multiplex gas sensing. ACS Appl. Mater. Interfaces 2019, 12, 1395–1403. [Google Scholar] [CrossRef] [PubMed]
  24. Hussain, G.; Ge, M.; Zhao, C.; Silvester, D.S. Fast responding hydrogen gas sensors using platinum nanoparticle modified microchannels and ionic liquids. Anal. Chim. Acta 2019, 1072, 35–45. [Google Scholar] [PubMed]
  25. Cha, W.; Tung, Y.-C.; Meyerhoff, M.E.; Takayama, S. Patterned electrode-based amperometric gas sensor for direct nitric oxide detection within microfluidic devices. Anal. Chem. 2010, 82, 3300–3305. [Google Scholar] [CrossRef] [PubMed]
  26. Kaaliveetil, S.; Lee, Y.-Y.; Li, Z.; Cheng, Y.-H.; Menon, N.H.; Dongare, S.; Gurkan, B.; Basuray, S. Ionic Liquid-Packed Microfluidic Device with Non-Planar Microelectrode as a Miniaturized Electrochemical Gas Sensor. J. Electrochem. Soc. 2023, 170, 087508. [Google Scholar] [CrossRef]
  27. Lee, S.H.; Lim, J.H.; Park, J.; Hong, S.; Park, T.H. Bioelectronic nose combined with a microfluidic system for the detection of gaseous trimethylamine. Biosens. Bioelectron. 2015, 71, 179–185. [Google Scholar] [CrossRef] [PubMed]
  28. Rehman, A.; Zeng, X. Methods and approaches of utilizing ionic liquids as gas sensing materials. RSC Adv. 2015, 5, 58371–58392. [Google Scholar] [CrossRef] [PubMed]
  29. Wan, H.; Yin, H.; Mason, A.J. Rapid measurement of room temperature ionic liquid electrochemical gas sensor using transient double potential amperometry. Sens. Actuators B Chem. 2017, 242, 658–666. [Google Scholar] [CrossRef]
  30. Lee, Y.-Y.; Edgehouse, K.; Klemm, A.; Mao, H.; Pentzer, E.; Gurkan, B. Capsules of reactive ionic liquids for selective capture of carbon dioxide at low concentrations. ACS Appl. Mater. Interfaces 2020, 12, 19184–19193. [Google Scholar] [CrossRef]
  31. Bulbul, A.; Kim, H. A bubble-based microfluidic gas sensor for gas chromatographs. Lab A Chip 2015, 15, 94–104. [Google Scholar] [CrossRef]
  32. Tirandazi, P.; Hidrovo, C.H. An integrated gas-liquid droplet microfluidic platform for digital sampling and detection of airborne targets. Sens. Actuators B Chem. 2018, 267, 279–293. [Google Scholar] [CrossRef]
  33. Bulbul, A.; Hsieh, H.C.; Kim, H. Microfluidic bubble-based gas sensor. In Proceedings of the 2014 IEEE 27th International Conference on Micro Electro Mechanical Systems (MEMS), San Francisco, CA, USA, 26–30 January 2014. [Google Scholar]
  34. Huang, S.; Connolly, J.; Khlystov, A.; Fair, R.B. Digital microfluidics for the detection of selected inorganic ions in aerosols. Sensors 2020, 20, 1281. [Google Scholar] [CrossRef] [PubMed]
  35. Bulbul, A.; Hsieh, H.C.; Kim, H. Droplet based microfluidics. Rep. Prog. Phys. 2011, 75, 016601. [Google Scholar]
  36. Femmer, T.; Eggersdorfer, M.L.; Kuehne, A.J.C.; Wessling, M. Efficient gas–liquid contact using microfluidic membrane devices with staggered herringbone mixers. Lab A Chip 2015, 15, 3132–3137. [Google Scholar] [CrossRef] [PubMed]
  37. Malankowska, M.; Martins, C.; Rho, H.; Neves, L.; Tiggelaar, R.; Crespo, J.; Pina, M.; Mallada, R.; Gardeniers, H.; Coelhoso, I. Microfluidic devices as gas–Ionic liquid membrane contactors for CO2 removal from anaesthesia gases. J. Membr. Sci. 2018, 545, 107–115. [Google Scholar] [CrossRef]
  38. Jani, J.M.; Wessling, M.; Lammertink, R.G.H. A microgrooved membrane based gas–liquid contactor. Microfluid. Nanofluidics 2012, 13, 499–509. [Google Scholar] [CrossRef]
  39. Malankowska, M.; Julian, I.; Pellejero, I.; Rho, H.; Schlautmann, S.; Tiggelaar, R.; Pina, M.; Gardeniers, H.; Mallada, R. Understanding blood oxygenation in a microfluidic meander double side membrane contactor. Sens. Actuators B Chem. 2019, 288, 414–424. [Google Scholar] [CrossRef]
  40. Li, Z.; Haridas, N.; Kaaliveetil, S.; Cheng, Y.-H.; Chande, C.; Perez, V.; Miri, A.K.; Basuray, S. Low-Cost Rapid Prototyping for Microfluidics Using Parafilm®-based Microchannels For Low Resource Settings. Sens. Actuators B Chem. 2023, 404, 135212. [Google Scholar] [CrossRef]
  41. Li, Z.; Haridas, N.; Rahman, M.; Kaaliveetil, S.; Cheng, Y.-H.; Chande, C.; Basuray, S. Flow-Based Compact Microfluidic Electrochemical Cell with Parafilm® Channels. Electrochim. Acta 2023, 470, 143349. [Google Scholar] [CrossRef]
  42. Al Obaidi, A.; Karaca, I.M.; Ayhan, Z.; Haskaraca, G.; Gultekin, E. Fabrication and validation of CO2-sensitive indicator to monitor the freshness of poultry meat. Food Packag. Shelf Life 2022, 34, 100930. [Google Scholar] [CrossRef]
  43. Pantaleão, I.; Portugal, A.F.; Mendes, A.; Gabriel, J. Carbon dioxide absorption in a membrane contactor with color change. J. Chem. Educ. 2010, 87, 1377–1379. [Google Scholar] [CrossRef]
  44. Pocker, Y.; Bjorkquist, D.W. Stopped-flow studies of carbon dioxide hydration and bicarbonate dehydration in water and water-d2. Acid-base and metal ion catalysis. J. Am. Chem. Soc. 1977, 99, 6537–6543. [Google Scholar]
  45. Dreybrodt, W.; Lauckner, J.; Zaihua, L.; Svensson, U.; Buhmann, D. The kinetics of the reaction CO2+ H2O→ H+ + HCO3 as one of the rate limiting steps for the dissolution of calcite in the system H2O–CO2–CaCO3. Geochim. Cosmochim. Acta 1996, 60, 3375–3381. [Google Scholar] [CrossRef]
  46. Ge, M.; Hussain, G.; Hibbert, D.B.; Silvester, D.S.; Zhao, C. Ionic Liquid-based Microchannels for Highly Sensitive and Fast Amperometric Detection of Toxic Gases. Electroanalysis 2019, 31, 66–74. [Google Scholar] [CrossRef]
  47. Paknahad, M.; Bachhal, J.S.; Ahmadi, A.; Hoorfar, M. Characterization of channel coating and dimensions of microfluidic-based gas detectors. Sens. Actuators B Chem. 2017, 241, 55–64. [Google Scholar] [CrossRef]
  48. Scott, K. Absorption, desorption, and extraction with membranes. In Handbook of Industrial Membranes; Scott, K., Ed.; Elsevier Science: Amsterdam, The Netherlands, 1995; pp. 633–639. [Google Scholar]
  49. Sebők, B.; Schülke, M.; Réti, F.; Kiss, G. Diffusivity, permeability and solubility of H2, Ar, N2, and CO2 in poly (tetrafluoroethylene) between room temperature and 180 C. Polym. Test. 2016, 49, 66–72. [Google Scholar] [CrossRef]
  50. Pasternak, R.A.; Christensen, M.V.; Heller, J. Diffusion and permeation of oxygen, nitrogen, carbon dioxide, and nitrogen dioxide through polytetrafluoroethylene. Macromolecules 1970, 3, 366–371. [Google Scholar] [CrossRef]
  51. Volkov, K.N.; Karpenko, A.G. Preconditioning of gas dynamics equations in compressible gas flow computations at low mach numbers. Comput. Math. Math. Phys. 2015, 55, 1051–1067. [Google Scholar] [CrossRef]
  52. Darbandi, M.; Schneider, G.E. Analogy-based method for solving compressible and incompressible flows. J. Thermophys. Heat Transf. 1998, 12, 239–247. [Google Scholar] [CrossRef]
  53. Kraushaar, M. Application of the Compressible and Low-Mach Number Approaches to Large-Eddy Simulation of Turbulent Flows in Aero-Engines. Doctoral Dissertation, Institut National Polytechnique de Toulouse, Toulouse, France, 2011. [Google Scholar]
Figure 1. (a) Schematic of the membrane-based microfluidic gas sensor. (b) Real image of the membrane-based microfluidic gas sensor with liquid microchannel filled with bromothymol blue solution. (c) Magnified image of liquid microchannel showing no leaks. (d) Color of bromothymol blue dye in liquid microchannel after passing CO2. The color changed to yellow, showing the permeation of CO2 through the membrane.
Chemosensors 12 00127 g001
Figure 2. Schematic of setup used to perform the experiments.
Chemosensors 12 00127 g002
Figure 3. (a) MFC setup without any mixing chamber; (b) response of the sensor for 20% CO2 and pure nitrogen; (c) MFC setup with a mixing chamber (empty chamber with a Reynolds number of 10); (d) response of the sensor for 20% CO2 and pure nitrogen.
Chemosensors 12 00127 g003
Figure 4. (a) Response of gas sensor to different flow rates. (b) k value obtained by fitting sigmoid function to the response of different flow rates. The k represents the slope of the rise in the curve. (c) tc value obtained by fitting the sigmoid function to the response of different flow rates. tc represents the offset or the delay in the system. (d) tc or delay in the regeneration of the sensor when nitrogen is passed through the microfluidic platform.
Chemosensors 12 00127 g004
Figure 5. (a) Response of the MB-MP for different gas microchannel thicknesses with a flow rate of 10 sccm. (b) Relation between gas microchannel thickness and velocity of gas stream when the volumetric flow rate is kept constant at 10 sccm. (c) Slope k of the saturation region as a function of velocity obtained from fitting the response (in the saturation region) with sigmoid function. (d) Offset/delay tc of the saturation region as a function of velocity obtained from fitting the response with sigmoid function.
Chemosensors 12 00127 g005
Figure 6. (a) Response of the MB-MP with different liquid microchannel thickness for a gas flow rate of 10 sccm. (b) Slope and offset obtained from fitting the response of saturation region by sigmoid function.
Chemosensors 12 00127 g006
Disclaimer/Publisher’s Note: The statements, opinions and data contained in all publications are solely those of the individual author(s) and contributor(s) and not of MDPI and/or the editor(s). MDPI and/or the editor(s) disclaim responsibility for any injury to people or property resulting from any ideas, methods, instructions or products referred to in the content.

