Article

Research on the Detection of Hg(II) in Seawater Using GR-MWCNTs/CeO2-Modified Electrodes

1
College of Mechanical and Marine Engineering, Beibu Gulf University, Qinzhou 535011, China
2
College of Eastern Michigan Joint Engineering, Beibu Gulf University, Qinzhou 535011, China
3
Guangxi Key Laboratory of Marine Engineering Equipment and Technology, Qinzhou 535011, China
*
Author to whom correspondence should be addressed.
Chemosensors 2024, 12(7), 128; https://doi.org/10.3390/chemosensors12070128
Submission received: 21 May 2024 / Revised: 30 June 2024 / Accepted: 2 July 2024 / Published: 4 July 2024
(This article belongs to the Special Issue Preparation and Application of Photoelectrochemical Sensors)

Abstract

:
Hg(II), as an extremely hazardous heavy metal contaminant in the environment, poses a significant potential hazard to human health and ecosystems. A GR-MWCNTs-COOH/CeO2/Nafion composite film-modified glassy carbon electrode was prepared using the drop-casting method in this study. The GR-MWCNTs-COOH/CeO2/Nafion/GCE was electrochemically investigated through cyclic voltammetry (CV) and differential pulse stripping voltammetry (DPSV). Additionally, the surface morphologies of the composite film were evaluated using scanning electron microscopy (SEM). The conditions, such as buffer solution, pH, deposition potential, deposition time, modified film thickness, and Nafion content, were optimized. Under optimal experimental conditions, a good linear relationship between the peak current response of Hg(II) and its concentration in the range of 5–100 μg·L−1 was observed, with a detection limit of 0.389 μg·L−1. When it was used to detect Hg(II) in offshore seawater, the recovery rate ranged from 94.72% to 103.8%, with RSDs ≤ 5.79%.

1. Introduction

Mercury is a heavy metal element with extensive industrial applications, but it is also a recognized environmental pollutant and toxic substance, especially in its ionic form, Hg(II). The bioaccumulation and biotoxicity of Hg(II) mean that it significantly affects organisms even at low concentrations, inducing nervous system damage, renal dysfunction, and immune system suppression [1]. Statistics show that as little as 3 mg of mercury can contaminate 1000 tons of water [2], and 0.3 g of mercury can be fatal to humans [3]. An estimated 1000 mg of mercury enters the ocean from rivers every year [4], and mercury poisoning causes intellectual disability in 250,000 people annually [5]. The World Health Organization (WHO) stipulates that the concentration of Hg(II) in drinking water should be below 0.006 mg·L−1. However, China has imposed a more stringent limit on the concentration of Hg(II) in drinking water, 0.001 mg·L−1, in the current “Standards for Drinking Water Quality” (GB5749-2022) [6]. Mercury pollution is not only highly hazardous, it is also close to us [7]; thus, detecting the Hg(II) content in water bodies is particularly important.
Differential pulse voltammetry (DPV) is commonly used for the electrochemical detection of Hg(II). DPV mainly applies a series of pulsed voltages to the working electrode and measures the current after each pulse ends [8]. However, during pulse application, besides the Faradaic current (current generated by electrochemical reactions), there is also the double-layer charging current (current caused by the charging and discharging of the double layer on the electrode surface) [9], which can interfere with the measurement of the Faradaic current. Differential pulse stripping voltammetry (DPSV) adds a pulse gap time to DPV, allowing the charging current to decay, greatly reducing the interference of the double-layer charging current [10]. Compared to traditional DPV detection technology, DPSV has a lower background current and higher resolution [11], significantly improving the sensitivity and accuracy of detection.
In recent years, the combined application of composite materials and electrochemical detection technology has become a research hotspot. Graphene (GR), a new type of two-dimensional carbon nanomaterial, provides an ideal modification material for electrochemical sensors due to its high specific surface area [12], excellent electrical conductivity, and chemical stability [13]. Multi-walled carbon nanotubes (MWCNTs) provide more active sites for electrochemical sensors due to their unique tubular structure and excellent electrical conductivity [14]. Carboxyl functionalization enables the additional of carboxyl functional groups to the surfaces of multi-walled carbon nanotubes, giving them high hydrophilicity and significantly improving their dispersion and stability. Meanwhile, the strong conductivity of carboxyl functional groups enables them to respond more sensitively to target analytes in electrochemical detection, improving detection sensitivity and accuracy. The combination of graphitized, carboxyl-functionalized, multi-walled carbon nanotubes (GR-MWCNTs-COOH) and cerium dioxide (CeO2) nanoparticles can further enhance the electrode’s conductivity [15], catalytic activity [16], and selectivity [17]. Nafion, as an ion-selective membrane [18], can effectively prevent interference from other ions [19], improving the electrode’s anti-interference ability and detection accuracy [20]. Meanwhile, Nafion’s strong adhesion greatly enhances the structural stability of the composite material [21], significantly improving its electrochemical performance.
This article presents a novel Hg(II) electrochemical sensor based on GR-MWCNTs-COOH/CeO2/Nafion-modified glassy carbon electrodes, combined with DPSV detection technology, for the accurate determination of Hg(II) in Maowei Bay seawater. The sensor significantly improves the sensitivity, selectivity, and stability of the electrode through the modification of composite materials, making Hg(II) detection more accurate, rapid, and convenient.

2. Experimental

2.1. Instruments and Reagents

This experiment was performed using the CHI 830D electrochemical analyzer produced by Shanghai Chenhua Instruments Company (Shanghai, China). A standard three-electrode system was adopted: The working electrode was a 3 mm glassy carbon electrode (GCE), the auxiliary electrode was a platinum wire, and the reference electrode was a saturated calomel electrode (SCE). The morphology of the modified electrode was captured using a Thermo Fisher Quattro S scanning electron microscope (SEM) (Thermo Fisher Scientific, Waltham, MA, USA). EIS analysis used a CHI660E electrochemical analyzer (Shanghai Chenhua Instruments Company, Shanghai, China). The PLUSE2-5TH ultrapure water system was obtained from Nanjing Yipuyida Technology Company (Nanjing, China). The electronic analytical balance, ultrasonic cleaner, and electric blast drying oven were purchased from Shanghai Lichen Instrument Technology Co., Ltd. (Shanghai, China).
The chemicals used in the experiment were as follows: GR-MWCNTs-COOH (purity > 99.9%, Shanghai Macklin Biochemical Technology Company, Shanghai, China); CeO2 (purity > 99.5%, Shanghai Jizhi Biochemical Technology Company, Shanghai, China); Nafion (5.0 wt%, Shanghai Macklin Biochemical Technology Company, Shanghai, China); mercury standard solution (1000 μg·mL−1, National Nonferrous Metals and Electronics Analysis and Test Center, Beijing, China); and KCl, HNO3, phosphate-buffered saline (PBS), anhydrous ethanol, HAc–NaAc solutions of different pH values (0.1 mol·L−1), K3[Fe(CN)6] (purity ≥ 99.5%), etc. These were all purchased from Guangzhou Wendu Scientific Instruments Co., Ltd. (Guangzhou, China). The experimental water used was ultrapure water with a resistivity of 18.0 Ω·m.

2.2. Synthesis of Nanocomposites

A 5% Nafion solution was diluted with anhydrous ethanol to prepare a 0.25% Nafion solution in anhydrous ethanol. Using an electronic balance, 11.2 mg of GR-MWCNTs-COOH was weighed and dissolved in 4 mL of the 0.25% Nafion solution in anhydrous ethanol. The mixture was then ultrasonically dispersed for 1 h to obtain the GR-MWCNTs-COOH/Nafion solution.
Using an electronic balance, 0.2 mg of CeO2 was weighed and dissolved in the GR-MWCNTs-COOH/Nafion solution. The mixture was further ultrasonically dispersed for over 1.5 h to obtain the GR-MWCNTs-COOH/CeO2/Nafion solution.
Separately, 11.2 mg of GR-MWCNTs-COOH and 0.2 mg of CeO2 were dissolved in 4 mL of anhydrous ethanol and ultrasonically dispersed for over 1.5 h to obtain the GR-MWCNTs-COOH/CeO2 solution.

2.3. GR-MWCNTs-COOH/CeO2/Nafion-Modified Electrode Preparation

The GCE, with a diameter of 3 mm, was polished using Al2O3 powders with particle sizes of 1.0 μm, 0.3 μm, and 50 nm, respectively, until the surface was bright and smooth. The GCE was initially rinsed with ultrapure water and subsequently subjected to multiple cleaning cycles in an ultrasonic cleaner until all traces of residual Al2O3 powder on the surface were completely removed. In a 0.1 mol·L−1 HAc–NaAc solution, the GCE was scanned several times using cyclic voltammetry (CV) from −0.6 to 1.0 V until the curves overlapped completely, indicating the completion of electrode activation. The electrode was then rinsed with ultrapure water, dried, and set aside for future use.
Using a pipette, 4 μL of the GR-MWCNTs-COOH/CeO2/Nafion solution was drop-casted onto the activated GCE. The electrode was then placed in a drying oven at 26 °C until the surface was completely dry. The formation of a dense black film on the GCE surface indicated successful electrode modification, with the GR-MWCNTs-COOH/CeO2/Nafion/GCE being obtained.

2.4. Physical and Electrochemical Measurements

The detection of Hg(II) primarily relies on two methods: constant potential deposition and DPSV. Using a 0.1 mol·L−1 concentration of the HAc–NaAc-supporting electrolyte solution with a pH of 4.5, the Hg(II) standard solution was diluted to a series of different concentrations. A three-electrode system was employed at room temperature, consisting of a glassy carbon electrode as the working electrode, a saturated calomel electrode (saturated KCl, SCE, 0.242 V vs. normal hydrogen electrode) as the reference electrode, and a platinum wire electrode as the counter electrode. The GR-MWCNTs-COOH/CeO2/Nafion/GCE, platinum wire electrode, and SCE were immersed in the solution. Hg(II) was deposited using the constant potential method of an electrochemical analyzer under stirring conditions, with a deposition potential of −1.1 V and a duration of 300 s. Stirring was stopped once the deposition was complete.
DPSV was carried out for the detection of Hg(II). The following parameters were used: initial potential, 0.7 V; final potential, 1.2 V; potential increment, 50 mV; frequency, 25 Hz; amplitude, 5 mV; quiet time, 2 s. The other parameters were set to the default values for the instrument. During the experiment, differential pulse stripping voltammograms were recorded for different Hg(II) concentrations, and a linear standard curve was plotted to calculate the detection limit. To ensure the rigor of the experiment, after the completion of the aforementioned experiments, the residual Hg(II) on the surface of the modified electrode was removed using constant potential technology (−0.6 V, 30 s).

3. Results and Discussion

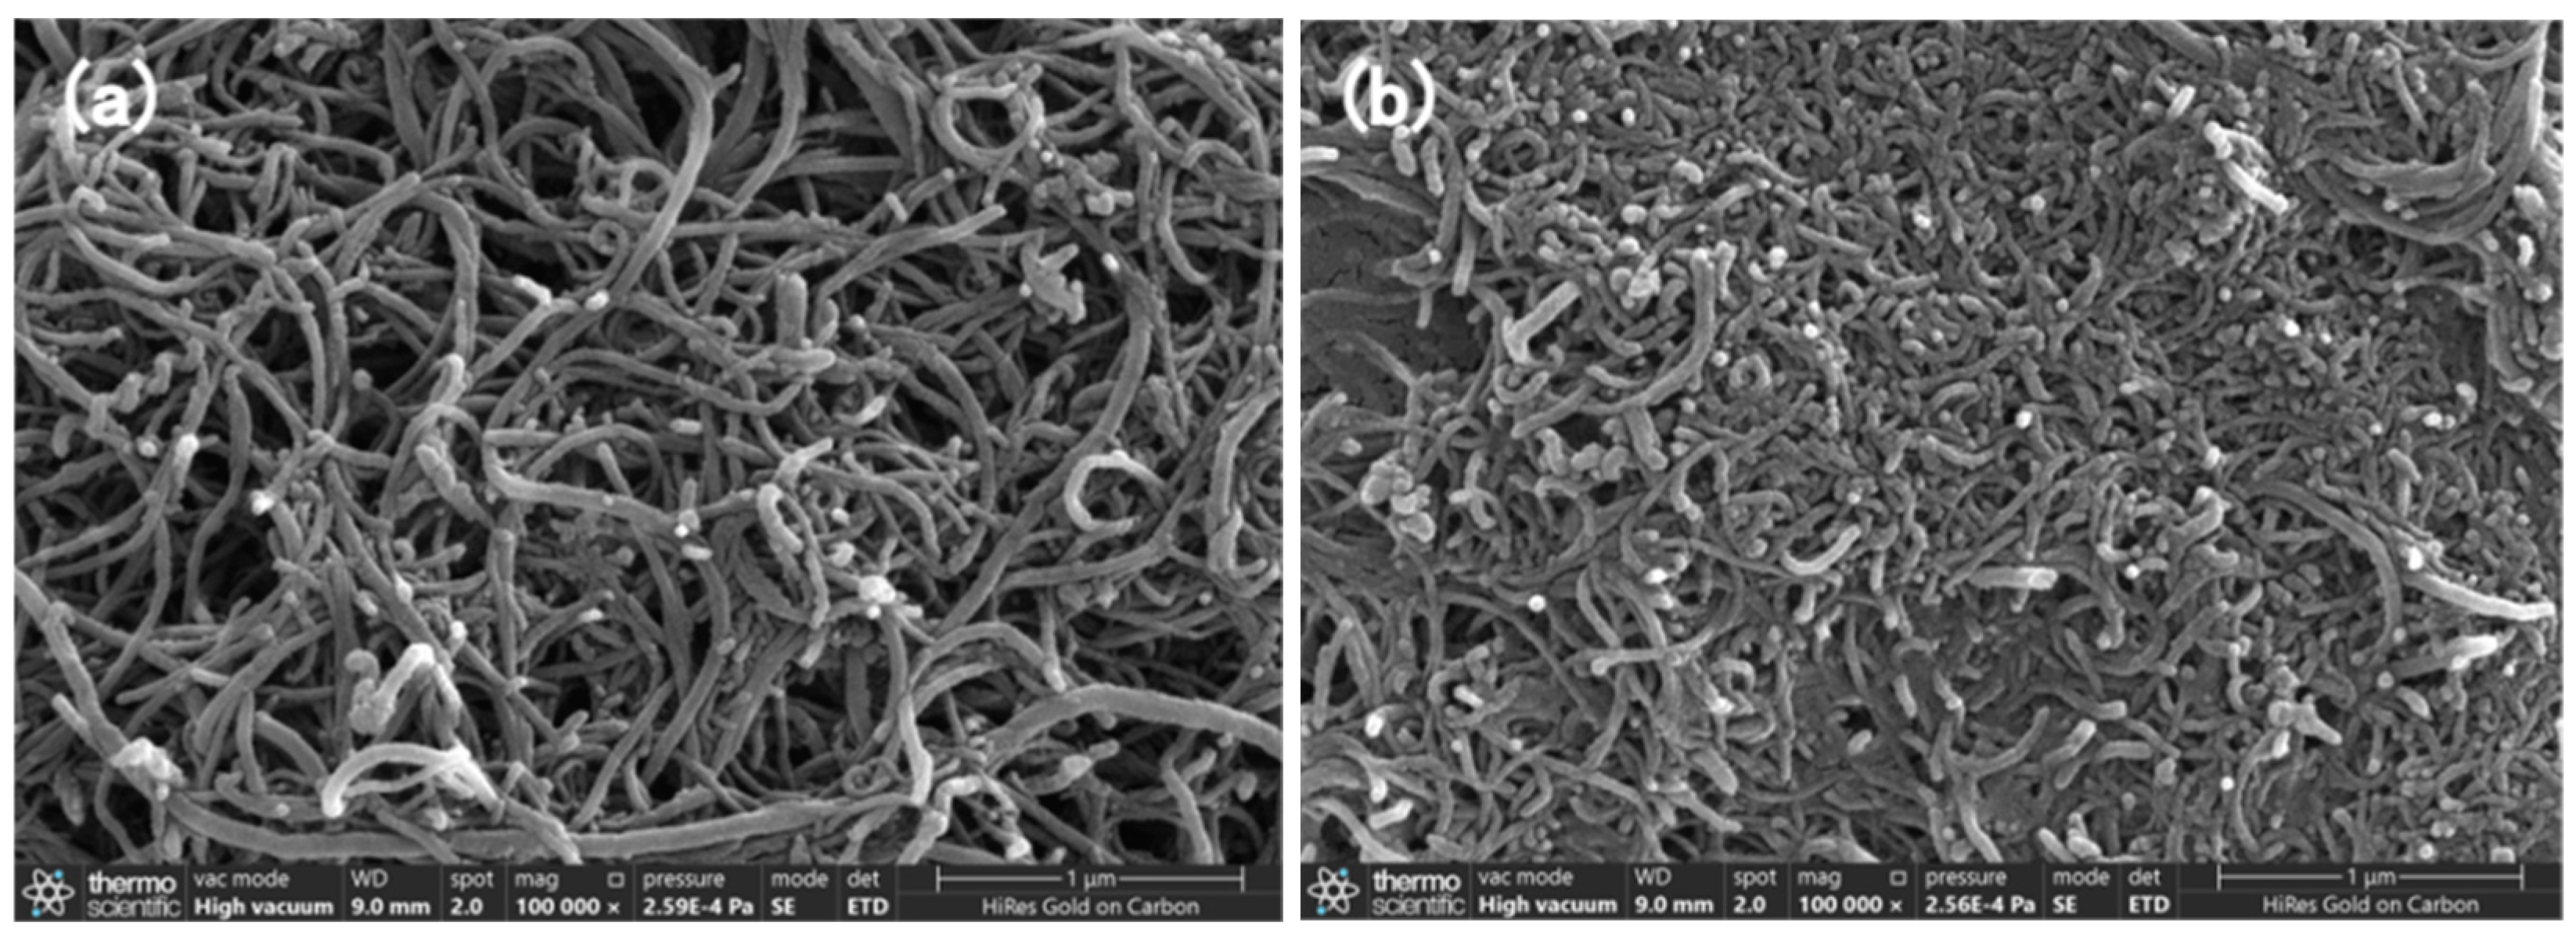
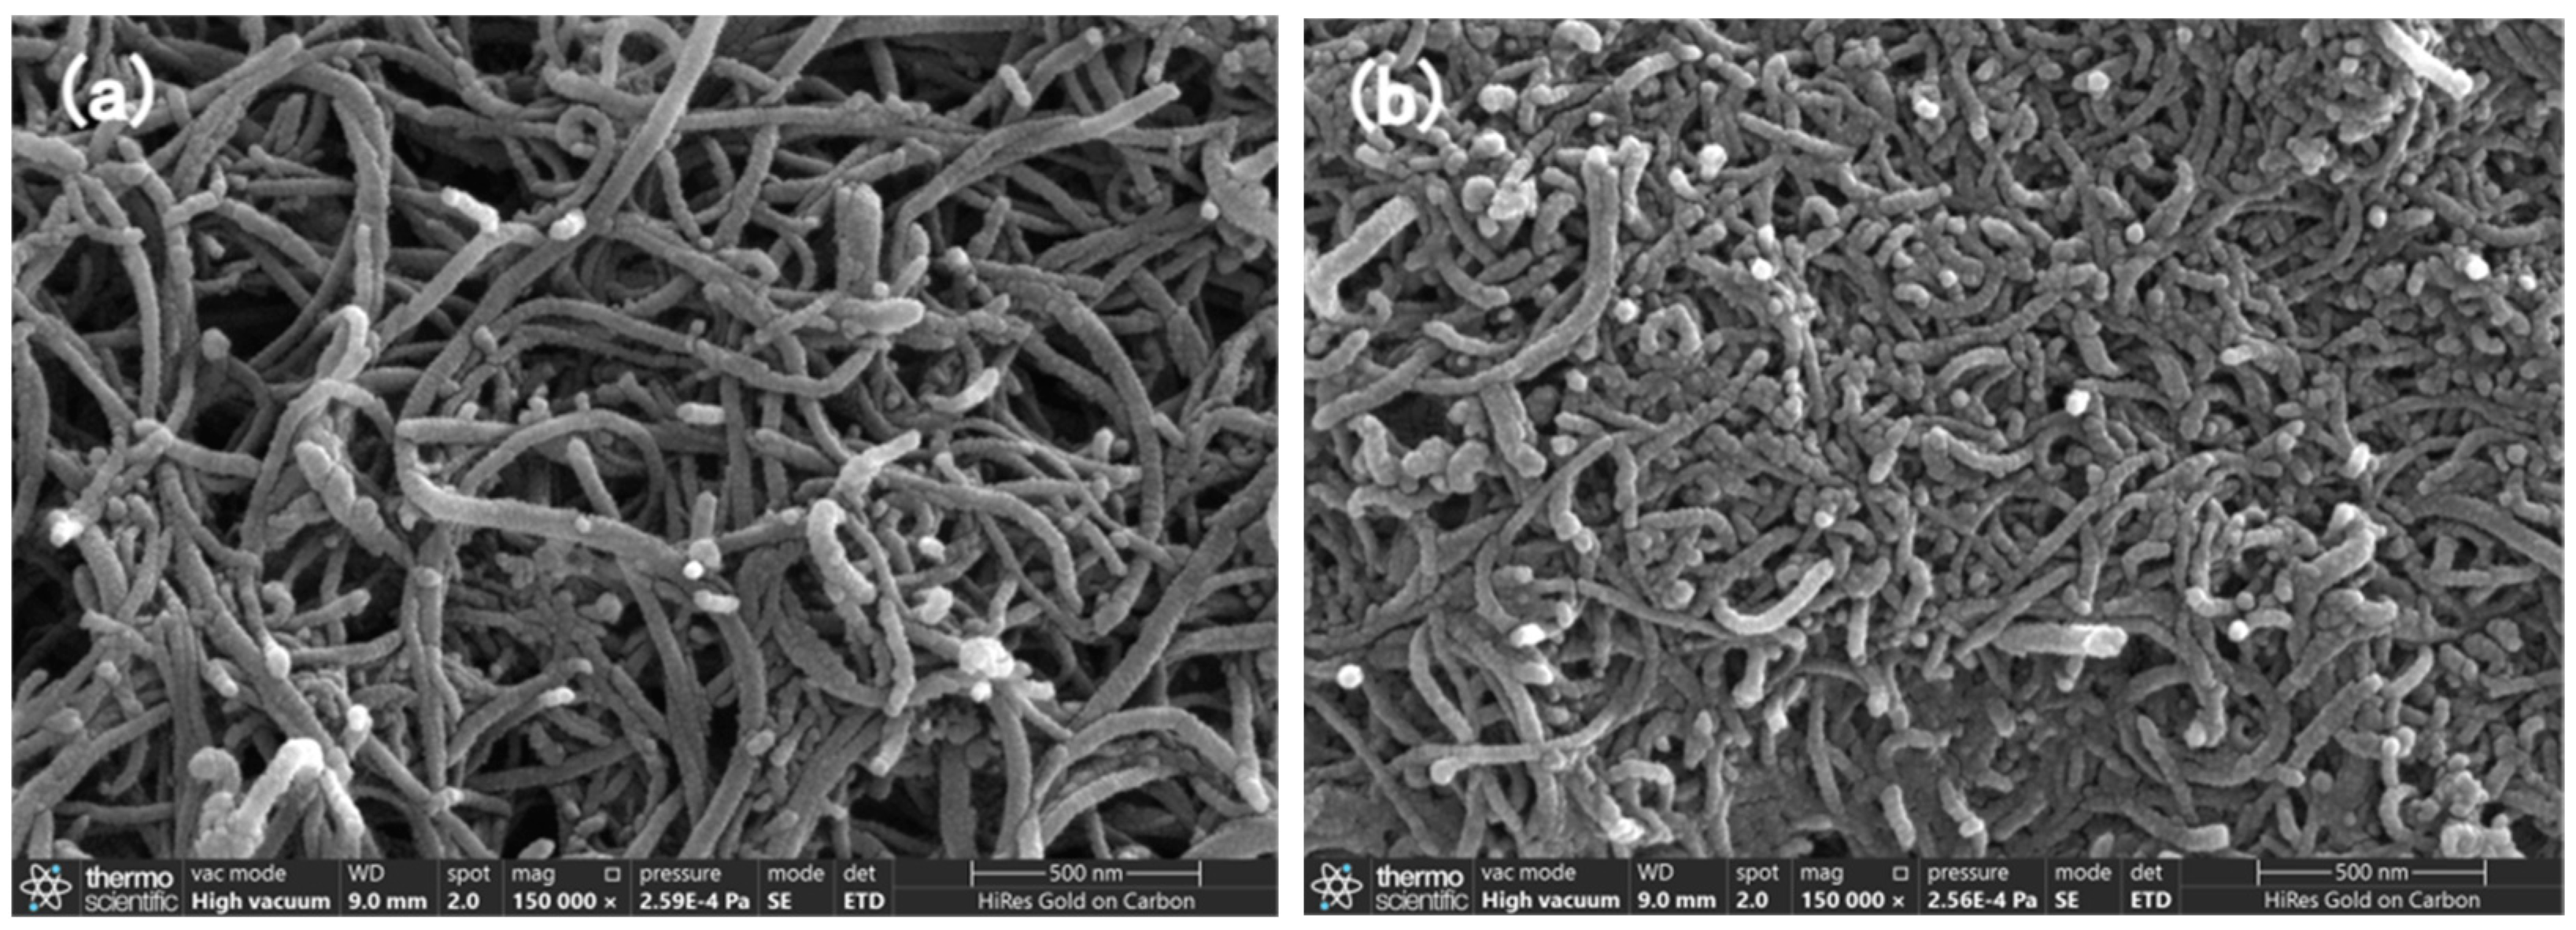
3.1. Surface Morphology of the Nanocomposites

SEM was employed to examine the surface morphology of the GR-MWCNTs-COOH/CeO2/Nafion and GR-MWCNTs-COOH/Nafion nanocomposites. In an image taken at a magnification of MAX = 100 kx, Figure 1a shows that GR-MWCNTs-COOH/Nafion formed an interlaced and entangled network on the GCE surface, with a small amount of agglomeration. In contrast, Figure 1b reveals a more uniform distribution of GR-MWCNTs-COOH/CeO2/Nafion, attributed to the good dispersibility and catalytic properties of CeO2, which facilitated better dispersion of the material on the GCE surface, reducing agglomeration and entanglement. In an image taken with further magnification at MAX = 150 kx, Figure 2a clearly demonstrates the uneven mixing and aggravated agglomeration phenomena of GR-MWCNTs-COOH/Nafion. In contrast, Figure 2b exhibits a well-formed morphology and uniform distribution of GR-MWCNTs-COOH/CeO2/Nafion.
Upon comparing Figure 1 and Figure 2, it can be observed that, under the same magnification, the GR-MWCNTs-COOH/CeO2/Nafion composite material exhibits a more uniform distribution and stable structure. The larger specific surface area provided more channels for rapid electron transfer between the electrode and the electrolyte, promoting electron transfer and increasing the electroactive sites for electrode reactions, thus greatly enhancing the detection sensitivity.

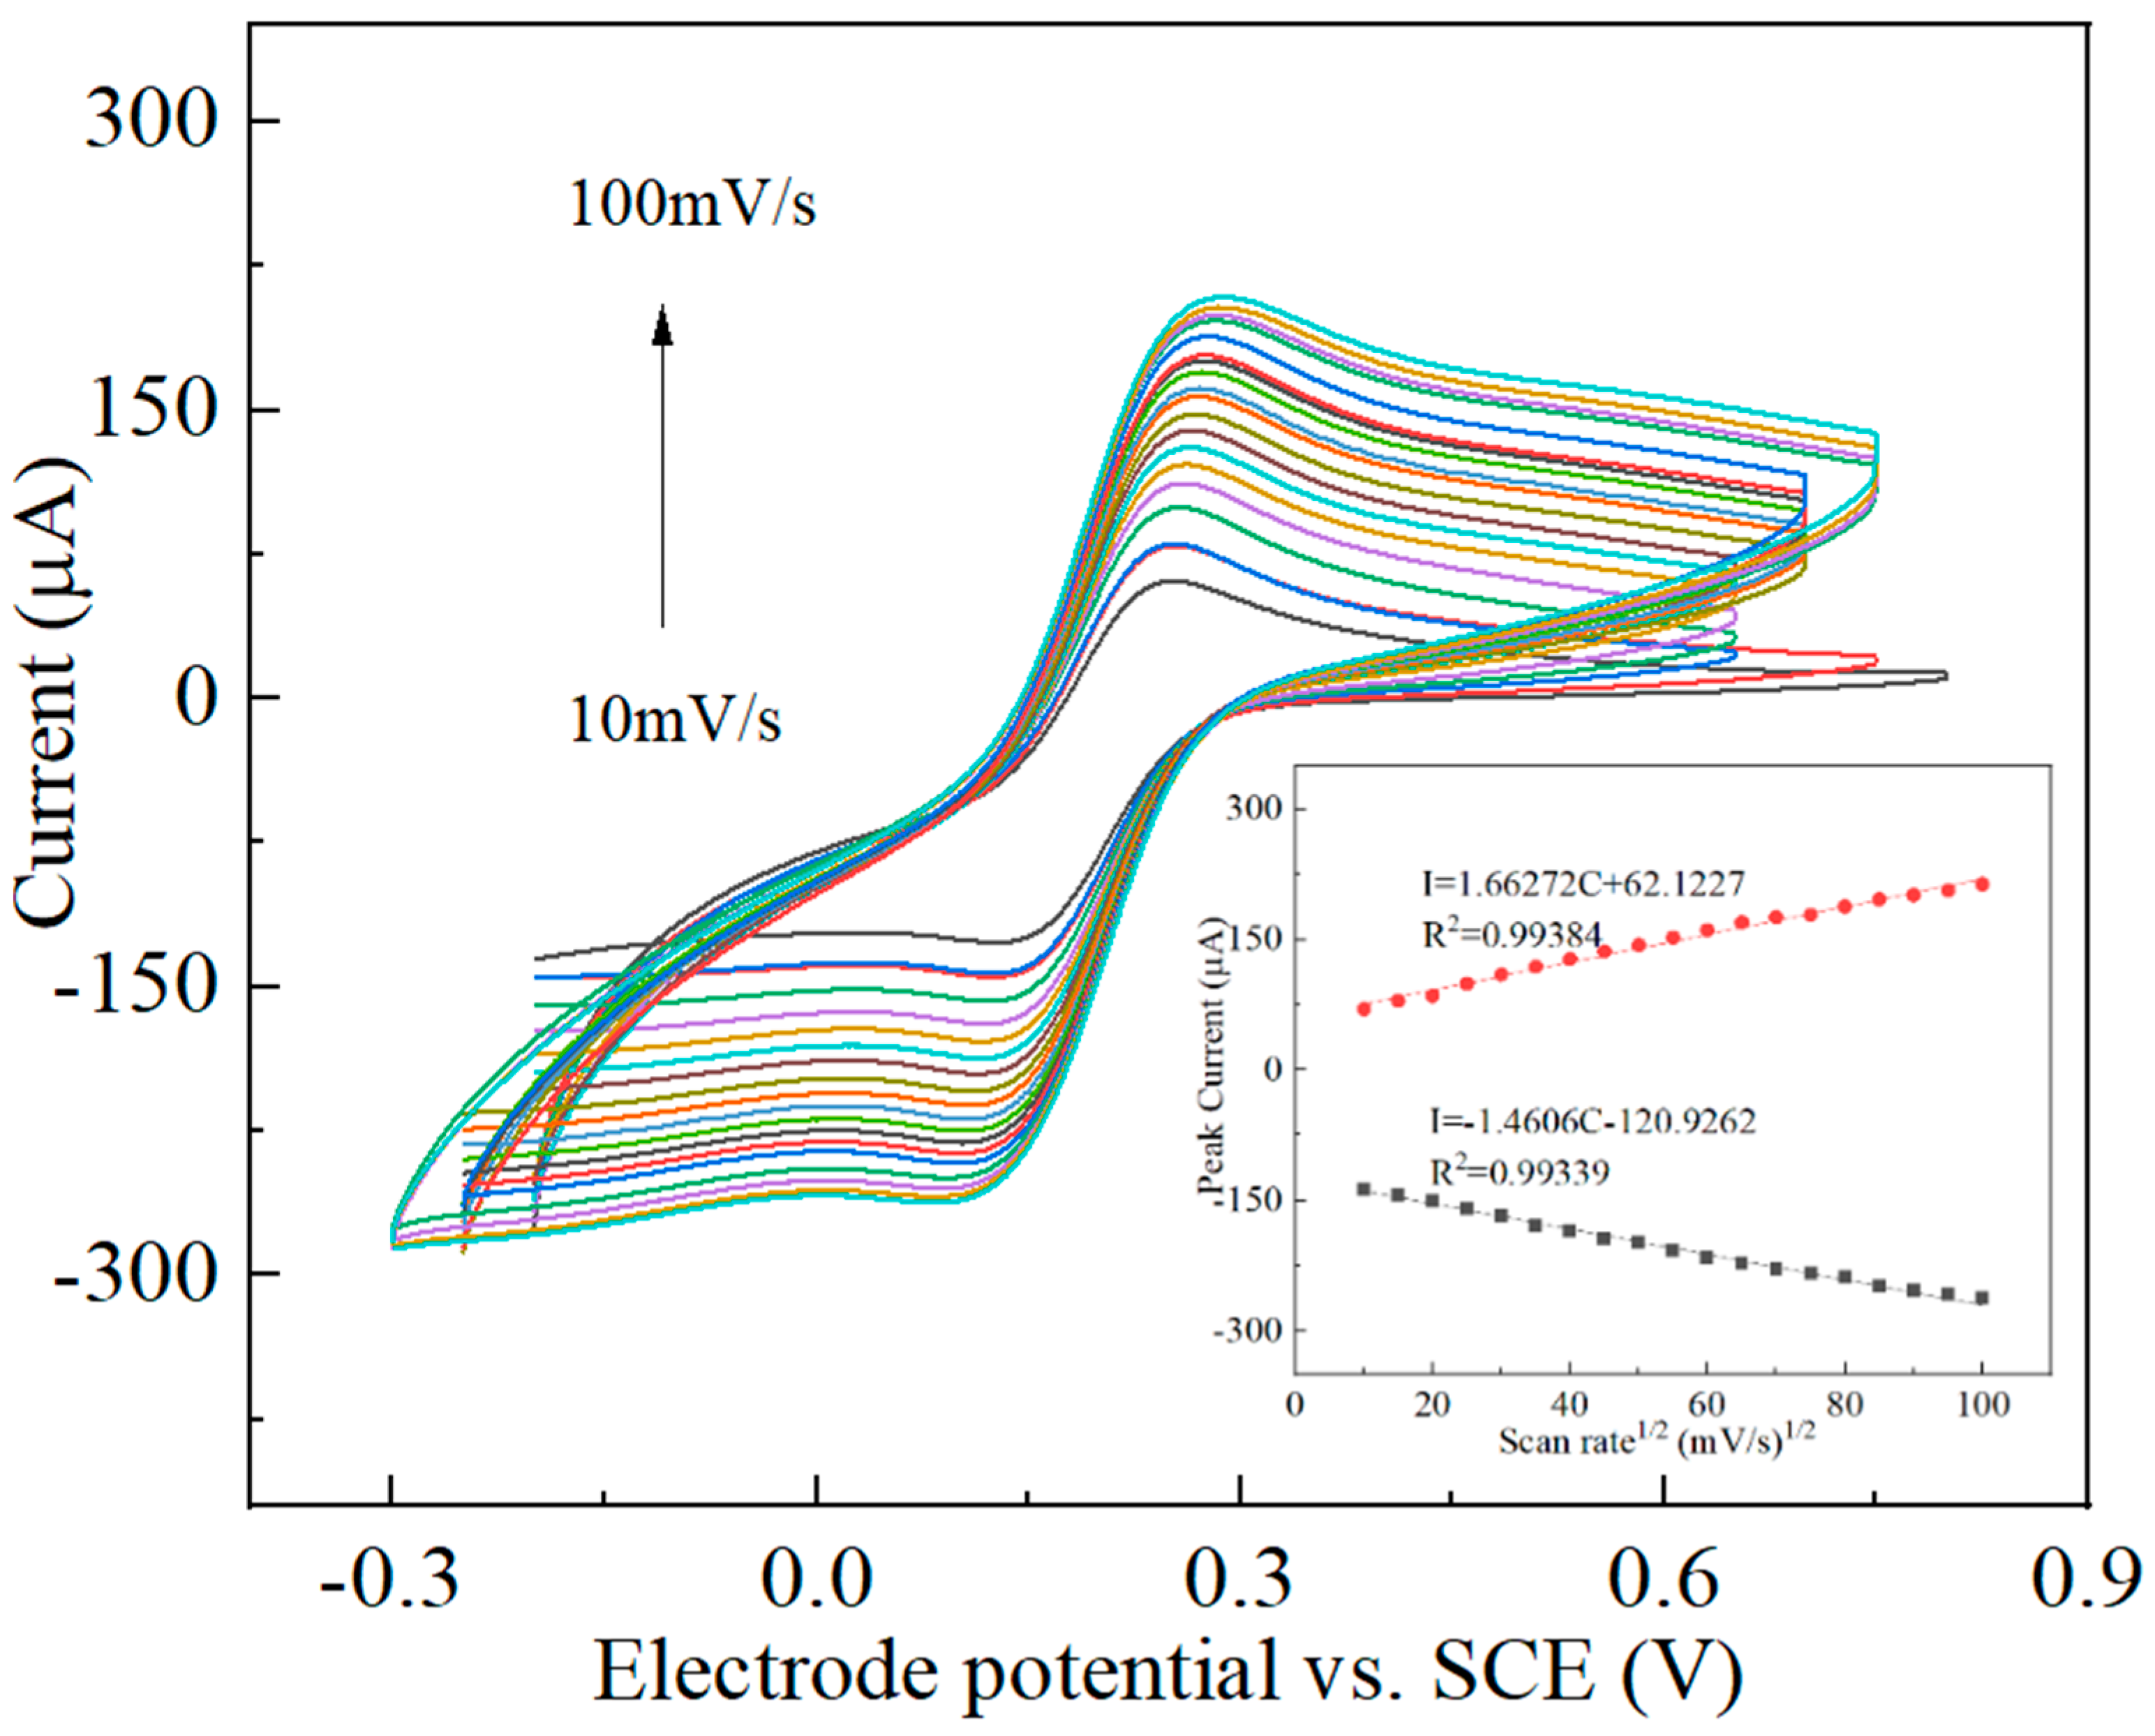
3.2. Electrochemical Characterization of the Nanocomposites

The electrochemical performance of the nanocomposite-modified electrodes was studied using CV in the presence of 1 mM K3[Fe (CN)6] in 0.1 M KCl solution at a scan rate of 0.1 V/s. As shown in Figure 3, clear redox peaks appeared at the GR-MWCNTs-COOH/CeO2/Nafion/GCE region, which were significantly larger than those of the other three electrodes. GR-MWCNTs-COOH is a material with excellent electrical conductivity, while CeO₂ possesses strong redox properties and catalytic capabilities. The addition of CeO₂ to GR-MWCNTs-COOH significantly enhanced the reaction rate. The adhesive and chemical stability of Nafion further improved the overall performance of the composite. Therefore, the redox peaks at the GR-MWCNTs-COOH/CeO2/Nafion/GCE region were higher.
During electrochemical reactions, electrodes can be classified into surface-process-controlled and diffusion-process-controlled reactions [22]. To further verify the surface characteristics of GR-MWCNTs-COOH/CeO2/Nafion/GCE, tests were conducted at different scan rates in a 1 mM K3[Fe(CN)6] and 0.1 M KCl environment, resulting in a series of CV diagrams that are shown in Figure 4. As the scan rate increased, the peak current also increased. The linear relationship between the peak current and the square root is illustrated in Figure 4, indicating that the reversible electron transfer reaction is completely diffusion-controlled.
To further analyze the electrochemical performance of the composite materials, the charge transfer processes of GR-MWCNTs-COOH/CeO2/Nafion/GCE, GR-MWCNTs-COOH/CeO2/GCE, GR-MWCNTs-COOH/Nafion/GCE, and GCE were studied using EIS in 1 mM K3[Fe(CN)6] in 0.1 M of KCl, and the results are shown in Figure 5. The following parameters were used: init, 0.2 V; high frequency, 1 × 10⁵ Hz; low frequency, 0.01 Hz; amplitude, 0.005 V; quiet time, 2 s. Compared to the impedance curve of the bare electrode, the semicircle diameter of the impedance curve of the electrode modified with the composite material was significantly reduced, indicating that the modified material has good conductivity and can accelerate the electron transfer rate in the system, that is, it has a smaller impedance. Compared to GR-MWCNTs-COOH/CeO2/GCE, the semicircle diameter of the impedance curve of GR-MWCNTs-COOH/Nafion/GCE was significantly reduced. This is because Nafion, as a polymer, can affect the charge distribution and transfer at the interface through its special molecular structure and electrical properties, providing additional ion transport channels for the reaction while improving the wettability of the interface and accelerating the charge transfer. Compared to that of GR-MWCNTs-COOH/Nafion/GCE, the radius of GR-MWCNTs-COOH/CeO2/Nafion/GCE was slightly reduced, but the curve of GR-MWCNTs-COOH/CeO2/Nafion/GCE was relatively stable. This is because the introduction of CeO2 had a relatively small impact on the electron transfer process at the electrode interface, but due to the unique stable catalytic property of CeO2 itself, the curve was relatively stable, showing better results. The EIS analysis results are consistent with the cyclic voltammogram results.

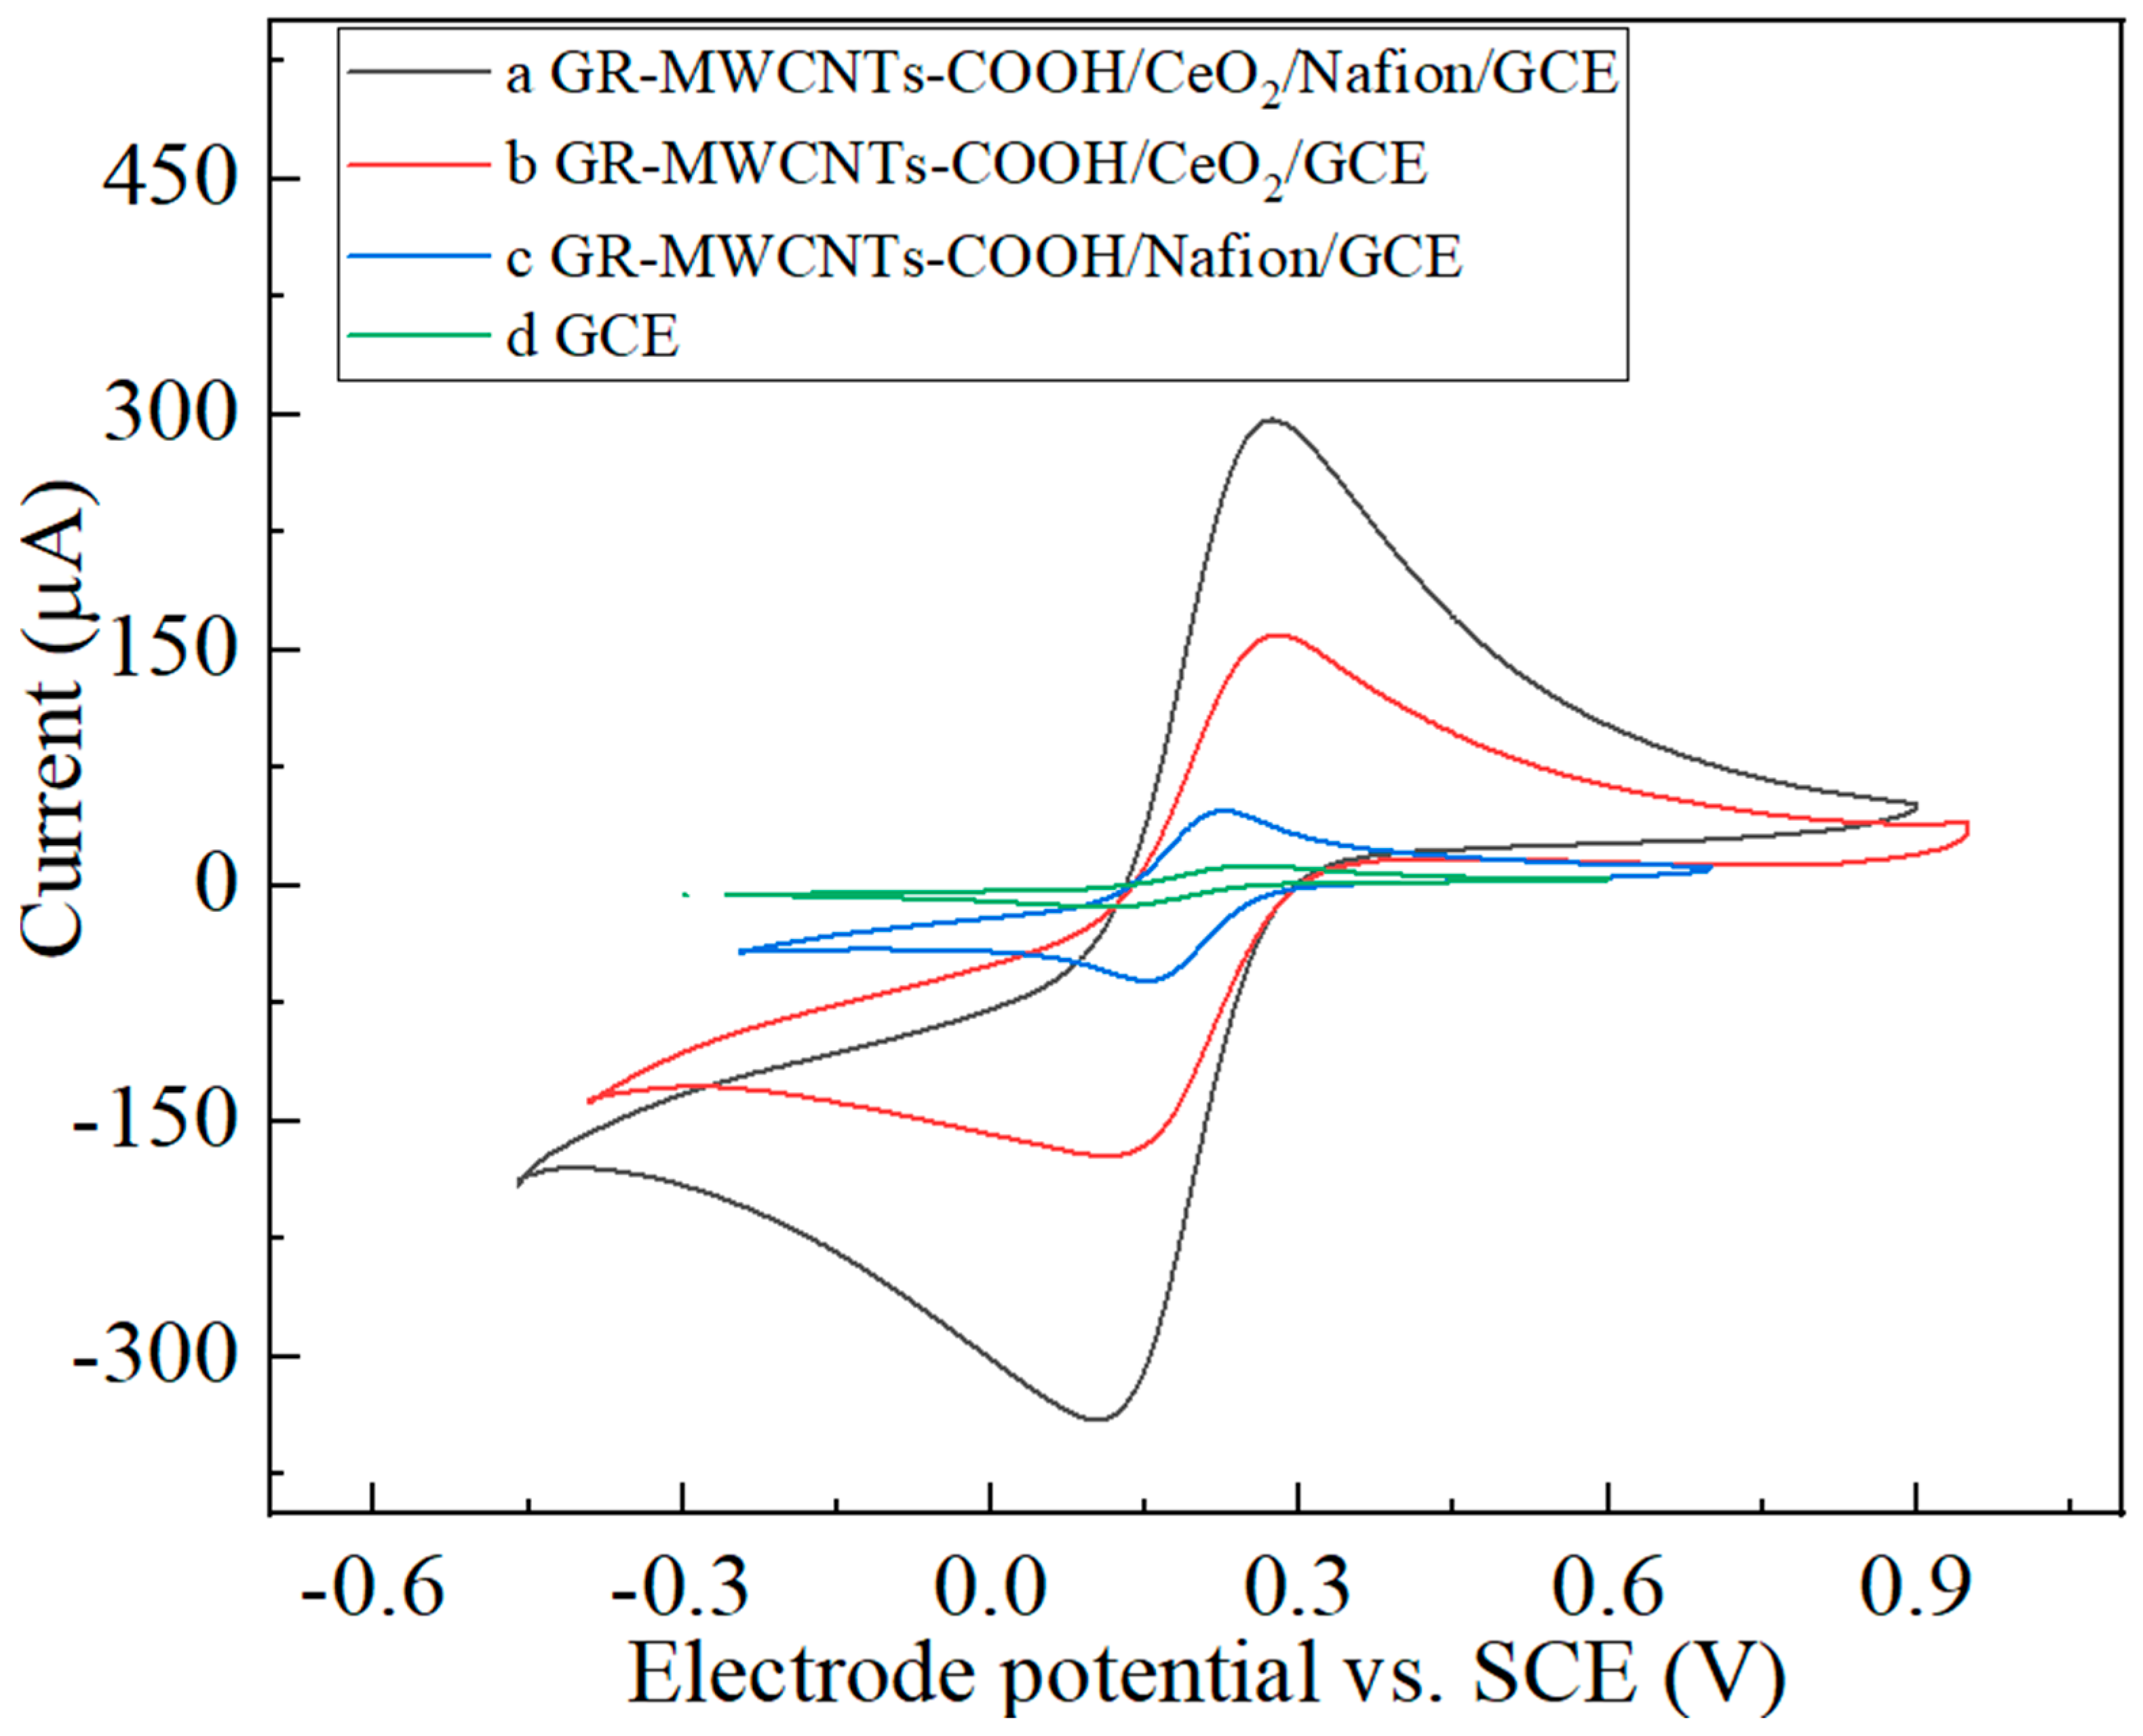
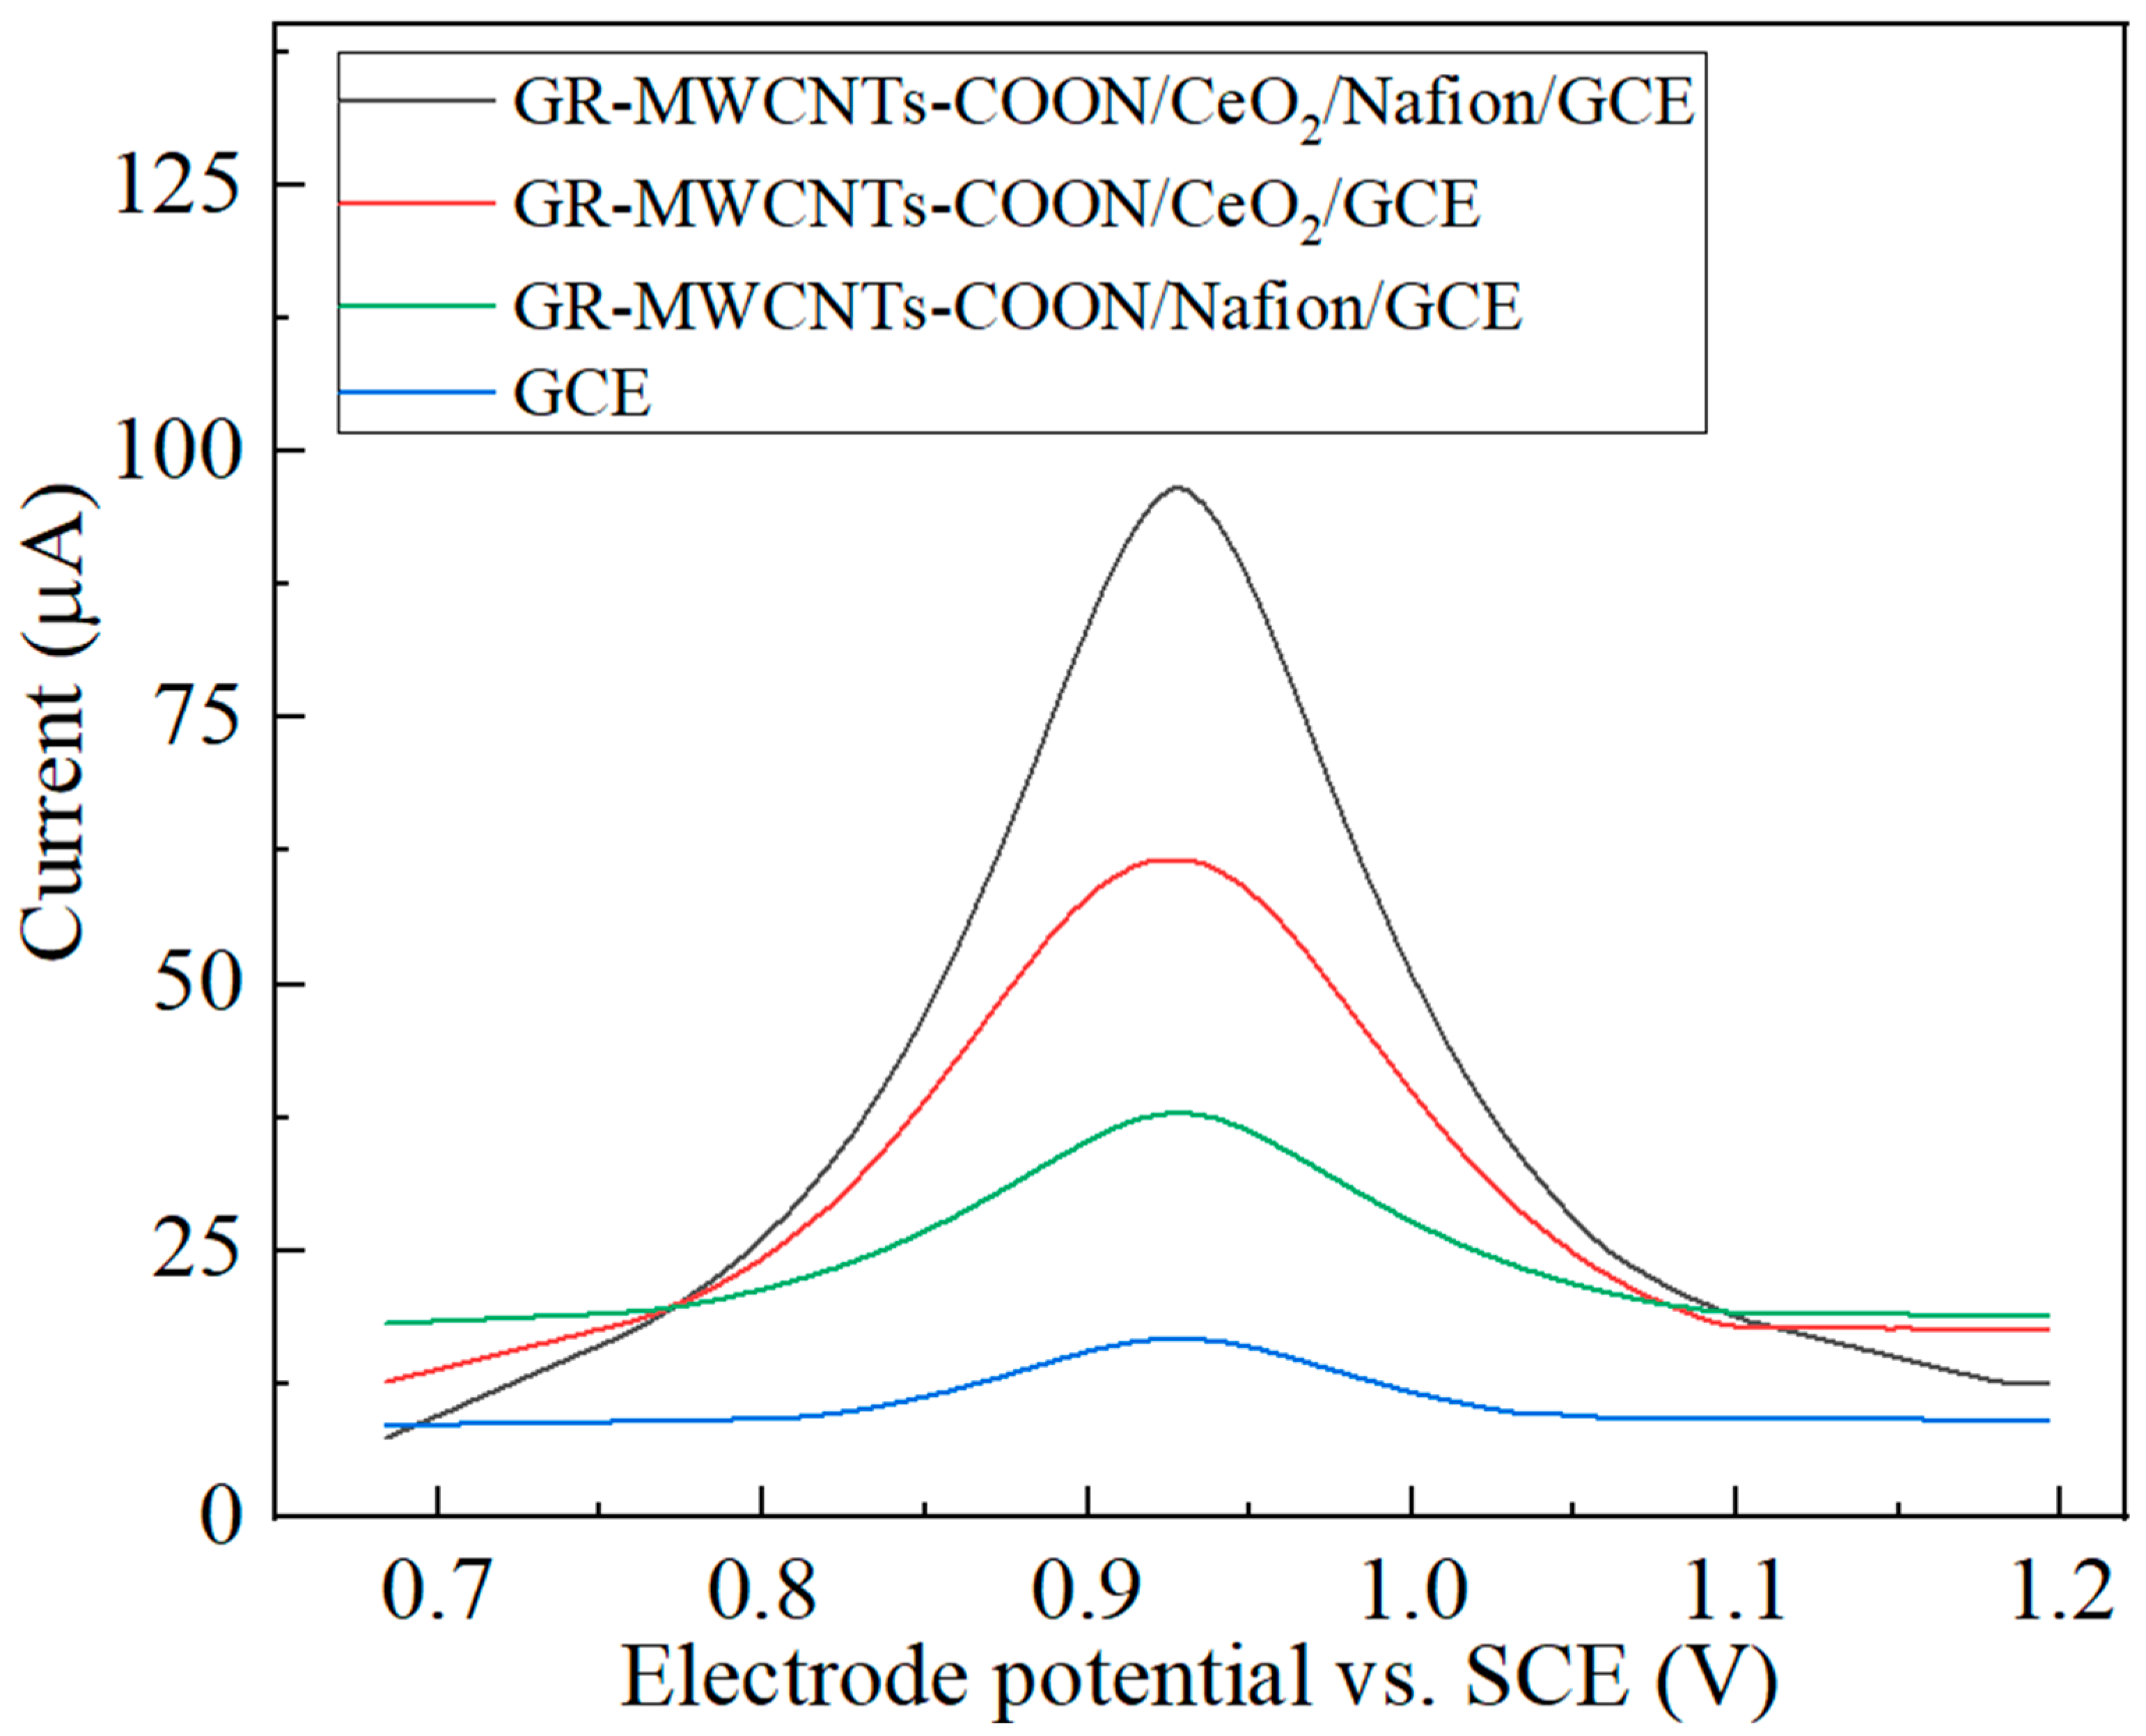
3.3. Comparison of the Performance of the Modified Electrodes

To investigate the response effects of different materials to Hg(II), DPSV was used to compare the stripping voltammetry curves of GR-MWCNTs-COOH/CeO2/Nafion/GCE, GR-MWCNTs-COOH/CeO2/GCE, GR-MWCNTs-COOH/Nafion/GCE, and GCE in a 25 μg·L−1 Hg(II) solution. The results are shown in Figure 6. It can be seen from the figure that Hg(II) exhibited the strongest response signal to GR-MWCNTs-COOH/CeO2/Nafion/GCE, indicating that the modified electrode has excellent electrochemical performance in detection. The main reason is that the combination of GR-MWCNTs-COOH and CeO2 increases the specific surface area of the composite material [23], promoting electron transfer and providing more electroactive sites for electrochemical reactions. Meanwhile, the strong adhesion of Nafion enhances the overall performance of the composite structure [24]. Therefore, the modified electrode demonstrated higher sensitivity and peak current.

3.4. Optimization Studies

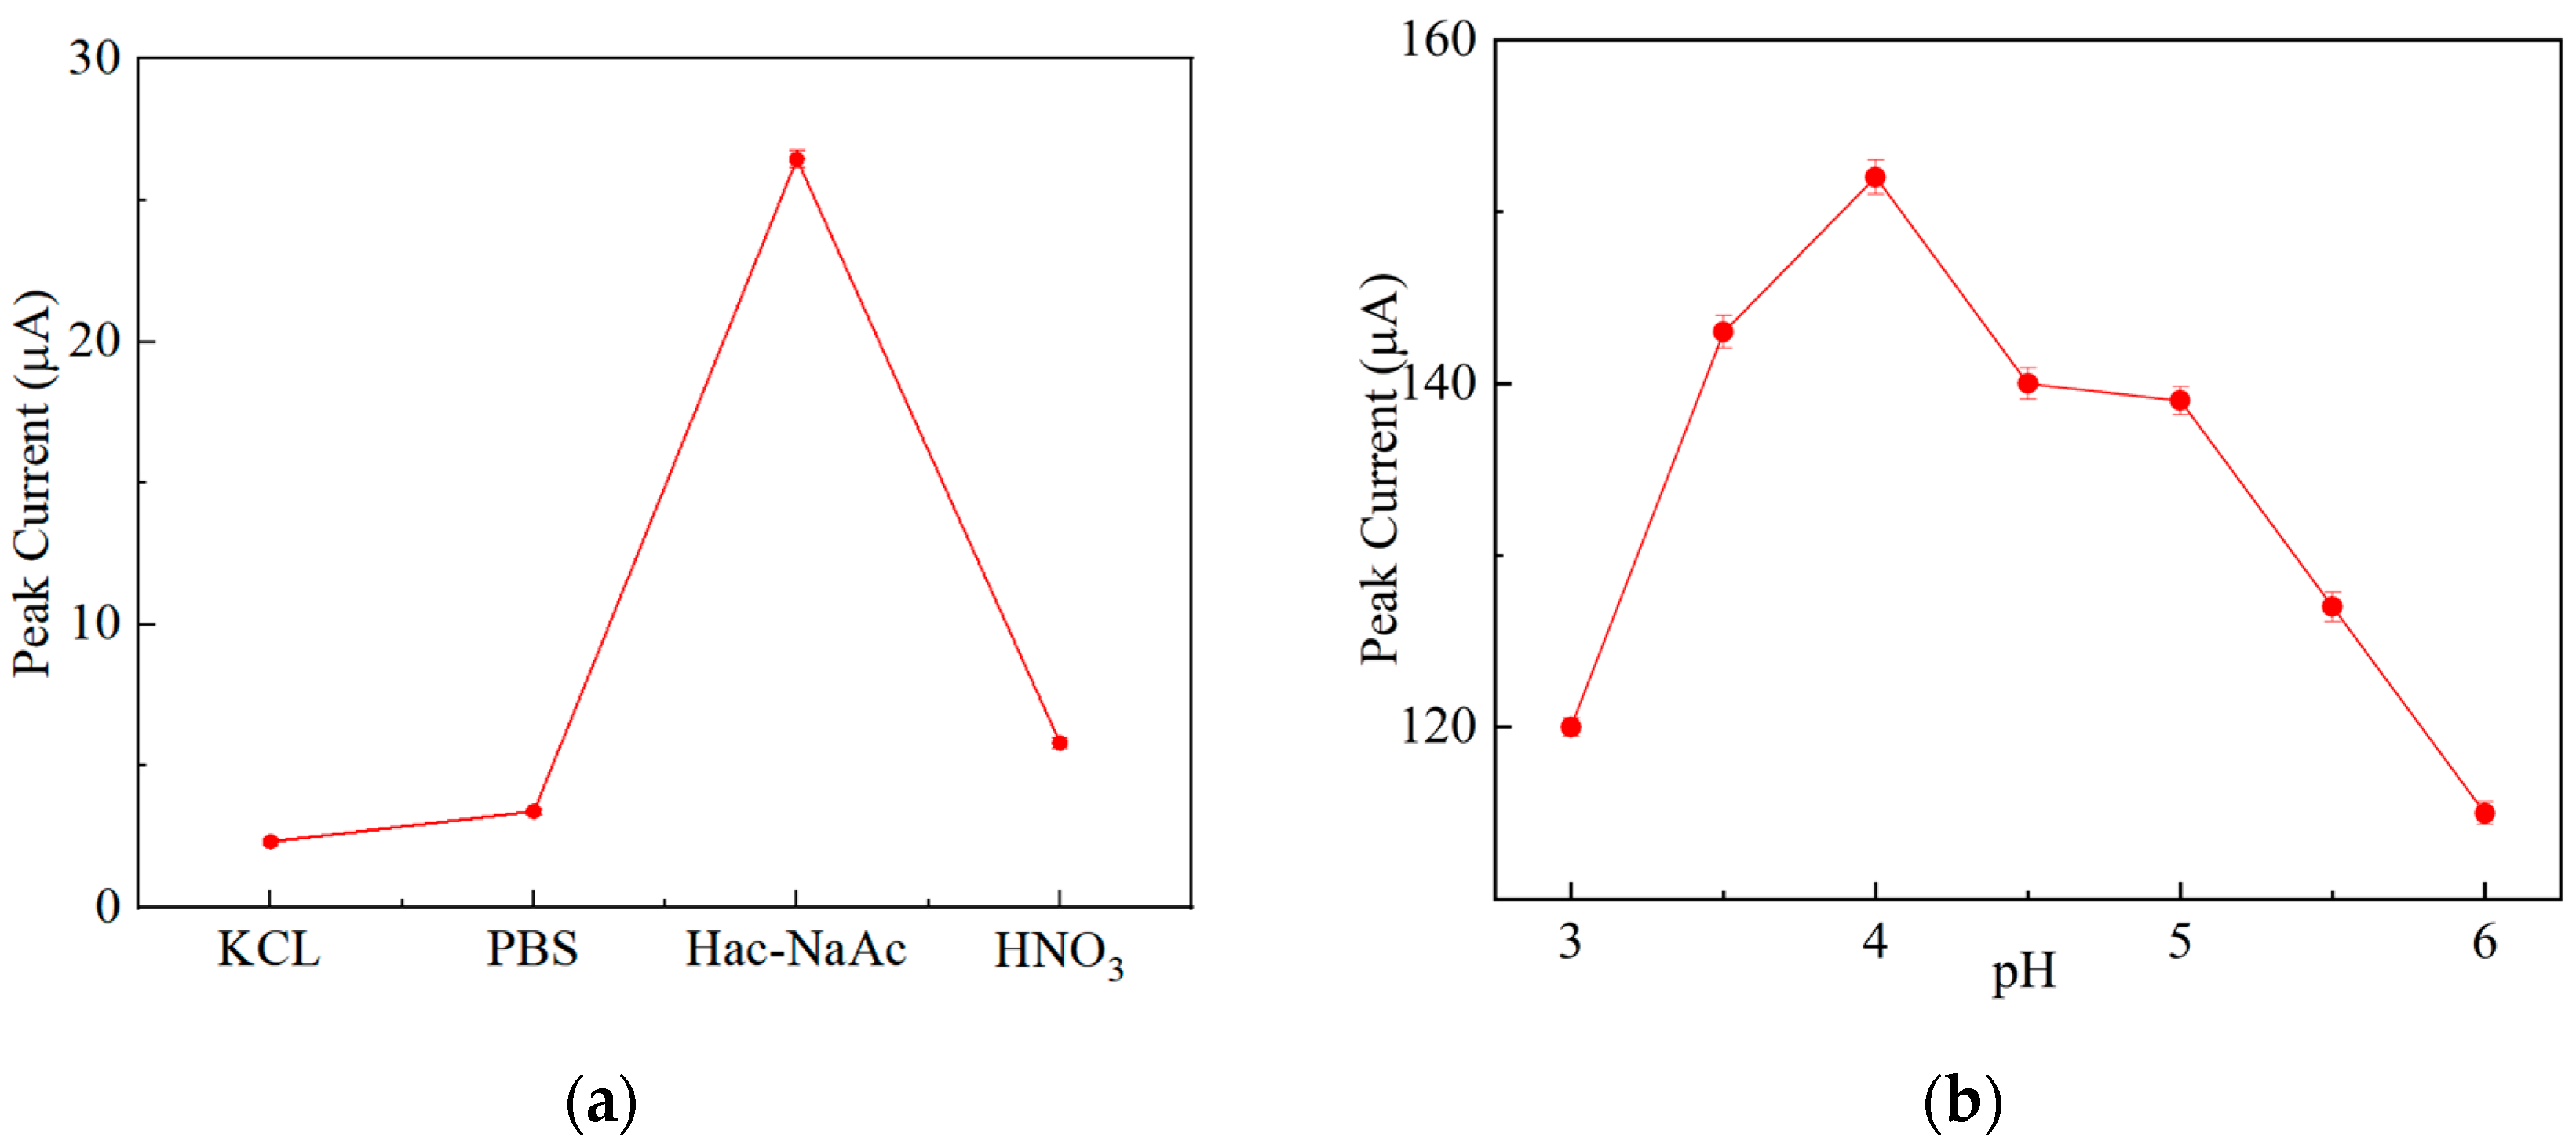
3.4.1. Effect of the Buffer Solution and pH

Considering the influence of different buffer solutions, a DPSV test was performed on GR-MWCNTs-COOH/CeO2/Nafion/GCE in four different buffer solutions, all containing 25 μg·L−1 of Hg(II), with 0.1 mol·L−1 of KCl, PBS, HNO3, and HAc–NaAc (pH = 5). As shown in Figure 7a, under the same experimental conditions, the peak current in the HAc–NaAc buffer solution was significantly higher than that in the other three. The main reason is that the relatively high concentration of Na+ and CH3COO in HAc–NaAc results in a higher ionic strength [25], increasing the electron transfer rate. Additionally, the specific reaction between CH3COO and H+ leads to a stronger electrochemical signal and higher peak current [26]. Therefore, HAc–NaAc (0.1 M·L−1, pH = 5) was determined to be the optimal buffer solution for Hg(II) detection.
Using HAc–NaAc (0.1 M·L−1) as the buffer solution, the DPSV curves of GR-MWCNTs-COOH/CeO2/Nafion/GCE were investigated under different pH conditions, as shown in Figure 7b. The peak current was the highest at pH = 4. The main reason is that, when the pH is too low, H+ competes with Hg(II), leading to hydrogen evolution [27], which affects the Hg(II) deposition process. Additionally, an overly acidic environment can increase the background current in the solution [28], thus obscuring the electrochemical response signal of Hg(II). When the pH is too high, Hg(II) is prone to forming hydroxides with OH and complexes with CH3COO, reducing the concentration of Hg(II) and, subsequently, the electrochemical response. Therefore, pH = 4 was determined to be the optimal pH.

3.4.2. Effect of the Deposition Potential and Deposition Time

In the 0.1 M·L−1 HAc–NaAc (pH = 5) environment, the deposition potential and deposition time of GR-MWCNTs-COOH/CeO2/Nafion/GCE were optimized.
As shown in Figure 8a, the peak current reached its maximum when the deposition potential was −1.1 V. This is because an excessively low deposition potential may result in the decomposition of the electrolyte, leading to the generation of numerous bubbles on the electrode surface [29], which hinders the contact between the electrode and the solution, thus affecting the deposition of Hg(II). Conversely, too high a deposition potential results in only a small amount of Hg(II) being reduced and deposited on the electrode [30], with the reduction reaction being insufficiently active to generate sufficient current signals for detection. Therefore, a deposition potential of −1.1 V is optimal.
Under a deposition potential of −1.1 V, the deposition time was optimized. As shown in Figure 8b, the peak current reached its maximum when the deposition time was 300 s. This is because a too-short deposition time results in less Hg(II) being deposited on the electrode surface, leading to a decrease in peak current due to insufficient deposition. Additionally, a short deposition time is unfavorable for forming a diffusion layer near the electrode [31], resulting in insufficient contact between the electrode and Hg(II) in the solution, thus lowering the current signal. On the contrary, an excessively long deposition time allows Hg(II) to continuously deposit on the electrode surface over time, increasing the thickness of the diffusion layer near the electrode, which hinders the contact between the electrode and Hg(II) in the solution, resulting in a decrease in peak current. Therefore, a deposition time of 300 s is optimal.

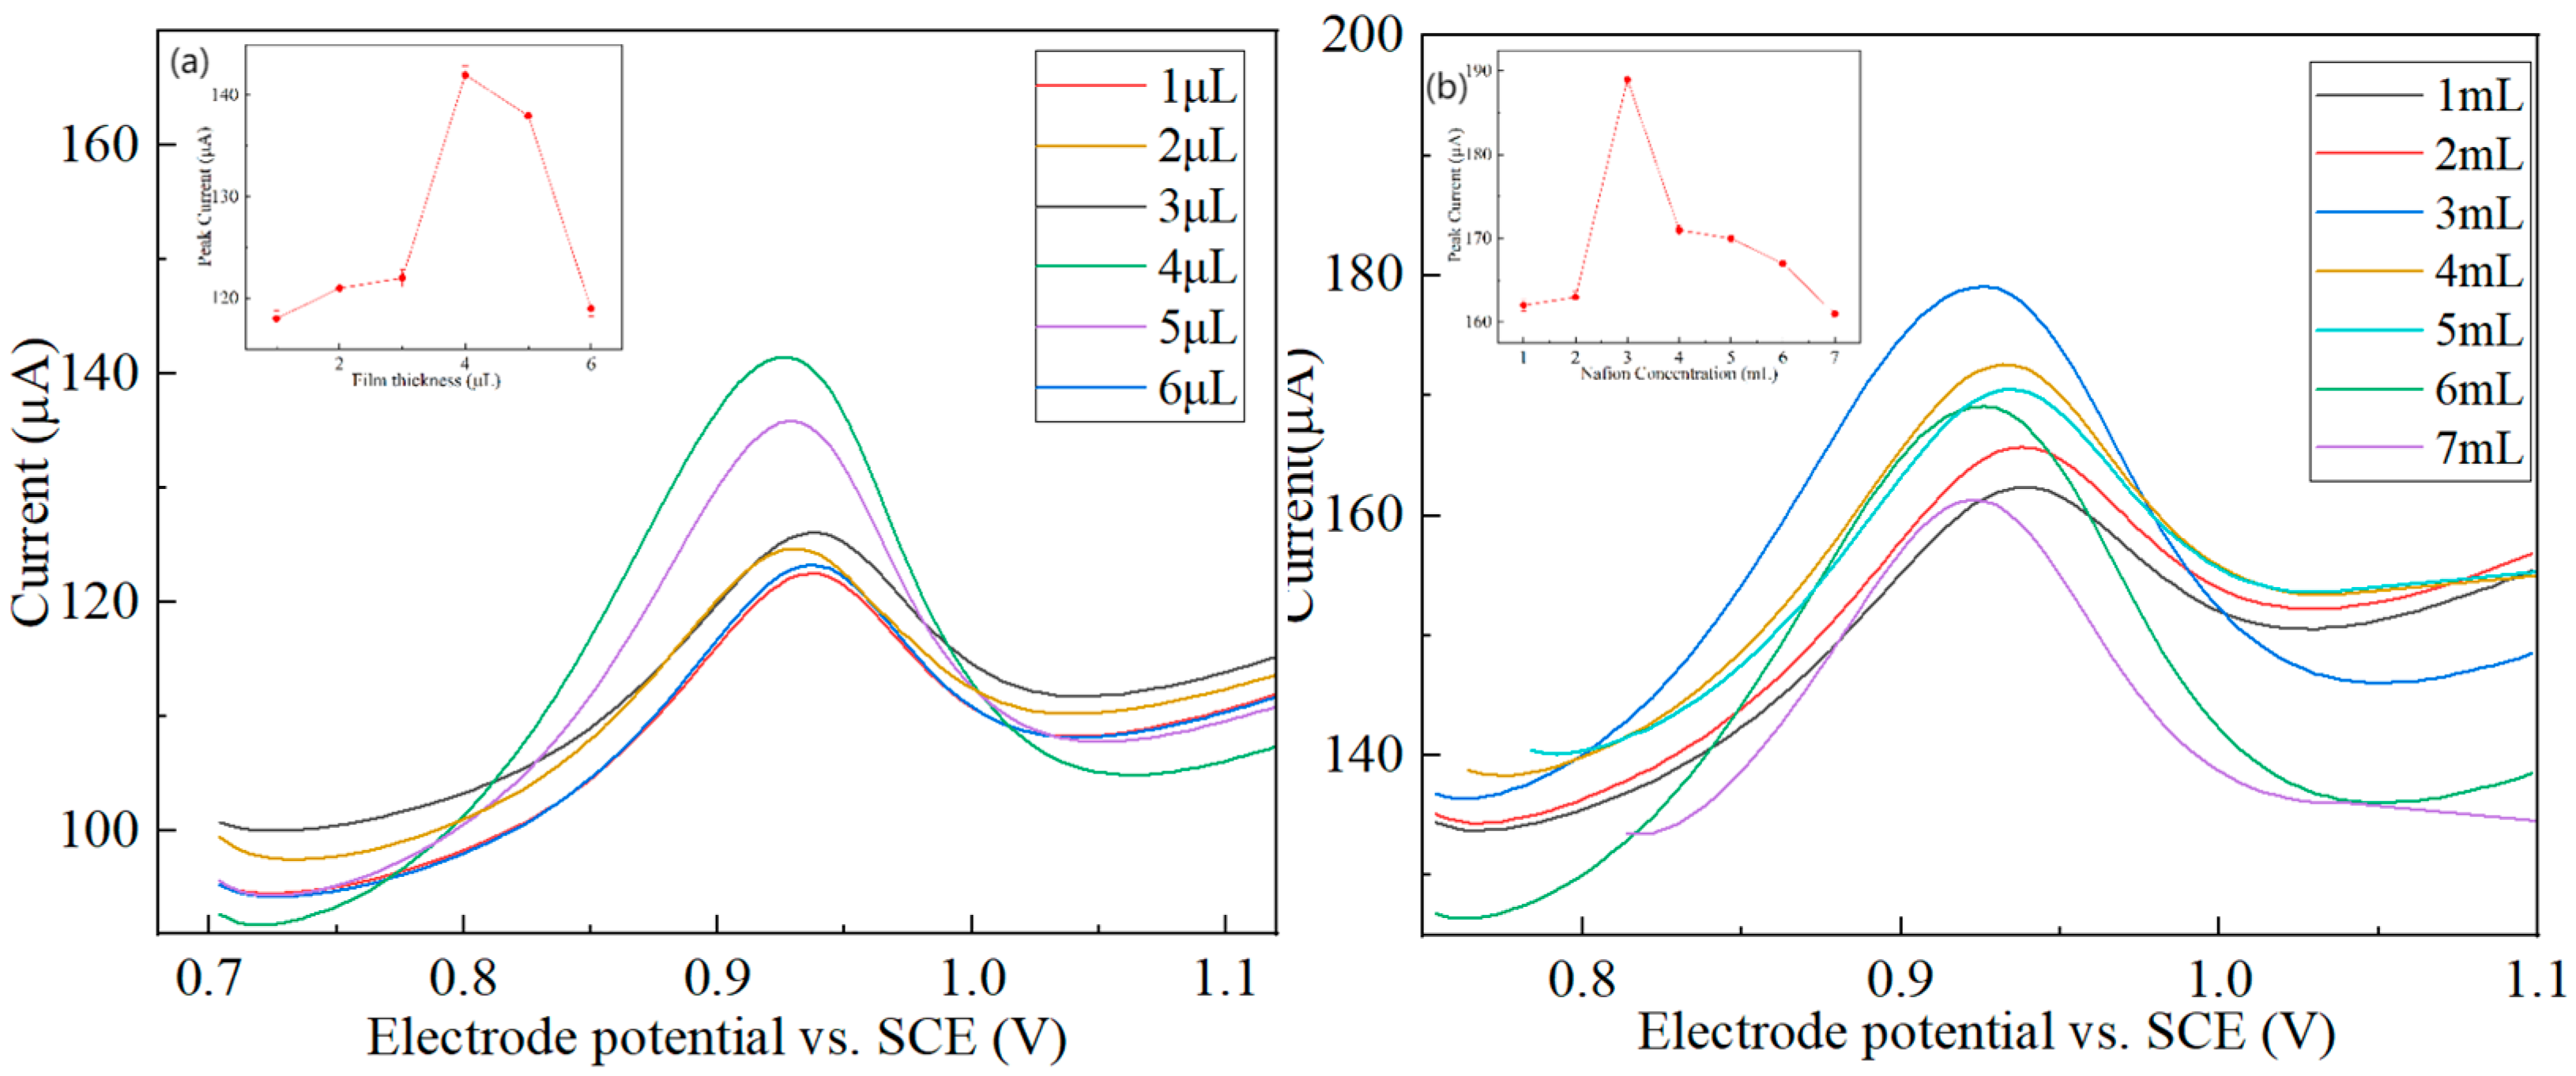
3.4.3. Effect of Membrane Thickness and Nafion Content
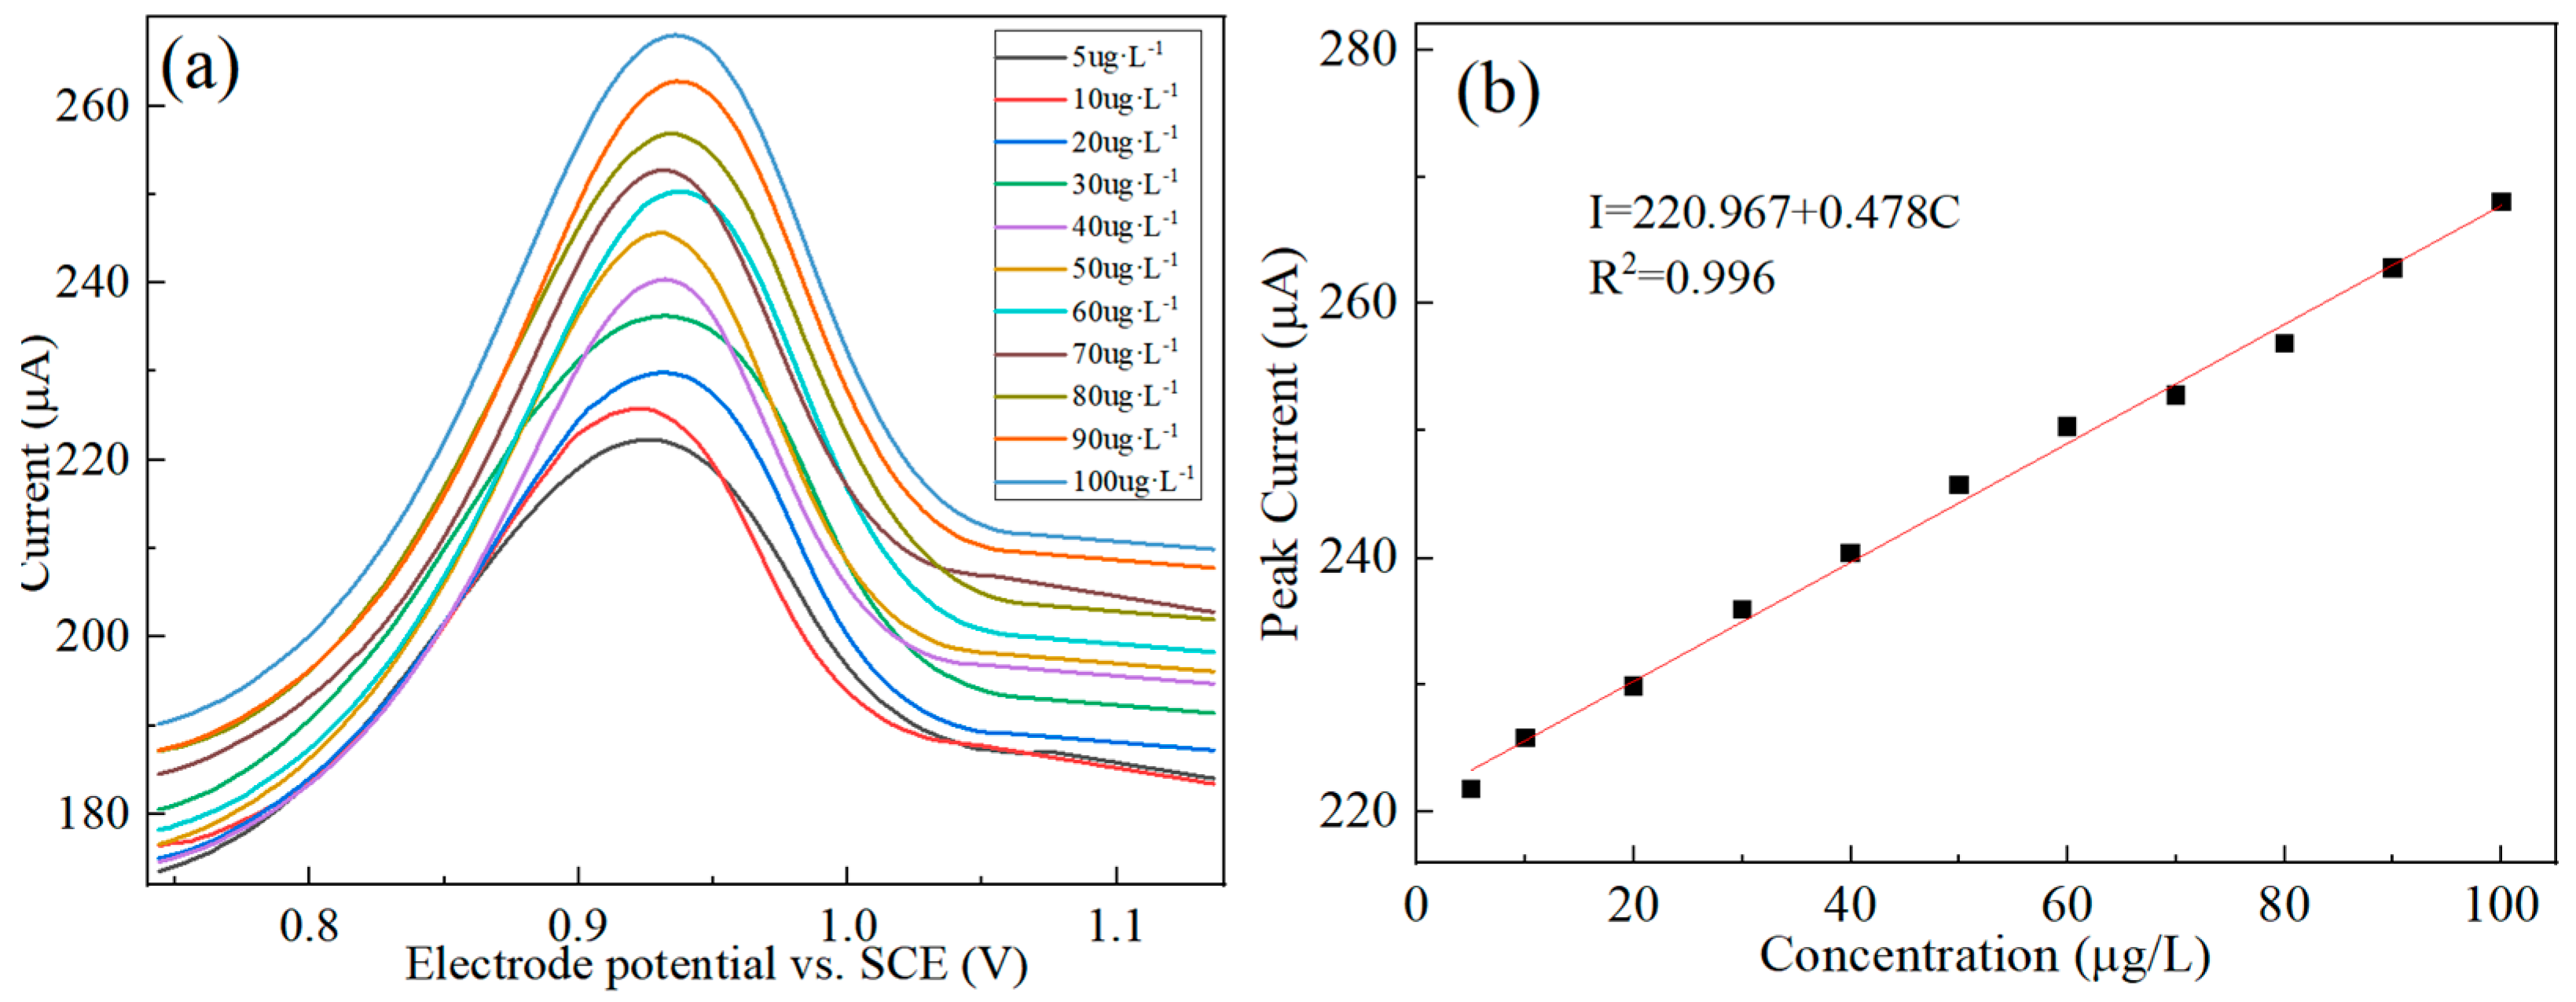
The influence of the thickness of the GR-MWCNTs-COOH/CeO2/Nafion-modified membrane on the peak current response to Hg(II) was investigated. The results are presented in Figure 9a, within which the abscissa represents the content of the GR-MWCNTs-COOH/CeO2/Nafion composite material drop-coated onto the glassy carbon electrode, and the ordinate is the corresponding peak current. It was found that the peak current reached its maximum when the thickness of the modified membrane was 4 μL. The main reason is that, when the modified membrane is too thin, the distribution of active components in the membrane is uneven [32], resulting in a decrease in the number of active sites, which affects the magnitude of the peak current. An excessively thick modified membrane increases the transmission path for Hg(II) between the electrode and the solution [33], increasing the transmission resistance [34] and reducing the efficiency of electron transport, leading to a decrease in the peak current. Therefore, a modified membrane thickness of 4 μL is optimal.
The dependence of the GR-MWCNTs-COOH/CeO2/Nafion-modified membrane on the Nafion content within the range of 1–7 mL was investigated. The results are depicted in Figure 9b, where the abscissa indicates the Nafion content in the GR-MWCNTs-COOH/CeO2/Nafion composite material, and the ordinate represents the corresponding peak current. When the Nafion content was 4 mL, the peak current reached its maximum. Nafion serves as a carrier for active components. When the content is too low, it can lead to uneven dispersion of active components in the membrane. Additionally, Nafion plays a role in proton transport in the modified membrane [35]. Too low a Nafion content affects the number and continuity of proton transport channels [36], limiting proton transport and, in turn, affecting the magnitude of the peak current. However, when the Nafion content is excessively high, an excessive number of proton transport channels hinder the transport of Hg(II) [37], increasing the resistance to Hg(II) transport and making reactions on the electrode surface more difficult, resulting in a decrease in the peak current.

3.5. Standard Curve

Under the optimal experimental conditions, in 0.1 M·L−1 HAc–NaAc (pH = 4) buffer solution, the current signals of the modified electrodes in response to Hg(II) concentrations ranging from 50 to 100 μg·L−1 were investigated using DPSV. The results are shown in Figure 10a, and the corresponding linear regression curve is depicted in Figure 10b. The linear regression equation for the Hg(II) concentration is I = 0.478C + 220.967, with a linear correlation coefficient of R2 = 0.996. The detection limit was determined to be 0.389 μg·L−1. The experimental results indicate that GR-MWCNTs-COOH/CeO2/Nafion/GCE exhibits excellent electrochemical performance and a low detection limit for Hg(II) detection.

3.6. Anti-Interference Capability
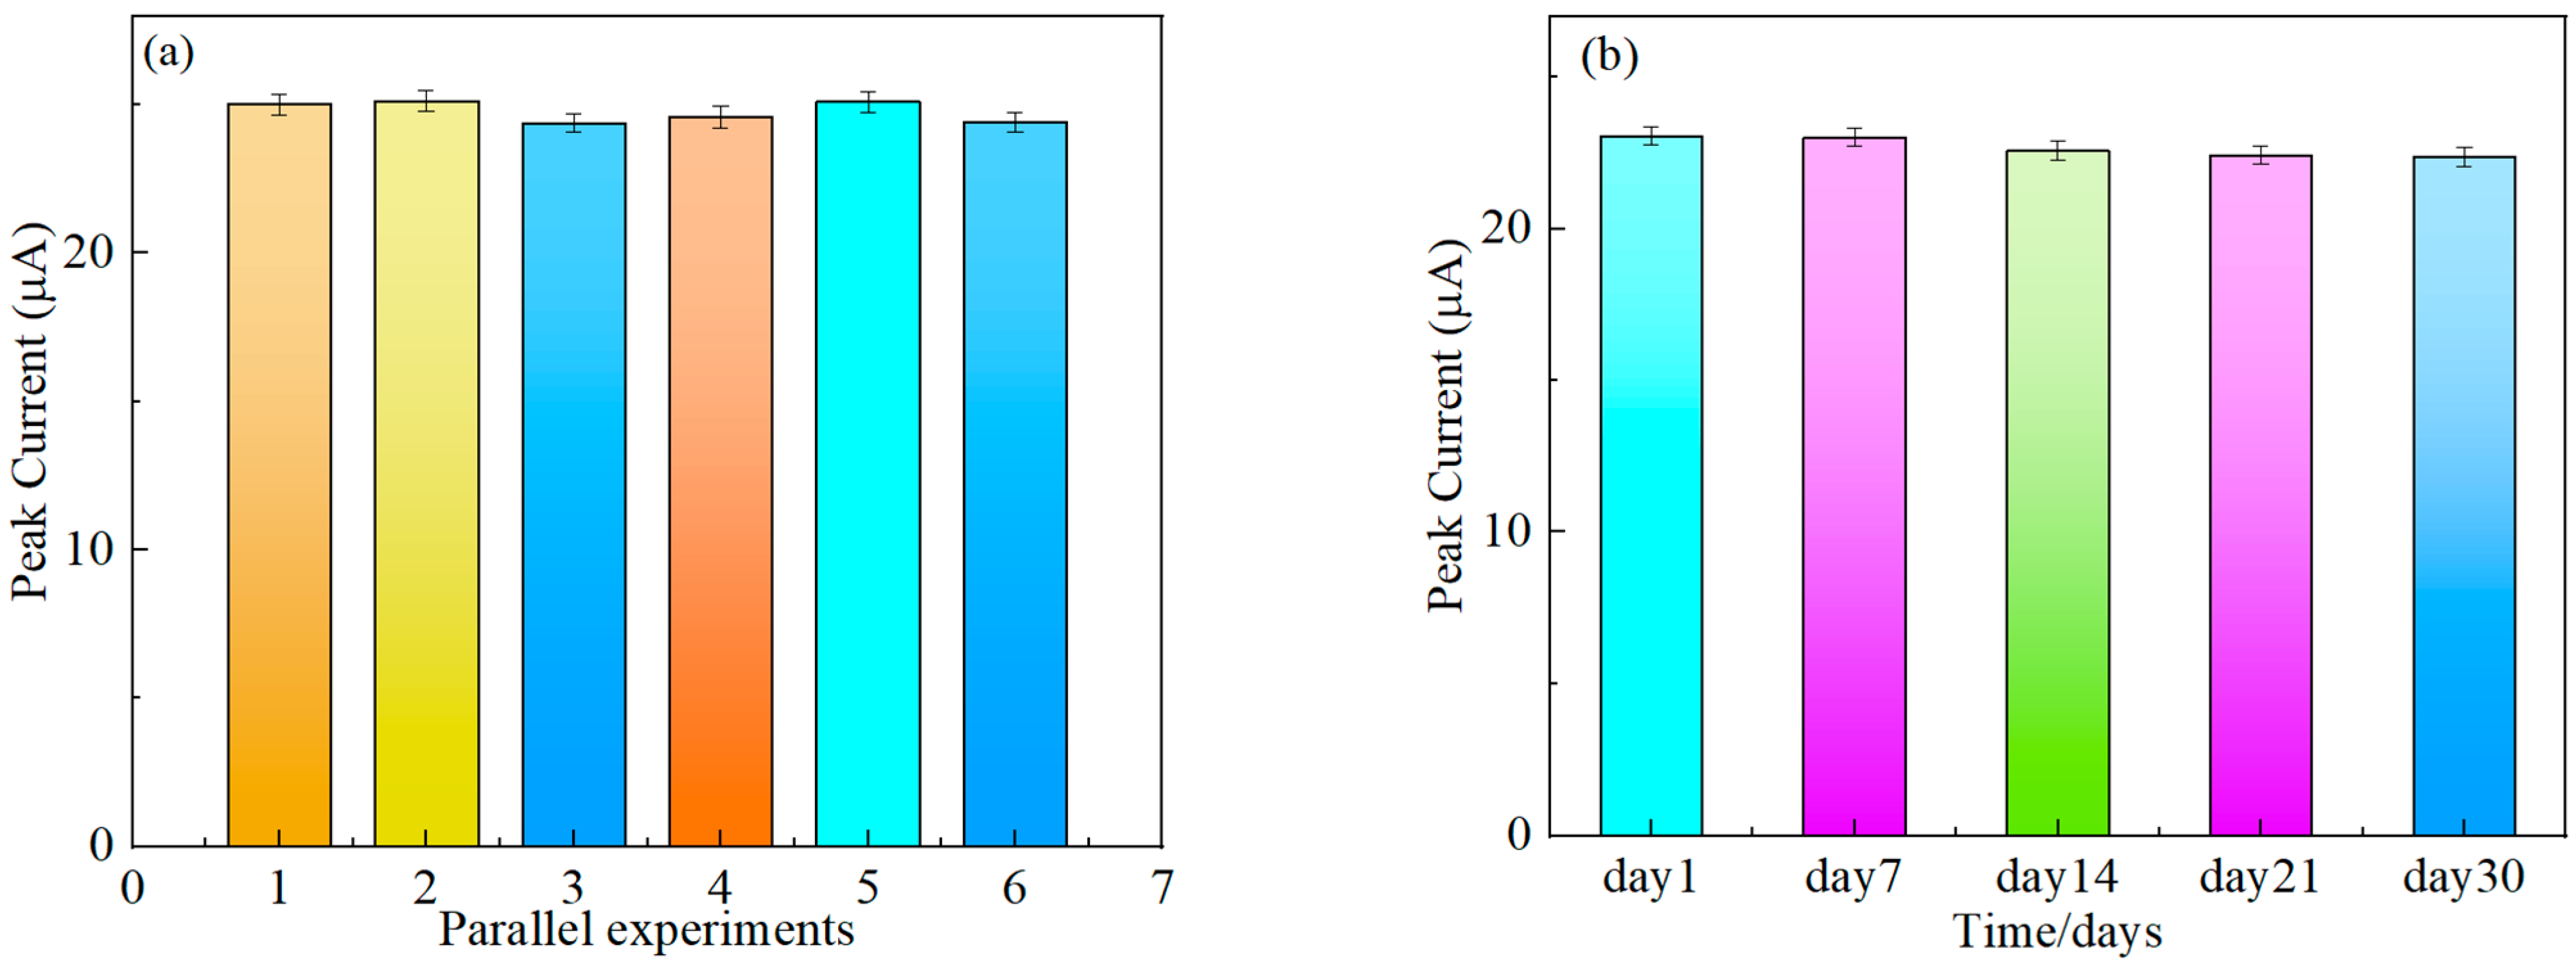
To evaluate the detection performance of the modified electrode, DPSV detection was performed in a 25 μg·L−1 Hg(II) solution with the addition of 100-fold concentrations of Zn(II), Cr(II), Cu(II), Pb(II), and Cd(II) interfering ions. The results are shown in Figure 11. The calculations show that the effects of these interfering ions on the change in Hg(II) peak current were all within 4.5%, indicating that GR-MWCNTs-COOH/CeO2/Nafion/GCE has good anti-interference capability.

3.7. Stability

Stability is an important indicator for evaluating the practicality of a sensor. To assess the stability of GR-MWCNTs-COOH/CeO2/Nafion/GCE, six consecutive DPSV detections were performed in a 0.1 M·L−1 HAc–NaAc (pH = 4) buffer solution with a Hg(II) content of 25 μg·L−1. The experimental results are shown in Figure 12a. The calculations show that the variation rates of the peak currents were all below 2.5%, indicating that GR-MWCNTs-COOH/CeO2/Nafion/GCE exhibits good stability.
To further verify the stability of GR-MWCNTs-COOH/CeO2/Nafion/GCE, DPSV detections were performed on GR-MWCNTs-COOH/CeO2/Nafion/GCE in a 0.1 M·L−1 HAc–NaAc (pH = 4) buffer solution with a Hg(II) content of 25 μg·L−1 over a continuous period of 30 days. The experimental results are shown in Figure 12b. The calculations reveal that the variation rates of the peak currents remained below 3.1%, further confirming the excellent stability of GR-MWCNTs-COOH/CeO2/Nafion/GCE.

3.8. Reproducibility

Six different batches of GCEs were modified using the same GR-MWCNTs-COOH/CeO2/Nafion composite material. Each modified electrode was then subjected to DPSV detection in a 0.1 mol·L−1 HAc–NaAc (pH = 4) buffer solution containing 25 μg·L−1 of Hg(II). The experimental results are shown in Figure 13. The calculations reveal that the variation rates of the peak currents were all below 5.3%, indicating that the modified electrode exhibits excellent reproducibility.

3.9. Sample Analysis

Maowei Bay in Qinzhou City, Guangxi, China, is a coastal zone of common estuaries mainly fed by the Qinjiang and Maolingjiang Rivers. Water samples were collected from four different locations in Maowei Bay. After being left to stand for 3 days, they were filtered through a 0.45 μL microporous filter membrane and pretreated with ultraviolet light. Then, the collected seawater was measured using GR-MWCNTs-COOH/CeO2/Nafion/GCE. The experimental results are shown in Table 1, with a recovery rate ranging from 94.72% to 103.8% and RSDs ≤ 5.79%. The experimental results indicate that GR-MWCNTs-COOH/CeO2/Nafion/GCE can be applied to detecting Hg(II) in actual seawater.

4. Conclusions

In this study, a GR-MWCNTs-COOH/CeO2/Nafion composite material was used to modify a glassy carbon electrode, resulting in the preparation of GR-MWCNTs-COOH/CeO2/Nafion/GCE with a larger specific surface area and faster electron transport efficiency. This modified electrode was then utilized to construct a sensor for the detection of Hg(II) in seawater. The modified electrode was characterized morphologically and electrochemically using SEM and CV, and the experimental conditions were optimized. The optimal buffer solution was HAc–NaAc (0.1 M·L−1, pH = 4), with an optimal deposition potential of −1.1 V, a deposition time of 300 s, and an optimal membrane thickness of 4 μL for the modified electrode. Considering the unique properties of Nafion, the Nafion content was optimized, resulting in an optimal Nafion content of 4 mL. Under the optimal experimental conditions, the sensor exhibited a good linear relationship between the peak current response and the concentration of Hg(II) in the range of 5~100 μg·L−1, with a detection limit of 0.389 μg·L−1. Actual seawater samples were collected from four different locations in Maowei Bay for testing, and the recovery rate ranged from 94.72% to 103.8%, with RSDs ≤ 5.79%. Based on the above experimental conclusions, this sensor can achieve high-sensitivity detection of Hg(II) in seawater, providing a new option for detecting Hg(II) in seawater.

Author Contributions

H.H.: methodology, writing—original draft preparation, writing—review and editing; C.Q.: resources, writing—review and editing, project administration; W.Q.: methodology, supervision, writing—review and editing; Y.Z.: investigation, writing—review and editing; X.H.: software, data curation, writing—review and editing; W.T.: conceptualization, software; Y.G.: conceptualization, formal analysis; Z.Z.: validation, conceptualization; H.L.: formal analysis, conceptualization; W.W.: validation, conceptualization. All authors have read and agreed to the published version of the manuscript.

Funding

Supported by the National Natural Science Foundation of China (No. 52161042), High-end Foreign Experts Introduction Program (G2022033007L), CSSC Guangxi Shipbuilding and Marine Engineering Technology Cooperation Project (ZCGXJSB20226300222-06), and Qinzhou Scientific Research and Technology Development Program (202116622).

Institutional Review Board Statement

Not applicable.

Informed Consent Statement

Not applicable.

Data Availability Statement

The original contributions presented in the study are included in the article, further inquiries can be directed to the corresponding author.

Conflicts of Interest

The authors declare no conflict of interest.

References

  1. Subedi, S.; Neupane, L.N.; Yu, H.; Lee, K.-H. A New Ratiometric Fluorescent Chemodosimeter for Sensing of Hg2+ in Water Using Irreversible Reaction of Arylboronic Acid with Hg2+. Sens. Actuator B-Chem. 2021, 338, 129814. [Google Scholar] [CrossRef]
  2. Luo, L.; Xi, C.; Zhuo, J.; Liu, G.; Yang, S.; Nian, Y.; Sun, J.; Zhu, M.-Q.; Wang, J. A Portable Dual-Mode Colorimetric Platform for Sensitive Detection of Hg2+based on NiSe2 with Hg2+ Activated Oxidase-like Activity. Biosens. Bioelectron. 2022, 215, 114519. [Google Scholar] [CrossRef] [PubMed]
  3. Zhou, J.; Wei, D.; Hu, C.; Li, S.; Ma, L.; Chen, Z.; Deng, Y. A Simple Label-Free Electrochemical Aptamer Sensor for Detection of Hg2+based on Black Phosphorus. Mater. Express 2022, 12, 802–809. [Google Scholar] [CrossRef]
  4. Huang, J.; Dong, R.; Habibul, M.; Zhang, Y.; Guan, M.; Li, G. An Electrochemiluminescence Aptasensor Based on Poly(Aniline-Luminol)/Graphene Oxide/Chitosan for Ultra-Sensitive Detection of Hg2+. Polym. Bull. 2023, 80, 12945–12958. [Google Scholar] [CrossRef]
  5. Xiao, W.; Xu, W.; Huang, W.; Zhou, Y.; Jin, Z.; Wei, X.; Li, J. Bismuth-Based BiOBrXI1-X/Ti3C2 MXene Schottky Nanocomposites for Hg2+Photoelectrochemical Sensors. ACS Appl. Nano Mater. 2022, 5, 18168–18177. [Google Scholar] [CrossRef]
  6. GB5749-2022; Standards for Drinking Water Quality. 2023. Available online: https://www.codeofchina.com/standard/GB5749-2022.html (accessed on 16 May 2024).
  7. Hao, B.; Bu, X.; Wu, J.; Ding, Y.; Zhang, L.; Zhao, B.; Tian, Y. Determination of Hg2+ in Water Based on Acriflavine Functionalized AgNPs by SERS. Microchem J. 2020, 155, 104736. [Google Scholar] [CrossRef]
  8. Zulhairee, M.; Zain, R.M.; Nor, A.C.M.; Jafar, N.F.; Noh, M.F.M.; Noorden, M.S.A.; Nordin, A.N.; Ab Rahim, R.; Gunawan, T.S.; Chin, L.Y.; et al. Clinical Performance of Reverse Transcription Loop-Mediated Isothermal Amplification COVID-19 Assay on Gold-Nanoparticle-Modified Screen-Printed Carbon Electrode Using Differential Pulse Voltammetry. Sens. Mater. 2023, 35, 4731–4750. [Google Scholar] [CrossRef]
  9. Yan, Y.; Zeng, S.; Xu, F.; Hu, Y.; Huang, H. Electrochemical Determination of Acetaminophen with a FeNi Nanoparticle Reduced Graphene Oxide (rGO) Nanocomposite and Differential Pulse Voltammetry (DPV). Anal. Lett. 2024, 57, 996–1007. [Google Scholar] [CrossRef]
  10. Lalmalsawmi, J.; Tiwari, D.; Kim, D.-J.; Kim, D.-J. Simultaneous Detection of Cd2+ and Pb2+ by Differential Pulse Anodic Stripping Voltammetry: Use of Highly Efficient Novel Ag0(NPs) Decorated Silane Grafted Bentonite Material. J. Electroanal. Chem. 2022, 918, 116490. [Google Scholar] [CrossRef]
  11. Taresh, R.R.; Roushani, M.; Karazan, Z.M. Selective Electrochemical Detection of Chromium Ions in Water Samples by Poly (Rutin)/Carbon Black-Chitosan Nanocomposite-Modified Glassy Carbon Electrode. J. Appl. Electrochem. 2024, 54, 1627–1636. [Google Scholar] [CrossRef]
  12. Arcos, D.; Nuno, D.; Khan, M.F.; Eom, J.; Ametller, L.; Ferrer-Anglada, N. Optoelectronic Characterization of 2D Graphene-Based Heterostructures: Gr/MoS2 and Gr/WS2. Phys. Status Solidi B-Basic Solid State Phys. 2023, 260, 2300202. [Google Scholar] [CrossRef]
  13. Huang, D.; Wang, L.; Zhan, Y.; Zou, L.; Ye, B. Photoelectrochemical Biosensor for CEA Detection Based on SnS2-GR with Multiple Quenching Effects of Au@CuS-GR. Biosens. Bioelectron. 2019, 140, 183–190. [Google Scholar] [CrossRef]
  14. Wu, Q.; Tian, L.; Shan, X.; Li, H.; Yang, S.; Li, C.; Song, Y.; Li, R.; Guo, Y.; Lu, J. A Molecule-Imprinted Electrochemiluminescence Sensor Based on CdS@MWCNTs for Ultrasensitive Detection of Fenpropathrin. Microchim. Acta 2024, 191, 269. [Google Scholar] [CrossRef]
  15. Wang, Z.; Liu, Y.; Li, F.; Dubovyk, V.; Guo, M.; Zhu, G.; Ran, Q.; Zhao, H. Electrochemical Sensing Platform Based on Graphitized and Carboxylated Multi-Walled Carbon Nanotubes Decorated with Cerium Oxide Nanoparticles for Sensitive Detection of Methyl Parathion. J. Mater. Res. Technol-JMRT 2022, 19, 3738–3748. [Google Scholar] [CrossRef]
  16. Zhu, G.; Zhang, Y.; Liu, Y.; Guo, M.; Zhang, M.; Wu, T.; Li, Y.; Zhao, H. Fabrication of Methyl Parathion Electrochemical Sensor Based on Modified Glassy Carbon Electrode with Graphitized and Carboxylated Multi-Walled Carbon Nanotubes Decorated with Zirconia Nanoparticles. Int. J. Electrochem. Sci. 2022, 17, 220678. [Google Scholar] [CrossRef]
  17. Wu, J.; Liu, X.; Zhang, R.; Zhang, J.; Si, H.; Wu, Z. A Novel (CaO/CeO2)@CeO2 Composite Adsorbent Based on Microinjection Titration-Calcination Strategy for CO2 Adsorption. Chem. Eng. J. 2023, 454, 140485. [Google Scholar] [CrossRef]
  18. Chen, Z.; Patel, R.; Berry, J.; Keyes, C.; Satterfield, C.; Simmons, C.; Neeson, A.; Cao, X.; Wu, Q. Development of Screen-Printable Nafion Dispersion for Electrochemical Sensor. Appl. Sci. 2022, 12, 6533. [Google Scholar] [CrossRef]
  19. Fu, X.; Xia, C.; Qu, J.; Lei, S.; Zuo, X.; Mao, Z.; Liu, Q.; Luo, P.; Zhang, R.; Hu, S. Enhanced Specific Capacitance and Stability of Polyaniline by Nafion Doping. ChemElectroChem 2022, 9, e202200312. [Google Scholar] [CrossRef]
  20. Yang, H.; Xu, K.; Zhang, Q.; Tao, L.; Yang, Z.; Dong, Z. Modified Nafion Membrane in Vanadium Redox Flow Battery. Prog. Chem. 2023, 35, 1595–1612. [Google Scholar] [CrossRef]
  21. Han, Z.-Y.; Pei, S.-P.; Yu, C.-Y.; Zhou, Y.-F. Molecular Dynamics Simulation Studies on the Micromorphology and Proton Transport of Nafion/Ti3C2Tx Composite Membrane. Chin. J. Polym. Sci. 2024, 42, 373–387. [Google Scholar] [CrossRef]
  22. Wen, L.; Dong, J.; Yang, H.; Zhao, J.; Hu, Z.; Han, H.; Hou, C.; Luo, X.; Huo, D. A Novel Electrochemical Sensor for Simultaneous Detection of Cd2+ and Pb2+ by MXene Aerogel-CuO/Carbon Cloth Flexible Electrode Based on Oxygen Vacancy and Bismuth Film. Sci. Total Environ. 2022, 851, 158325. [Google Scholar] [CrossRef]
  23. Guo, M.; Wu, T.; Zhu, G.; Liu, Y.; Zhao, M.; Shen, Y.; Zhou, Y.; Chen, L.; Guo, X.; Wang, Q.; et al. Highly Sensitive Determination of Niclosamide Based on The Graphitized and Carboxylated Multi-Walled Carbon Nanotubes Modified Glassy Carbon Electrode. Int. J. Electrochem. Sci. 2022, 17, 220772. [Google Scholar] [CrossRef]
  24. Kakhki, R.M. Nafion Based Biosensors: A Review of Recent Advances and Applications. Int. J. Polym. Mater. Polym. Biomat. 2023, 1–18. [Google Scholar] [CrossRef]
  25. Zhou, Y.; Wu, T.; Zhang, H.; Zhao, M.; Shen, Y.; Zhu, G.; Guo, M.; Liu, Y.; Li, F.; Zhao, H. Surface Optimization of Glassy Carbon Electrode with Graphitized and Carboxylated Multi-Walled Carbon Nanotubes@β-Cyclodextrin Nanocomposite for Electrochemical Determination of Methyl Parathion. Int. J. Electrochem. Sci. 2022, 17, 220653. [Google Scholar] [CrossRef]
  26. Somer, G.; Kalayci, S. A New and Simple Method for the Simultaneous Determination of Fe, Cu, Pb, Zn, Bi Cr, Mo, Se, and Ni in Dried Red Grapes Using Differential Pulse Polarography. Food Anal. Meth. 2015, 8, 604–611. [Google Scholar] [CrossRef]
  27. Gao, J.; Qiu, C.; Qu, W.; Zhuang, Y.; Wang, P.; Yan, Y.; Wu, Y.; Zeng, Z.; Huang, G.; Deng, R.; et al. Detection of Cd2+ Based on Nano-Fe3O4/MoS2/Nafion/GCE Sensor. Anal. Sci. 2023, 39, 1445–1454. [Google Scholar] [CrossRef] [PubMed]
  28. Xie, Z.; Xu, J.; Xie, F.; Xiong, S. Electrochemical Detection of As(III) by a rGO/Fe3O4-Modified Screen-Printed Carbon Electrode. Anal. Sci. 2016, 32, 1053–1058. [Google Scholar] [CrossRef] [PubMed]
  29. Sahoo, S.; Sahoo, P.K.; Manna, S.; Satpati, A.K. A Novel Low Cost Nonenzymatic Hydrogen Peroxide Sensor Based on CoFe2O4/CNTs Nanocomposite Modified Electrode. J. Electroanal. Chem. 2020, 876, 114504. [Google Scholar] [CrossRef]
  30. Manni, A.; Maallah, R.; El Haddar, A.; Chtaini, A.; Harrati, A.; Sair, S.; El Bouari, A.; El Hassani, I.-E.E.A.; Sadik, C. A Sensitive Electrochemical Sensor Using a Dolomite-Graphite Composite for the Simultaneous Detection of Pb2+ and Cd2+. Iran J. Chem. Chem. Eng.-Int. Engl. Ed. 2023, 42, 3422–3434. [Google Scholar]
  31. Fendrych, K.; Porada, R.; Bas, B. Electrochemical Sensing Platform Based on Zeolite/Graphite/Dimethylglyoxime Nanocomposite for Highly Selective and Ultrasensitive Determination of Nickel. J. Hazard. Mater. 2023, 448, 130953. [Google Scholar] [CrossRef]
  32. Mukherjee, A.G.; Renu, K.; Gopalakrishnan, A.V.; Veeraraghavan, V.P.; Vinayagam, S.; Paz-Montelongo, S.; Dey, A.; Vellingiri, B.; George, A.; Madhyastha, H.; et al. Heavy Metal and Metalloid Contamination in Food and Emerging Technologies for Its Detection. Sustainability 2023, 15, 1195. [Google Scholar] [CrossRef]
  33. Setiyanto, H.; Purwaningsih, D.R.; Saraswaty, V.; Mufti, N.; Zulfikar, M.A. Highly Selective Electrochemical Sensing Based on Electropolymerized Ion Imprinted Polyaniline (IIPANI) on a Bismuth Modified Carbon Paste Electrode (CPE-Bi) for Monitoring Nickel(Ii) in River Water. RSC Adv. 2022, 12, 29554–29561. [Google Scholar] [CrossRef] [PubMed]
  34. Gayathri, J.; Sivalingam, S.; Narayanan, S.S. Novel Synthesized SABA/MWCNTs Composite to Detect Cd2+and Pb2+ions in Real Samples of Rice Water, Tobacco Extract and Raw Milk. J. Mol. Liq. 2023, 387, 122586. [Google Scholar] [CrossRef]
  35. Fu, X.; Wen, J.; Xia, C.; Liu, Q.; Zhang, R.; Hu, S. Nafion Doped Polyaniline/Graphene Oxide Composites as Electrode Materials for High Performance Flexible Supercapacitors Based on Nafion Membrane. Mater. Des. 2023, 236, 112506. [Google Scholar] [CrossRef]
  36. Miranda, M.; Carvetta, C.; Sisodia, N.; Shirley, L.; Day, C.D.; McGuinness, K.L.; Wadhawan, J.D.; Lawrence, N.S. Nafion® Coated Electropolymerised Flavanone-Based pH Sensor. Electroanalysis 2022, 34, 1273–1279. [Google Scholar] [CrossRef]
  37. Khan, I.; Lee, J.H.; Park, J.; Wooh, S. Nano/Micro-Structural Engineering of Nafion Membranes for Advanced Electrochemical Applications. J. Saudi Chem. Soc. 2022, 26, 101511. [Google Scholar] [CrossRef]
Figure 1. SEM MAX = 100 kx: (a) GR-MWCNTs-COOH/Nafion; (b) GR-MWCNTs-COOH/CeO2/Nafion.
Chemosensors 12 00128 g001
Figure 2. SEM MAX = 150 kx: (a) GR-MWCNTs-COOH/Nafion; (b) GR-MWCNTs-COOH/CeO2/Nafion.
Chemosensors 12 00128 g002
Figure 3. Comparative CV diagram of GR-MWCNTs-COOH/CeO2/Nafion/GCE, GR-MWCNTs-COOH/CeO2/GCE, GR-MWCNTs-COOH/Nafion/GCE, and GCE in 1 mM K3[Fe(CN)6] and 0.1 M KCl.
Chemosensors 12 00128 g003
Figure 4. CV diagrams of GR-MWCNTs-COOH/CeO2/Nafion/GCE at different scan rates; anodic and cathodic peak currents vs. square root of scan rate for GR-MWCNTs-COOH/CeO2/Nafion/GCE (inset).
Chemosensors 12 00128 g004
Figure 5. Nyquist plot of 1 mM K3[Fe (CN)6] in 0.1 M of KCl for GR-MWCNTs-COOH/CeO2/Nafion/GCE, GR-MWCNTs-COOH/CeO2/GCE, GR-MWCNTs-COOH/Nafion/GCE, and GCE.
Chemosensors 12 00128 g005
Figure 6. DPSV curves of different electrodes in 25 μg·L−1 of the Hg(II) solution.
Chemosensors 12 00128 g006
Figure 7. (a) Peak currents in different buffer solutions. (b) Peak currents at different pH levels.
Chemosensors 12 00128 g007
Figure 8. (a) DPSV curves under different deposition potentials. Peak currents at different deposition potentials (inset). (b) DPSV curves under different deposition times. Peak currents at different deposition times (inset).
Chemosensors 12 00128 g008
Figure 9. (a) DPSV curves under different drop-coating amounts of the electrode. Peak currents at different membrane thicknesses (inset). (b) DPSV curves at different 0.25% Nafion concentrations. Peak currents with different Nafion contents (inset).
Chemosensors 12 00128 g009
Figure 10. (a) DPSV curves of GR-MWCNTs-COOH/CeO2/Nafion/GCE for different Hg(II) concentrations. (b) Corresponding linear regression curve.
Chemosensors 12 00128 g010
Figure 11. Peak currents of the Hg(II) solution with the addition of 100-fold concentrations of Zn(II), Cr(II), Cu(II), Pb(II), and Cd(II) interfering ions.
Chemosensors 12 00128 g011
Figure 12. (a) Peak currents of GR-MWCNTs-COOH/CeO2/Nafion/GCE in six consecutive DPSV detections. (b) Peak currents of GR-MWCNTs-COOH/CeO2/Nafion/GCE in DPSV detections conducted on the same electrode over a period of 30 days.
Chemosensors 12 00128 g012
Figure 13. Peak currents of six different batches of GR-MWCNTs-COOH/CeO2/Nafion/GCE in the DPSV detections.
Chemosensors 12 00128 g013
Table 1. Determination of Hg(II) in real seawater using GR-MWCNTs-COOH/CeO2/Nafion/GCE.
SampleAdded (μg·L−1)Found (μg·L−1)Recovery %RSD %
15051.88103.802.61
25049.5999.185.79
35047.5795.143.52
45047.4094.723.78
Disclaimer/Publisher’s Note: The statements, opinions and data contained in all publications are solely those of the individual author(s) and contributor(s) and not of MDPI and/or the editor(s). MDPI and/or the editor(s) disclaim responsibility for any injury to people or property resulting from any ideas, methods, instructions or products referred to in the content.

