Article

Voltammetric Investigation of Paracetamol Detection in Acidic Conditions by Using Cork-Modified Carbon Paste Electrodes

by
Mayra K. S. Monteiro
1,
Mayara M. S. Monteiro
2,
João M. M. Henrique
3,
Carlos A. Martínez-Huitle
1,*,
Sergio Ferro
4 and
Elisama Vieira dos Santos
1
1
Laboratório de Eletroquímica Ambiental e Aplicada, Instituto de Química, Universidade Federal do Rio Grande do Norte, Natal CEP 59.072-900, RN, Brazil
2
Agência Brasileira de Apoio à Gestão do Sistema Único de Saúde (AgSUS), SBS Quadra 2, Bloco J, Lote 10, 7º andar, Edifício Carlton Tower Asa Sul, Brasília CEP 70.070-120, DF, Brazil
3
Instituto Federal do Sertão Pernambucano, IFSertãoPE, Estrada do Tamboril, s/n—Vila Quixada, Ouricuri CEP 56.200-000, PE, Brazil
4
Ecas4 Australia Pty. Ltd., Mile End South, SA 5031, Australia
*
Author to whom correspondence should be addressed.
Chemosensors 2024, 12(9), 183; https://doi.org/10.3390/chemosensors12090183
Submission received: 15 July 2024 / Revised: 25 August 2024 / Accepted: 4 September 2024 / Published: 10 September 2024

Abstract

:
Developing new products that satisfy performance and durability expectations while also addressing environmental concerns is possible through the reuse of residues produced by industrial processes, aiming to fulfill the principles of circular economy. In this study, we improved the performance of a carbon paste sensor by incorporating untreated (RC) and regranulated/thermally treated (RGC) cork, which are considered biomass residues from the cork industry. We explored the electroanalytical behavior of paracetamol in sulfuric acid solutions using cyclic voltammetry and differential pulse techniques. The cork-modified carbon paste sensors showed greater sensitivity towards paracetamol. Both modified sensors allowed for an excellent resolution in distinguishing the voltammetric responses of paracetamol in sulfuric acid, showing for both an increase in peak currents compared to the unmodified carbon paste electrode. The quantification of paracetamol without interference has proved to be a feasible operation for the RC- and RGC-modified carbon paste sensors; notably, the first showed the most favorable limits of detection (LD = 2.4112 µM) and quantification (LQ = 8.0373 µM) for paracetamol in the sulfuric acid solution, performing significantly better than the second (LD = 10.355 µM, and LQ = 34.518 µM). Finally, the practical utility of the proposed sensors was assessed by analyzing paracetamol in pharmaceutical samples, obtaining satisfactory results that were in line with those obtainable using high-performance liquid chromatography.

1. Introduction

Acetaminophen, commonly known as paracetamol, is used to reduce fever and to relieve mild pains, such as cold symptoms and headaches, thanks to its action on the temperature regulation system of the Central Nervous System [1]. Currently, it is the most frequently involved medication in cases of self-poisoning, leading to significant morbidity and mortality rates. Considering its potential dangers, the possibility of reclassifying paracetamol, converting it into a drug for which a prescription is required, should be taken into serious consideration [2]. The implementation of a maximum limit in prescription products is aimed at reducing the risk of overdose in instances where patients mistakenly assume incorrect doses while using various pharmaceuticals containing the same ingredients [3]. Acute poisoning from paracetamol can cause serious, and potentially fatal, liver damage, which often manifests in symptoms such as nausea, vomiting, and abdominal pain [4]. Given these concerns, it is essential to quantify the paracetamol content of different commercial drugs to ensure that the labeled dosages correspond to the values analyzed [5]. This could be pivotal in verifying whether pharmaceutical companies adhere to the standards established by regulatory bodies such as the Food and Drug Administration [6].
Several analytical methods have been investigated for the quantification of paracetamol, including gas chromatography, spectrophotometry, high-performance liquid chromatography (HPLC), chemiluminescence, potentiometric electrochemical methods, polarography, and capillary zone electrophoresis [5,7,8,9,10,11]. While chromatographic and spectrophotometric methods are used exclusively for the determination of paracetamol, the tools involved are often expensive to operate and maintain and the pre-treatment processing of the samples is typically time-consuming and complex. On the contrary, analytical methods based on electrochemical sensors have shown distinct and unique properties, such as a rapid response, simple and inexpensive operation procedures, time efficiency, high selectivity, and sensitivity [12,13,14,15,16,17,18,19].
Various types of electrodes have been proposed for the determination of paracetamol, including carbon paste electrodes [4], graphite [20], boron-doped diamond electrodes [1], glassy carbon electrodes [3], graphene paste electrodes [2], and ruthenium electrodes [20]. Among these, carbon paste electrodes have garnered significant attention thanks to their hybrid carbon structure, which exhibits excellent adsorption, conductivity, high sensitivity, lower background current, and ease of preparation and modification of their surfaces [21]. Compared to glassy carbon electrodes, the renewal of the carbon paste surface is crucial for subsequent analyses, as the electrochemical (re)activity of the investigated molecules can alter the surface’s electrode properties [22]. Therefore, the periodic renewal of the carbon paste surface can facilitate the selective and sensitive electrochemical investigation of paracetamol.
Cork, derived from the bark of cork oak (Quercus suber L.), is a completely natural vegetable tissue with a chemical composition comprising suberin (40%), lignin and alkanes (22%), polysaccharides (18%), and extractables (15%). This composition makes cork entirely biodegradable, renewable, and recyclable, among other qualities [23]. The valorization of cork by-products represents a promising avenue for the cork industry, as a significant portion (20–30%) of cork production is typically rejected. Cork powder, a by-product of this waste, exhibits a high adsorption performance after the extraction of its extractables, enabling for its combination with other materials. This positions it as a sustainable option with potential applications in advanced technologies [24,25].
In this study, we compared the performance of cork-modified carbon paste electrodes using both raw cork and thermally treated cork powders as part of the reuse of residues produced by the cork industry, thereby fulfilling the principles of circular economy. We employed cyclic voltammetry (CV) and differential pulse voltammetry (DPV) methods to determine the quantity of paracetamol present in some pharmaceutical formulations in a sensitive and selective way.

2. Materials and Methods

2.1. Chemicals and Reagents

The chemicals utilized were of the highest quality available on the market and were used without further purification. Pure Carbon paste powder (CAS No.: 7782-42-5), Caffeine (CAS No.: 58-08-2), Sulfuric Acid (CAS No.: 7664-93-9), Raw Cork (RC) granules, and ReGranulated Cork (RGC) granules were supplied by Corticeira Amorim, SGPS (Porto, Portugal). The RC and RGC granules had particle sizes between 0.8 and 2 mm. The production of RGC involves treating RC at 380 °C with water vapor injections. Subsequently, RGC particles underwent washing at 60 °C using distilled water, followed by a 24 h drying period at 60 °C to eliminate impurities. Initially, the cork granules were pulverized by grinding in ball mills and sieved through an ABNT N° 200 sieve (φ = 0.150 mm). A detailed textural and surface characterization of the cork used can be found in a previous study [26]. The following medicines were analyzed: (A) Benegrip Multi Noite (800 mg of paracetamol per tablet); (B) Doril Enxaqueca (250 mg of paracetamol per tablet); (C) Sonridor (500 mg of paracetamol per tablet); (D) Naldecon Noite (800 mg of paracetamol per tablet); and (E) Tolife (1000 mg of paracetamol per tablet). Aqueous solutions were prepared using double-distilled deionized water.

2.2. Apparatus

Voltammetric analyses, including cyclic voltammetry (CV) and differential pulse voltammetry (DPV), were conducted using an Autolab PGSTAT302N model connected to a PC running NOVA 1.11 software for data processing. A platinum wire served as the auxiliary electrode, and all potentials were referenced against an Ag/AgCl electrode immersed in saturated KCl solution. The working electrodes employed in this study had an exposed geometric area of 3.14 mm2, which was polished with polish paper before and after each measurement. Experiments were conducted at room temperature (25 °C) and atmospheric pressure (1 atm). An FRA impedance potentiostatic module (instrument AUT85282) was used to perform the impedance electrochemical spectroscopy measurements with the follow conditions: frequency scan: 100,000 (Hz); amplitude (V): 0.01; integration time (s): 0.125; minimum number of cycles to integrate 1; minimum number of cycles to record 10; number of frequencies 50; estimated duration 4 m; potential (V): 0.520; and current range: 1 mA.

2.3. Preparation of Modified Carbon Paste Sensors

Two sensors based on modified carbon paste, X1 (incorporating RC) and X2 (containing RGC), were prepared; in both cases, the amount of cork used was set to 70% of the quantity of carbon paste, which for each sensor was equal to 0.6 g. This proportion was considered based on previous investigations [26]. The carbon paste–cork mixtures were homogenized in a mortar with a pestle, aided by the use of mineral oil (NATIVITA Pharmaceutica, Juiz de Fora, MG, Brazil), until a pasty consistency was achieved. A total of 30 drops of oil were used for the RC-modified paste, while 40 drops were used for the RGC-modified paste. Only 10 drops of oil were used for the unmodified carbon paste electrode, X3. Each paste was transferred into a 200 μL polypropylene Eppendorf nozzle (model K31-200Y), which served as a support. Finally, a 0.5 mm-thick platinum wire from Degussa S.A. (São Paulo, SP, Brazil) was inserted into the nozzle containing the paste and left to rest for 24 h at 25 °C.

2.4. Samples Preparation

The pharmaceutical products subjected to analysis were prepared using the following protocol: 10 tablets were individually weighed and the average weight per tablet was determined. Subsequently, the tablets were meticulously ground in a mortar until a fine powder was obtained. A quantity of powder equivalent to the average weight of the tablet was then dissolved in 20 mL of water using sonication for 5 m. The resulting solution was centrifuged for 5 m at 4000 rpm, and then diluted by a factor of 1:100 (v/v) in 0.5 M H2SO4. An appropriate amount of the prepared sample was added to the supporting electrolyte in the cell for voltammetric analysis.

2.5. Procedure for Measuring Paracetamol Using the Cork-Carbon Paste Sensors

The sensors underwent electroactivation by performing 20 voltammetric cycles from +0.60 V to +0.9 V at a scan rate of 50 mV/s. Measurements using differential pulse voltammetry (DPV) were typically performed with the following parameters: scan rate of 50 mV/s, equilibrium time of 10 s, modulation time of 0.04 s, initial potential of 0.6 V, final potential of +1.2 V, potential step of +0.005 V, modulation amplitude of +0.05 V, and deposition potential of +0.3 V for 10 s.
For the determination of paracetamol, analytical curves were recorded. The intensity of the current peak was evaluated as a function of the analyte concentration, with 16 points obtained by adding 10, 20, 30, 40, 50, 100, 200, 300, 400, 500, 600, 700, 800, 900, 1000, and 1100 μL of paracetamol solution (0.01 mol/L) to 20 mL of carrier electrolyte (0.5 M H2SO4). Prior to each curve, the surface of the working electrode was left in contact with the electrolyte for 10 m.
To quantify paracetamol in a complex matrix (real samples), the standard addition method was used. Paracetamol was quantified in real samples of commercial drugs by adding 0.3 mL of sample solution to 20 mL of carrier electrolyte, followed by the sequential addition of 3 × 100 µL of paracetamol (0.01 mol/L), resulting in three additional data points. Several experiments and analysis were replicated to minimize the experimental error, with a confidence level of >95% for all determinations, but only one set of data was chosen as the best.

3. Results and Discussion

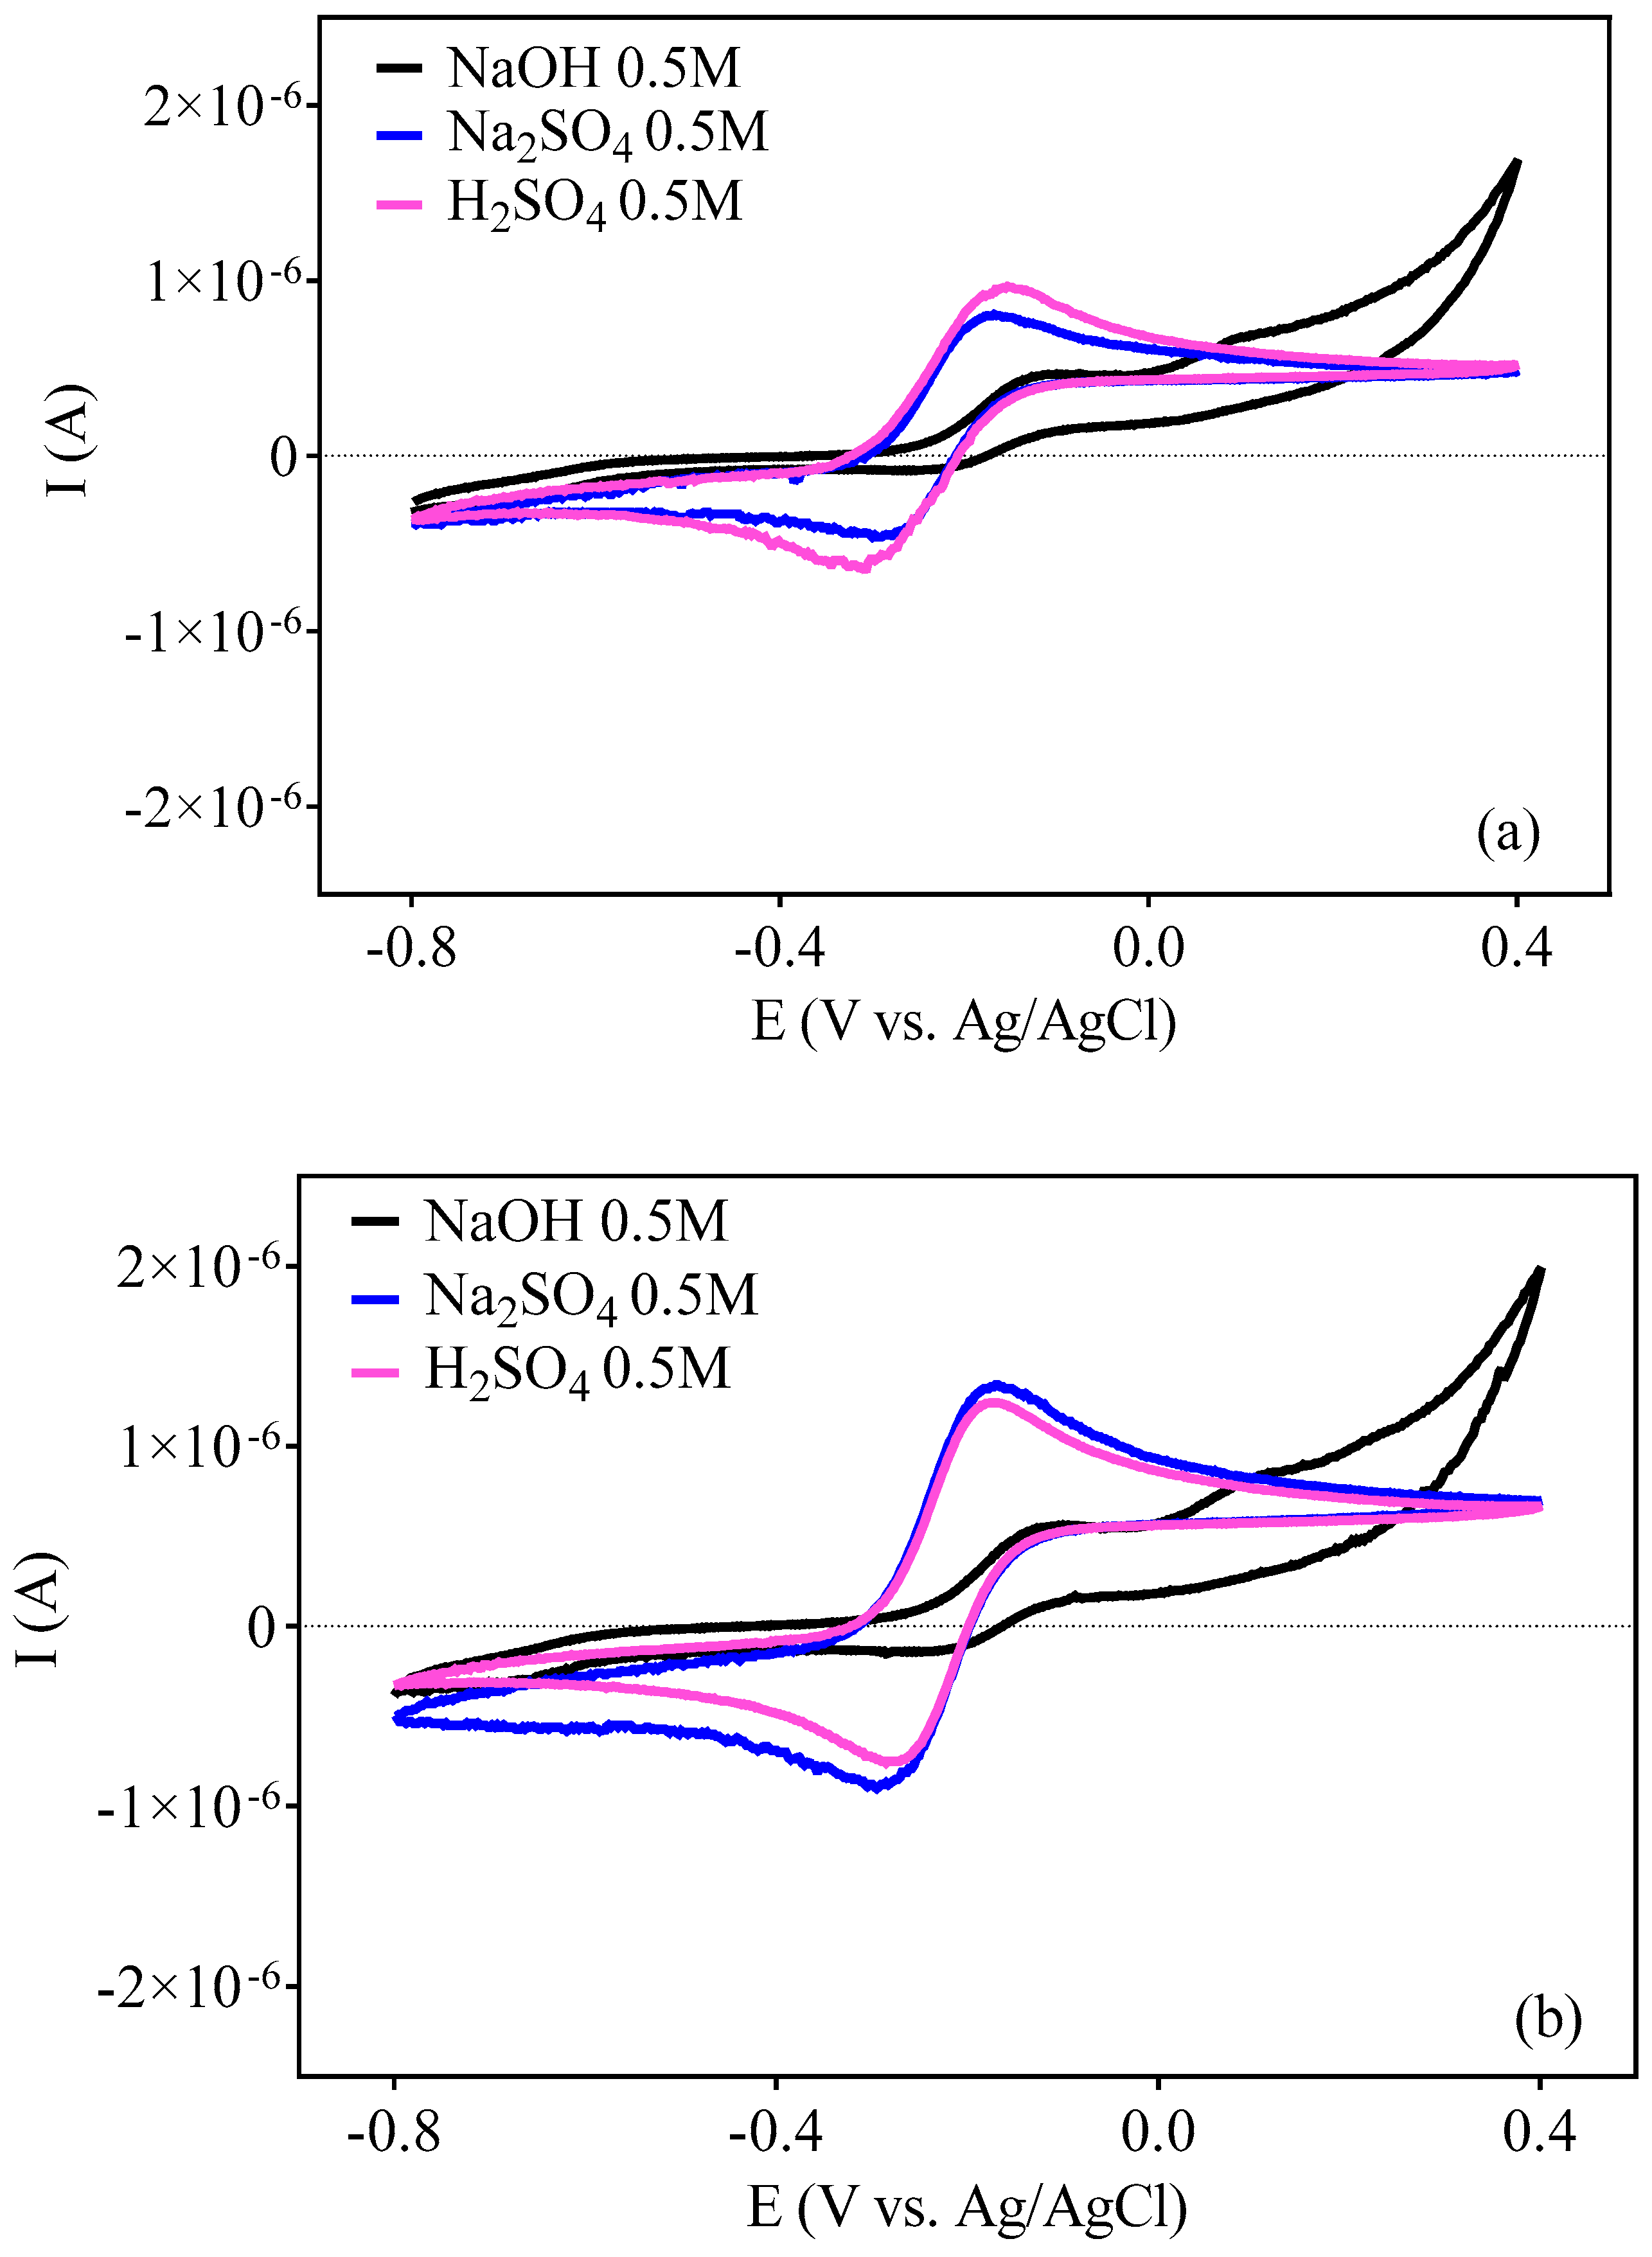
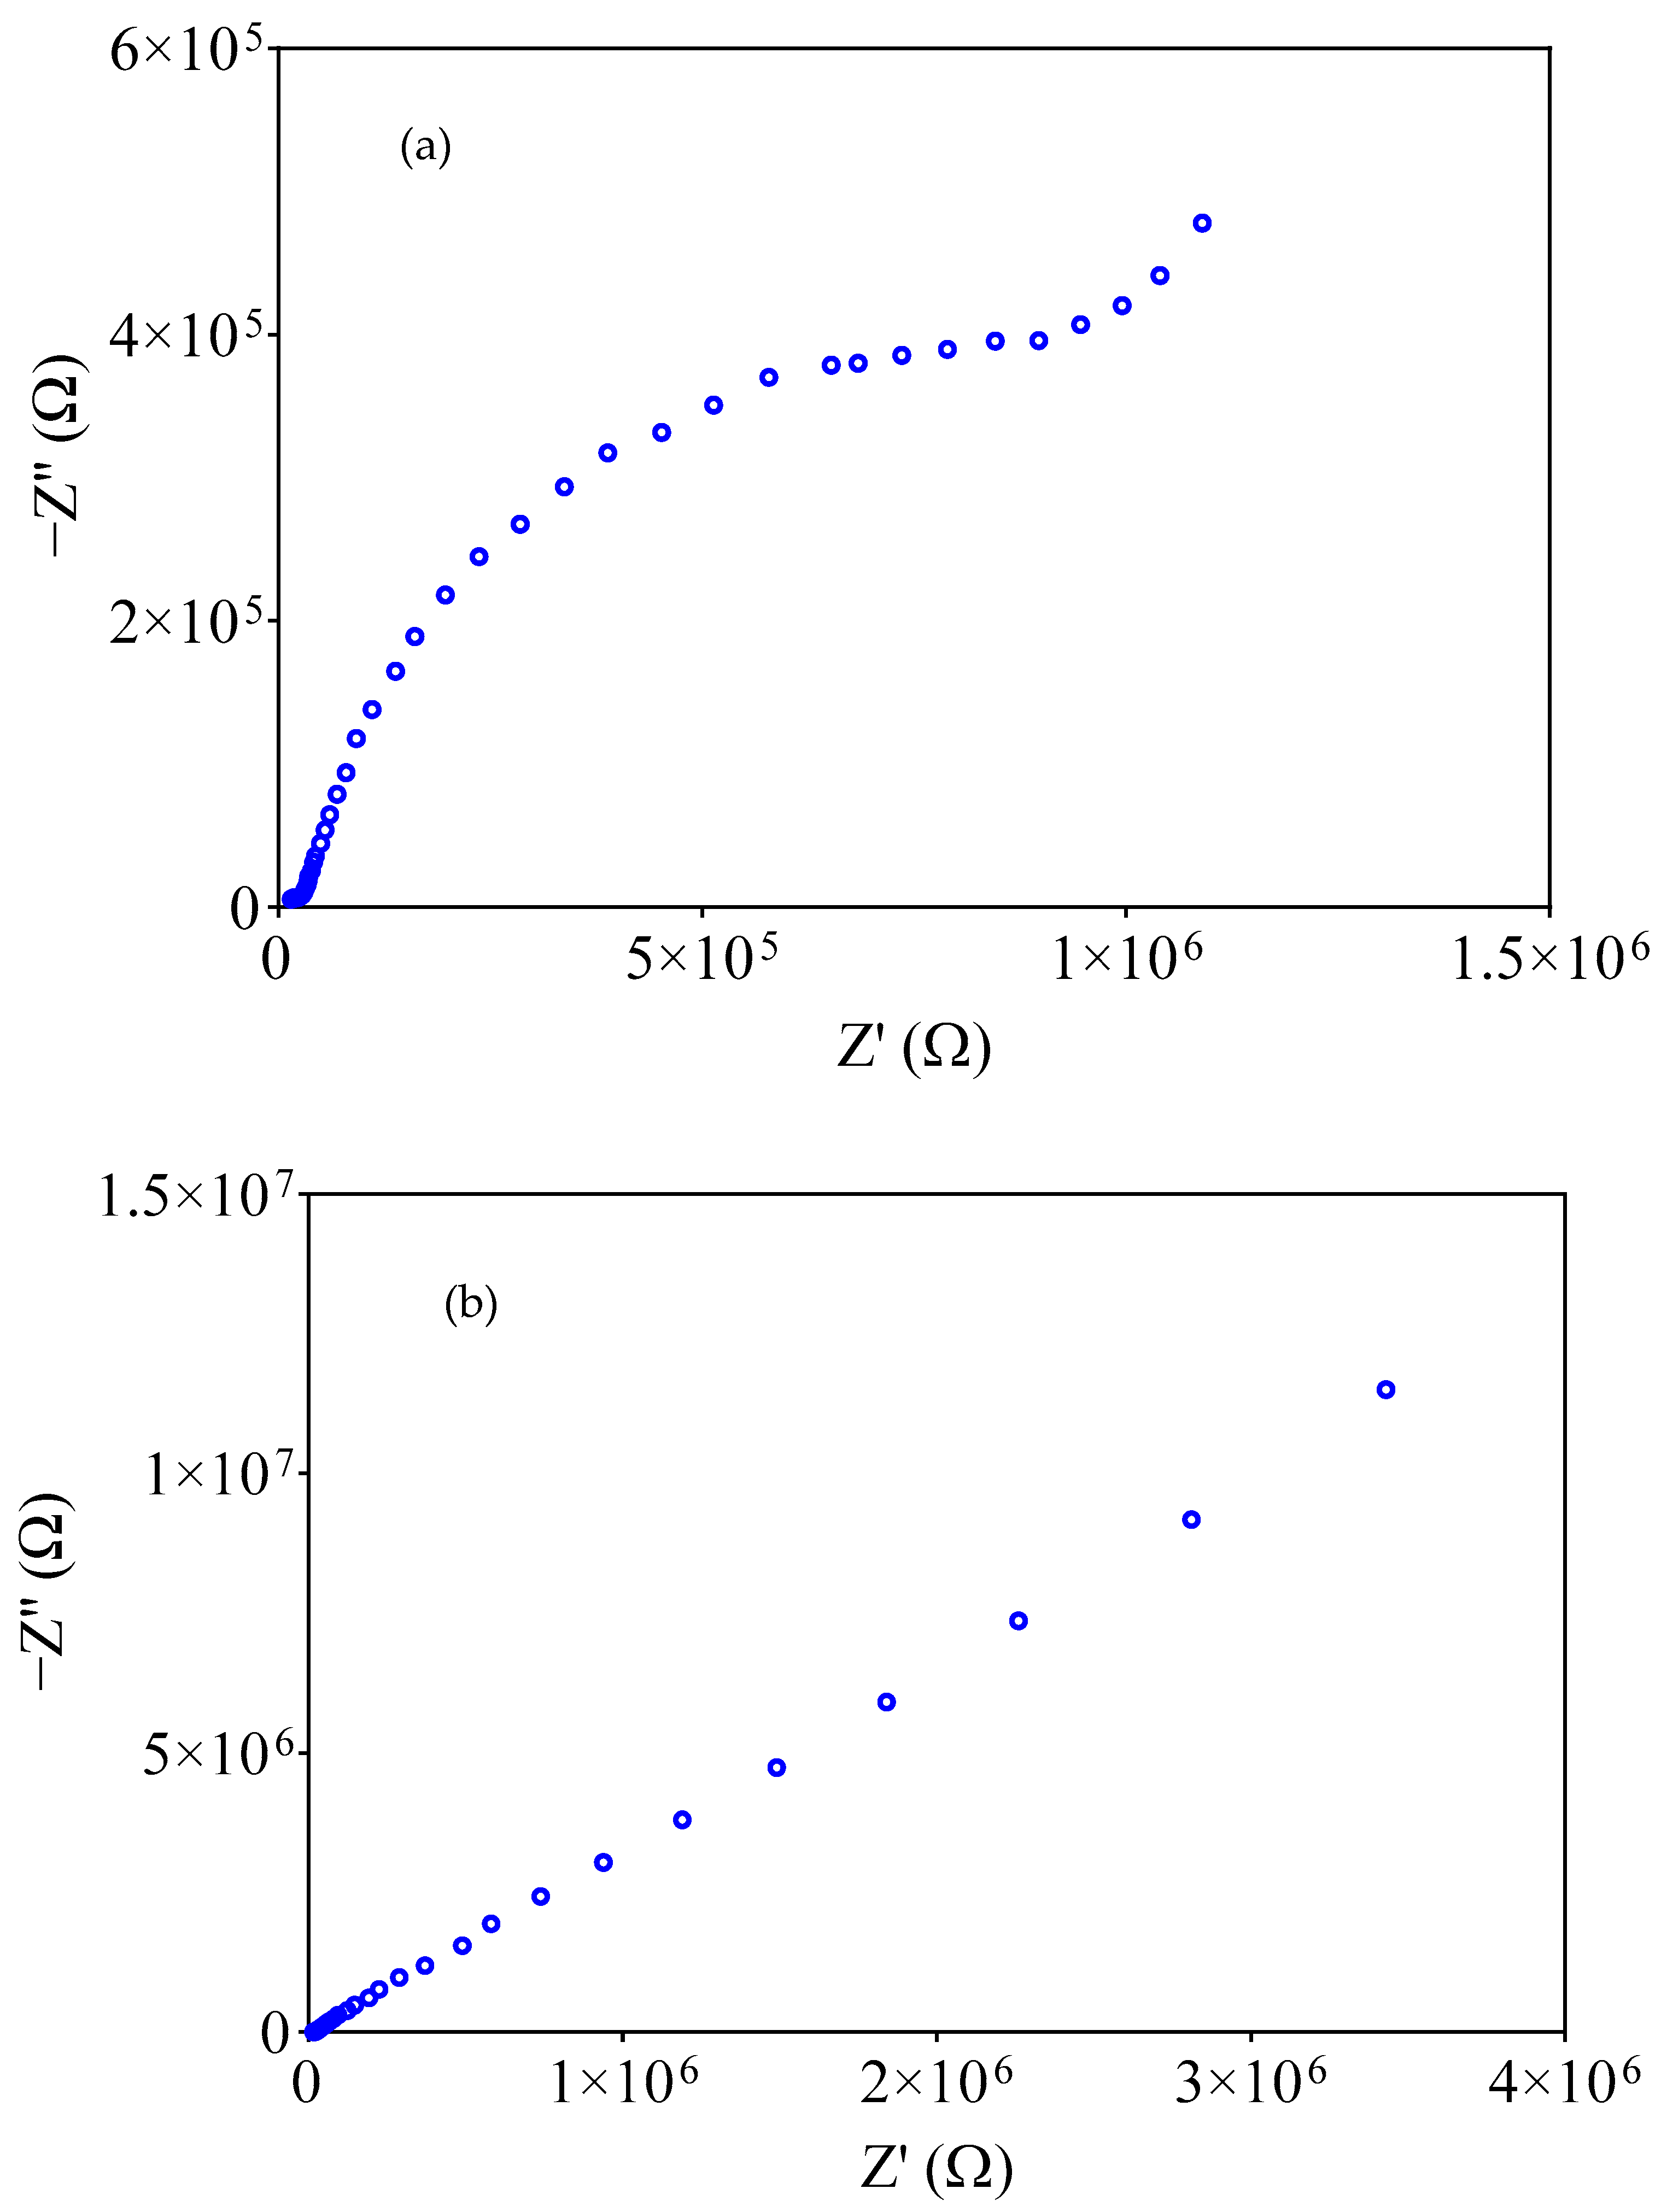
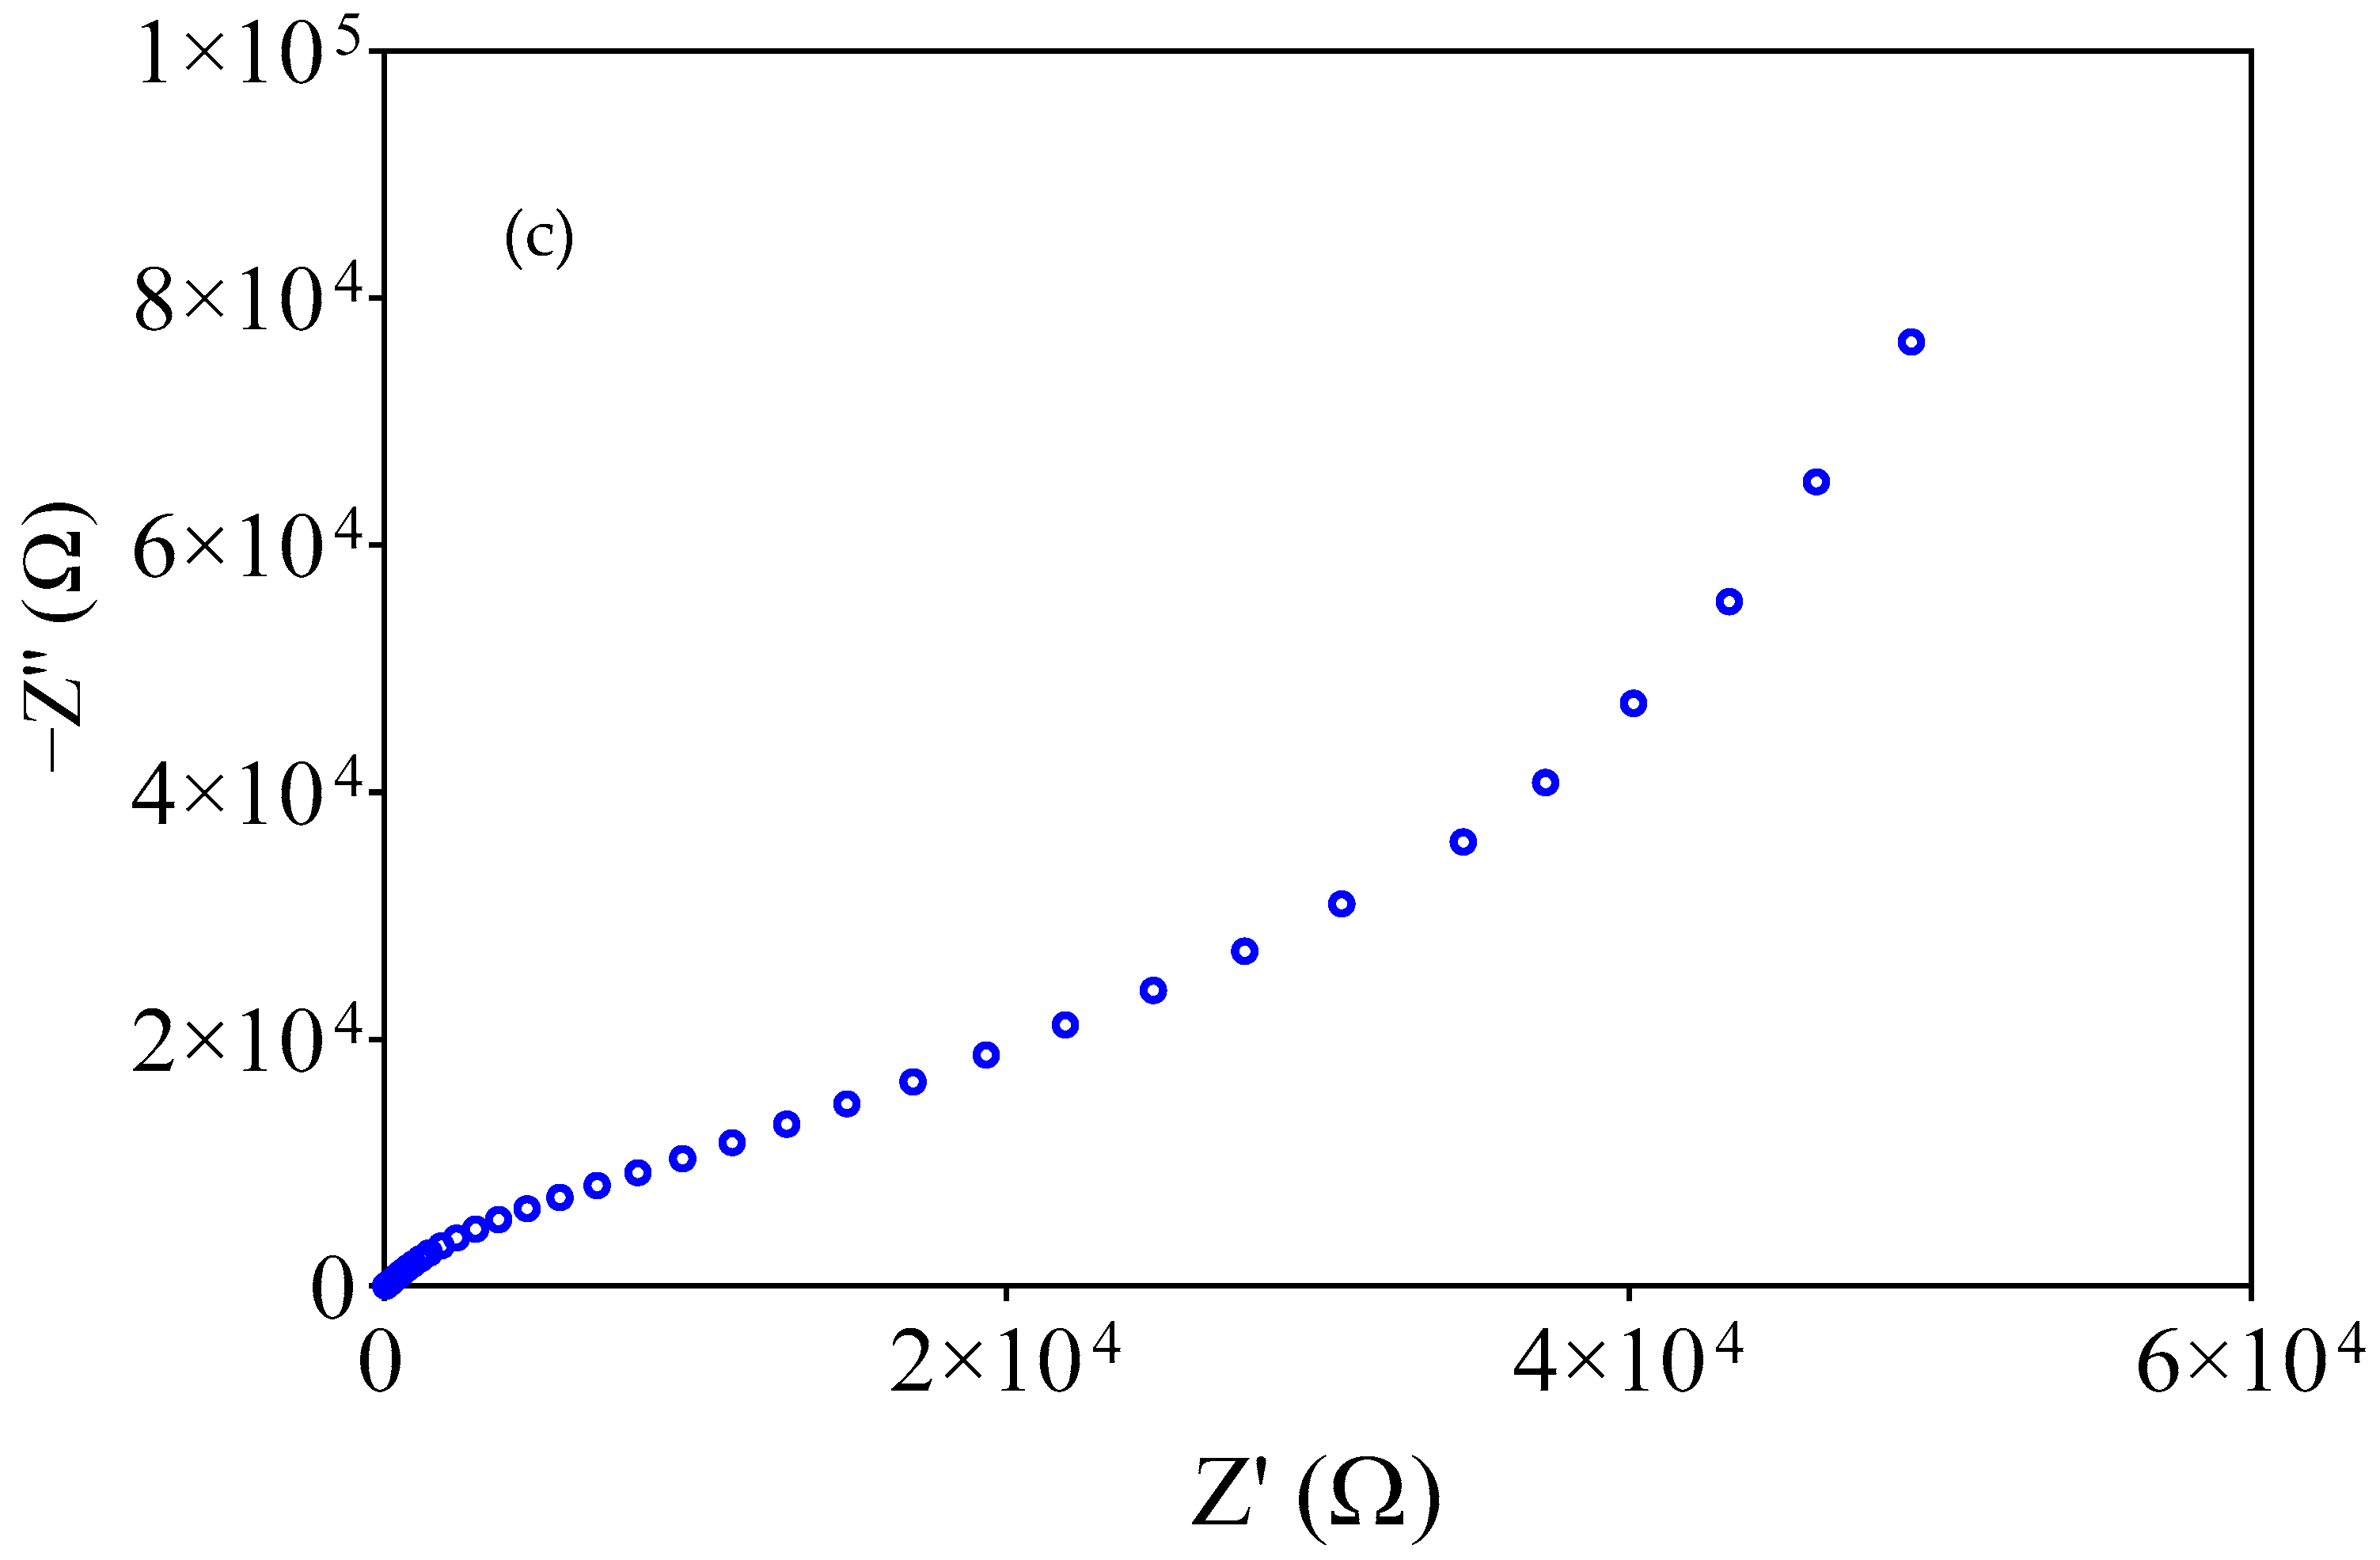
3.1. Electrochemical Surface Characterization of the Cork-Modified Carbon Paste Sensors

In order to understand the current response behavior of the modified electrodes towards a redox specie in solution, different pH conditions were investigated (acidic, neutral and alkaline conditions). Figure 1a,b show the voltammograms obtained by using RC-(X1) and RGC-(X2) modified carbon paste sensors, respectively, for comparison purposes, in different electrolyte solutions (0.5 M H2SO4 (pH 1), 0.5 M NaOH (pH 13), and 0.5 M Na2SO4 (pH 6)) containing hexamine ruthenium (III) chloride. In all cases, it was possible to observe the presence of a pair of peaks (anodic and cathodic) related to the electrochemical activity of the redox specie. Nevertheless, an enhancement on the current response was achieved in neutral and acidic conditions while the voltammetric response was lower in alkaline conditions. This considerable increase in the electroactivity, between the redox specie and the cork-modified carbon paste electrodes, can be attributed to the presence of residual groups containing oxygen on the surface of the reduced carbon paste layer [26] as well as oxygenated cork functional groups. This is a characteristic behavior of electrode arrays modified with a biomass [26], which combine the characteristics of the carbon paste electrode, such as the radial diffusion regime (hence the voltammogram with the characteristic sigmoidal shape) with an amplified current intensity due to the sum of the electrical signals of the individual electrodes that make up the set as well as the features of biomass modifier like porosity, hydrophobicity, permeability, and so on. Even when the current response obtained in both modified electrodes are similar (Figure 1a,b), the RGC-modified carbon paste sensor seemed to improve more signals in neutral and acidic conditions than the RC-modified sensor. Therefore, further experiments were carried out under acidic conditions.

3.2. Cyclic Voltammetry Experiments in the Presence of Paracetamol

Cyclic voltammetry experiments were conducted on the modified carbon paste sensors (X1 and X2) to examine the behavior of paracetamol and compare the results with that obtained by the unmodified sensor (X3), as illustrated in Figure 2. Consistent with findings reported in previous studies [27,28], the voltammetric profile presents an oxidation signal during the positive sweep and the absence of any cathodic peak in the reverse sweep, indicating the irreversibility of the oxidation process. The electrochemical oxidation mechanism of paracetamol involves the transfer of two electrons and two protons (see Figure 3) to produce the relatively stable N-acetyl-p-benzoquinone-imine (NAPQI) product [8,29].
As shown in Figure 2, although the paracetamol showed electroactivity towards the X3 surface electrode, which is enough to allow its concentration; the modified electrodes resulting from the presence of RC- and RGC-cork led to an increase in the sensitivity of the sensors and selectivity from the response of the analyte. This behavior is due to the accumulation of the analyte on the cork surface. On the other hand, X1 exhibited a higher peak signal than X2. This disparity derives from the hydrophobic nature of RC-cork, which contains an aromatic domain in its main constituents, leading to the accumulation of organic species on the solution’s surface [23]. In contrast, the structure of the RGC-cork undergoes a degradation of polysaccharides, carbohydrates, and extractables, together with partial degradation of suberin and lignin, with the formation of coke, consequently reducing its adsorptive capacity [25].
In order to understand the resistivity behavior of cork-modified electrochemical sensors, impedance electrochemical spectroscopy measurements were performed to obtain the Nyquist plots (Figure 4). By comparing the Nyquist curves for all electrochemical sensors, the profiles obtained through potentiostatic steps (Figure 4b) clearly showed that a greater resistivity of RGC-modified electrode (Figure 4b) was achieved over the others (Figure 4a,c). This indicates that, upon extrapolation from higher frequencies, these curves (X1 and X3) intersect the axis at higher frequencies, suggesting greater resistance to load transfer in these structures. Additionally, the curves for X1 and X3 appear slightly “flattened”. This phenomenon arises from the presence of pores, irregularities, etc., on the surfaces, leading to the dispersion of various structural characteristics associated with good adsorptive properties.

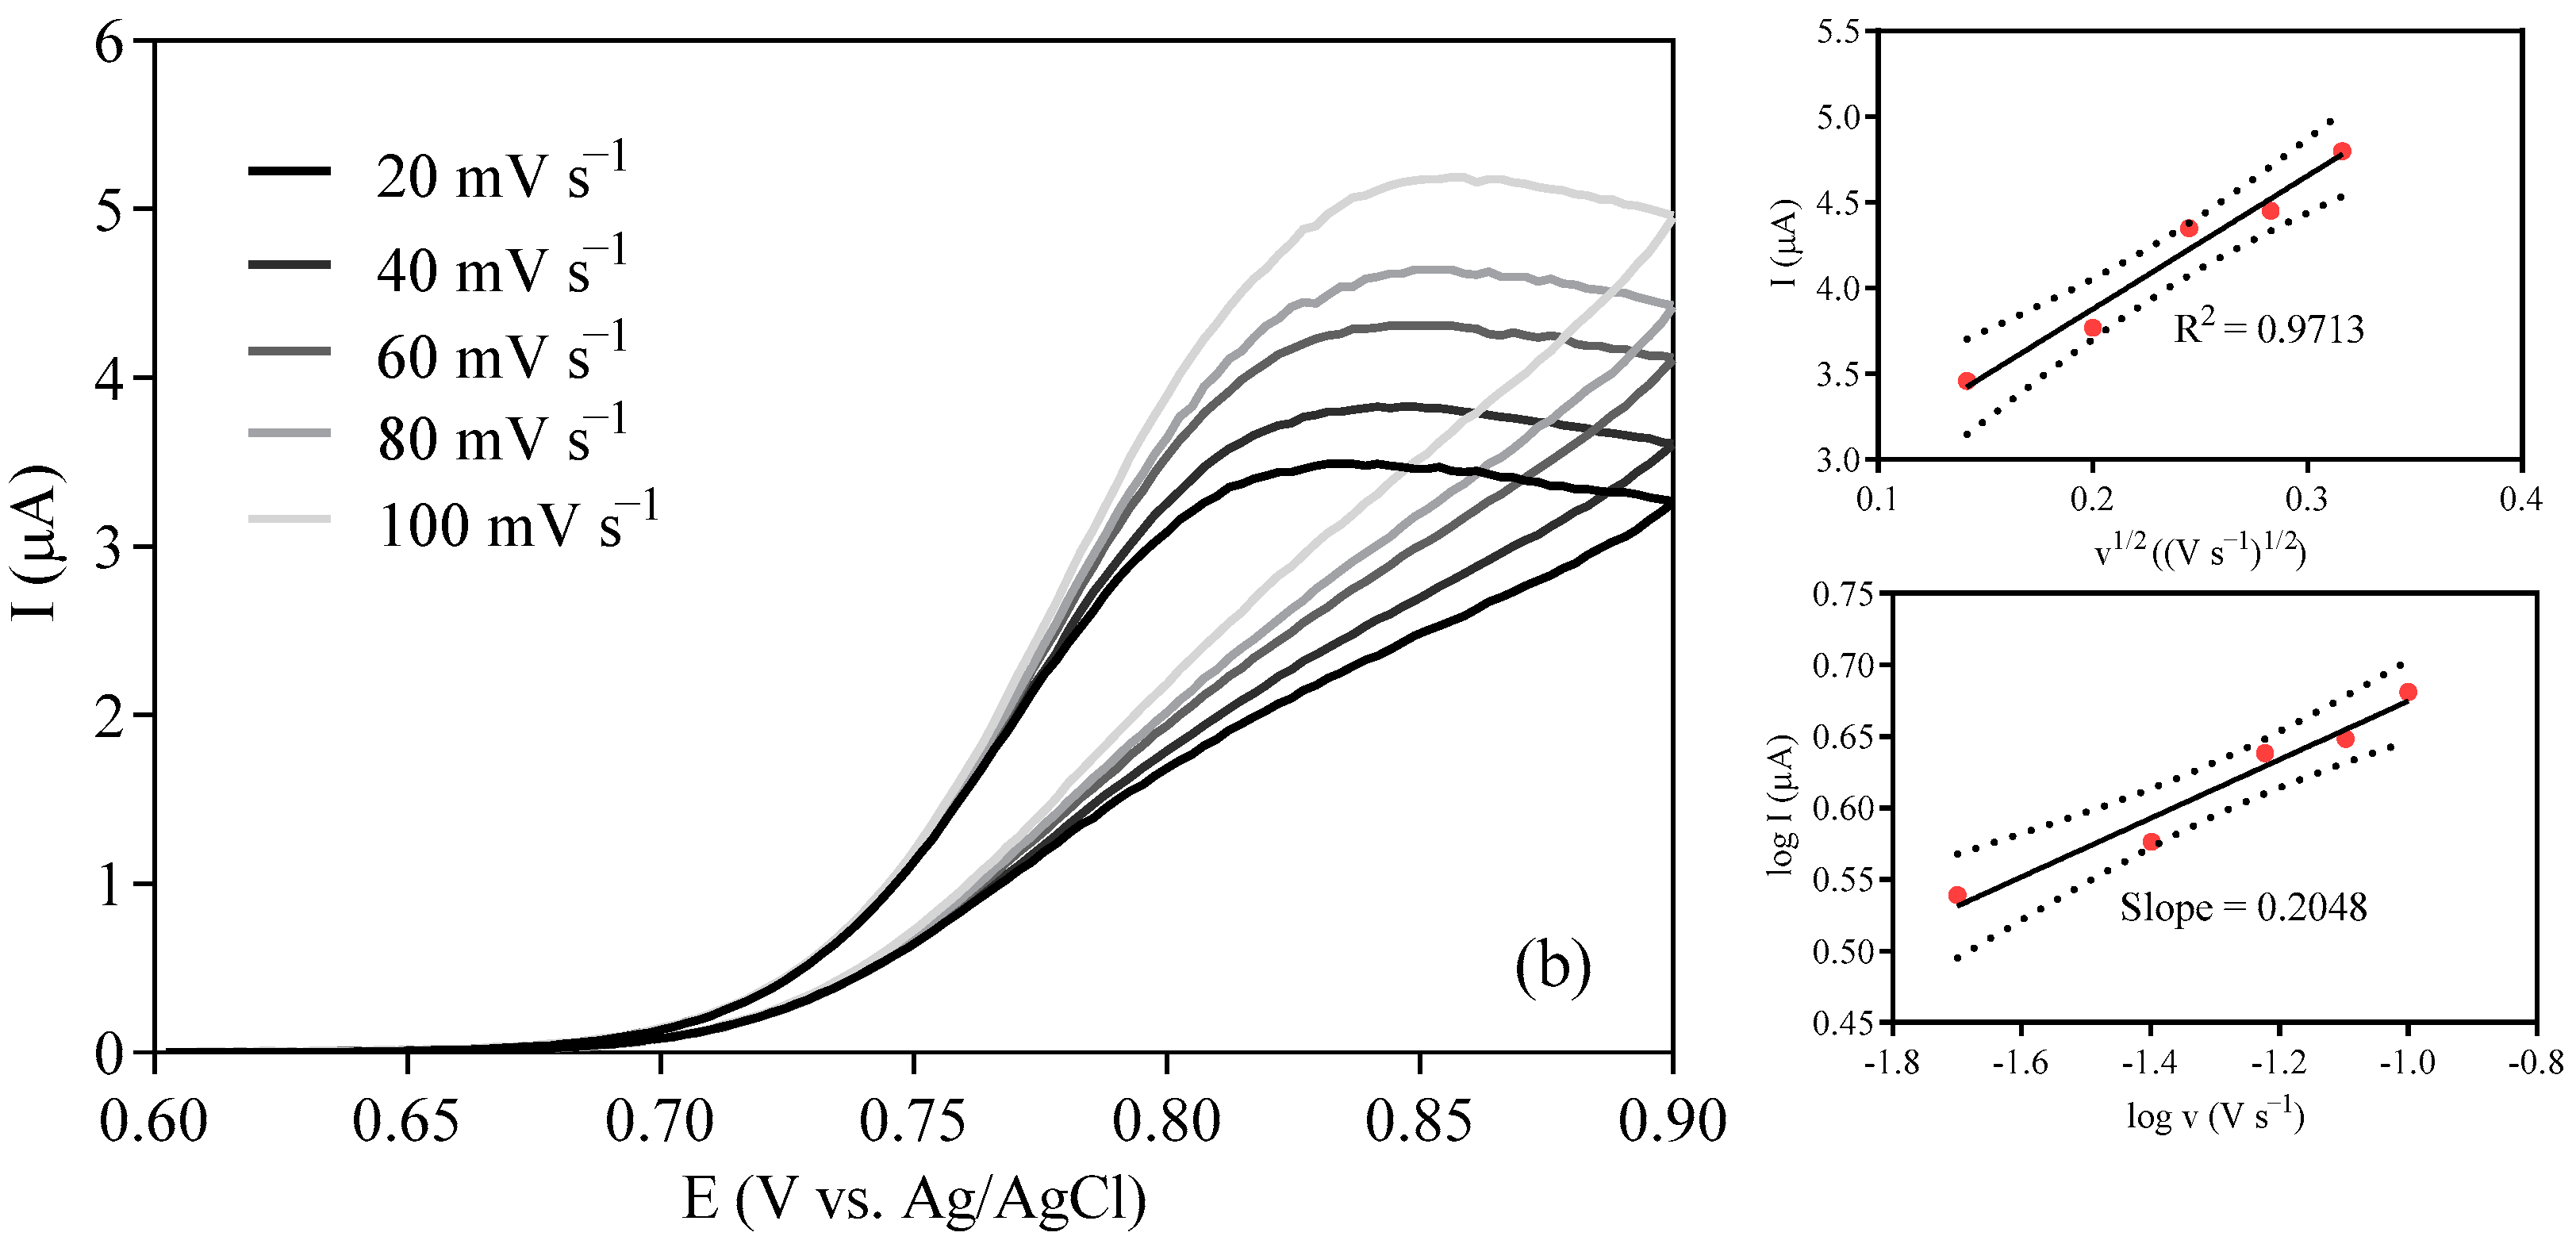
3.3. Effect of Scan Rate on Paracetamol Determination

The impact of the scan rate (from 20 to 100 mV/s) on the voltammetric response of paracetamol oxidation was investigated on the modified electrodes (X1 and X2), recording cyclic voltammograms in a 0.5 M H2SO4 solution containing paracetamol (0.01 M). As observed in Figure 5, anodic peak shifted towards more positive potentials as a function of the increase in the scan rate. This behavior evidences the irreversible nature of the process [30,31]. On the other hand, the insets in Figure 5a,b reveal a linear relationship between peak current and the square root of the scan rate (I vs. v1/2), suggesting that the oxidation of paracetamol is mainly influenced by diffusion mass transport. In addition, the plots of the logarithm of the anodic peak current (log I) versus the logarithm of the scan rate (log v) reached linear relationships with slopes of 0.2669 for X1 and 0.2048 for X2, respectively. This indicates that cork can contribute an adsorptive tendency on the electrode surfaces during the paracetamol oxidation reaction [3,32].

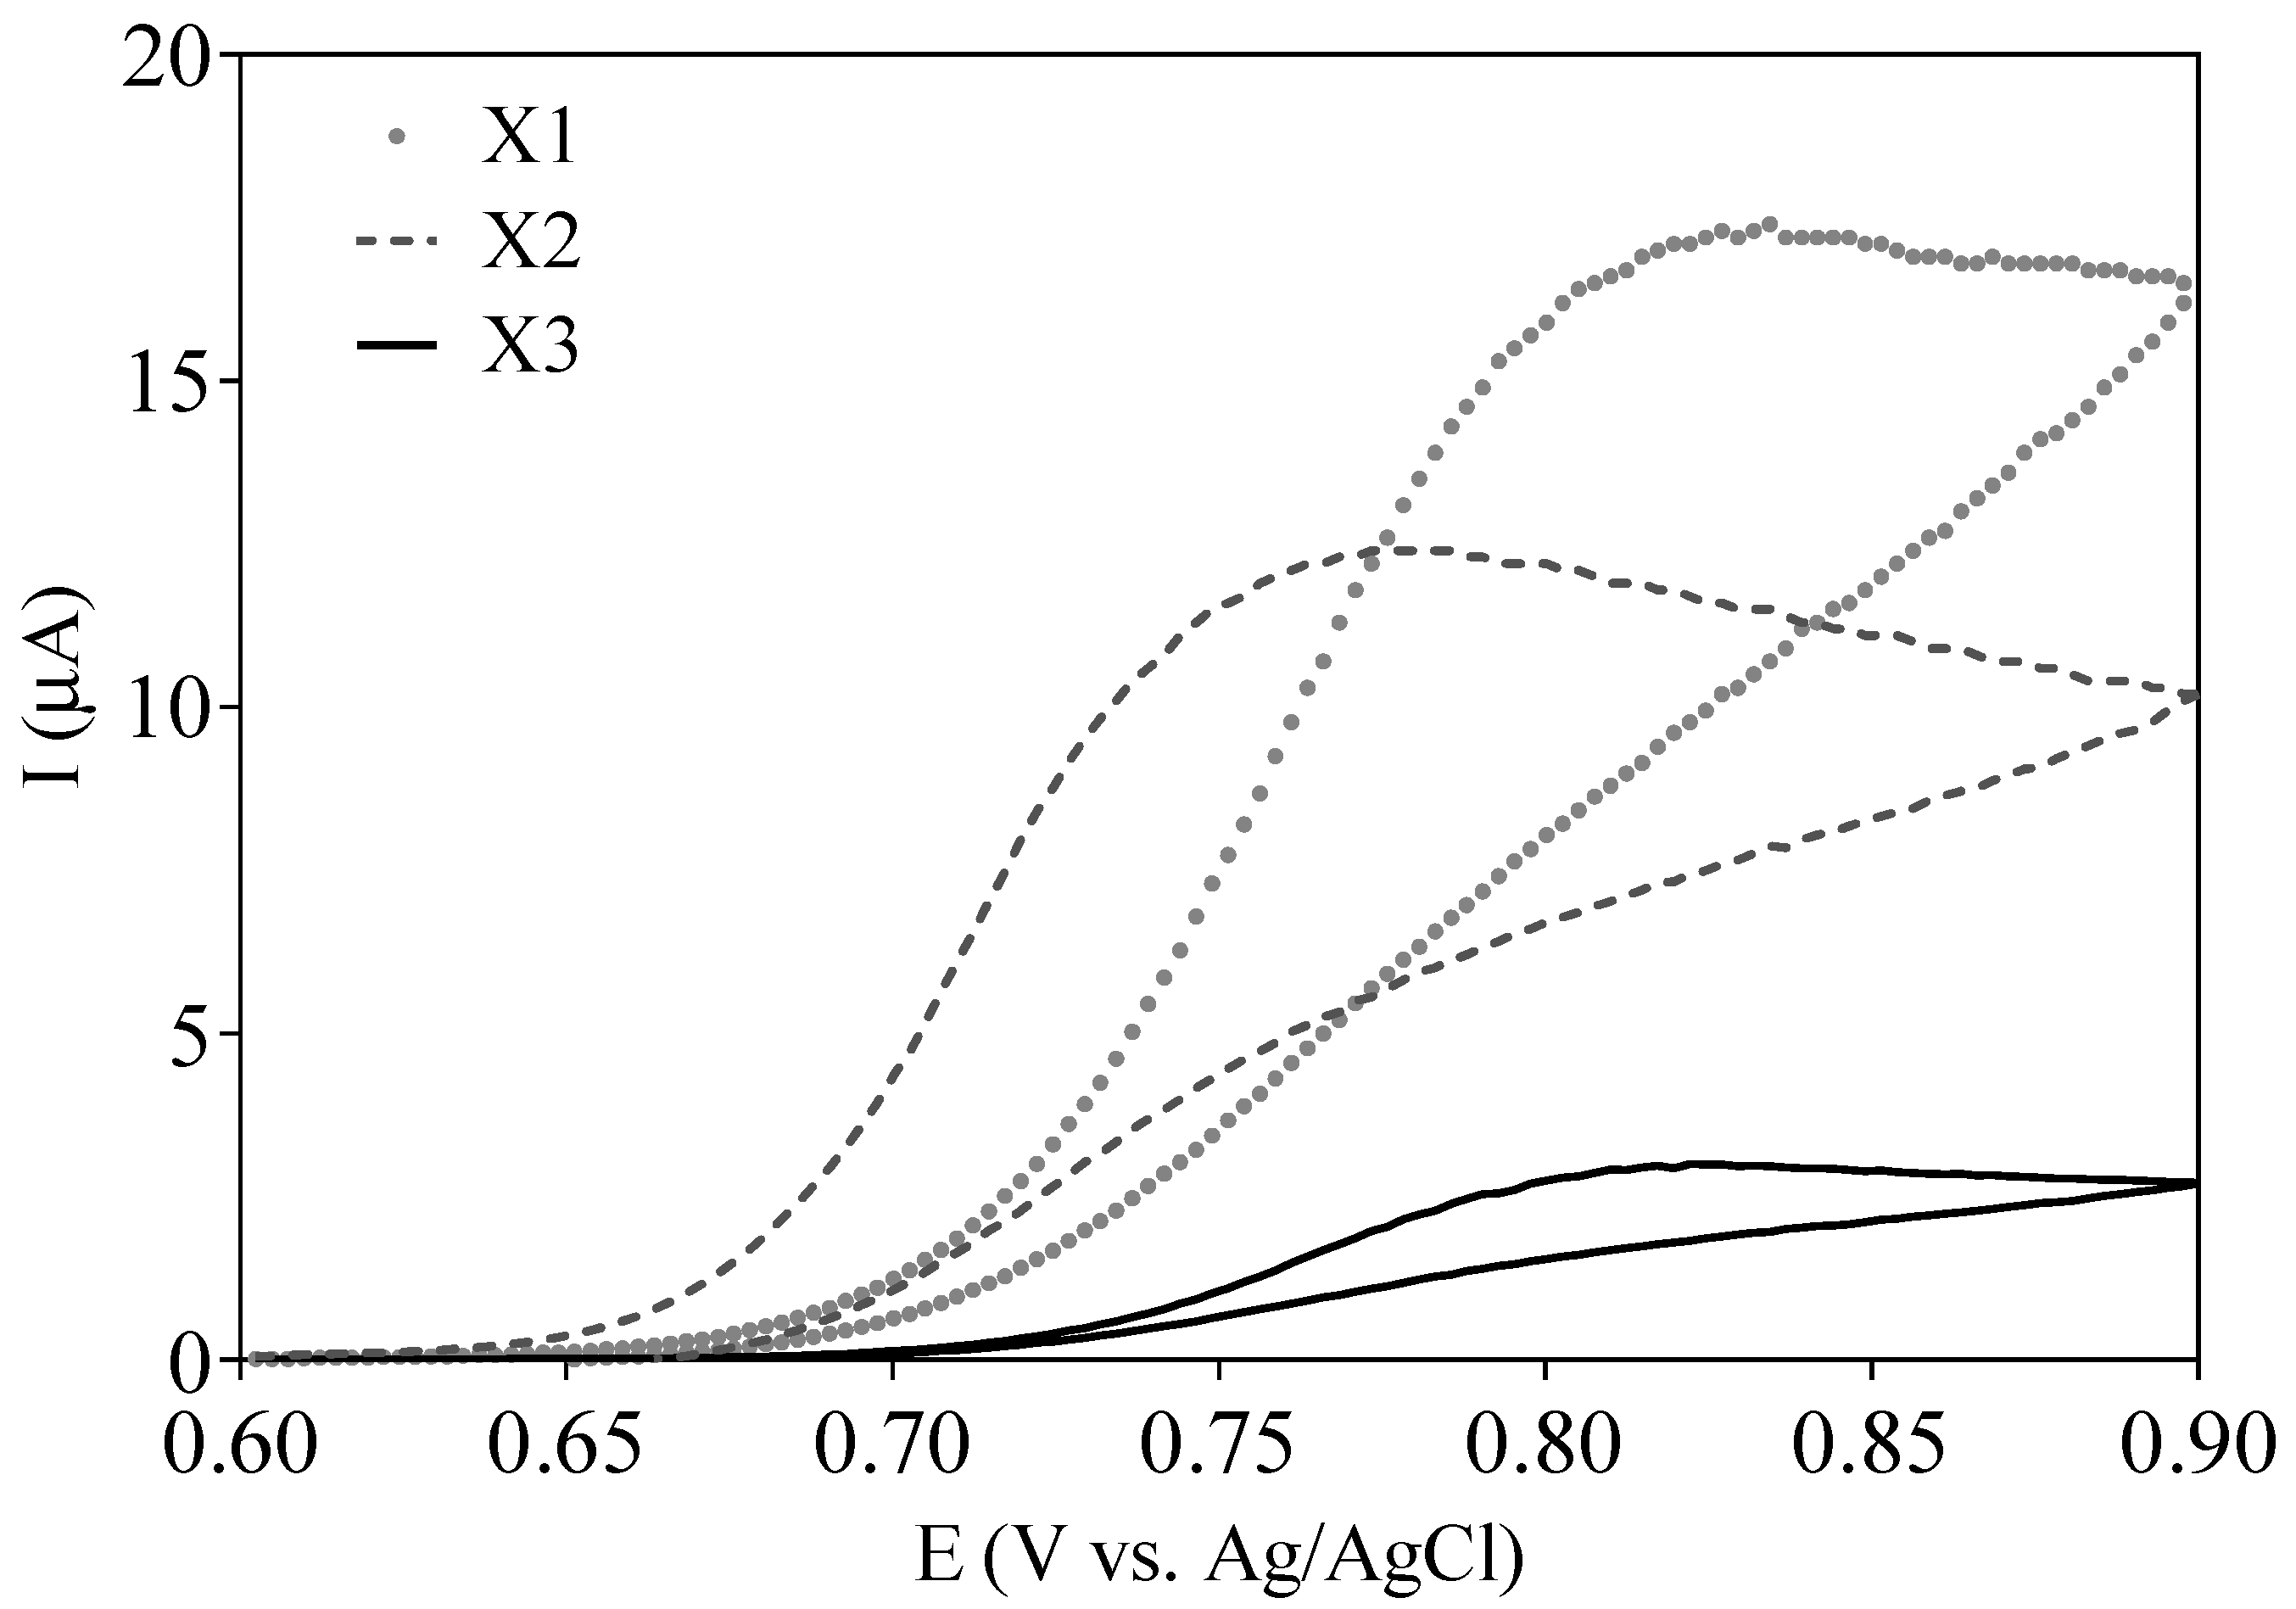
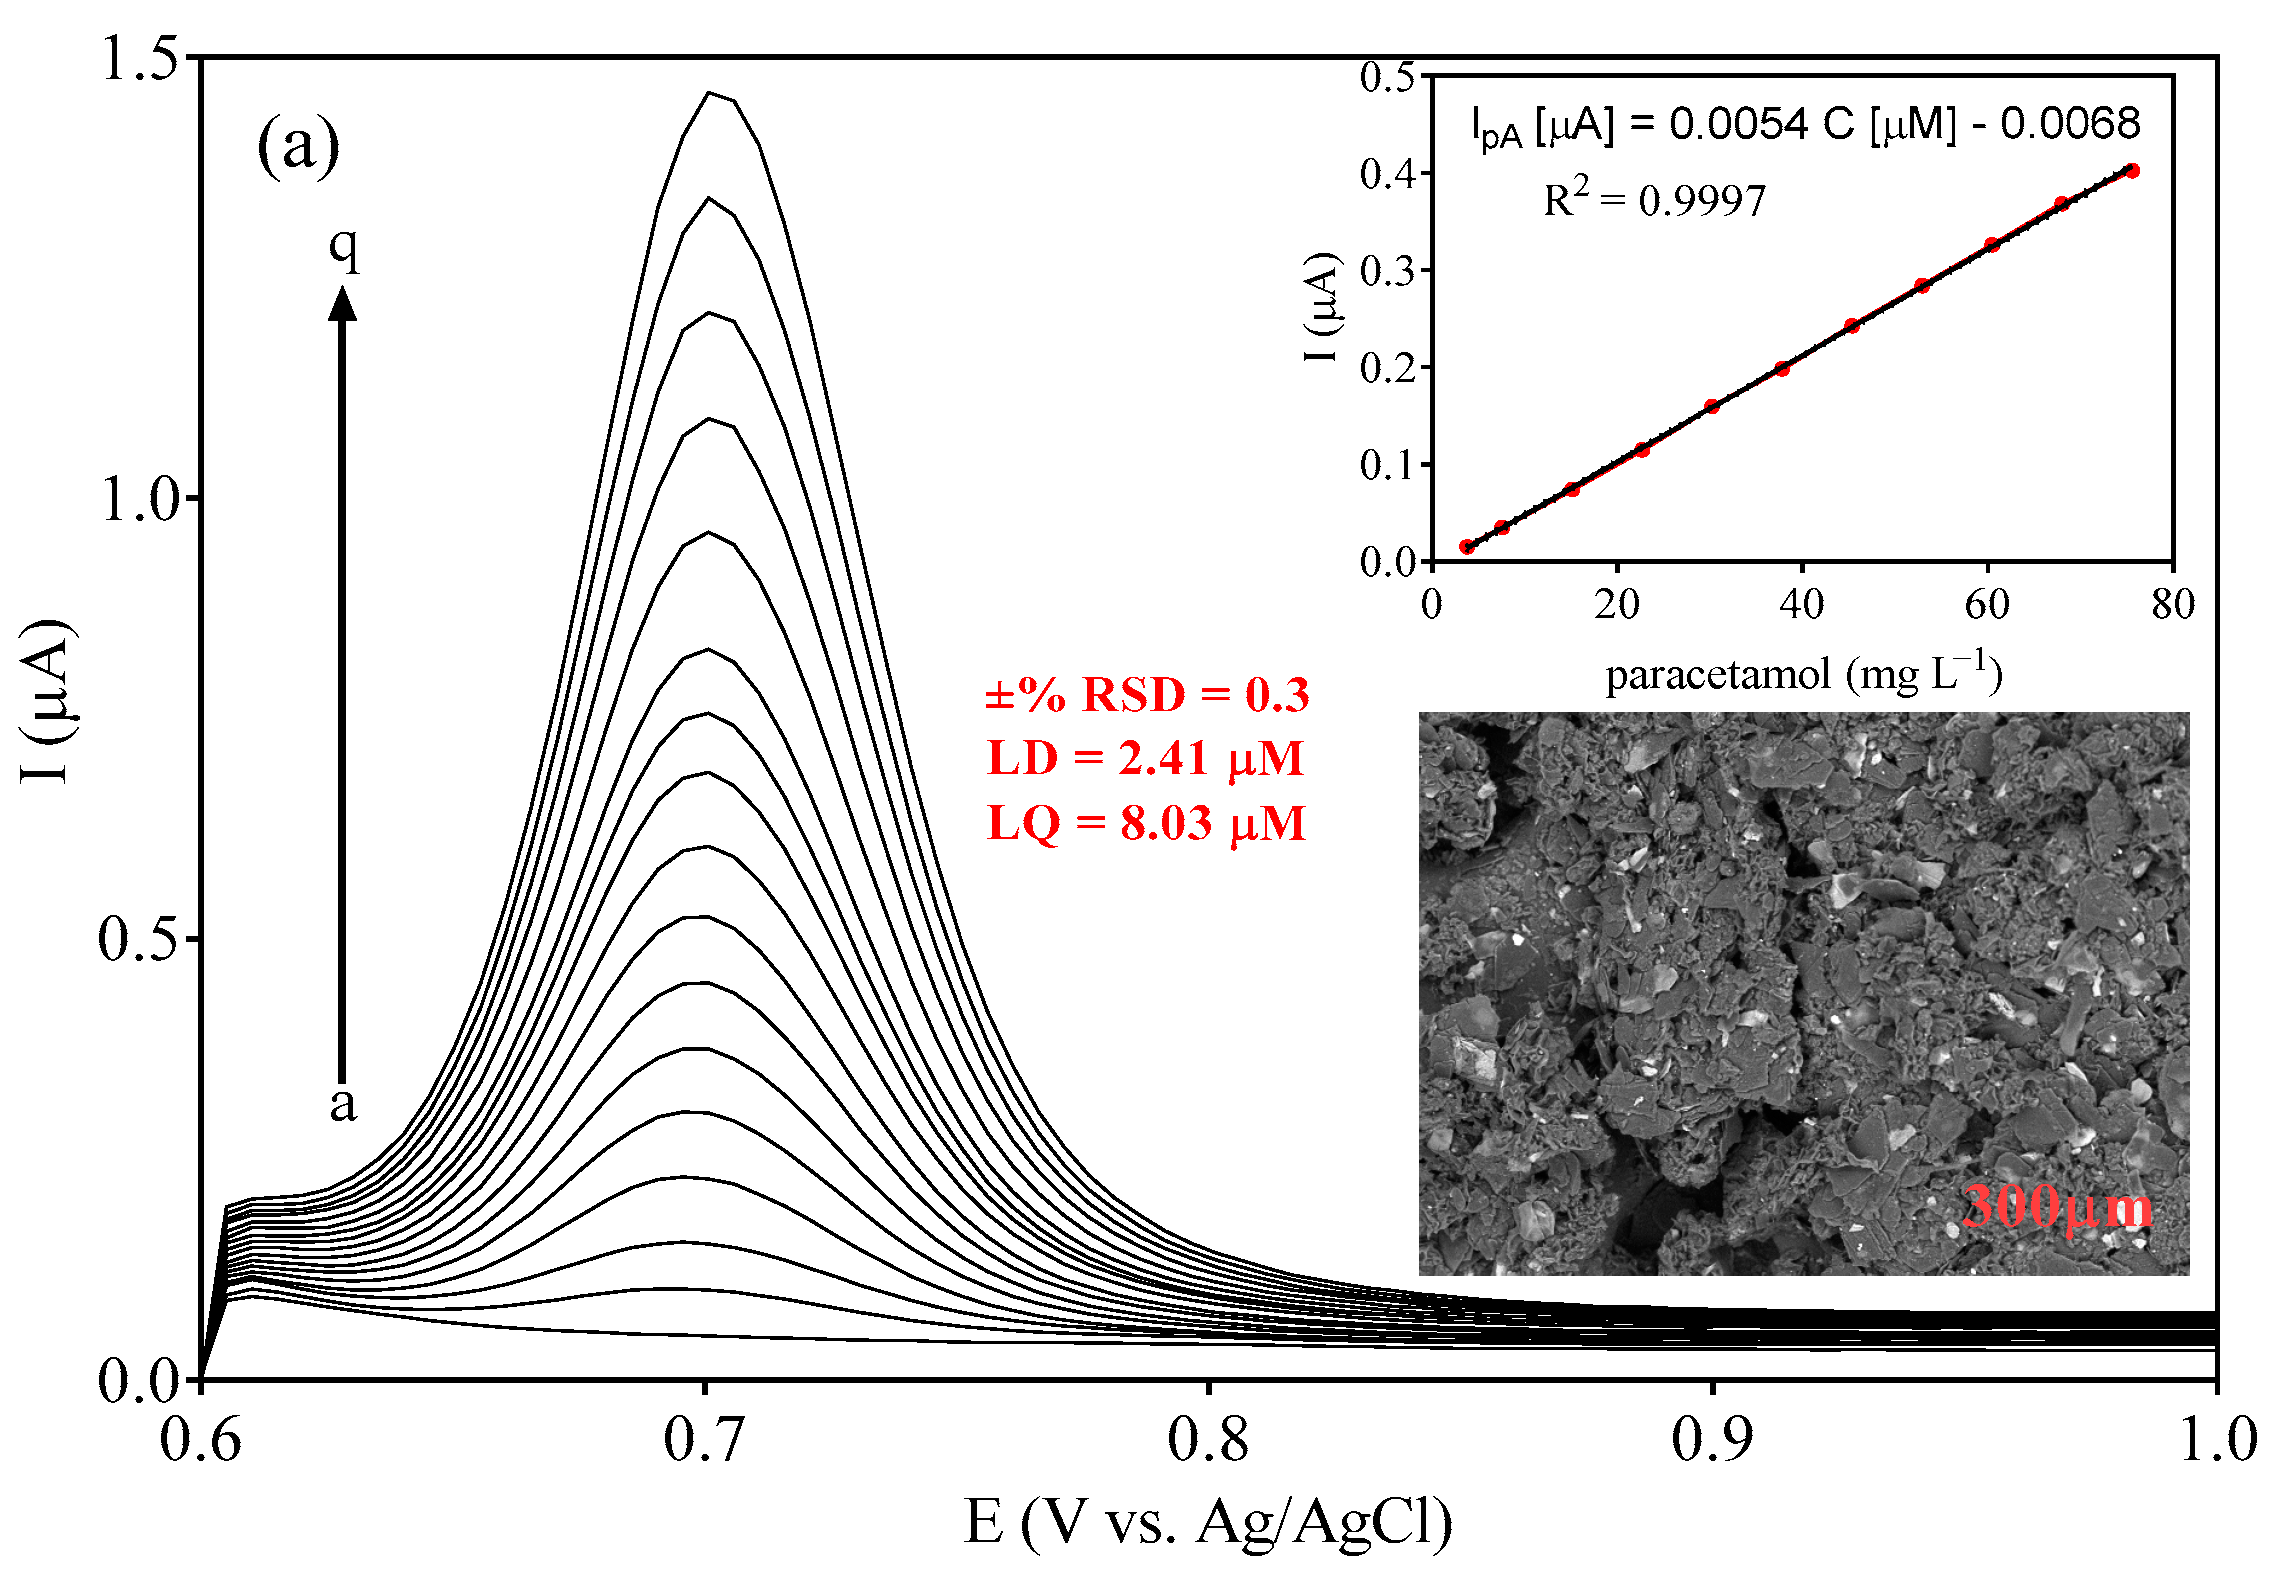
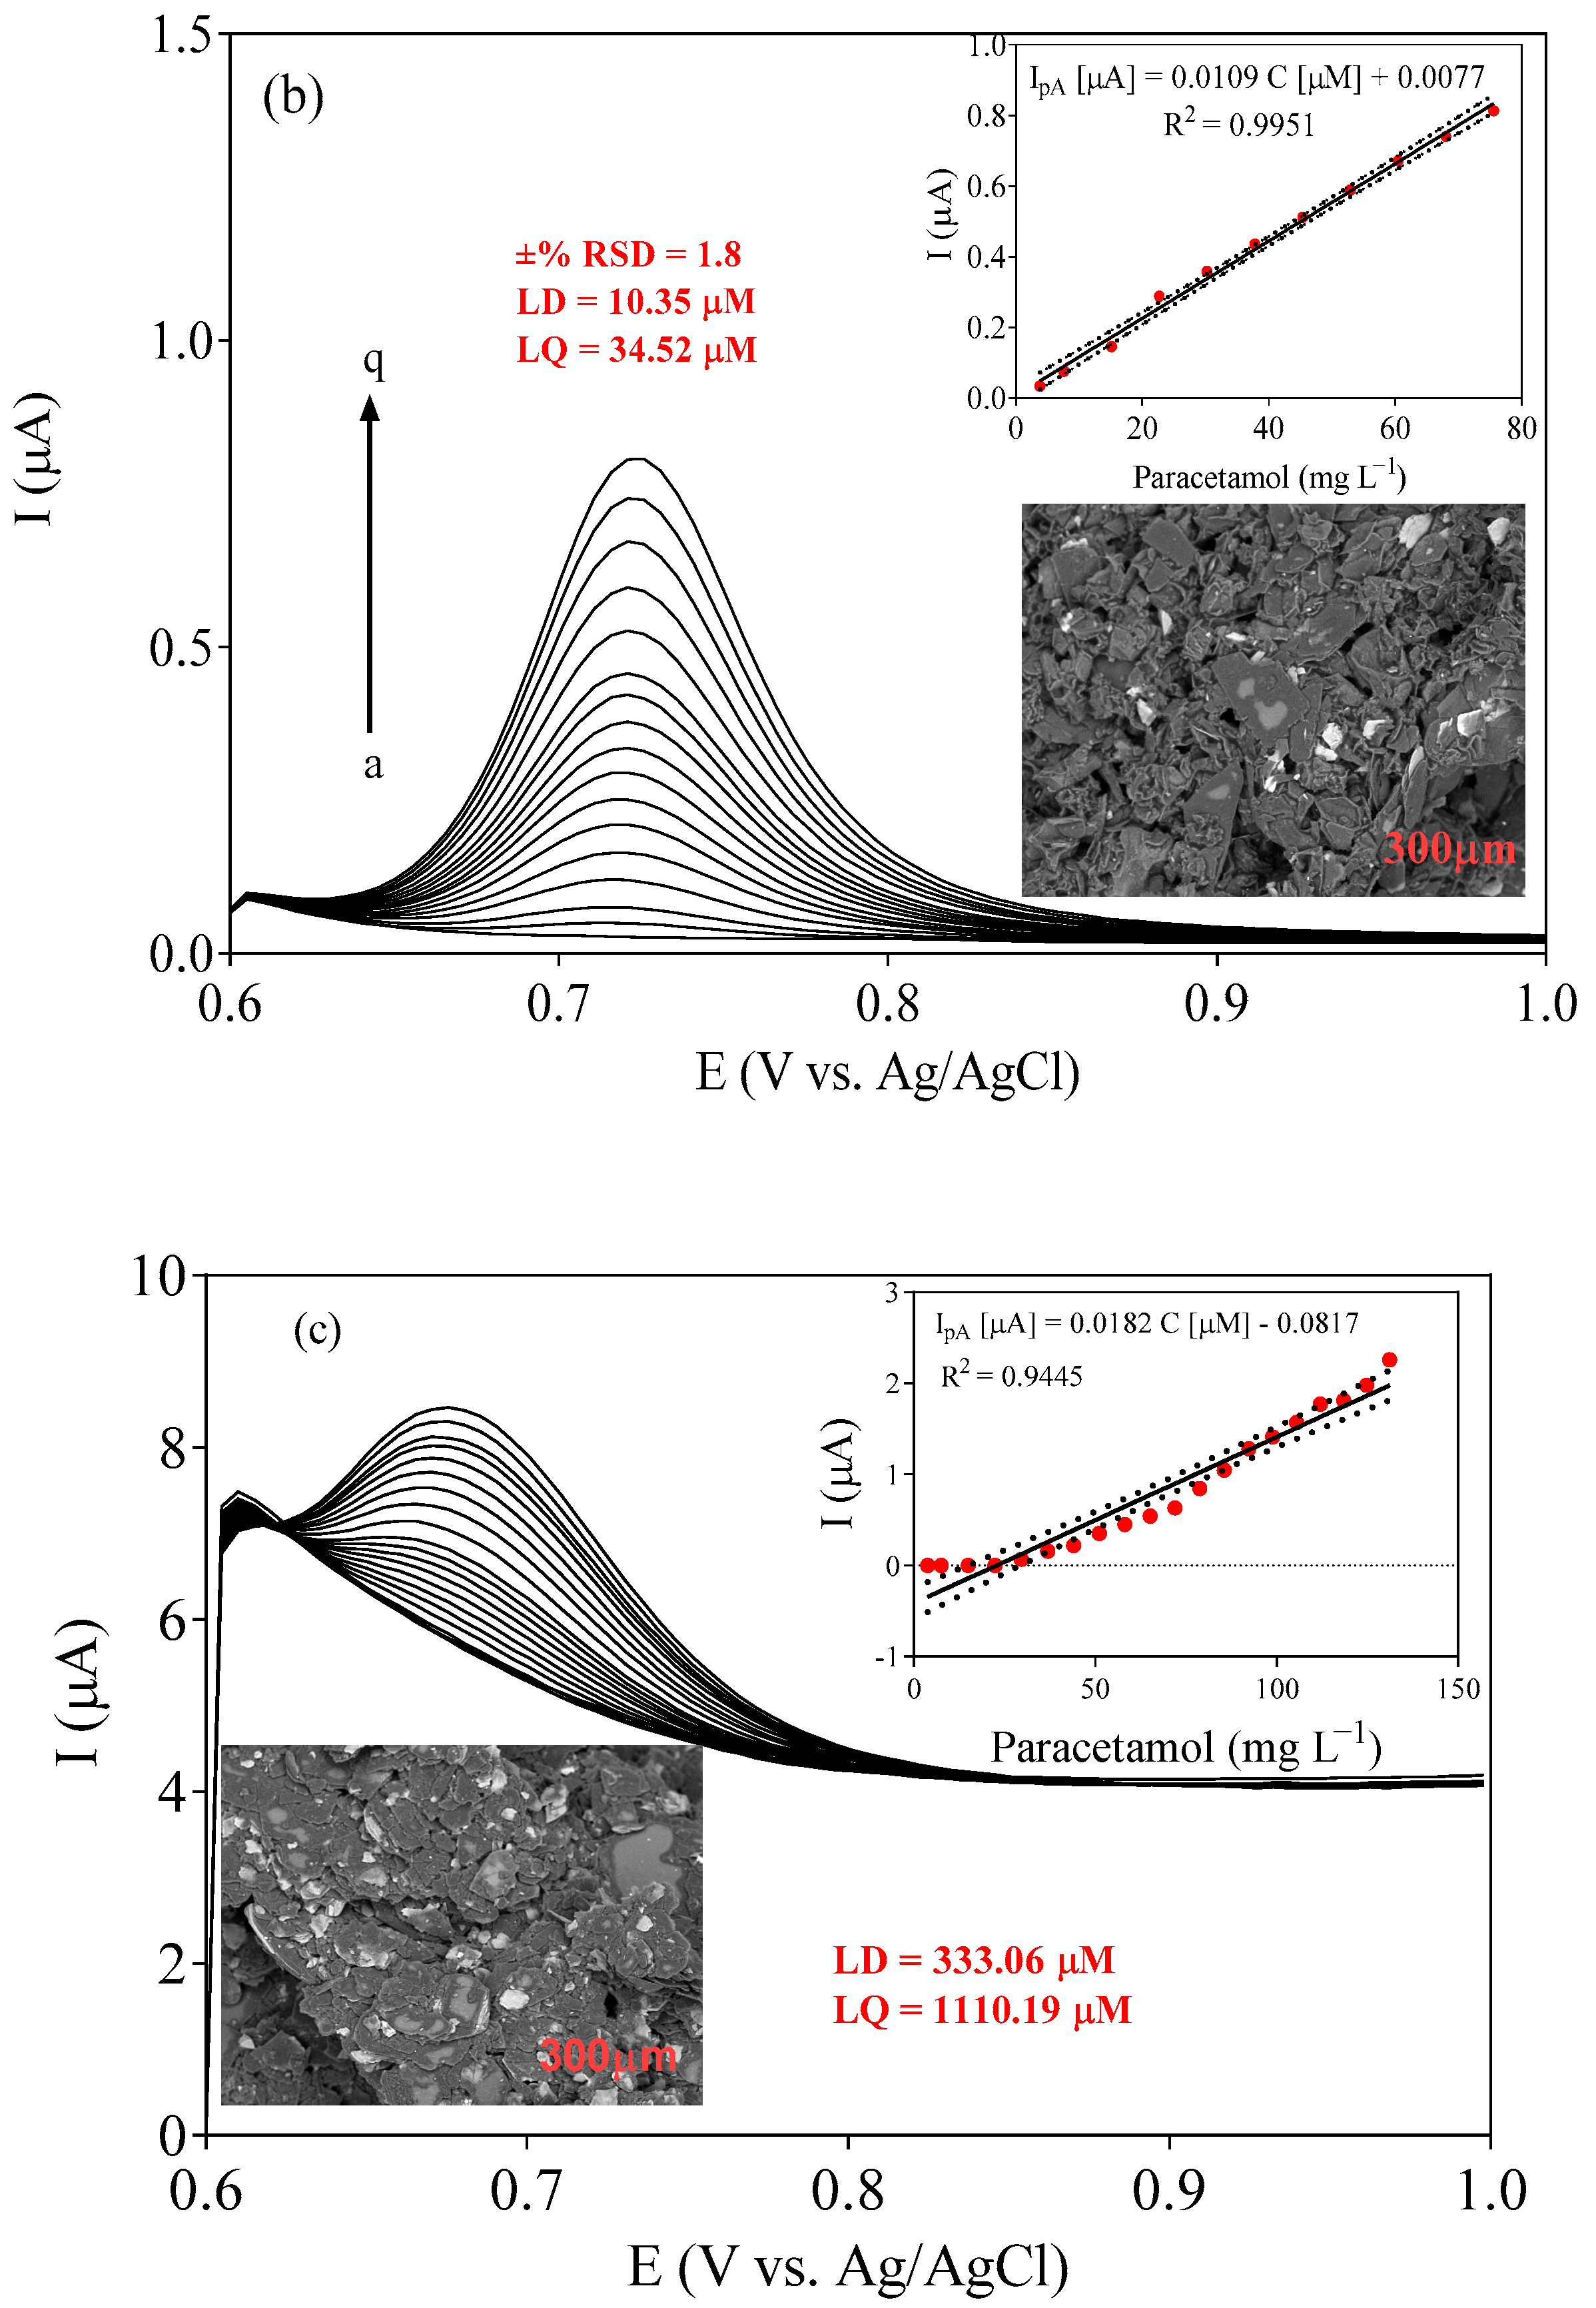
3.4. Differential Pulse Voltammetric Experiments

The validation of the sensors X1, X2, and X3, as a function of paracetamol concentration, was carried out using DPV measurements, as shown in Figure 6a–c.
As shown in Figure 6, a peak current for the oxidation of paracetamol was detected at approximately +0.65 V on the unmodified carbon paste sensor (X3, Figure 6c), and around +0.75 V on the modified electrodes (X1 (Figure 6a) and X2 (Figure 6b)). The anodic peak current of paracetamol demonstrates linearity with its concentration and consistently increases within a range from 25 to 1000 μM for all sensors. The equations that correspond to the analytical curves according to the linear regressions are as follows:
IpA [μA] = 0.0054 C [μM] − 0.0068 R2 = 0.9997 for X1 
IpA [μA] = 0.0109 C [μM] + 0.0077 R2 = 0.9951 for X2
IpA [μA] = 0.0182 C [μM] − 0.4146 R2 = 0.9445 for X3
The detection and quantification limits, respectively, were 2.41 µM and 8.04 µM for X1 (Figure 6a); 10.36 µM and 34.52 µM for X2 (Figure 6b); and 333.06 µM and 1110.20 µM for X3 (Figure 6c). These limits were estimated using the estimation method described by Brunetti and collaborators [33,34].
Repeatability was assessed by leading subsequent measurements (n = 5) in 0.01M paracetamol solution, producing relative standard deviations of 1.5% and 3.8%, respectively, with both electrodes. Reproducibility was evaluated by measuring the oxidation current values in freshly prepared solutions over a period of 5 d, revealing discrepancies of only 4.1% and 1.8% compared to the original oxidation current values obtained.
Interestingly, the X1 sensor showed greater sensitivity with lower detection and quantification limits of paracetamol compared to X2 and X3 electrodes. This behavior can be attributed to the accumulative nature of the surface of the X1 electrode due to the superficial cork groups (anionic and cationic), which favor a significant interaction with paracetamol molecules in solution [22,35,36]. It is also evident in the micrographs presented in Figure 6a–c that the modification of the carbon paste with raw cork (X1) reveals an exfoliated structure, not visible in the carbon paste with thermally treated cork (X2), increasing the interaction of the modifier with paracetamol in solution. In addition, the low affinity of X3 with paracetamol is evidenced by its intact structure [37].
A comparison of the results reported in the literature for determining paracetamol using different electrochemical sensors is provided in Table 1. These data reported show that the X1 sensor has competitive analytical performance, with significantly lower detection limits than the other sensors.

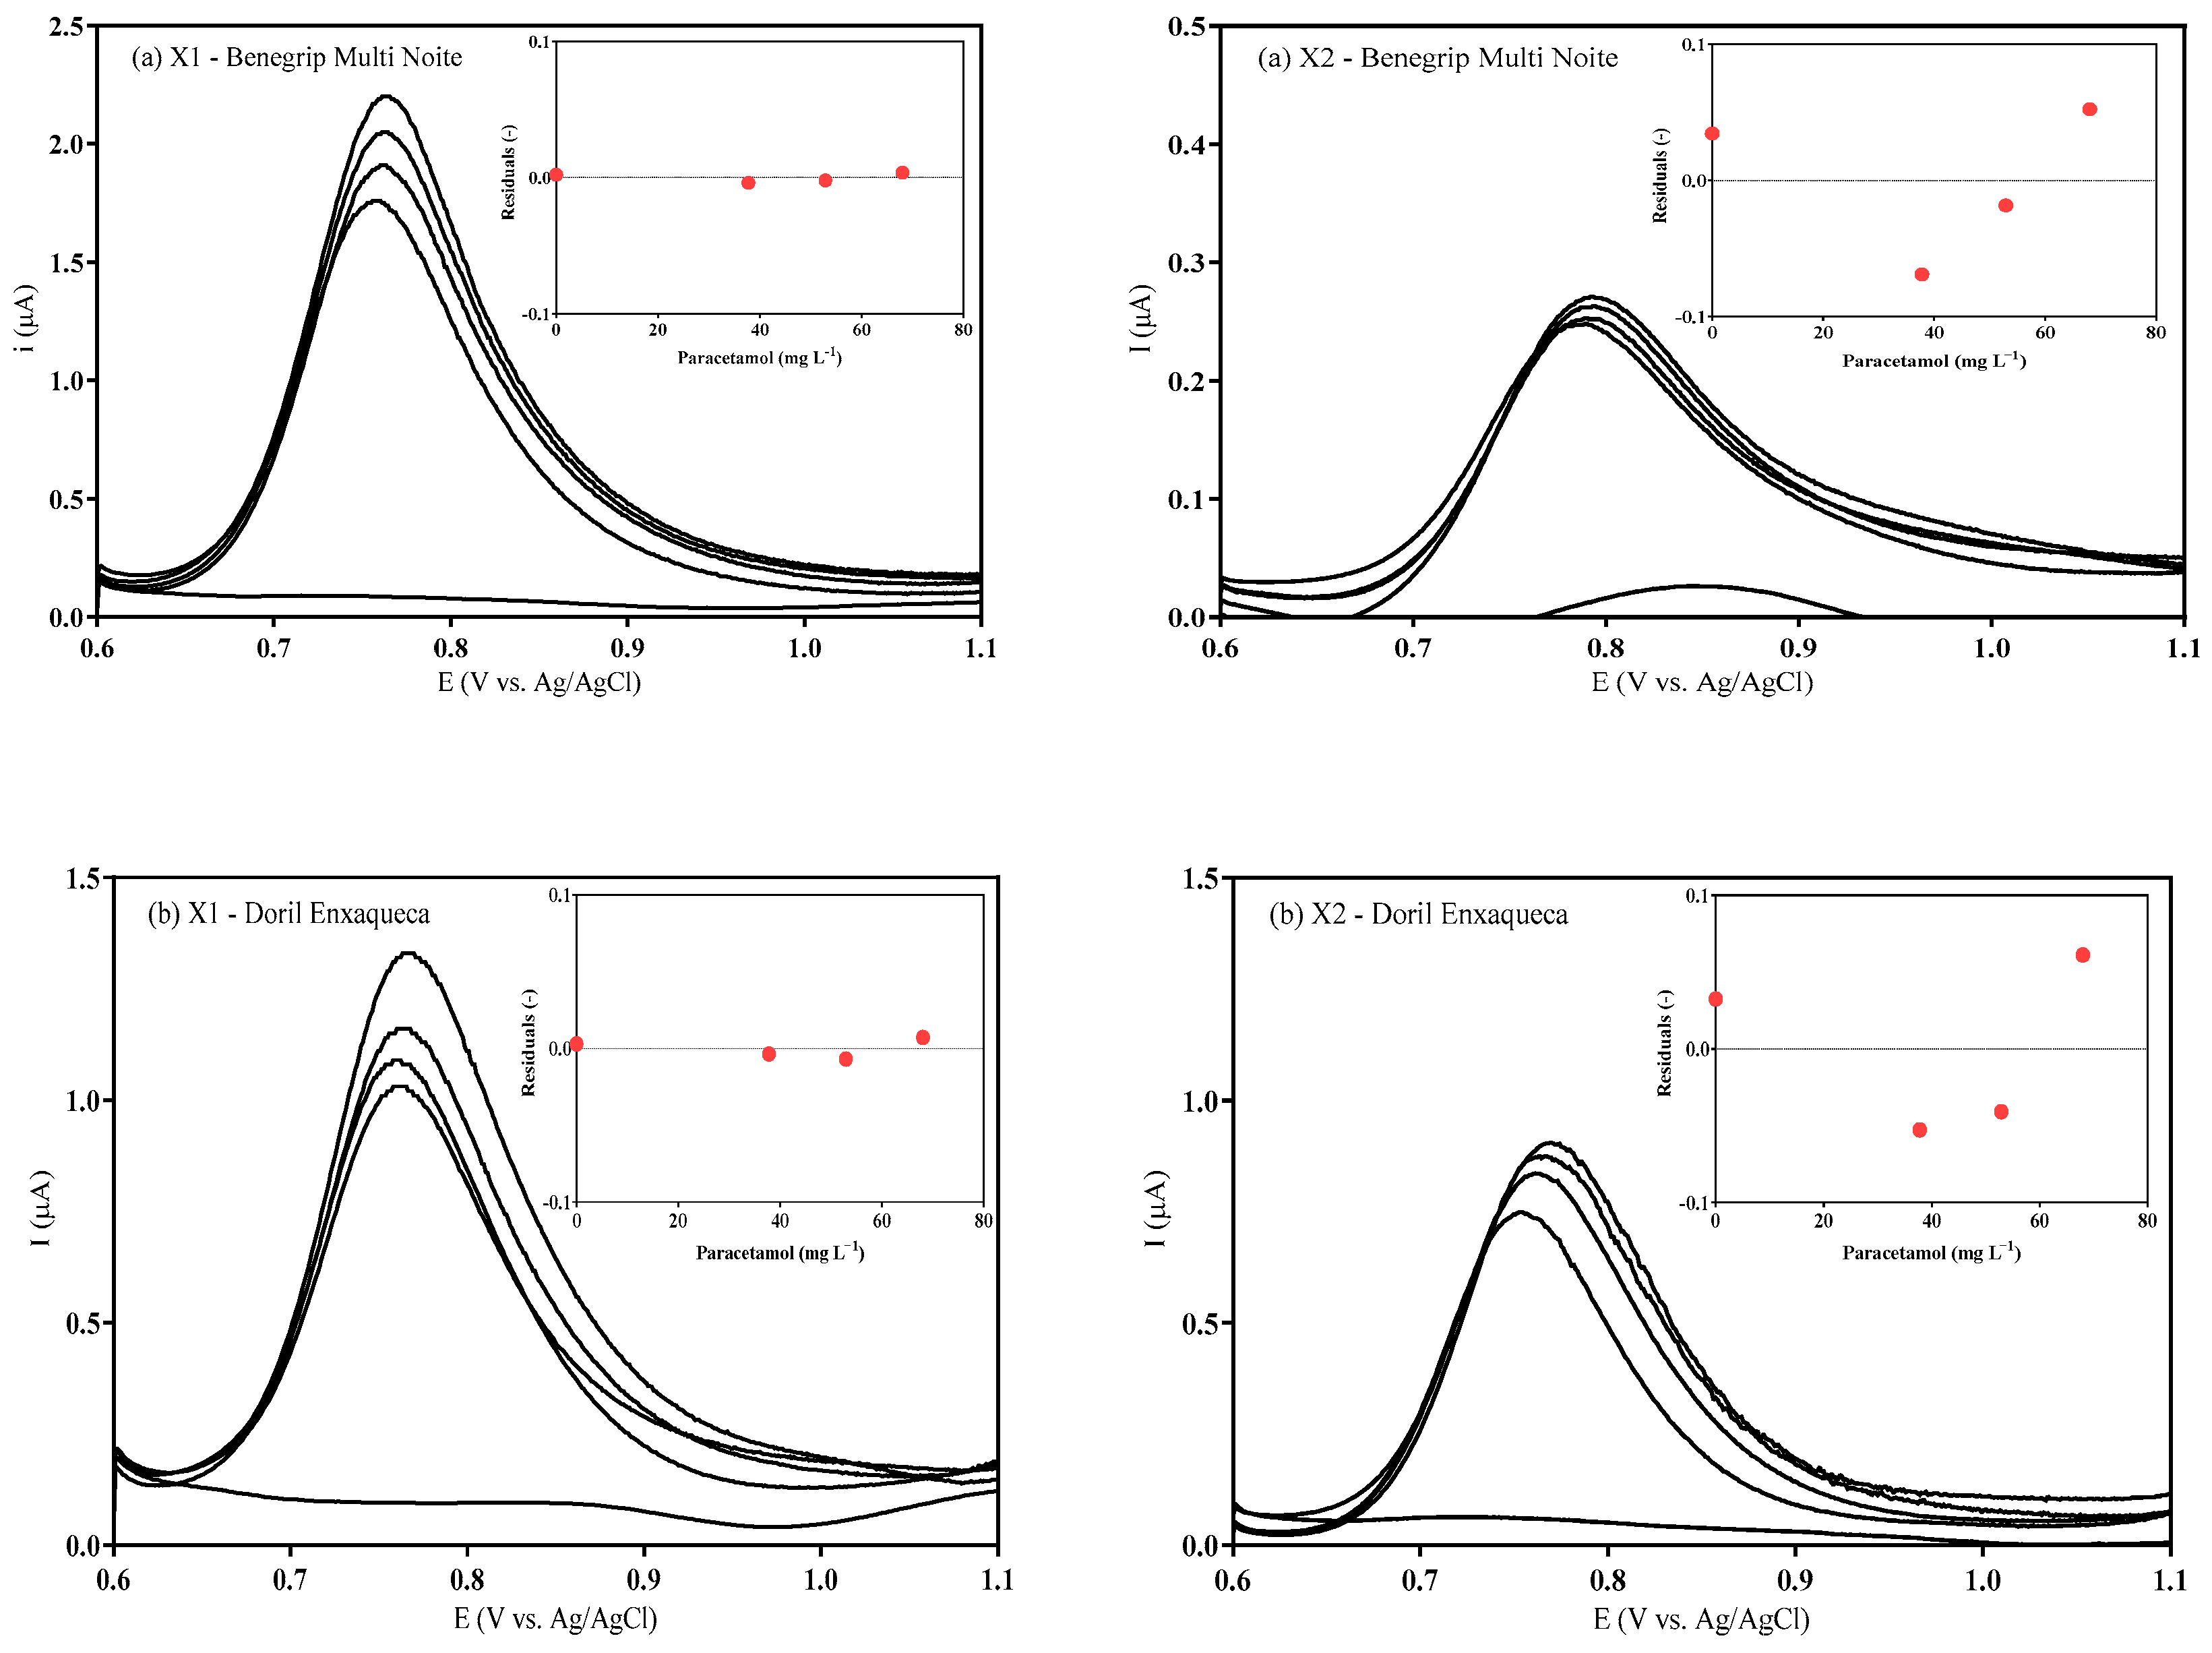
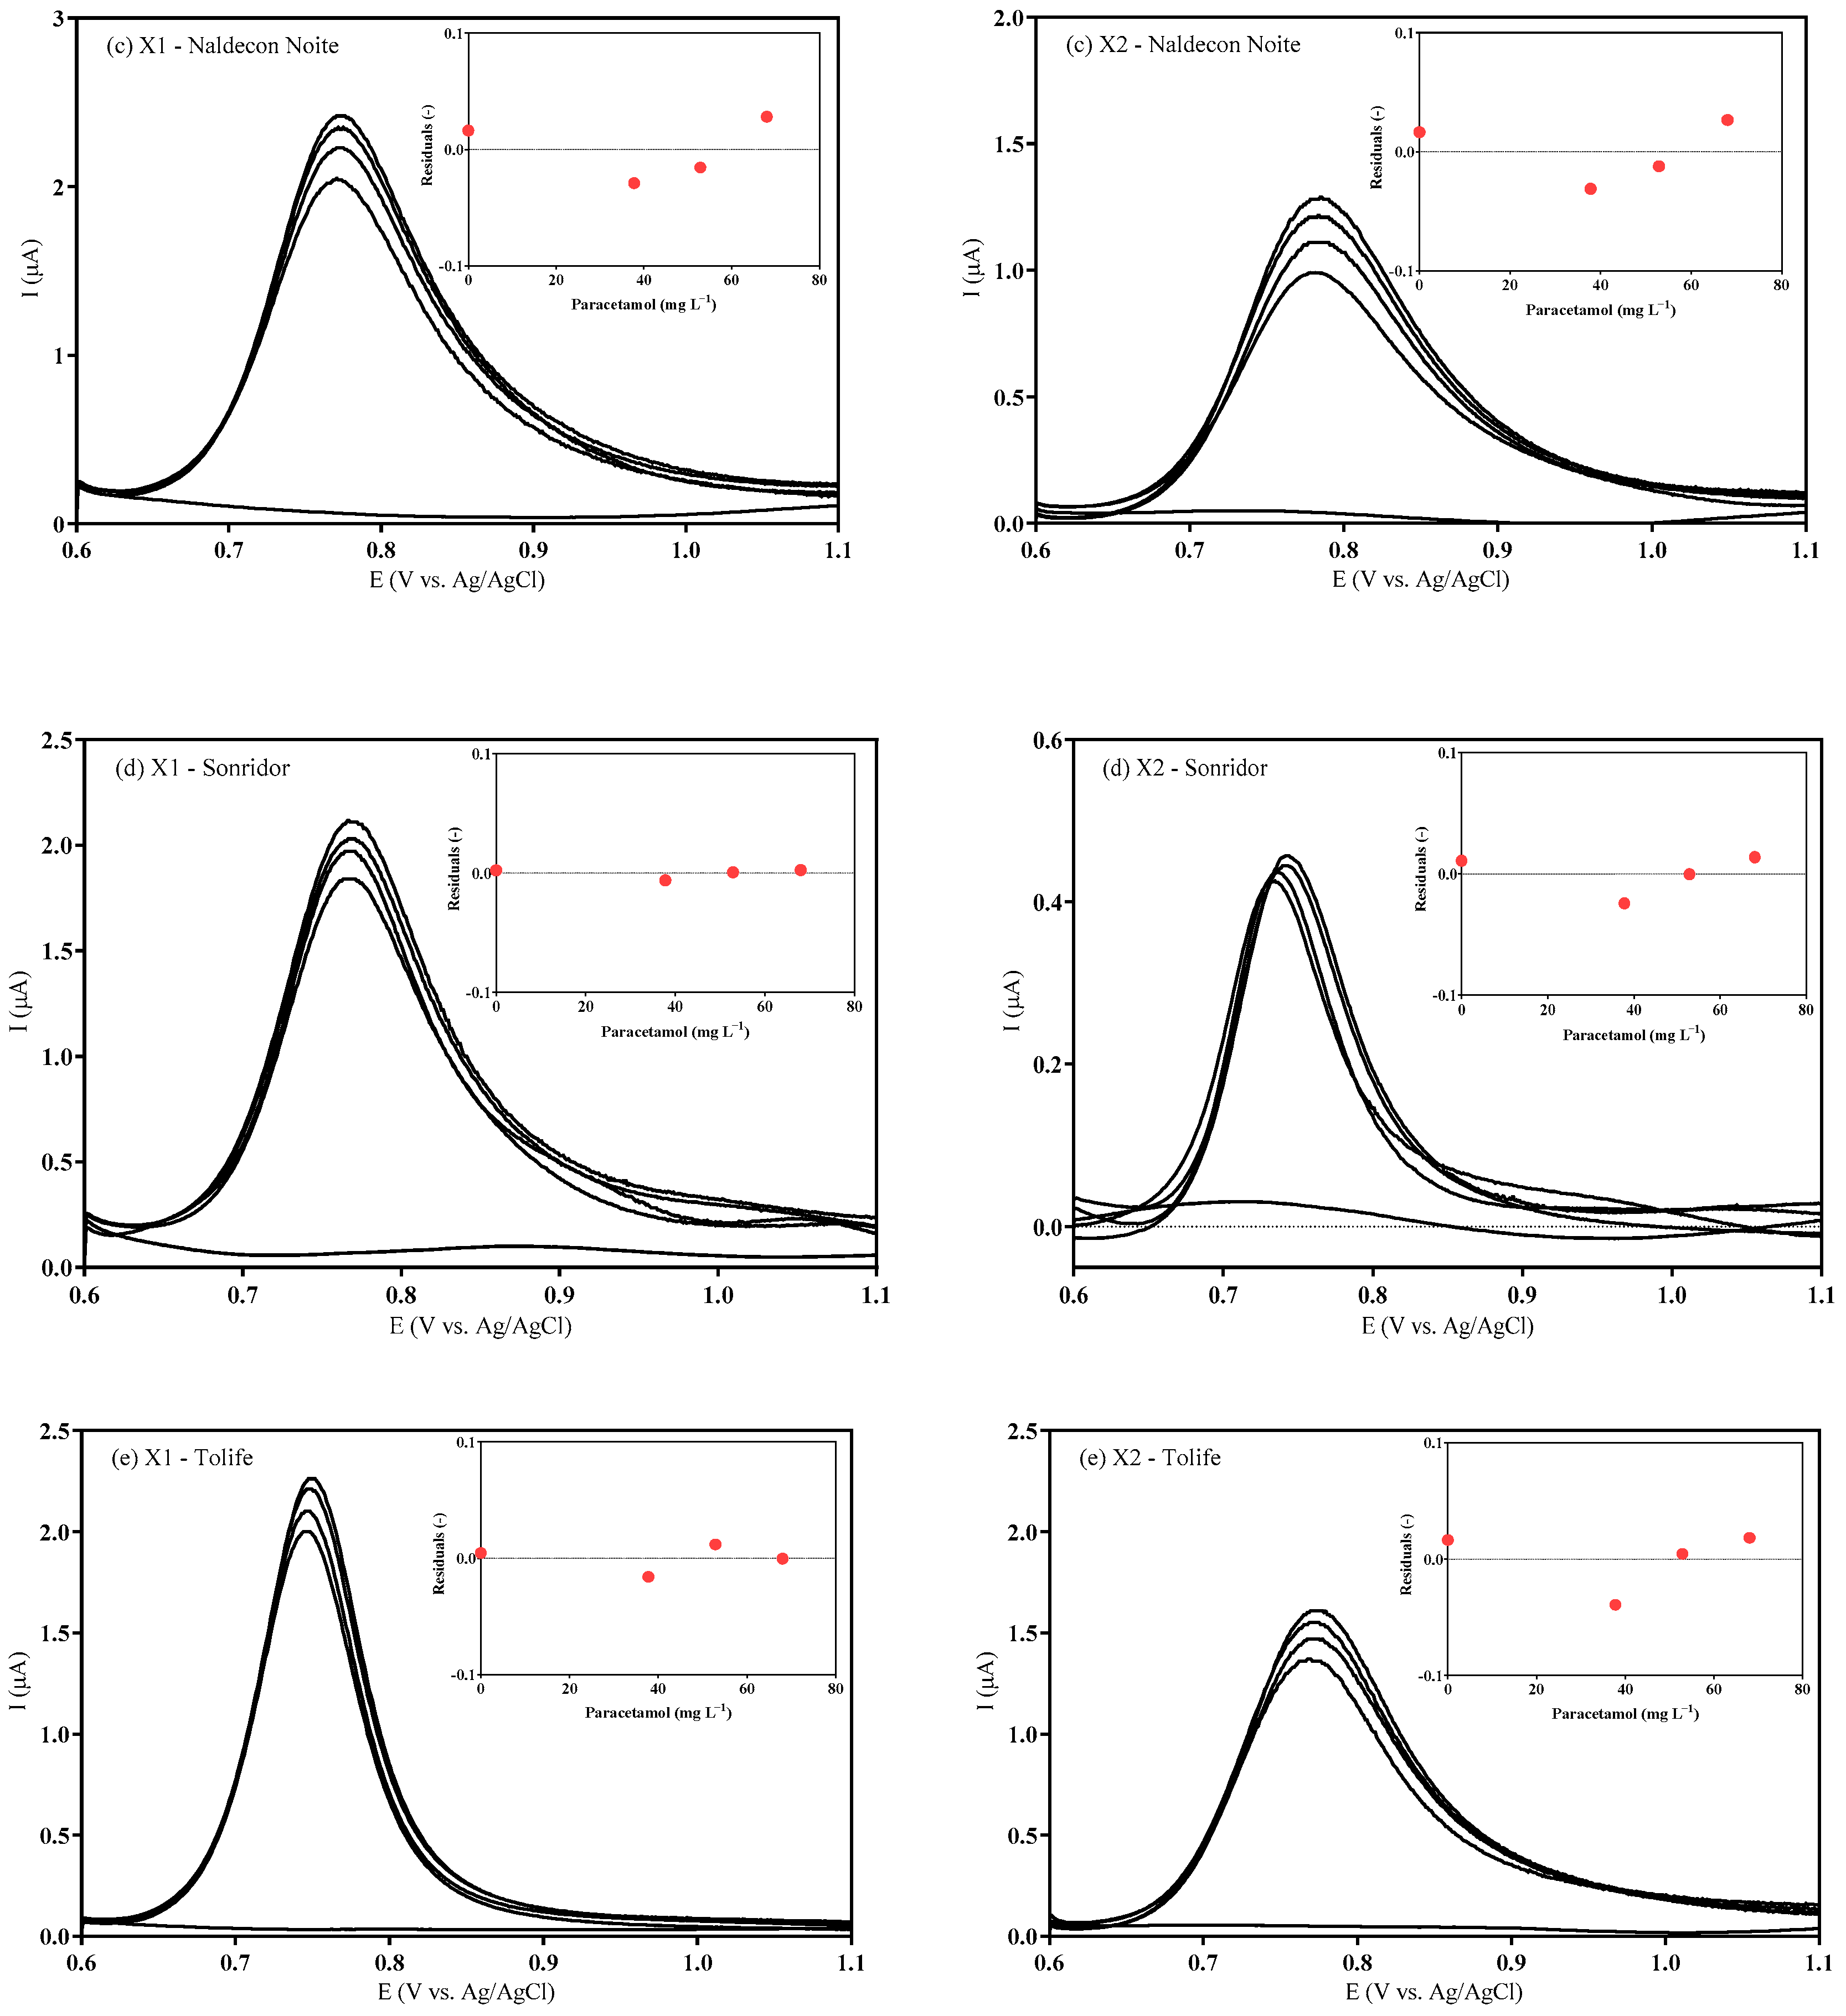
3.5. Analytical Application of Cork-Modified Carbon Paste Electrodes

To fall within the linearity interval of the sensor, the samples used for these tests were carefully diluted with the supporting electrolyte. Table 2 summarizes the analytical results achieved by analyzing real samples of paracetamol content in commercial drugs, and comparing them with the manufacturer’s data and the results obtained by HPLC. The paracetamol content in the drugs was determined using the standard addition method, which avoid the matrix effect. The statistical analysis of the results obtained with the two analytical methods was conducted using the paired t-test. The calculated t values (texp) range from 0.117 to 0.024 (see Table 2) and these were lower than the critical value (2.776, α = 0.05). These results indicated that there are no significant differences between the results obtained at the 95% confidence level [53,54,55,56]. Moreover, as illustrated in Table 2, the concentrations of paracetamol in the drugs align with the declared content. Based on these outcomes, it can be concluded that the proposed procedure can actually be used to determine paracetamol in pharmaceutical formulations.
The voltammograms obtained during the determination of paracetamol in the drugs using the RC-(X1) and RGC-(X2) modified carbon paste sensors are shown in Figure 7. In addition, Figure 7a–e reveals that the regression residuals were evenly distributed around zero, allowing a visual confirmation of the absence of significant nonlinearity for the two sensors [57,58].

4. Conclusions

In this study, cork was utilized as a modifier to improve the performance of carbon paste sensors. The cork-modified paste carbon sensors, labeled X1 and X2, and the unmodified carbon paste sensor, labeled X3, were characterized using CV and DPV techniques. The analysis of the effect of the potential scan rate revealed that the oxidation process was predominantly governed by diffusion. The results relating to the detection limit indicated an enhanced paracetamol response with the modified sensors that contained cork and carbon compared to the unmodified sensor. The practical applicability of the sensor was demonstrated through the analysis of paracetamol in pharmaceutical samples, where the data obtained for X1 and X2 indicated that the former was the sensor that showed better detection performances. Thanks to their improved performances, which involve sensitivity, selectivity, convenience, and practicality, the cork-modified carbon paste sensors appear promising as tools for determining other drugs. It is important to consider that cork could be also combined with other modifiers to open up new alternatives for other applications [59,60].

Author Contributions

Conceptualization, E.V.d.S. and C.A.M.-H.; methodology, M.K.S.M., M.M.S.M. and J.M.M.H.; formal analysis, M.K.S.M., M.M.S.M., J.M.M.H., S.F. and C.A.M.-H.; investigation, M.K.S.M., M.M.S.M., J.M.M.H., S.F. and C.A.M.-H.; resources, C.A.M.-H. and E.V.d.S.; data curation, M.K.S.M., M.M.S.M., J.M.M.H., S.F., E.V.d.S. and C.A.M.-H.; writing—original draft preparation, M.K.S.M., S.F., E.V.d.S. and C.A.M.-H.; writing—review and editing, M.K.S.M., S.F., E.V.d.S. and C.A.M.-H.; funding acquisition, E.V.d.S. and C.A.M.-H. All authors have read and agreed to the published version of the manuscript.

Funding

Financial support was received from the National Council for Scientific and Technological Development (CNPq—430121/2016-4, CNPq—306323/2018-4 and 465571/2014-0) and by L’ORÉAL—ABC—UNESCO. This study was partially financed by the Coordination for the Improvement of Higher Education Personnel (Proc. 88881.156371/2017-01 and CAPES 88887136426/2017/00); by the Human Resources Training Program for Oil, Natural Gas and Biofuels (PRH-ANP.37); and by the Oronzio and Niccolò De Nora Foundation (with a scholarship in Applied Electrochemistry).

Institutional Review Board Statement

Not applicable.

Informed Consent Statement

Not applicable.

Data Availability Statement

The original contributions presented in the study are included in the article, further inquiries can be directed to the corresponding author.

Conflicts of Interest

Author Sergio Ferro was employed by the company Ecas4 Australia Pty. Ltd. The remaining authors declare that the research was conducted in the absence of any commercial or financial relationships that could be construed as a potential conflict of interest.

References

  1. Niedziałkowski, P.; Cebula, Z.; Malinowska, N.; Białobrzeska, W.; Sobaszek, M.; Ficek, M.; Bogdanowicz, R.; Anand, J.S.; Ossowski, T. Comparison of the paracetamol electrochemical determination using boron-doped diamond electrode and boron-doped carbon nanowalls. Biosens. Bioelectron. 2019, 126, 308–314. [Google Scholar] [CrossRef] [PubMed]
  2. Amare, M. Voltammetric determination of paracetamol in tablet formulation using Fe (III) doped zeolite-graphite composite modified GCE. Heliyon 2019, 5, e01663. [Google Scholar] [CrossRef] [PubMed]
  3. Wong, A.; Santos, A.M.; Fatibello-Filho, O. Simultaneous determination of paracetamol and levofloxacin using a glassy carbon electrode modified with carbon black, silver nanoparticles and PEDOT:PSS film. Sens. Actuators B Chem. 2018, 255, 2264–2273. [Google Scholar] [CrossRef]
  4. Tanuja, S.; Swamy, B.K.; Pai, K.V. Electrochemical determination of paracetamol in presence of folic acid at nevirapine modified carbon paste electrode: A cyclic voltammetric study, Journal of Electroanalytical Chemistry. J. Electroanal. Chem. 2017, 798, 17–23. [Google Scholar] [CrossRef]
  5. Mezaal, E.N.; Sadiq, K.A.; Jabbar, M.M.; Al-Noor, T.H.; Azooz, E.A.; Al-Mulla, E.A.J. Al-Mulla, Green methods for determination of paracetamol in drug samples: A comparative study. Green Anal. Chem. 2024, 10, 100123. [Google Scholar] [CrossRef]
  6. Tyszczuk-Rotko, K.; Jaworska, I.; Jędruchniewicz, K. Application of unmodified boron-doped diamond electrode for determination of dopamine and paracetamol. Microchem. J. 2019, 146, 664–672. [Google Scholar] [CrossRef]
  7. Fan, Y.; Liu, J.H.; Lu, H.T.; Zhang, Q. Electrochemical behavior and voltammetric determination of paracetamol on Nafion/TiO2–graphene modified glassy carbon electrode. Colloids Surf. B Biointerfaces 2011, 85, 289–292. [Google Scholar] [CrossRef]
  8. Tyszczuk-Rotko, K.; Bęczkowska, I.; Wójciak-Kosior, M.; Sowa, I. Simultaneous voltammetric determination of paracetamol and ascorbic acid using a boron-doped diamond electrode modified with Nafion and lead films. Talanta 2014, 129, 384–391. [Google Scholar] [CrossRef]
  9. Tefera, M.; Geto, A.; Tessema, M.; Admassie, S. Simultaneous determination of caffeine and paracetamol by square wave voltammetry at poly(4-amino-3-hydroxynaphthalene sulfonic acid)-modified glassy carbon electrode. Food Chem. 2016, 210, 156–162. [Google Scholar] [CrossRef]
  10. Kalakech, C.; Agusti, G.; Gagnière, E.; Vera, R.; Mangin, D.; Lafont, S.; Baltes, D.; Le Hir, M.; Monnot, M.; Charcosset, C.; et al. Paracetamol polymorphs detection in suspension via a new ex situ Fourier Transform Near Infrared spectroscopy method. Chem. Eng. Res. Des. 2024, 208, 808–819. [Google Scholar] [CrossRef]
  11. Morelli, B. Spectrophotometric determination of paracetamol in pure form and in tablets. J. Pharm. Biomed. Anal. 1989, 7, 577–584. [Google Scholar] [CrossRef] [PubMed]
  12. Mallah, M.A.; Sherazi, S.T.H.; Bhanger, M.I.; Mahesar, S.A.; Bajeer, M.A. A rapid Fourier-transform infrared (FTIR) spectroscopic method for direct quantification of paracetamol content in solid pharmaceutical formulations. Spectrochim. Acta Part A Mol. Biomol. Spectrosc. 2015, 141, 64–70. [Google Scholar] [CrossRef] [PubMed]
  13. EL Bouabi, Y.; Farahi, A.; Labjar, N.; El Hajjaji, S.; Bakasse, M.; El Mhammedi, M. Square wave voltammetric determination of paracetamol at chitosan modified carbon paste electrode: Application in natural water samples, commercial tablets and human urines. Mater. Sci. Eng. C 2016, 58, 70–77. [Google Scholar] [CrossRef] [PubMed]
  14. Khaskheli, A.R.; Fischer, J.; Barek, J.; Vyskočil, V.; Sirajuddin; Bhanger, M.I. Differential pulse voltammetric determination of paracetamol in tablet and urine samples at a micro-crystalline natural graphite–polystyrene composite film modified electrode. Electrochimica Acta 2013, 101, 238–242. [Google Scholar] [CrossRef]
  15. de Araújo, D.M.; Paiva, S.D.S.M.; Henrique, J.M.M.; Martínez-Huitle, C.A.; Dos Santos, E.V. Green Composite Sensor for Monitoring Hydroxychloroquine in Different Water Matrix. Materials 2021, 14, 4990. [Google Scholar] [CrossRef]
  16. Barros, T.M.; de Araújo, D.M.; de Melo, A.T.L.; Martínez-Huitle, C.A.; Vocciante, M.; Ferro, S.; dos Santos, E.V. An Electroanalytical Solution for the Determination of Pb2+ in Progressive Hair Dyes Using the Cork–Graphite Sensor. Sensors 2022, 22, 1466. [Google Scholar] [CrossRef]
  17. Monteiro, M.K.S.; Da Silva, D.R.; Quiroz, M.A.; Vilar, V.J.P.; Martínez-Huitle, C.A.; Dos Santos, E.V. Applicability of Cork as Novel Modifiers to Develop Electrochemical Sensor for Caffeine Determination. Materials 2020, 14, 37. [Google Scholar] [CrossRef]
  18. Monteiro, M.K.S.; Santos, E.C.M.M.; Silva, D.R.; Martínez-Huitle, C.A.; dos Santos, E.V. Simultaneous determination of paracetamol and caffeine in pharmaceutical formulations and synthetic urine using cork-modified graphite electrodes. J. Solid State Electrochem. 2020, 24, 1789–1800. [Google Scholar] [CrossRef]
  19. de Freitas Araújo, K.C.; de Araújo Costa, E.C.T.; de Araújo, D.M.; Santos, E.V.; Martínez-Huitle, C.A.; Castro, P.S. Probing the Use of Homemade Carbon Fiber Microsensor for Quantifying Caffeine in Soft Beverages. Materials 2023, 16, 1928. [Google Scholar] [CrossRef]
  20. Berté, M.; Appia, F.T.A.; Sanogo, I.; Ouattara, L. Electrochemical Oxidation of the Paracetamol in its Commercial Formulation on Platinum and Ruthenium Dioxide Electrodes. Int. J. Electrochem. Sci. 2016, 11, 7736–7749. [Google Scholar] [CrossRef]
  21. Švancara, I.; Vytřas, K.; Kalcher, K.; Walcarius, A.; Wang, J. Carbon Paste Electrodes in Facts, Numbers, and Notes: A Review on the Occasion of the 50-Years Jubilee of Carbon Paste in Electrochemistry and Electroanalysis. Electroanalysis 2009, 21, 7–28. [Google Scholar] [CrossRef]
  22. Yoshimi, Y.; Yagisawa, Y.; Yamaguchi, R.; Seki, M. Blood heparin sensor made from a paste electrode of graphite particles grafted with molecularly imprinted polymer. Sens. Actuators B Chem. 2018, 259, 455–462. [Google Scholar] [CrossRef]
  23. Silva, S.P.; Sabino, M.A.; Fernandes, E.M.; Correlo, V.M.; Boesel, L.F.; Reis, R.L. Cork: Properties, capabilities and applications. Int. Mater. Rev. 2005, 50, 345–365. [Google Scholar] [CrossRef]
  24. Souza, R.S.; Porto, P.S.; Pintor, A.M.; Ruphuy, G.; Costa, M.; Boaventura, R.A.; Vilar, V.J. New insights on the removal of mineral oil from oil-in-water emulsions using cork by-products: Effect of salt and surfactants content. Chem. Eng. J. 2016, 285, 709–717. [Google Scholar] [CrossRef]
  25. Pintor, A.M.A.; Ferreira, C.I.A.; Pereira, J.C.; Correia, P.; Silva, S.P.; Vilar, V.J.P.; Botelho, C.M.S.; Boaventura, R.A.R. Use of cork powder and granules for the adsorption of pollutants: A review. Water Res. 2012, 46, 3152–3166. [Google Scholar] [CrossRef]
  26. Monteiro, M.K.; Paiva, S.S.; da Silva, D.R.; Vilar, V.J.; Martínez-Huitle, C.A.; dos Santos, E.V. Novel cork-graphite electrochemical sensor for voltammetric determination of caffeine. J. Electroanal. Chem. 2019, 839, 283–289. [Google Scholar] [CrossRef]
  27. Palakollu, V.N.; Chiwunze, T.E.; Liu, C.; Karpoormath, R. Electrochemical sensitive determination of acetaminophen in pharmaceutical formulations at iron oxide/graphene composite modified electrode. Arab. J. Chem. 2020, 13, 4350–4357. [Google Scholar] [CrossRef]
  28. Patil, D.S.; Shetti, N.P.; Nayak, D.S.; Revankar, R.S. Fabrication of multi-walled carbon nanotubes and ZnO nanoparticles composite electrode as a sensor for paracetamol. Mater. Today Proc. 2019, 18, 1124–1131. [Google Scholar] [CrossRef]
  29. Kang, X.; Wang, J.; Wu, H.; Liu, J.; Aksay, I.A.; Lin, Y. A graphene-based electrochemical sensor for sensitive detection of paracetamol. Talanta 2010, 81, 754–759. [Google Scholar] [CrossRef]
  30. Abbaspour, A.; Mirzajani, R. Electrochemical monitoring of piroxicam in different pharmaceutical forms with multi-walled carbon nanotubes paste electrode. J. Pharm. Biomed. Anal. 2007, 44, 41–48. [Google Scholar] [CrossRef]
  31. Santos, A.M.; Wong, A.; Fatibello-Filho, O. Simultaneous determination of salbutamol and propranolol in biological fluid samples using an electrochemical sensor based on functionalized-graphene, ionic liquid and silver nanoparticles. J. Electroanal. Chem. 2018, 824, 1–8. [Google Scholar] [CrossRef]
  32. Bard, A.J.; Faulkner, L.R. Electrochemical Methods: Fundamentals and Applications, 2nd ed.; John Wiley & Sons Inc.: New York, NY, USA, 2000. [Google Scholar]
  33. Brunetti, B.; Desimoni, E.; Casati, P. Determination of Caffeine at a Nafion-Covered Glassy Carbon Electrode. Electroanalysis 2007, 19, 385–388. [Google Scholar] [CrossRef]
  34. Brunetti, B.; Desimoni, E. Voltammetric determination of vitamin B6 in food samples and dietary supplements. J. Food Compos. Anal. 2014, 33, 155–160. [Google Scholar] [CrossRef]
  35. Khairy, M.; Mahmoud, B.G.; Banks, C.E. Simultaneous determination of codeine and its co-formulated drugs acetaminophen and caffeine by utilising cerium oxide nanoparticles modified screen-printed electrodes. Sens. Actuators B Chem. 2018, 259, 142–154. [Google Scholar] [CrossRef]
  36. Pintor, A.M.A.; Silvestre-Albero, A.M.; Ferreira, C.I.A.; Pereira, J.P.C.; Vilar, V.J.P.; Botelho, C.M.S.; Rodríguez-Reinoso, F.; Boaventura, R.A.R. Textural and Surface Characterization of Cork-Based Sorbents for the Removal of Oil from Water. Ind. Eng. Chem. Res. 2013, 52, 16427–16435. [Google Scholar] [CrossRef]
  37. Shahmiri, M.R.; Bahari, A.; Karimi-Maleh, H.; Hosseinzadeh, R.; Mirnia, N. Ethynylferrocene–NiO/MWCNT nanocomposite modified carbon paste electrode as a novel voltammetric sensor for simultaneous determination of glutathione and acetaminophen. Sens. Actuators B Chem. 2013, 177, 70–77. [Google Scholar] [CrossRef]
  38. Goyal, R.N.; Singh, S.P. Voltammetric determination of paracetamol at C60-modified glassy carbon electrode. Electrochimica Acta 2006, 51, 3008–3012. [Google Scholar] [CrossRef]
  39. Si, W.; Lei, W.; Han, Z.; Zhang, Y.; Hao, Q.; Xia, M. Electrochemical sensing of acetaminophen based on poly(3,4-ethylenedioxythiophene)/graphene oxide composites. Sens. Actuators B Chem. 2014, 193, 823–829. [Google Scholar] [CrossRef]
  40. Pasban, A.A.; Nia, E.H.; Piryaei, M. Determination of acetaminophen via TiO2/ MWCNT modified electrode. J. Nanoanal. 2017, 4, 142–149. [Google Scholar]
  41. Su, W.; Cheng, S. Electrochemical Oxidation and Sensitive Determination of Acetaminophen in Pharmaceuticals at Poly(3,4-ethylenedioxythiophene)-Modified Screen-Printed Electrodes. Electroanalysis 2010, 22, 707–714. [Google Scholar] [CrossRef]
  42. Bayram, E.; Akyilmaz, E. Development of a new microbial biosensor based on conductive polymer/multiwalled carbon nanotube and its application to paracetamol determination. Sens. Actuators B Chem. 2016, 233, 409–418. [Google Scholar] [CrossRef]
  43. Fu, L.; Xie, K.; Zheng, Y.; Zhang, L.; Su, W. Graphene Ink Film Based Electrochemical Detector for Paracetamol Analysis. Electronics 2018, 7, 15. [Google Scholar] [CrossRef]
  44. Patil, M.M.; Shetti, N.P.; Malode, S.J.; Nayak, D.S.; Chakklabbi, T.R. Electroanalysis of paracetamol at nanoclay modified graphite electrode. Mater. Today Proc. 2019, 18, 986–993. [Google Scholar] [CrossRef]
  45. Liu, R.; Zeng, X.; Liu, J.; Luo, J.; Zheng, Y.; Liu, X. A glassy carbon electrode modified with an amphiphilic, electroactive and photosensitive polymer and with multi-walled carbon nanotubes for simultaneous determination of dopamine and paracetamol. Microchim. Acta 2016, 183, 1543–1551. [Google Scholar] [CrossRef]
  46. Wang, J.; Liu, S.; Luo, J.; Hou, S.; Song, H.; Niu, Y.; Zhang, C. Conductive Metal-Organic Frameworks for Amperometric Sensing of Paracetamol. Front. Chem. 2020, 8, 594093. [Google Scholar] [CrossRef]
  47. Karimi-Maleh, H.; Moazampour, M.; Ahmar, H.; Beitollahi, H.; Ensafi, A.A. A sensitive nanocomposite-based electrochemical sensor for voltammetric simultaneous determination of isoproterenol, acetaminophen and tryptophan. Measurement 2014, 51, 91–99. [Google Scholar] [CrossRef]
  48. Mulyasuryani, A.; Tjahjanto, R.T.; Andawiyah, R. Simultaneous voltammetric detection of acetaminophen and caffeine base on cassava starch-Fe3O4 nanoparticles modified glassy carbon electrode. Chemosensors 2019, 7, 49. [Google Scholar] [CrossRef]
  49. Câmpean, A.; Tertiş, M.; Săndulescu, R. Voltammetric determination of some alkaloids and other compounds in pharmaceuticals and urine using an electrochemically activated glassy carbon electrode. Open Chem. 2011, 9, 688–700. [Google Scholar] [CrossRef]
  50. Alagarsamy, P.; Settu, R.; Chen, S.-M.; Chen, T.-W.; Hong, I.-S.; Rao, M.M. Amperometric determination of acetaminophen (paracetamol) using graphene oxide modified glassy carbon electrode. Int. J. Electrochem. Sci. 2018, 13, 7930–7938. [Google Scholar] [CrossRef]
  51. Yu, Q.; Zou, J.; Xiong, Q.; Peng, G.; Gao, F.; Fan, G.; Chen, S.; Lu, L. Electrochemical Sensor Based on Biochar Decorated with Gold Clusters for Sensitive Determination of Acetaminophen. Int. J. Electrochem. Sci. 2022, 17, 220438. [Google Scholar] [CrossRef]
  52. Allende, S.; Liu, Y.; Jacob, M.V. Electrochemical sensing of paracetamol based on sugarcane bagasse-activated biochar. Ind. Crops Prod. 2024, 211, 118241. [Google Scholar] [CrossRef]
  53. Cao, Y.; Si, W.; Zhang, Y.; Hao, Q.; Lei, W.; Xia, X.; Li, J.; Wang, F. Nitrogen-doped graphene: Effect of graphitic-N on the electrochemical sensing properties towards acetaminophen. FlatChem 2018, 9, 1–7. [Google Scholar] [CrossRef]
  54. Zhang, X.; Wang, K.P.; Zhang, L.-N.; Zhang, Y.C.; Shen, L. Phosphorus-doped graphene-based electrochemical sensor for sensitive detection of acetaminophen. Anal. Chim. Acta 2018, 1036, 26–32. [Google Scholar] [CrossRef] [PubMed]
  55. Kalambate, P.K.; Sanghavi, B.J.; Karna, S.P.; Srivastava, A.K. Simultaneous voltammetric determination of paracetamol and domperidone based on a graphene/platinum nanoparticles/nafion composite modified glassy carbon electrode. Sens. Actuators B Chem. 2015, 213, 285–294. [Google Scholar] [CrossRef]
  56. Anuar, N.S.; Basirun, W.J.; Ladan, M.; Shalauddin; Mehmood, M.S. Fabrication of platinum nitrogen-doped graphene nanocomposite modified electrode for the electrochemical detection of acetaminophen. Sens. Actuators B Chem. 2018, 266, 375–383. [Google Scholar] [CrossRef]
  57. Shetti, N.P.; Malode, S.J.; Nayak, D.S.; Reddy, K.R.; Reddy, C.V.; Ravindranadh, K. Silica gel-modified electrode as an electrochemical sensor for the detection of acetaminophen. Microchem. J. 2019, 150, 104206. [Google Scholar] [CrossRef]
  58. Song, J.; Yang, J.; Zeng, J.; Tan, J.; Zhang, L. Graphite oxide film-modified electrode as an electrochemical sensor for acetaminophen. Sens. Actuators B Chem. 2011, 155, 220–225. [Google Scholar] [CrossRef]
  59. Ravariu, C.; Mihaiescu, D.; Morosan, A.; Vasile, B.S.; Purcareanu, B. Sulpho-Salicylic Acid Grafted to Ferrite Nanoparticles for n-Type Organic Semiconductors. Nanomaterials 2020, 10, 1787. [Google Scholar] [CrossRef]
  60. Moulaee, K.; Neri, G. Electrochemical Amino Acid Sensing: A Review on Challenges and Achievements. Biosensors 2021, 11, 502. [Google Scholar] [CrossRef]
Figure 1. Cyclic voltammograms obtained in 0.5 M H2SO4, 0.5 M NaOH, and 0.5 M Na2SO4 solutions adding 0.5 mM hexamine ruthenium trichloride (Ru(NH3)6Cl3) using the RC- and RGC-modified carbon paste sensors (a) X1 and (b) X2 electrodes, respectively. Scan rate = 50 mV s−1 and number of cycles = 10 cycles.
Chemosensors 12 00183 g001
Figure 2. Cyclic voltammograms recorded on RC-(X1) and RGC-(X2) modified carbon paste sensors, and unmodified sensor (X3), in the presence of 0.01 M paracetamol (in 0.5 M H2SO4); scan rate: 50 mVs−1.
Chemosensors 12 00183 g002
Figure 3. Paracetamol oxidation mechanism.
Chemosensors 12 00183 g003
Figure 4. Nyquist plots for the investigated sensors: (a) X1 (RC-modified); (b) X2 (RGC-modified); and (c) X3 (pure carbon paste).
Chemosensors 12 00183 g004aChemosensors 12 00183 g004b
Figure 5. Cyclic voltammograms obtained at sensors (a) X1 and (b) X2 in 0.5 M H2SO4 solution containing with 0.01 M paracetamol at different scan rates. Insert: log (I (µA)) vs. log (v (V s−1)) and I (µA) vs. v1/2 ((V s−1)1/2). The dashed lines represent the 95% of confidence of data obtained.
Chemosensors 12 00183 g005aChemosensors 12 00183 g005b
Figure 6. Differential pulse voltammograms recorded, in X1 (a), X2 (b), and X3 (c) electrochemical sensors, in 0.5 M H2SO4 solution as a function of successive additions of 0.01 M paracetamol solution: supporting electrolyte, 25, 50, 100, 150, 200, 250, 300, 350, 400, 450, 500, 600, 700, 800, 900 and 1000 μM. Insets: calibration plots of the paracetamol concentration versus peak current (The dashed lines represent the 95% of confidence of data obtained.) as well as the micrographs of the modified and unmodified carbon paste sensors (electrode geometric area = 0.78 cm2).
Chemosensors 12 00183 g006aChemosensors 12 00183 g006b
Figure 7. DPV curves for the five drugs analyzed with sensors X1 and X2: (a) Benegrip Multi Noite, (b) Doril Enxaqueca, (c) Naldecon Noite, (d) Sonridor and (e) Tolife. Insets: Graphics displaying weighted residuals for all detection measurements.
Chemosensors 12 00183 g007aChemosensors 12 00183 g007b
Table 1. Comparison of the performance of sensors proposed for the electrochemical detection of paracetamol.
ElectrodeMethodLinear Range (µM)Detection Limit (µM)Reference
C60DPV50–150050[38]
CDA/Au-Ag NPDPV10–1002.6[39]
MWCNT/TiO2CV10–12011.77[40]
SPE/PEDOTDPV4–4003.7[41]
Au/Pani/cMWCNT/Bas/GADPV5–6302.9[42]
GI/GCEDPV10–5002.7[43]
NC-GPEDPV50–4003.71[44]
MWCNT-polymer/GCEDPV5–10003.5[45]
NiCu-CAT/GCEDPV5–1905[46]
DMBQ-MCNTPEDPV5–5001[47]
GCE-M221-Fe3O4DPV50–200016[48]
AGCEDPV0.1–1000.72[49]
GO/GCEDPV0.1–4300.021[50]
AuNCs/BCDPV0.003–501[51]
SCB-activatedbiochar/GCEDPV5–9502.5[52]
RC-modified carbon paste (X1)DPV25–10002.4This work
Table 2. Results obtained for the determination of paracetamol in pharmaceutical formulations (tablets) using the DPV (proposed) and HPLC methods.
MedicineParacetamol (mg)
ab *c *d *
Benegrip Multi Noite800669.17 ± 3.86945.70 ± 5.46760.92 ± 4.39
Doril Enxaqueca250279.35 ± 1.61348.60 ± 2.01321.20 ± 1.85
Naldecon Noite800775.67 ± 4.48917.66 ± 5.30794.05 ± 4.58
Sonridor500436.50 ± 2.52626.10 ± 3.61578.11 ± 3.34
Tolife1000965.03 ± 5.571099.90 ± 6.35948.78 ± 5.48
* Average of 3 measurements. a: nominal amount of paracetamol in the sample (mg) b: amount of paracetamol estimated using DPV on X1; (mg) ± % RSD (n = 5) c: amount of paracetamol estimated using DPV on X2; (mg) ± % RSD (n = 5) d: amount of paracetamol estimated by HPLC; (mg) ± % RSD (n = 5).
Disclaimer/Publisher’s Note: The statements, opinions and data contained in all publications are solely those of the individual author(s) and contributor(s) and not of MDPI and/or the editor(s). MDPI and/or the editor(s) disclaim responsibility for any injury to people or property resulting from any ideas, methods, instructions or products referred to in the content.

