Abstract
The assessment of catechin content stands as a pivotal determinant of tea quality. In tea production and quality grading, the development of accurate and non-destructive techniques for the accurate prediction of various catechin content is paramount. Near-infrared spectroscopy (NIRS) has emerged as a widely employed tool for analyzing the chemical composition of tea. Nevertheless, the spectral information obtained from NIRS faces challenges when discerning different types of catechins in black tea, owing to their similar physical and chemical properties. Moreover, the vast number of NIRS wavelengths exceeds the available tea samples, further complicating the accurate assessment of catechin content. This study introduces a novel deep learning approach that integrates specific wavelength selection and attention mechanisms to accurately predict the content of various catechins in black tea simultaneously. First, a wavelength selection algorithm is proposed based on feature interval combination sensitivity segmentation, which effectively extracts the NIRS feature information of tea. Subsequently, a one-dimensional convolutional neural network (CNN) incorporating channel and spatial–sequential attention mechanisms is devised to independently extract the key features from the selected wavelength variables. Finally, a multi-output predictor is employed to accurately predict the four main catechins in tea. The experimental results demonstrate the superiority of the proposed model over existing methods in terms of prediction accuracy and stability (R2 = 0.92, RMSE = 0.018 for epicatechin; R2 = 0.96, RMSE = 0.11 for epicatechin gallate; R2 = 0.97, RMSE = 0.14 for epigallocatechin; R2 = 0.97, RMSE = 0.32 for epigallocatechin gallate). This innovative deep learning approach amalgamates wavelength selection with attention mechanisms, provides a new perspective for the simultaneous assessment of the major components in tea, and contributes to the advancement of precision management in the tea industry’s production and grading processes.
1. Introduction
Black tea is one of the most widely consumed beverages globally, captivating the taste buds of two-thirds of the world’s population [1,2,3]. The content of tea polyphenols is directly related to the quality of black tea. Tea polyphenols, mainly consisting of catechins, have various positive effects on the body, such as regulating gut microbiota, reducing obesity, and exhibiting antiviral and antibacterial properties [4,5,6]. Due to these positive effects, there is an increasing consumer demand for tea products with a high catechin content, as they are associated with improved health outcomes. Consequently, the ability to accurately assess catechin content is crucial to ensure that tea products deliver the expected health benefits, making it essential for producers to meet market demands and maintain quality standards.
Traditional methods for evaluating tea quality primarily rely on professional tea evaluators who use sensory information to judge the quality of tea based on five aspects: appearance, liquor color, aroma, taste, and leaf residue [7]. However, these sensory evaluations are subjective and prone to human error, leading to inconsistencies and potential biases in quality assessments. This subjectivity poses a significant challenge in standardizing tea quality evaluation across different evaluators and regions. The traditional method for detecting catechin content in tea usually involves a high-performance liquid chromatography (HPLC) [8]. Although HPLC can effectively separate the various components of tea polyphenols and accurately detect their content, this method is often very time-consuming in practical testing [9,10]. Additionally, HPLC requires extensive sample preparation, complex procedures, and expensive equipment, making it less suitable for rapid, on-site analysis, limiting its widespread applicability for real-time quality control in the tea industry. Therefore, proposing an accurate and rapid detection method for catechin content is of great significance for evaluating the quality of black tea.
Near-infrared spectroscopy (NIRS) [11] technology utilizes chemometric techniques to analyze the chemical information obtained from the near-infrared spectra of samples about the content or properties of the substances within them, thereby establishing quantitative or qualitative analysis models. These models enable the rapid prediction of the content or properties of specific substances. NIRS has been applied in areas such as tea origin tracing, quality grade identification, and the quantitative prediction of intrinsic components [12]. Turgut et al. successfully predicted the sensory quality (appearance, shape, color, and overall quality) and other important component indicators (bulk density, cellulose, water extract, and moisture) of black tea samples by combining NIRS with partial least squares (PLS) regression [13]. Dong et al. established an ELM discrimination model, achieving 100% accuracy in identifying black tea adulterated with exogenous sucrose [14]. Chen et al. used NIRS to detect the caffeine, EGC, EGCG, EC, ECG, and total catechin content in fresh green tea leaves, developing effective quantitative prediction models with accuracies exceeding 0.9 [15]. Liu et al. proposed the FICSS-ELM model to simultaneously predict the contents of EGC, EGCG, EC, and ECG in black tea. FICSS is used to extract the effective features of each catechin, while ELM is used for simultaneous prediction [16]. Despite its advantages, chemometric modeling approaches in NIRS face challenges when handling complex, nonlinear relationships between spectral data and catechin content. These methods often require extensive preprocessing and feature selection to improve the model’s accuracy. Moreover, the presence of noise and irrelevant information in the spectral data can affect the reliability and robustness of the predictions.
In recent years, the rapid advancement of deep learning has opened new avenues for research in chemometric modeling. The integration of convolutional neural networks (CNNs) with NIRS analysis techniques has found extensive application in the domain of food quality control. Li et al. devised a one-dimensional convolutional neural network, optimized using a grid search algorithm, and fused it with NIRS to estimate the sugar content in Huangshan Maofeng tea leaves [17]. Liu et al. developed an ensemble learning approach based on CNN estimation to identify two types of adulterants, hydrolyzed leather protein and melamine, in infant formulas [18]. Yang et al. introduced a series of innovative NIR-based CNNs tailored for tea leaf data, namely TeaNet, TeaResnet, and TeaMobilenet, achieving a classification accuracy rate of 100% in tea-grade classification [19]. Additionally, Luo et al. presented a tea polyphenol prediction model utilizing a CNN to extract spectral–spatial deep features, surpassing the limitations associated with traditional shallow features. This groundbreaking approach integrates deep learning methodologies into the realm of non-destructive tea leaf testing [20].
Despite the notable advancements made by deep learning models in NIRS analysis, challenges persist due to the relatively small sample size and the vast number of wavelength variables present in tea NIRS data, particularly when aiming for the simultaneous evaluation of multiple active ingredient contents in tea leaves. These models can also suffer from overfitting and their performance can be limited by the lack of interpretability and the need for substantial computational resources. Previous studies have highlighted that the integration of attention mechanisms [21] into deep learning models can significantly enhance their accuracy in quantitatively analyzing near-infrared spectroscopy data [22,23,24]. However, there remains a paucity of research on the amalgamation of NIRS, CNNs, and attention mechanisms for the simultaneous prediction of multiple catechin contents in black tea.
To tackle these challenges and enhance the accuracy of simultaneously predicting multiple catechin contents in black tea, a deep learning model named FICSS-CNN-CSAM is proposed, which integrates wavelength selection and attention mechanisms. This model comprises four key components: a wavelength selector, a feature extractor, attention mechanisms, and a catechin content predictor. Leveraging deep learning models equipped with wavelength selection and attention mechanisms enables adaptation to small-sample NIRS data learning, circumvents the need for intricate feature engineering, and facilitates the construction of a more precise mapping relationship between the content of different catechins and the unique NIRS spectra. The primary innovations are outlined as follows:
- (1)
- A wavelength selection method named FICSS is introduced, which systematically screens wavelength variables through partitioning. FICSS eliminates overlapping intervals of various catechin spectra, selects the most representative wavelength variables for each type of catechin, reduces the prediction model’s complexity, and enhances the stability of the selection process.
- (2)
- A novel deep learning model named CNN-CSAM is introduced to predict the content of four catechins in tea simultaneously. CNN-CSAM integrates a channel and spatial dimensions attention mechanism into its feature-extraction process. The CSAM selectively emphasizes the relevant features while diminishing the impact of the unimportant ones, thereby improving the accuracy of the catechin content prediction.
2. Materials
2.1. Black Tea Sample Preparation
In this study, we collected tea samples from Anshun City, Guizhou Province, including Jinjunmei, Maojian, Yunwu Tea, and others, totaling 105 experimental samples. The 105 tea samples were then randomly divided into two groups: a calibration set of 70 samples and a prediction set of 35 samples, with a ratio of 2:1.
2.2. NIR Spectra Acquisition
In this study, we collected tea samples from Anshun City, Guizhou Province, including varieties such as Jinjunmei, Maojian, and Yunwu Tea, totaling 105 experimental samples. We utilized an Antaris Fourier Transform Near-Infrared Spectrometer (Thermo Fisher Scientific Inc., Waltham, MA, USA) as our primary experimental equipment. Prior to the commencement of the experiment, the spectrometer was turned on and preheated for 30 min to achieve a stable operational state, ensuring the accuracy and reliability of the spectral measurements. The scanning wavenumber range was set to 4000–10,000 cm−1 with a resolution of 8 cm−1 and a scanning frequency of 64 scans per sample. Each tea sample was carefully weighed using a high-precision analytical balance (XPR226CDR/AC, Mettler Toledo, Columbus, OH, USA) to ensure an exact mass of 10 g and placed in a standardized culture dish to maintain uniformity across all measurements. The tea sample was compacted using a compactor to minimize air gaps and ensure a consistent packing density, which is critical for accurate spectral readings.
The NIR spectra acquisition was conducted in a controlled laboratory environment with a stable temperature of 25 °C and relative humidity of approximately 50%. These conditions were maintained to minimize the impact of environmental fluctuations on the spectral data quality. For each sample, three spectra were collected to account for any variability in the measurements, and the average of these three spectra was used as the representative spectral data. This detailed procedure was designed to maximize the reproducibility of our experiments, ensuring that future studies can replicate our methodology and validate our findings.
2.3. The Actual Value of Catechin Content Acquisition
The catechin content in tea samples was determined according to GB/T 8313-2008 [25,26]. The detection process involved using a LC-20A HPLC instrument (Shimadzu Corporation, Kyoto, Japan). For the analysis, a Waters C18 column (4.6 mm × 250 mm, 5 µm) was utilized. The mobile phases consisted of 2% acetic acid (phase A) and pure acetonitrile (phase B). The conditions set were an injection volume of 10 µL, a flow rate of 1 mL/min, a detection wavelength of 280 nm, and a column temperature of 35 °C.
The elution sequence was the following: mobile phase B increased from 6.5% to 15% over the first 16 min; from 16 to 25 min, it increased further to 25%; from 25 to 25.5 min, it decreased back to 6.5%; and from 25.5 to 30 min, phase B remained at 6.5%. The quantification of catechins was performed using the external standard method.
3. Methods
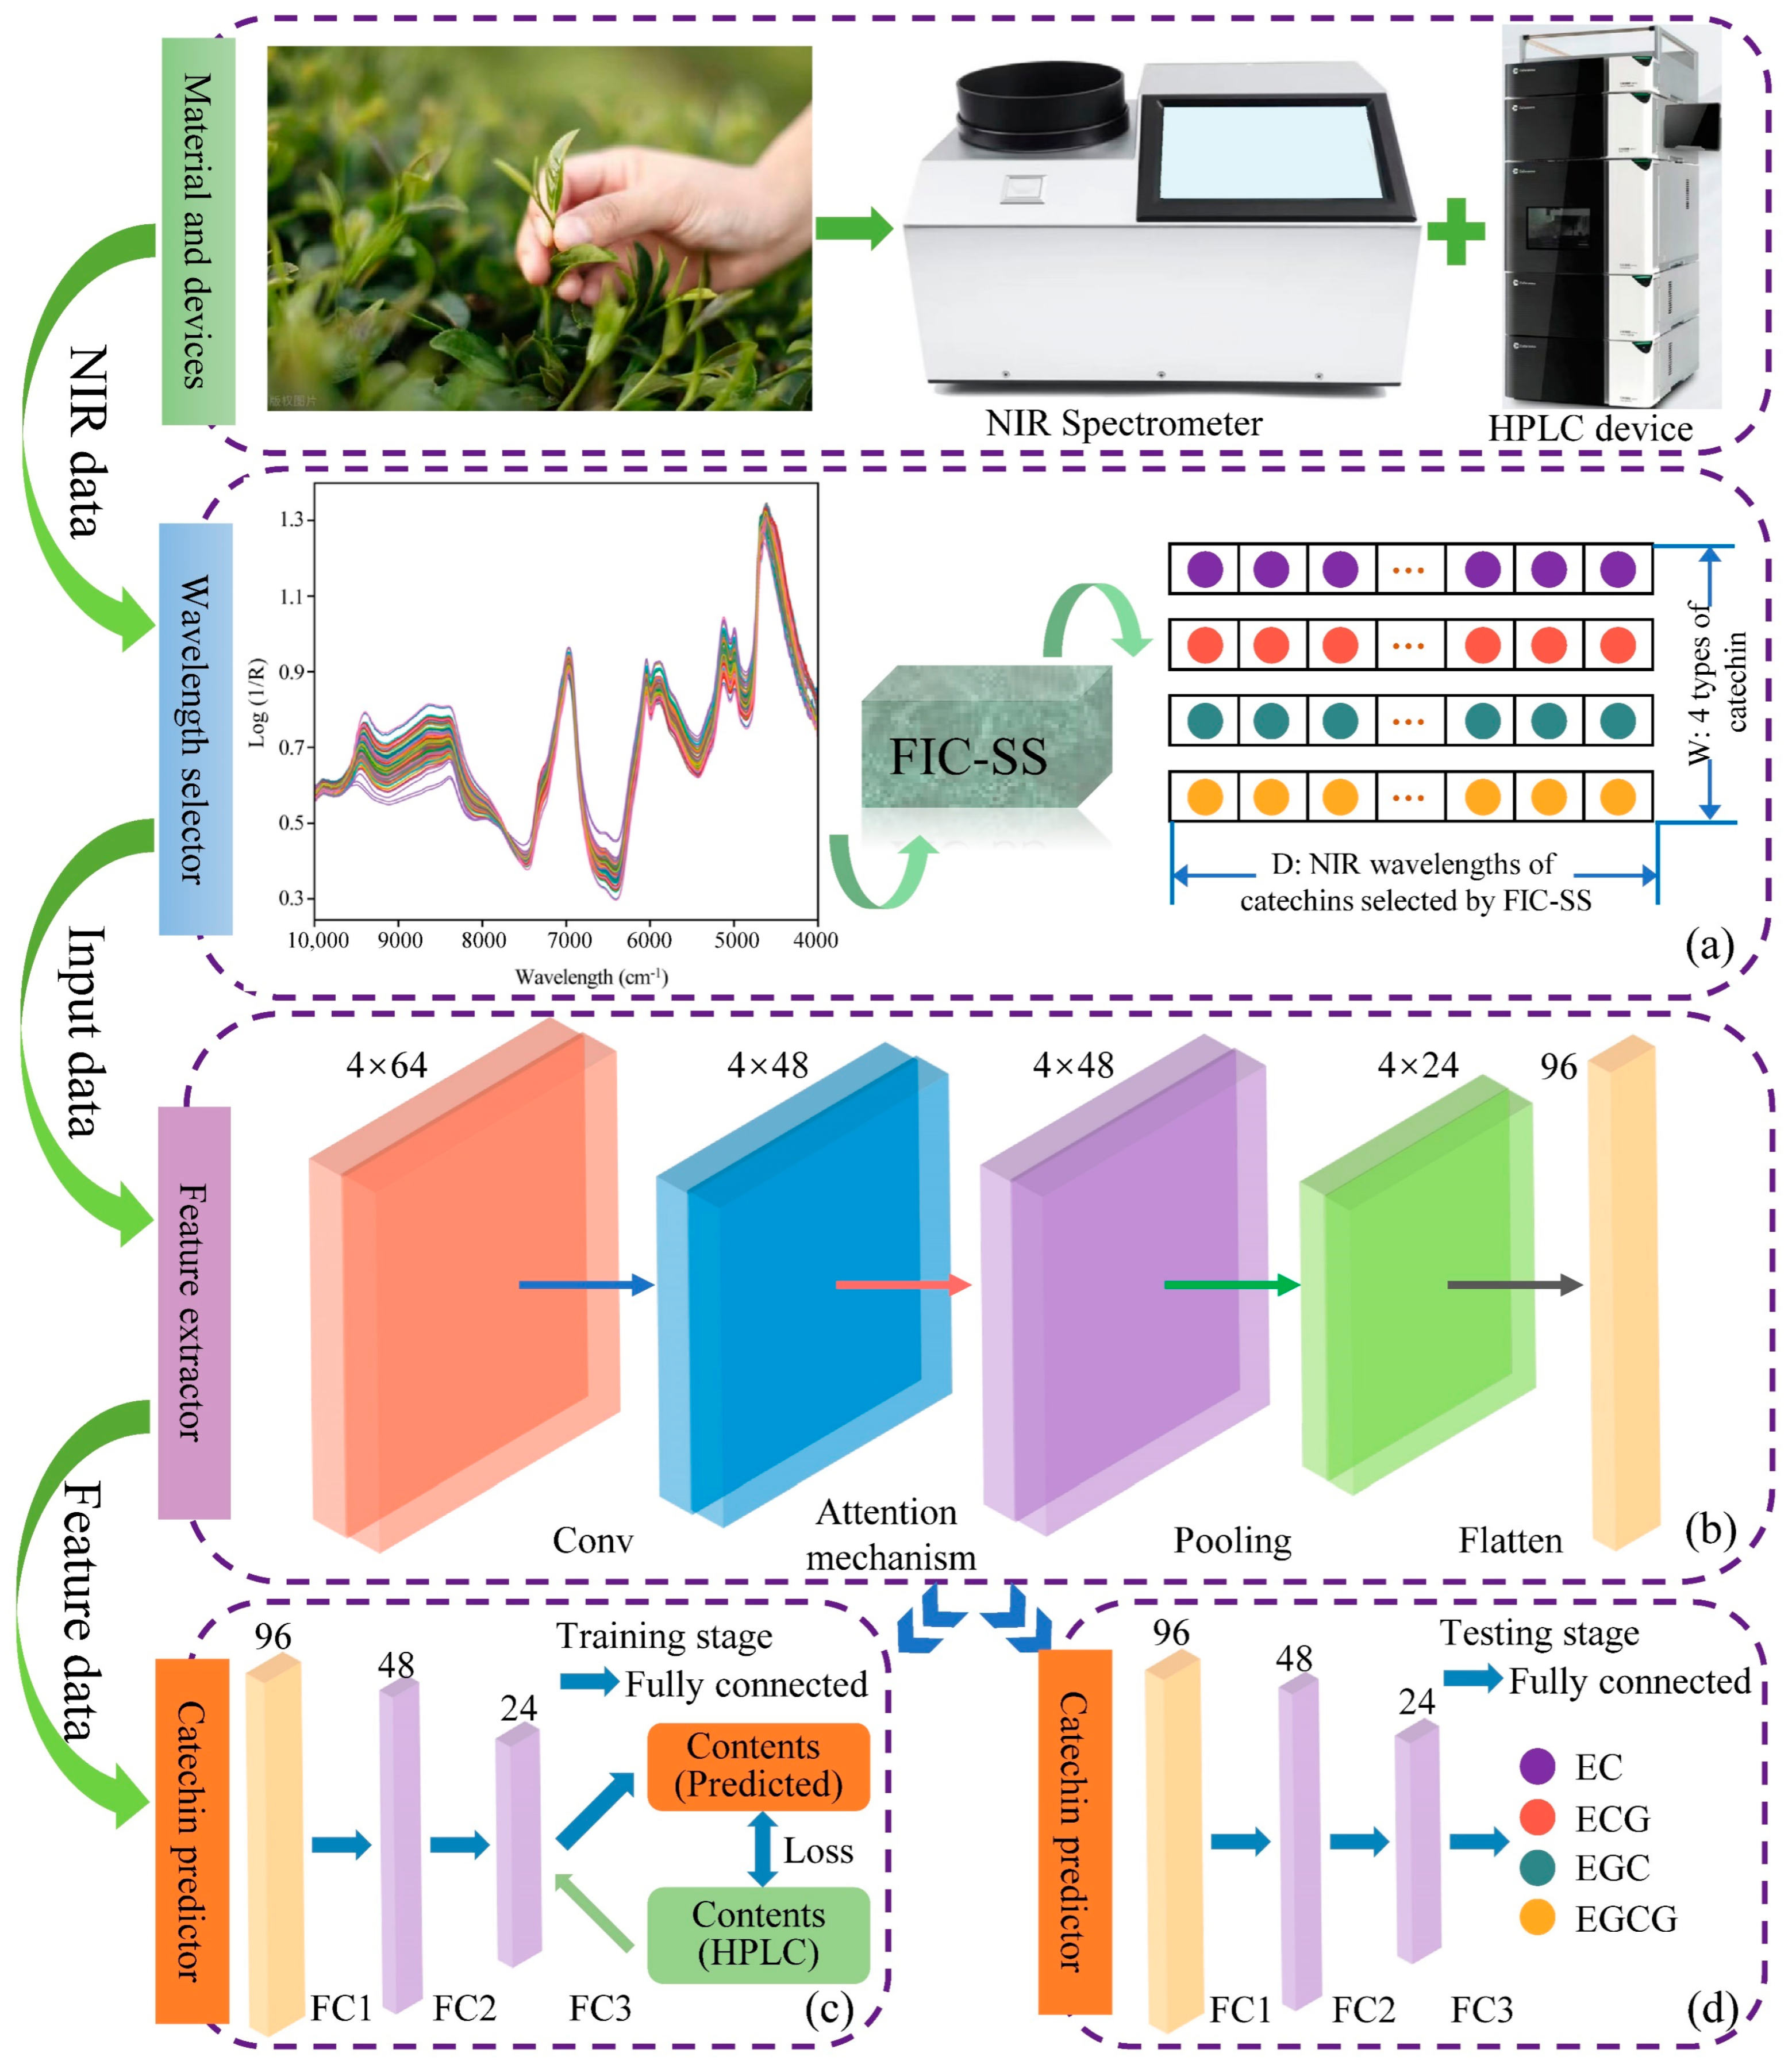
Figure 1 depicts the detailed architecture of our proposed FICSS-CNN-CSAM model for predicting the content of four catechins in fresh black tea. The FICSS-CNN-CSAM model comprises four modules: a NIRS wavelength selector, a feature extractor, a channel and spatial attention mechanism, and a catechin content predictor.

Figure 1.
The flow chart of the proposed model for predicting the content of black tea catechins. (a) represents the process of wavelength variable selection, (b) provides the framework of the feature extractor, (c) depicts the training process of the predictor, and (d) shows the predictor simultaneously predicting the content of the four catechins.
3.1. The Wavelength Variable Selector
Due to the substantial overlap in the spectral information of EC, ECG, EGC, and EGCG stemming from their similar chemical compositions, significant nonlinear relationships arise. The entire spectrum comprises 3100 wavelength variables, many of which contain redundant non-feature information. Therefore, before establishing a prediction model for catechin content, it is necessary to perform feature engineering on the spectral data. In this study, we used a wavelength variable selection method termed FICSS (feature interval combination sensitivity segmentation) [16].
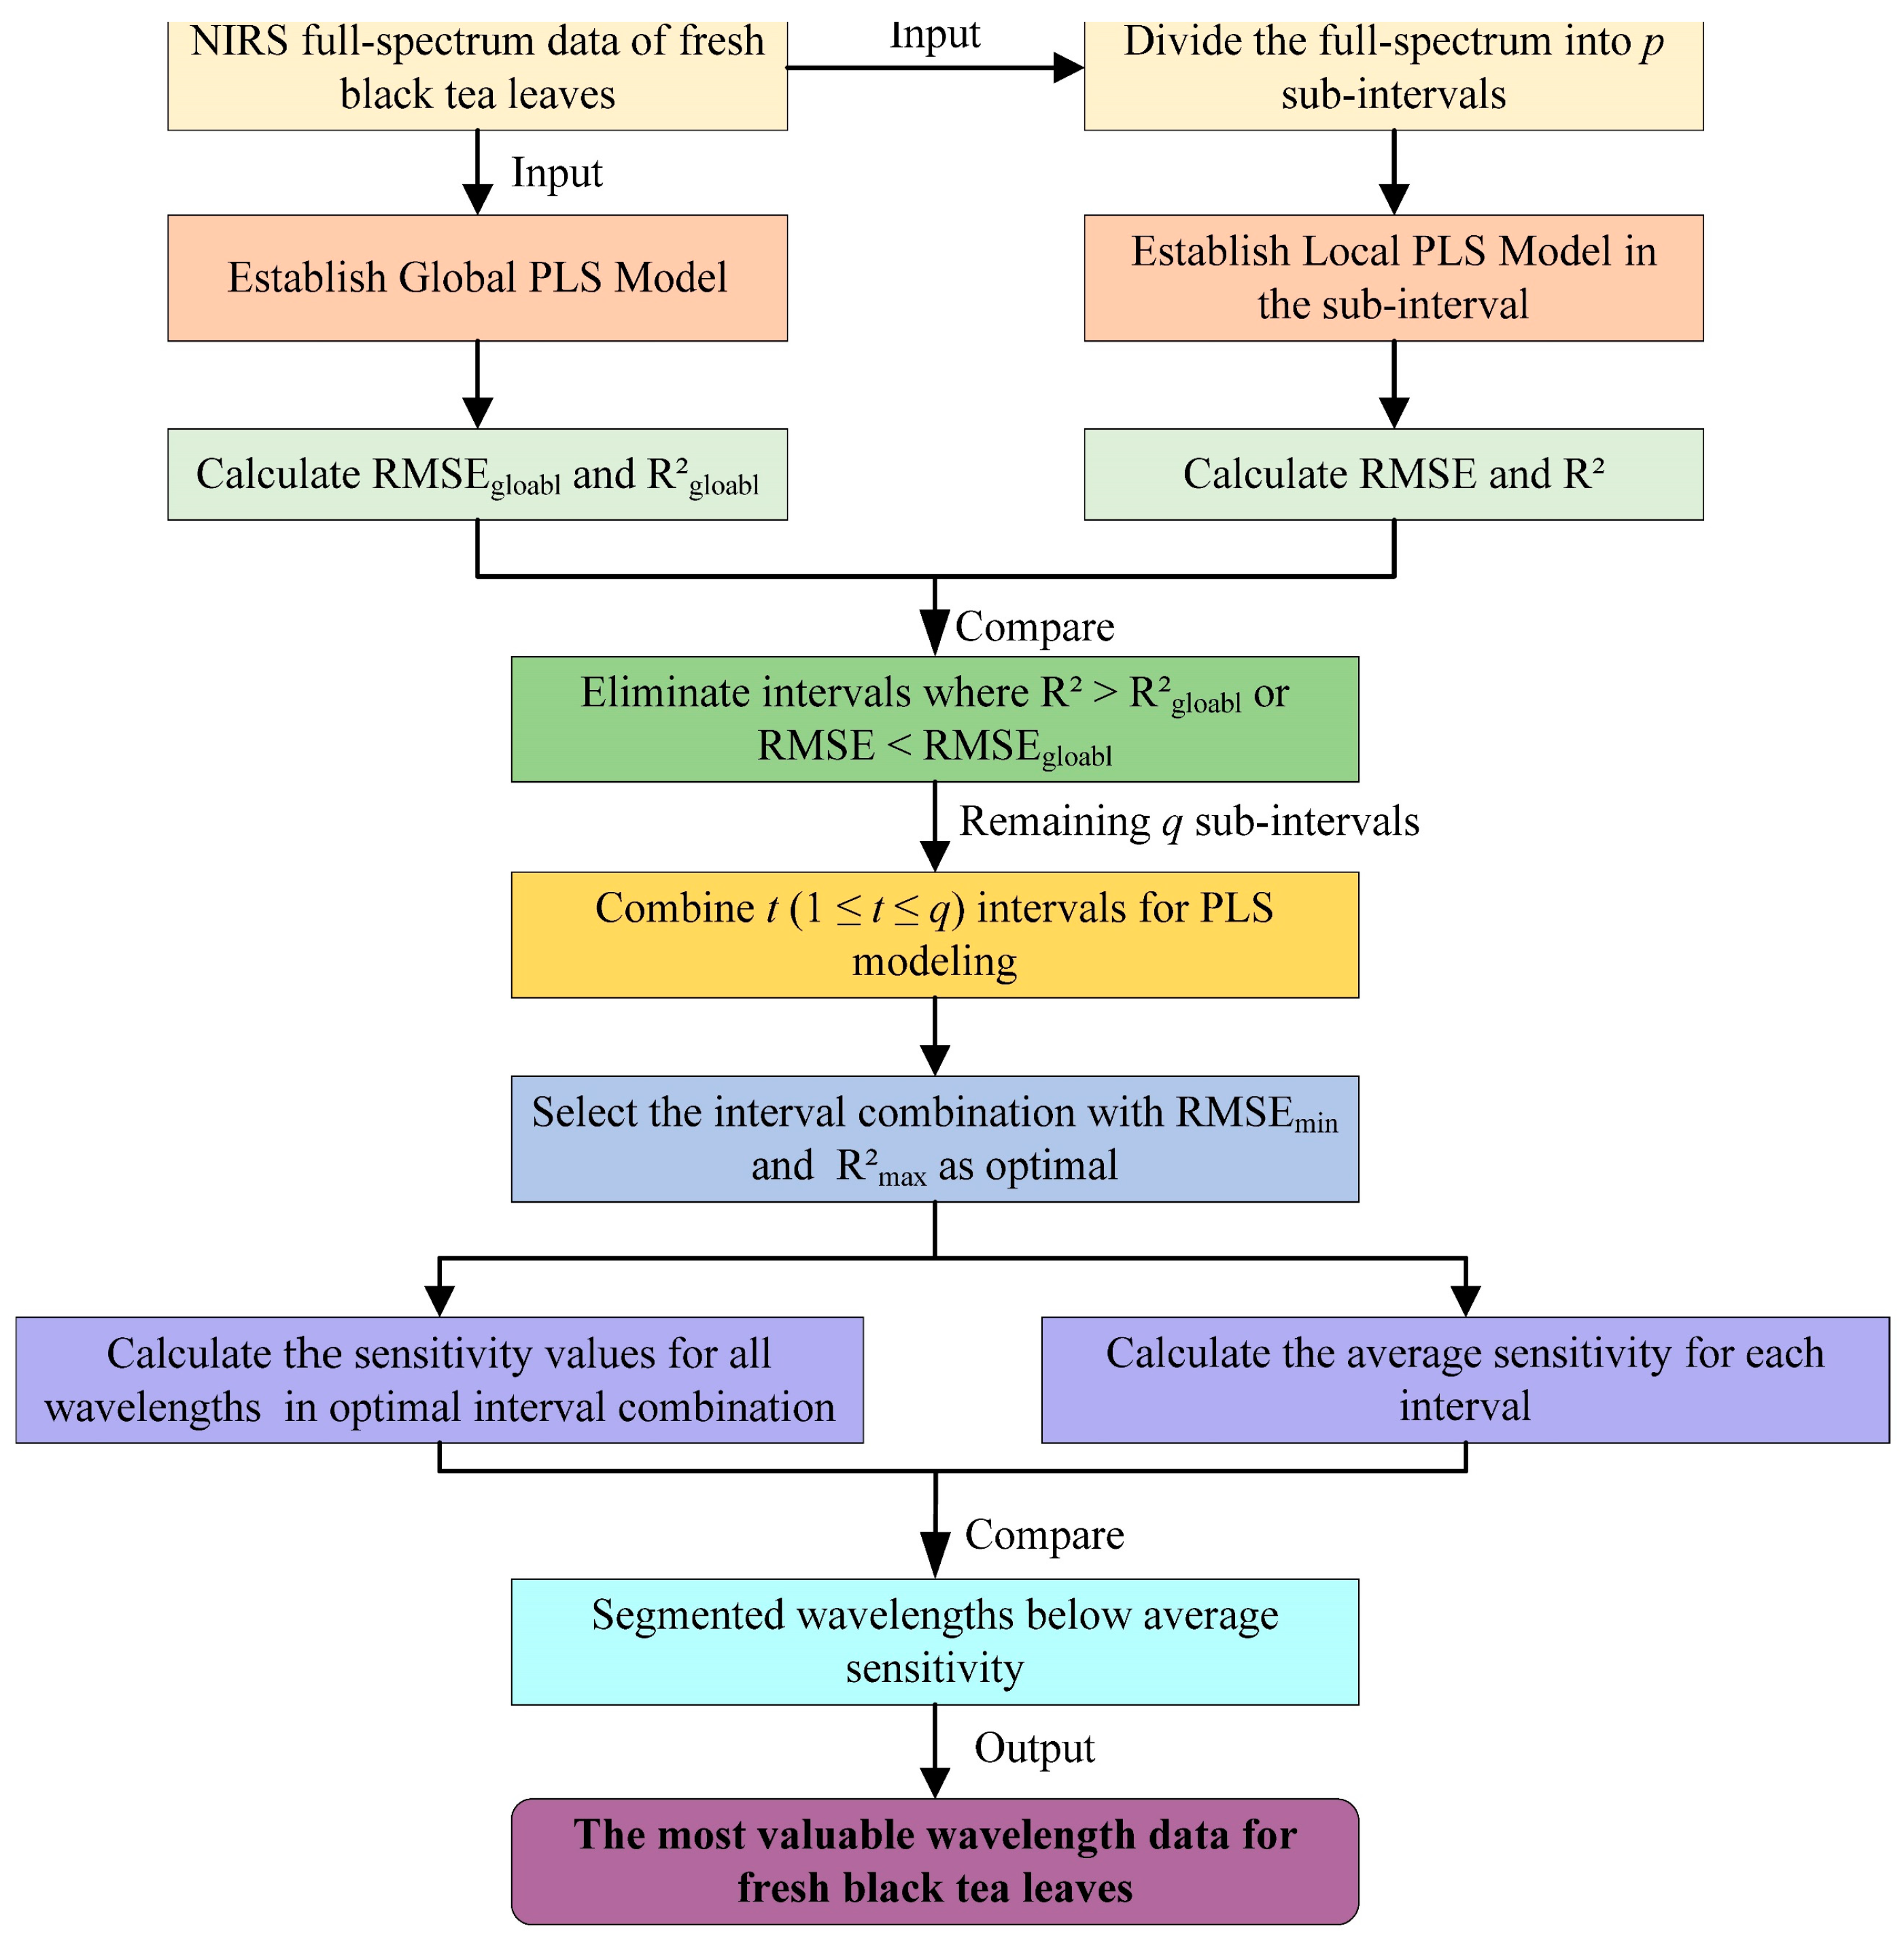
FICSS initially partitions and combines the wavelength variables, utilizing the root mean square error (RMSE) and determination coefficient (R2) as criteria to identify the characteristic wavelength intervals for each component to be measured. Subsequently, sensitivity factors are introduced to swiftly eliminate mis-selected wavelengths resulting from evenly partitioned intervals. FICSS achieves a rapid elimination of mis-selected wavelength variables, thereby enhancing the precision of wavelength variable selection. The algorithm’s detailed steps are illustrated in Figure 2.
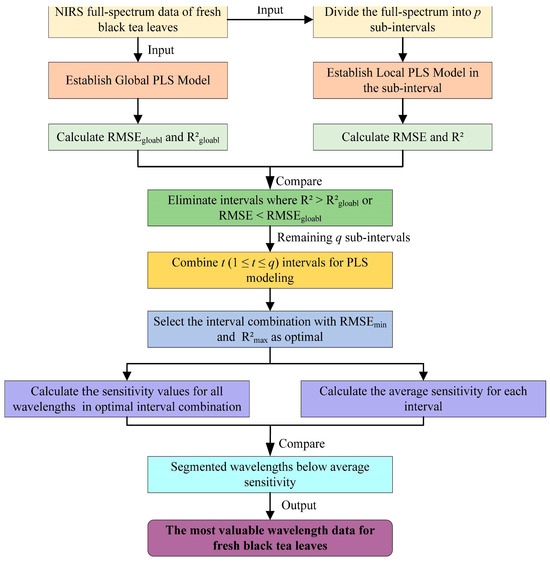
Figure 2.
The details of the FICSS method as a NIRS wavelength selector.
3.2. The NIRS Feature Extractor
In this study, a shallow CNN is utilized in conjunction with the channel and spatial attention mechanism (CSAM) for the NIRS feature extraction. Embedding the CSAM enhances the ability of the CNN to recognize more important features while filtering out the meaningless ones.
The NIRS feature extractor includes convolutional layers, a CSAM layer, pooling layers, and a flattening layer, as shown in Figure 2. The output of the second convolutional layer is processed by the CSAM layer. The features extracted are then converted into a 1D vector through a flattening layer, making them suitable for input into the catechin predictor. More specifics about the NIRS feature extractor are provided in Table 1.

Table 1.
The structure parameters of the proposed CNN model.
3.3. The Attention Mechanisms
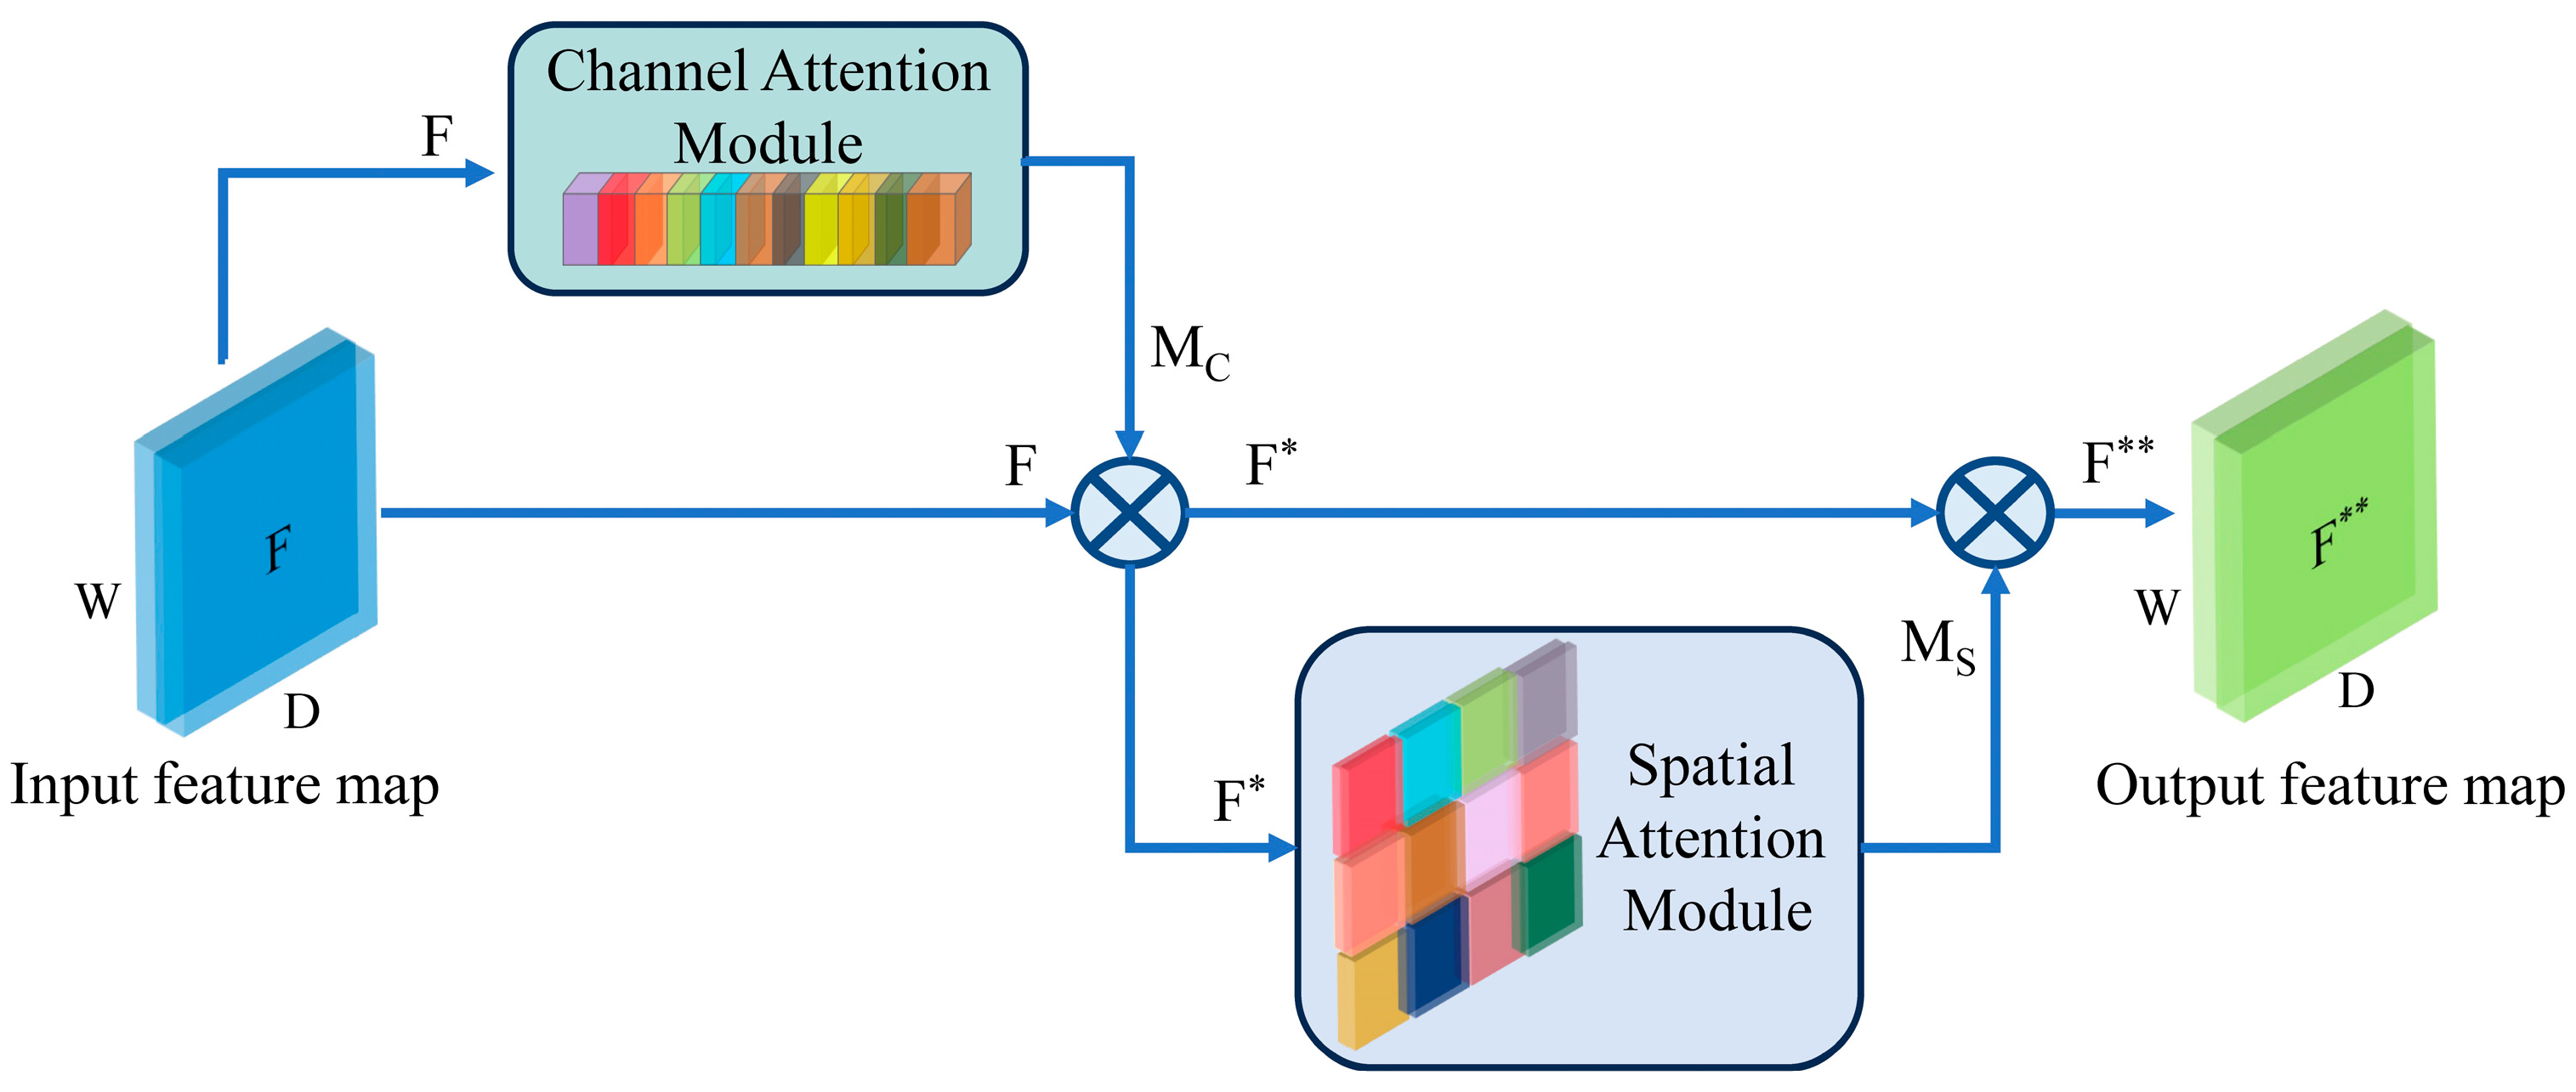
The CSAM used in this study is depicted in Figure 3 and consists of two parts: a channel attention module and a spatial attention module.
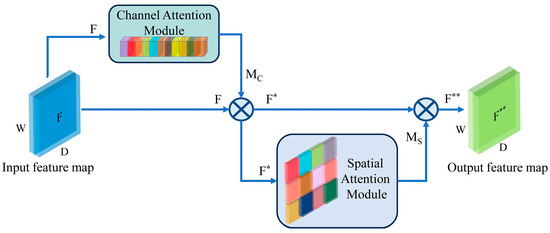
Figure 3.
The structure of the CSAM proposed in this study. The size of the input feature F is W × D, where W is the number of catechin types and D is the number of NIRS wavelength variables; F* is a feature map generated by the CAM; F** is a feature map generated by the SAM.
Within the feature extractor, the channel attention module (CAM) exploits the unique channel structure of the CNN to adjust the amount of catechin content information acquired from each channel in the input feature [27]. Meanwhile, the spatial attention module (SAM) adjusts the significance of the catechin content information across various regions within each channel of the input feature [28]. This combined approach enables the feature extractor to effectively focus on the information that is pertinent to catechin content and discard any extraneous data. Indeed, the CSAM optimizes the feature extraction process, thereby enhancing the accuracy and effectiveness of predicting black tea catechin content.
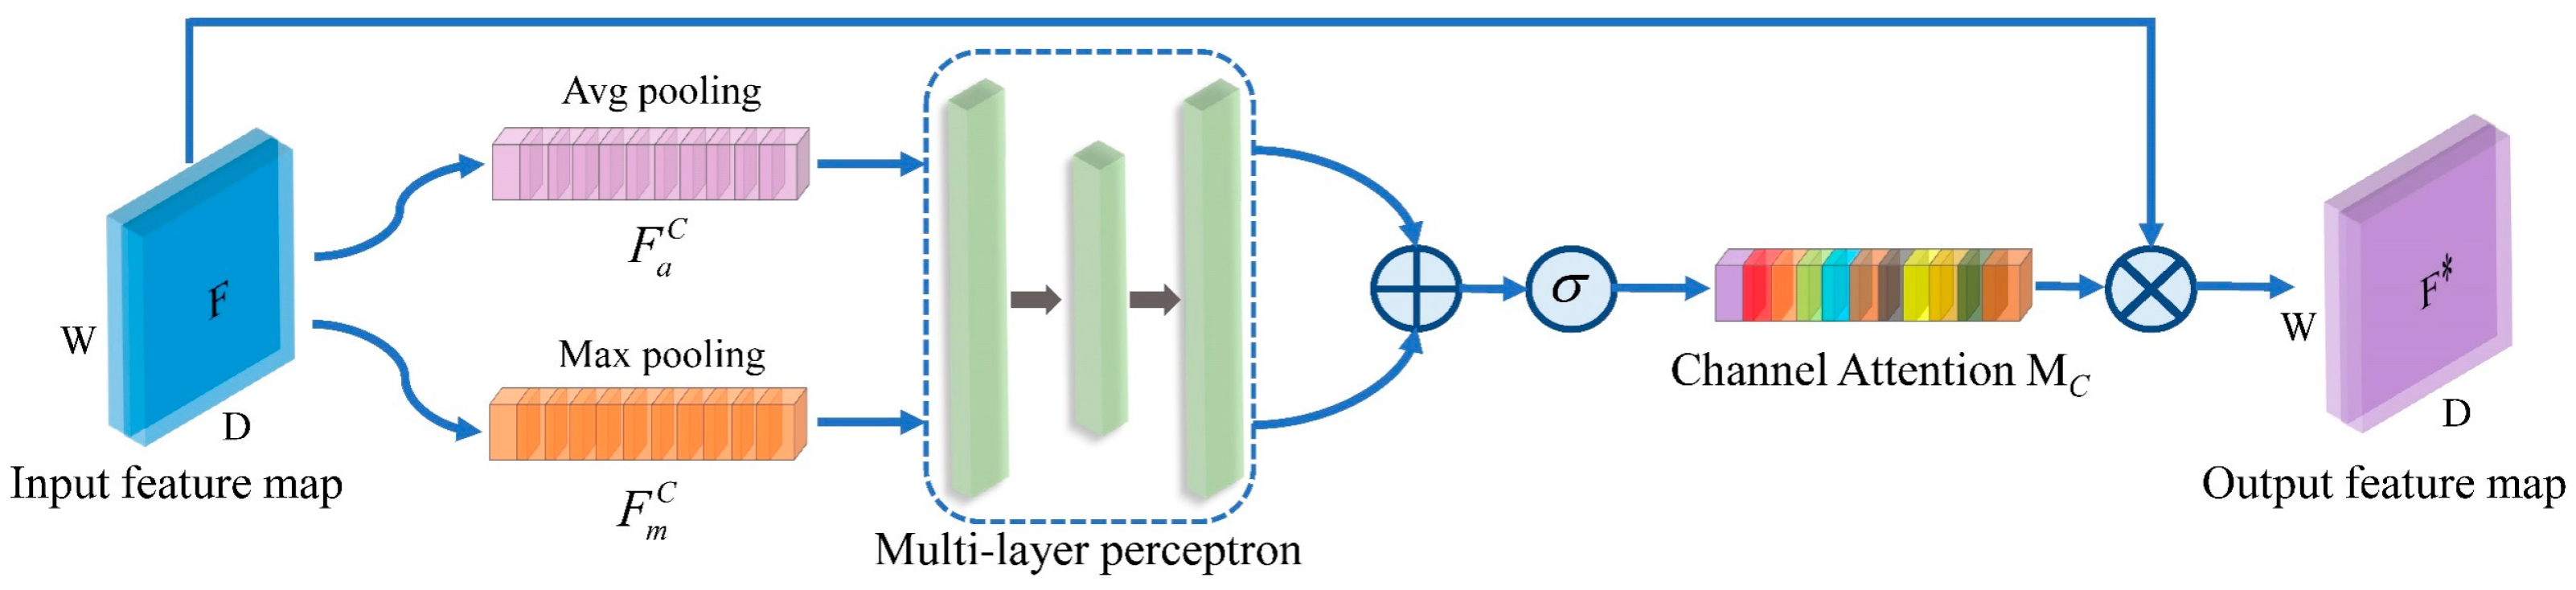
3.3.1. The Channel Attention Module
The detailed structure of the CAM is shown in Figure 4. When the feature map is passed to the CAM, first, the spatial information of each channel in is condensed through a max pooling and average pooling, respectively, to generate two 1D feature vectors: and .
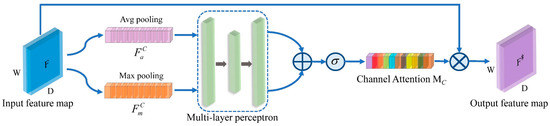
Figure 4.
The framework diagram of the CAM.
Next, the two 1D feature vectors are separately input into a multi-layer perceptron (MLP) to calculate the attention weights for each channel. Finally, by adding the computed weights and normalizing them to the range [0, 1] using a sigmoid function, the channel attention map is obtained. The operation of the CAM on the input NIRS features can be represented by the following equation:
where is the MLP, is the max pooling, and is the average pooling.
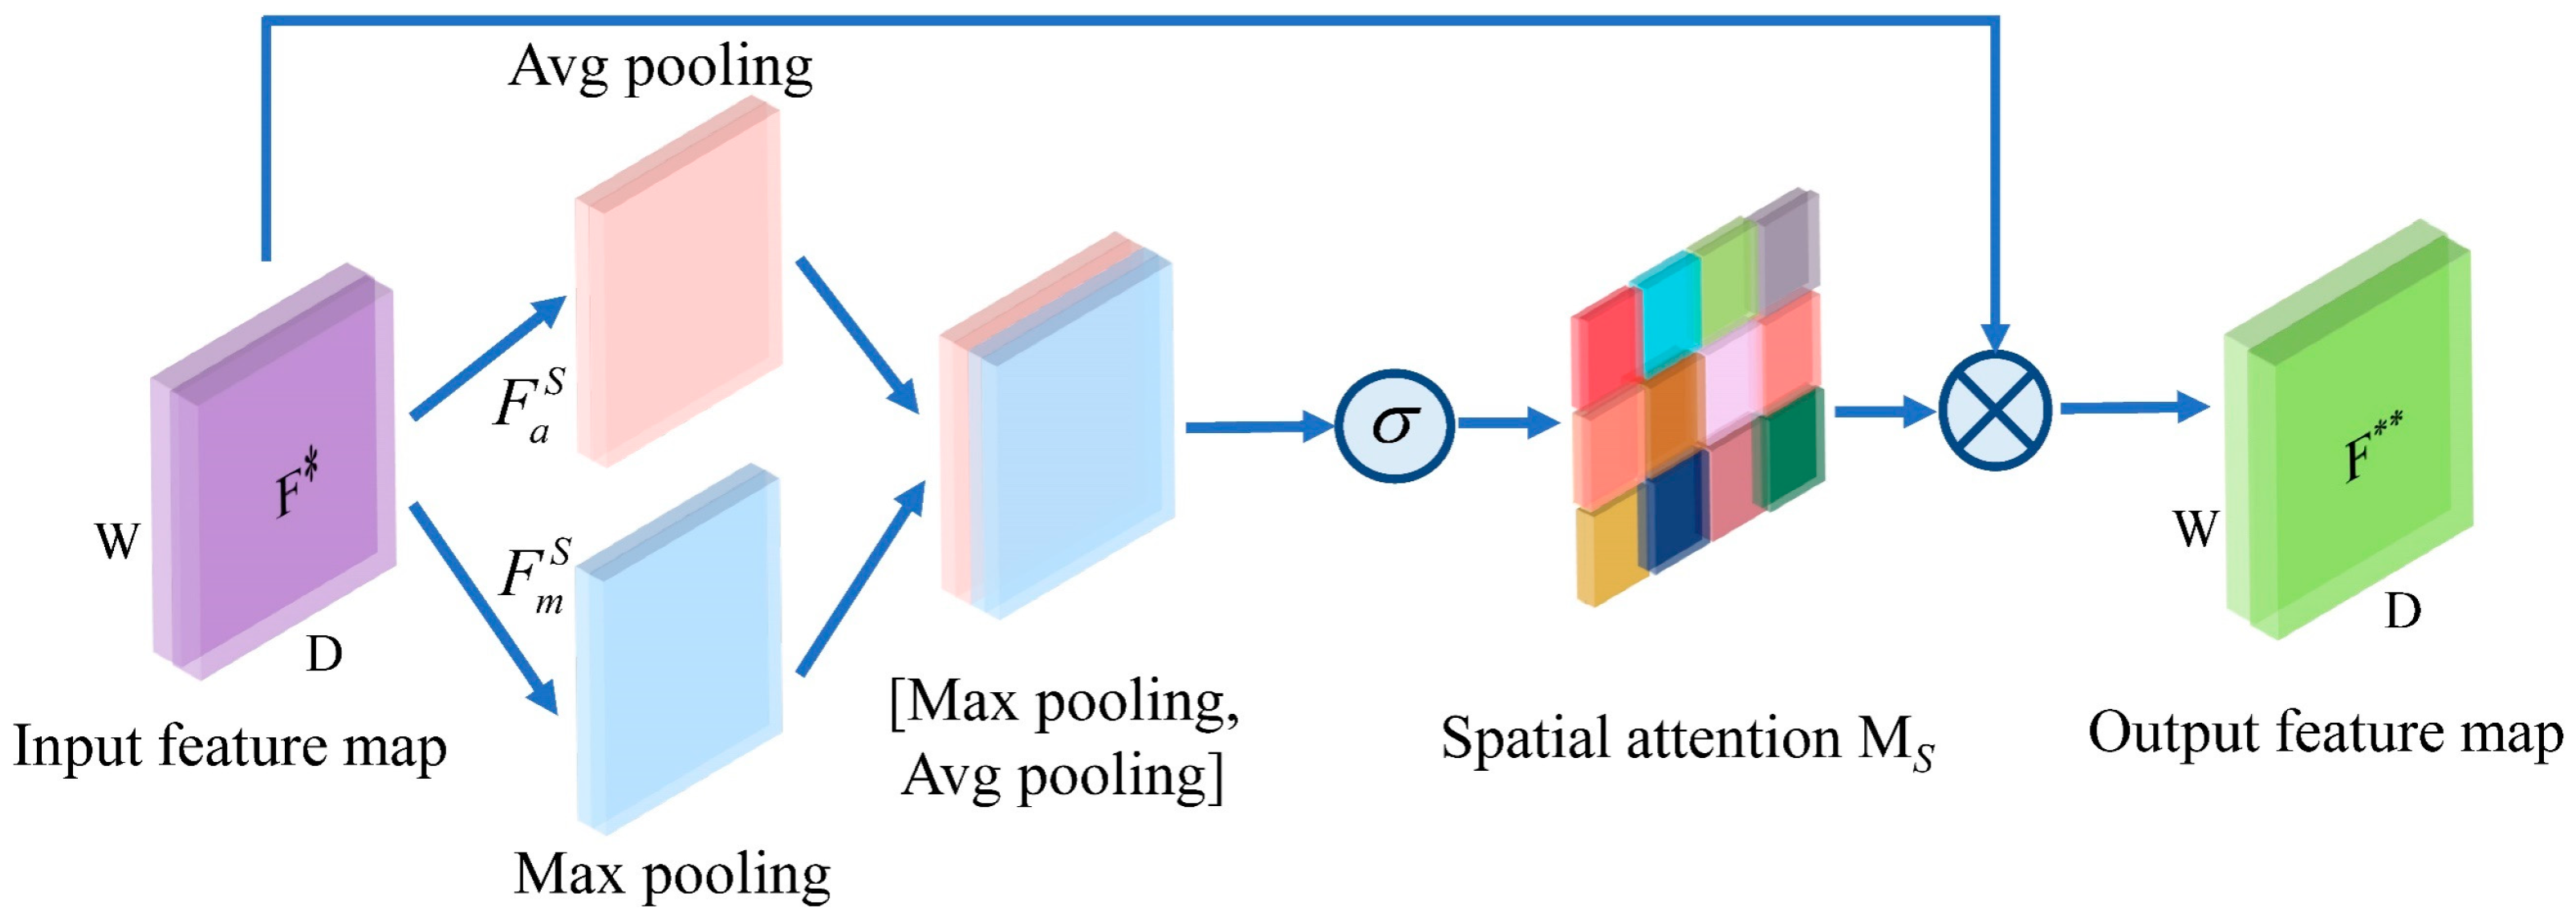
3.3.2. The Spatial Attention Module
The detailed structure of the SAM is shown in Figure 5. First, the SAM receives the feature map output by the CAM, and generates the 2D feature vectors and in the spatial dimension through a max pooling and average pooling, respectively.
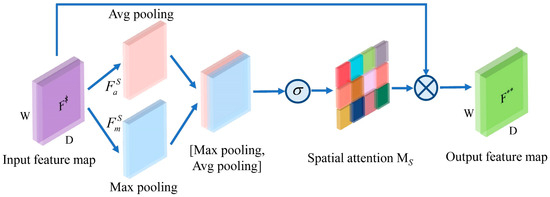
Figure 5.
The details of the SAM.
Next, the two concatenated feature vectors are input into a 2D convolutional layer to calculate the weights for each region in the feature map. Finally, the computed weights are normalized to the range [0, 1] using a sigmoid function, generating the final spatial attention feature map . The operation of the SAM on the input NIRS features can be represented by the following equation:
where represents sigmoid function, represents a feature map concatenation, and is the convolutional operation.
3.4. The Catechin Content Predictor
In this study, fully connected (FC) layers were utilized to build the catechin content predictor. This predictor estimates catechin content using the feature vectors from the feature extractor. During training, the RMSE was used as the loss function to quantify the difference between the predicted and actual values. By minimizing this loss, the predictor continuously updates its weights, ultimately achieving an optimal set. In the testing phase, the predictor with optimal weights directly estimates the content of four catechins in black tea leaves. The catechin content predictor consists of three FC layers. Dropout regularization was applied during the training to reduce overfitting and ensure the model’s generalizability. The specific structure is depicted in Figure 1d.
3.5. The Performance Evaluation
The commonly used metrics for evaluating the performance of a FICSS-CNN-CSAM model in predicting catechin content are R2 and the RMSE. The normal value range of R2 is [0, 1]. The closer it is to 1, the stronger the estimation ability of the model. The calculation formulas for R2 and the RMSE are as follows:
4. Results and Discussion
To verify the predictive performance of the proposed method for catechin content, we conducted the following four experiments: catechin content prediction with different models of full-spectrum data; wavelength selection based on FICSS; the simultaneous prediction of catechin content with various deep learning models; and an attention mechanism ablation experiment. These four experiments comprehensively and objectively demonstrate the effectiveness of the FICSS algorithm in spectral feature extraction, the CSAM in enhancing the prediction accuracy of simultaneous predictions of four catechins, and the superior performance of the FICSS-CNN-CSAM model, compared to other chemometric and existing deep learning models for predicting catechin content.
4.1. Catechin Content Prediction with Different Models of Full-Spectrum Data
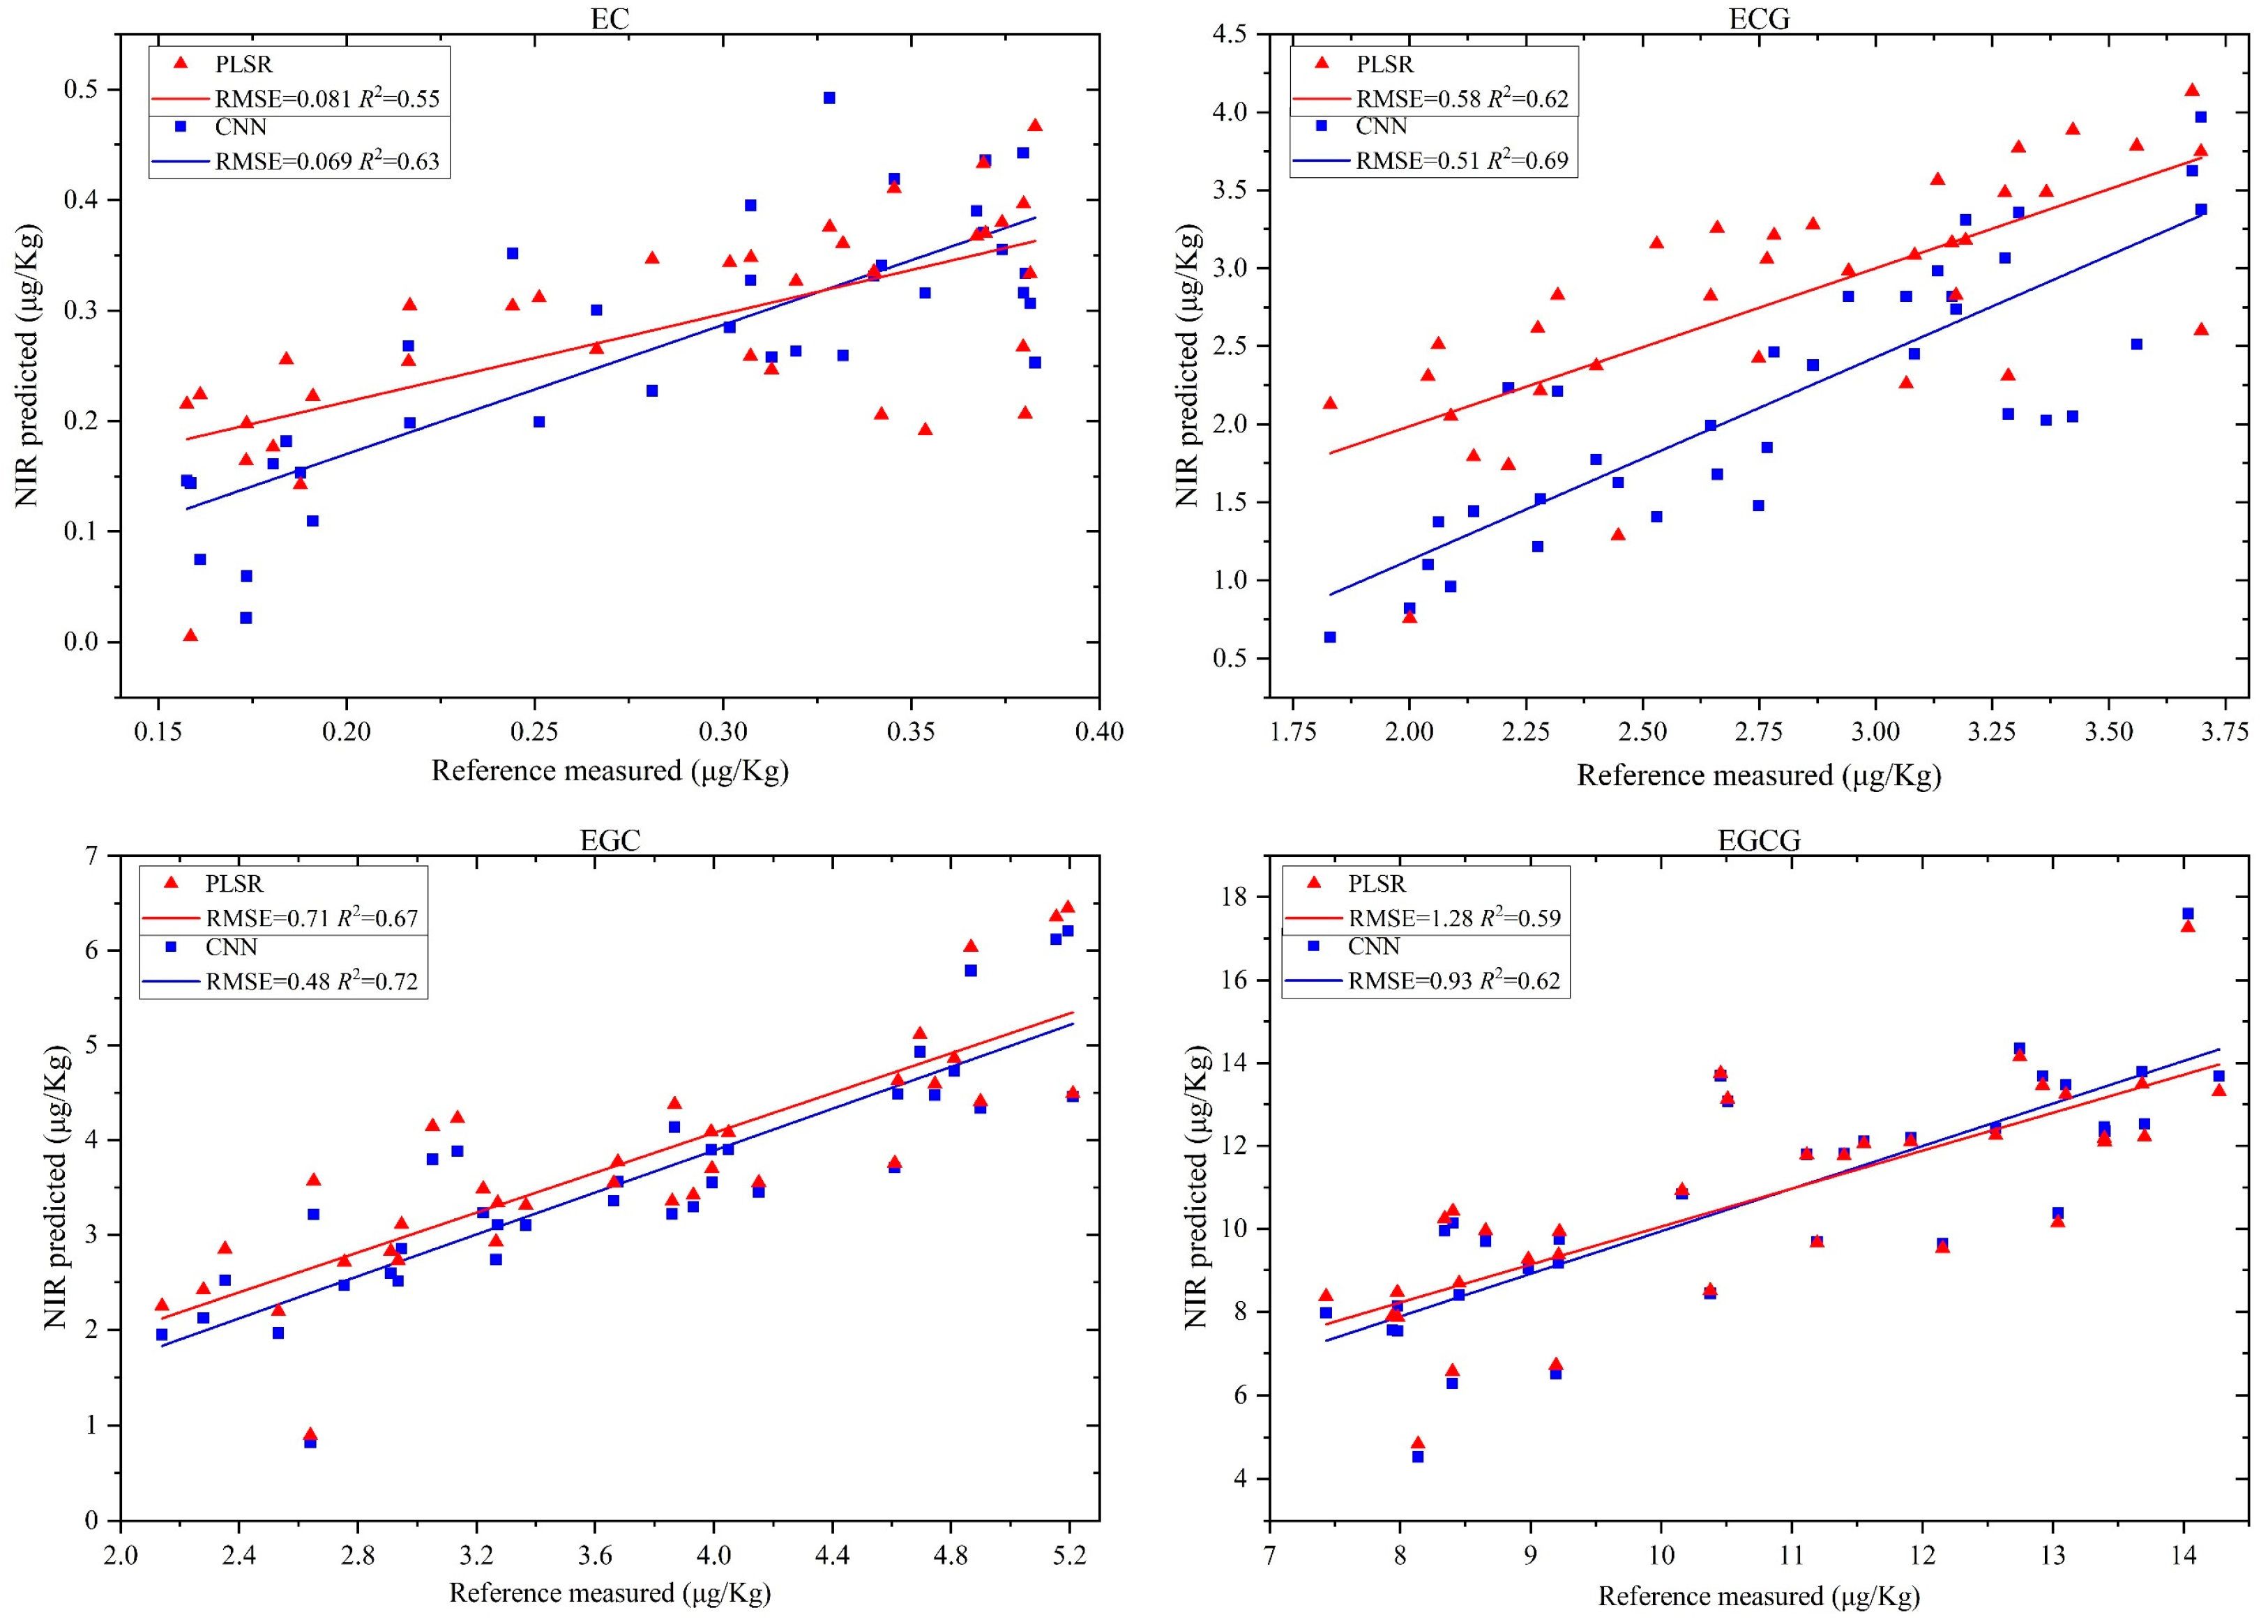
Due to the similar physical and chemical properties of different types of catechins in tea leaves, their respective near-infrared spectral features significantly overlap, greatly reducing the prediction accuracy of chemometric models. Fortunately, some studies have preliminarily addressed this issue by leveraging the powerful feature extraction capabilities of deep learning models and harnessing their inherent advantages in nonlinear mapping for multi-input and multi-output scenarios. This study conducted a comparative experiment on the simultaneous prediction performance of four catechins in black tea using the CNN (the structure is illustrated in Figure 1c) and PLSR models. Figure 6 shows the prediction results of the content of four catechins in black tea using the PLSR and CNN models.
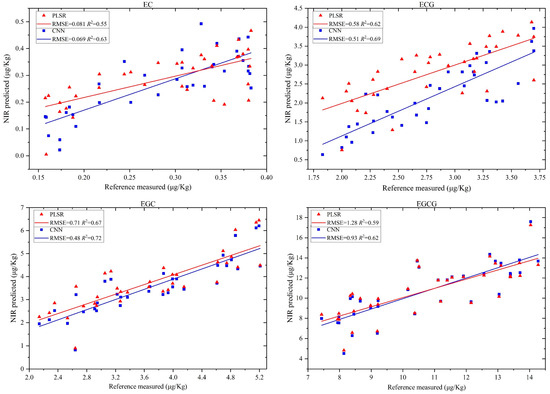
Figure 6.
The prediction results of black tea catechins based on full-spectrum data using the PLSR and CNN models.
From Figure 6, it is evident that, compared to the PLSR, the CNN achieved the highest prediction accuracy for the contents of EC, ECG, EGC, and EGCG, respectively. Compared to the PLSR, for the EC catechin, the CNN improved R2 and the RMSE by 12.70% and 14.81%, respectively; for the ECG catechin, the CNN’s R2 and RMSE improved by 10.14% and 12.06%; for the EGC catechin, the improvements in R2 and the RMSE were 6.94% and 32.39%; for the EGCG catechin, the CNN’s R2 and RMSE improved by 4.84% and 27.34%. This improvement is primarily attributed to the CNN model’s ability to capture complex nonlinear relationships in the spectral data, which are often missed by linear models, like the PLSR. Additionally, we can observe that the average R2 values predicted by the PLSR and the CNN for four types of catechins simultaneously are 0.61 and 0.67, respectively, which only increased by 8.96% and is not a satisfactory result. This is because the sample size and input data dimensions have a much greater impact on the prediction performance of the CNN model compared to the PLSR. In this experiment, the full-spectrum data of black tea leaves were used, with 1500 wavelength variables, while the training sample size was only 65. Even under such unfavorable conditions, the CNN model still demonstrated a significant advantage compared to the PLSR model. Additionally, this indicates that wavelength selection is crucial for further improving the performance of the CNN.
4.2. Wavelength Selection Based on the FICSS Algorithm
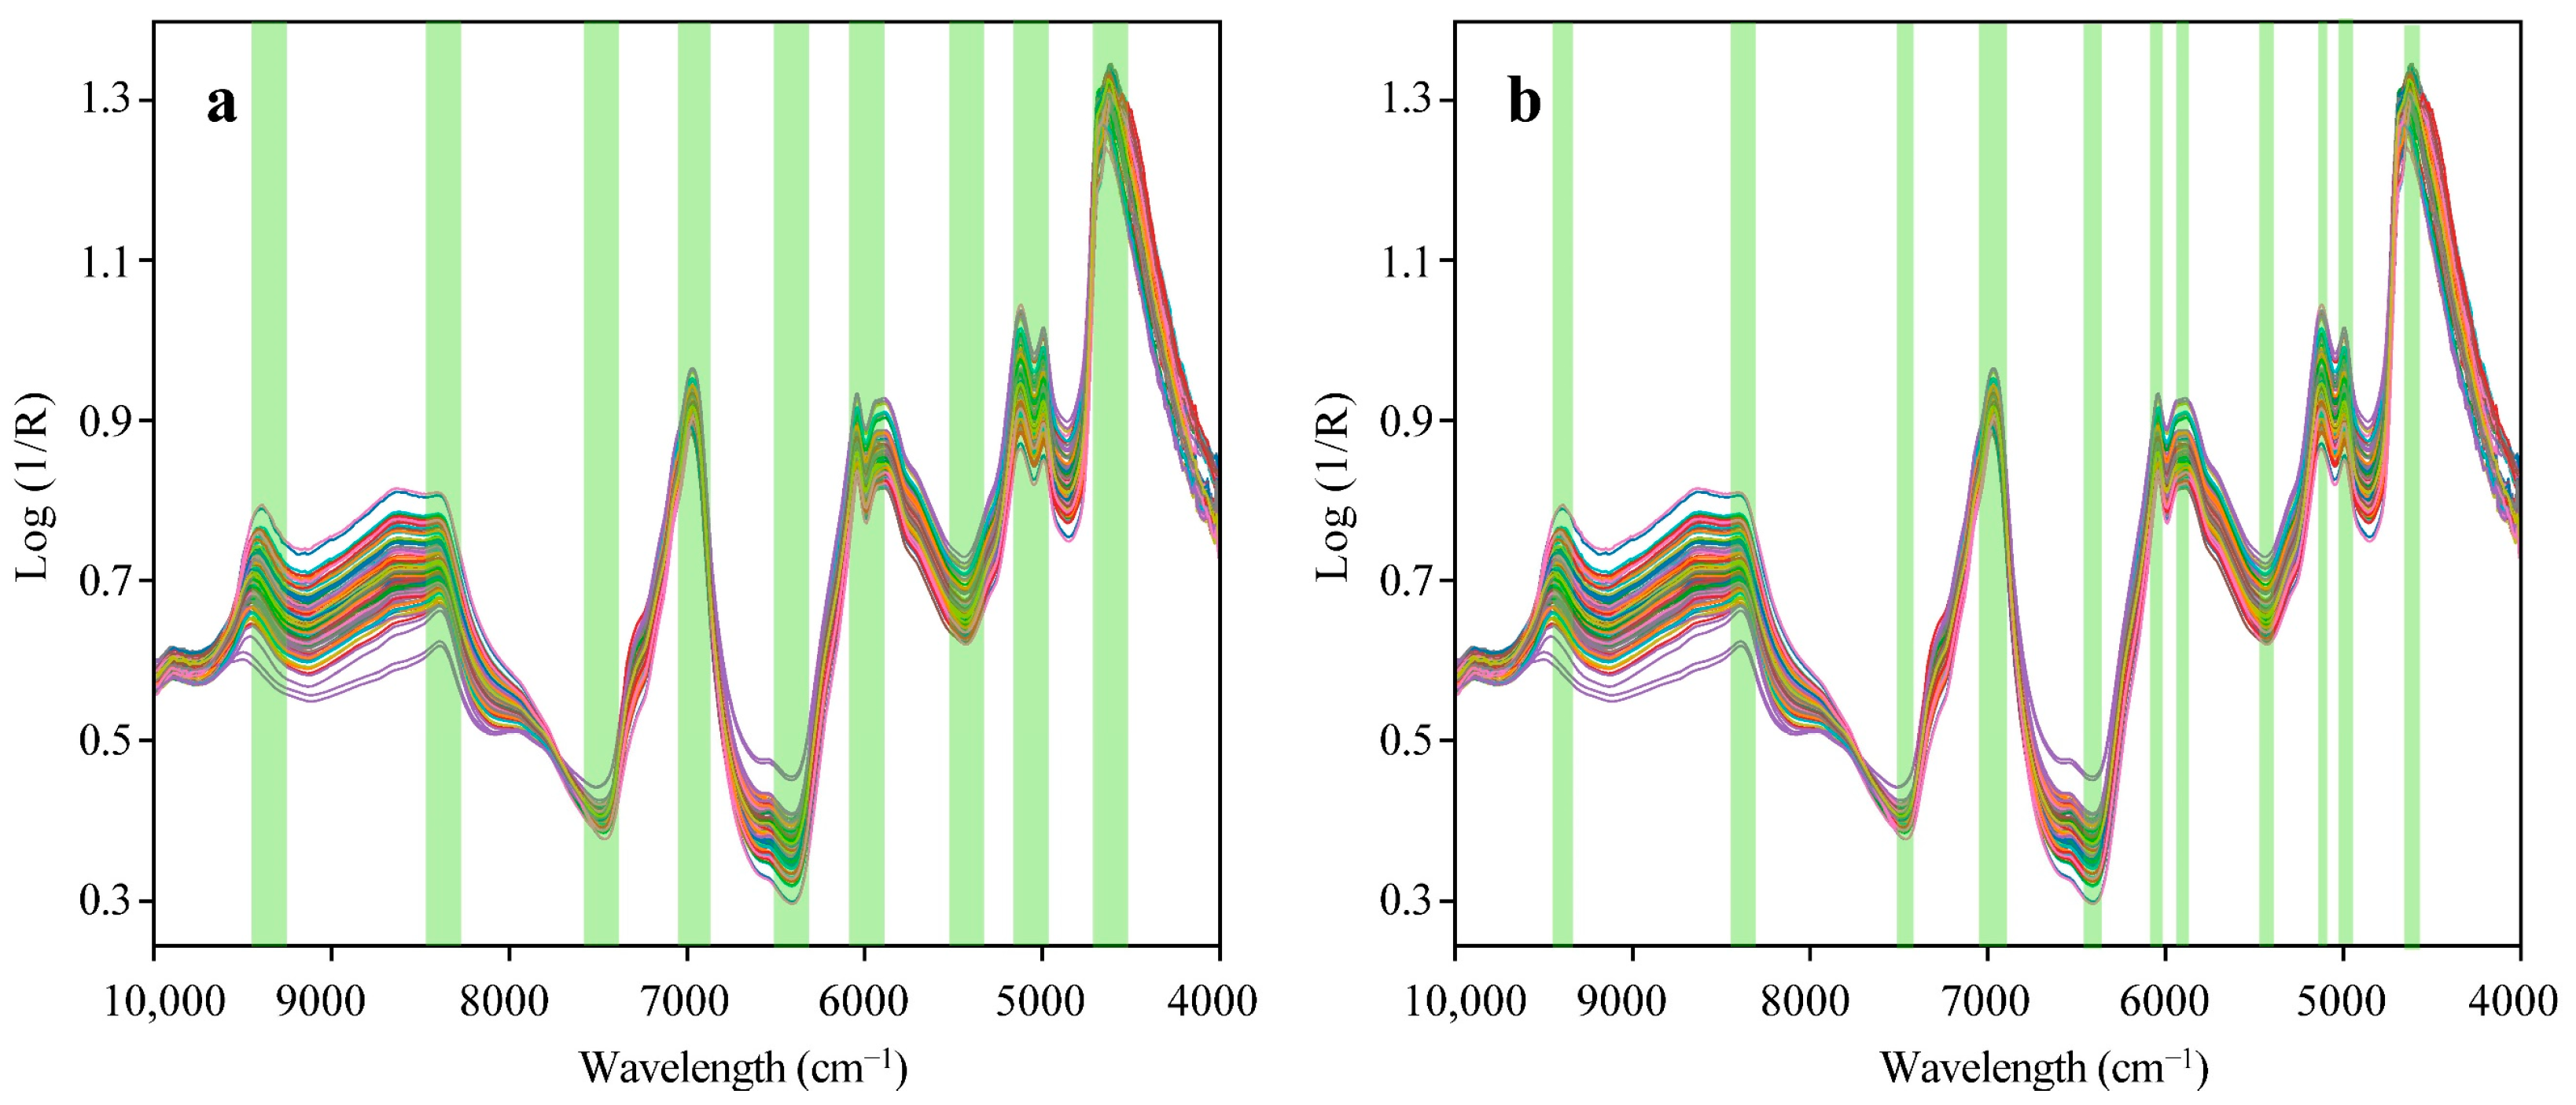
Wavelength selection not only enhances the stability of the model but also makes the model more parsimonious. The wavelength selector proposed in this study is based on the FICSS algorithm, and the selection process consists of two steps. The first step is feature interval combination (FIC), and the second step is sensitivity factor segmentation (SS). FICSS is used to select wavelength variables from the full-spectrum data that are the most independently expressive of the four black tea catechins (EC, ECG, EGC, EGCG). This provides stable and high-quality input data for the subsequent deep learning models. Following the steps in Figure 2, the full-spectrum data is evenly divided into 20 sub-intervals, and a PLSR model is established and predicted for each sub-interval. The RMSE values for each interval are obtained, and the average RMSE value for each interval is used as the threshold for feature interval combination. Sub-intervals with RMSE values greater than the threshold are eliminated and the remaining sub-intervals are combined to the optimal interval combination.
Subsequently, sensitivity factors are introduced based on these combined feature intervals, and the average sensitivity factor for the optimal combination interval is computed as the segmentation value. The wavelength variables with sensitivity factors below the threshold are segmented and adjusted. The process of selecting the wavelength variables for black tea NIRS using the FICSS algorithm is illustrated in Figure 7. When comparing the wavelength selection results in Figure 7a,b, it was observed that sensitivity segmentation effectively eliminated the wavelengths mistakenly selected in the FIC method due to uniform partitioning.
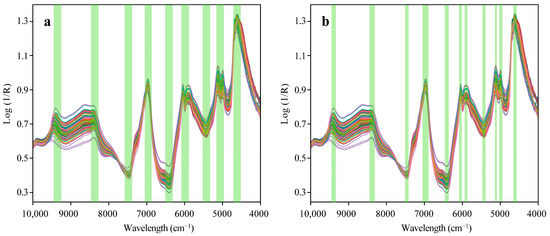
Figure 7.
The optimal feature wavelength intervals and variables extracted by four feature wavelength selection algorithms. (a) FIC; (b) FICSS.
As shown in Figure 7, the FICSS selected a total of 64 wavelength variables, while the FIC selected 115 variables. The FICSS reduced the number of wavelength variables by 44.35%, significantly reducing the model’s computational complexity and information redundancy. Additionally, compared to the wavelength variables selected by the FIC, the PLSR model, established based on the wavelength variables chosen by FICSS, achieved an average R2 value of 0.73 for the prediction of the four catechins, representing an 8.22% improvement. Moreover, according to the RMSE values, the FICSS consistently outperformed the FIC method in terms of prediction performance.
The FICSS algorithm optimizes this process by retaining the most informative spectral features. This results in a more parsimonious and stable model, as the reduction in the wavelength variables decreases the model’s computational complexity and reduces the risk of overfitting. The targeted selection of wavelengths leads to higher-quality input data, which improves the model’s predictive accuracy for catechin content, with an 8.22% improvement in the R2 values compared to the FIC method. Additionally, FICSS effectively eliminates any irrelevant wavelengths, reducing noise and increasing the signal–to–noise ratio, thus enhancing the model’s robustness. By providing high-quality data, FICSS supports efficient learning and generalization in the overall model, further boosting overall performance.
4.3. The Simultaneous Prediction of Catechin Content with Various Deep Learning Models
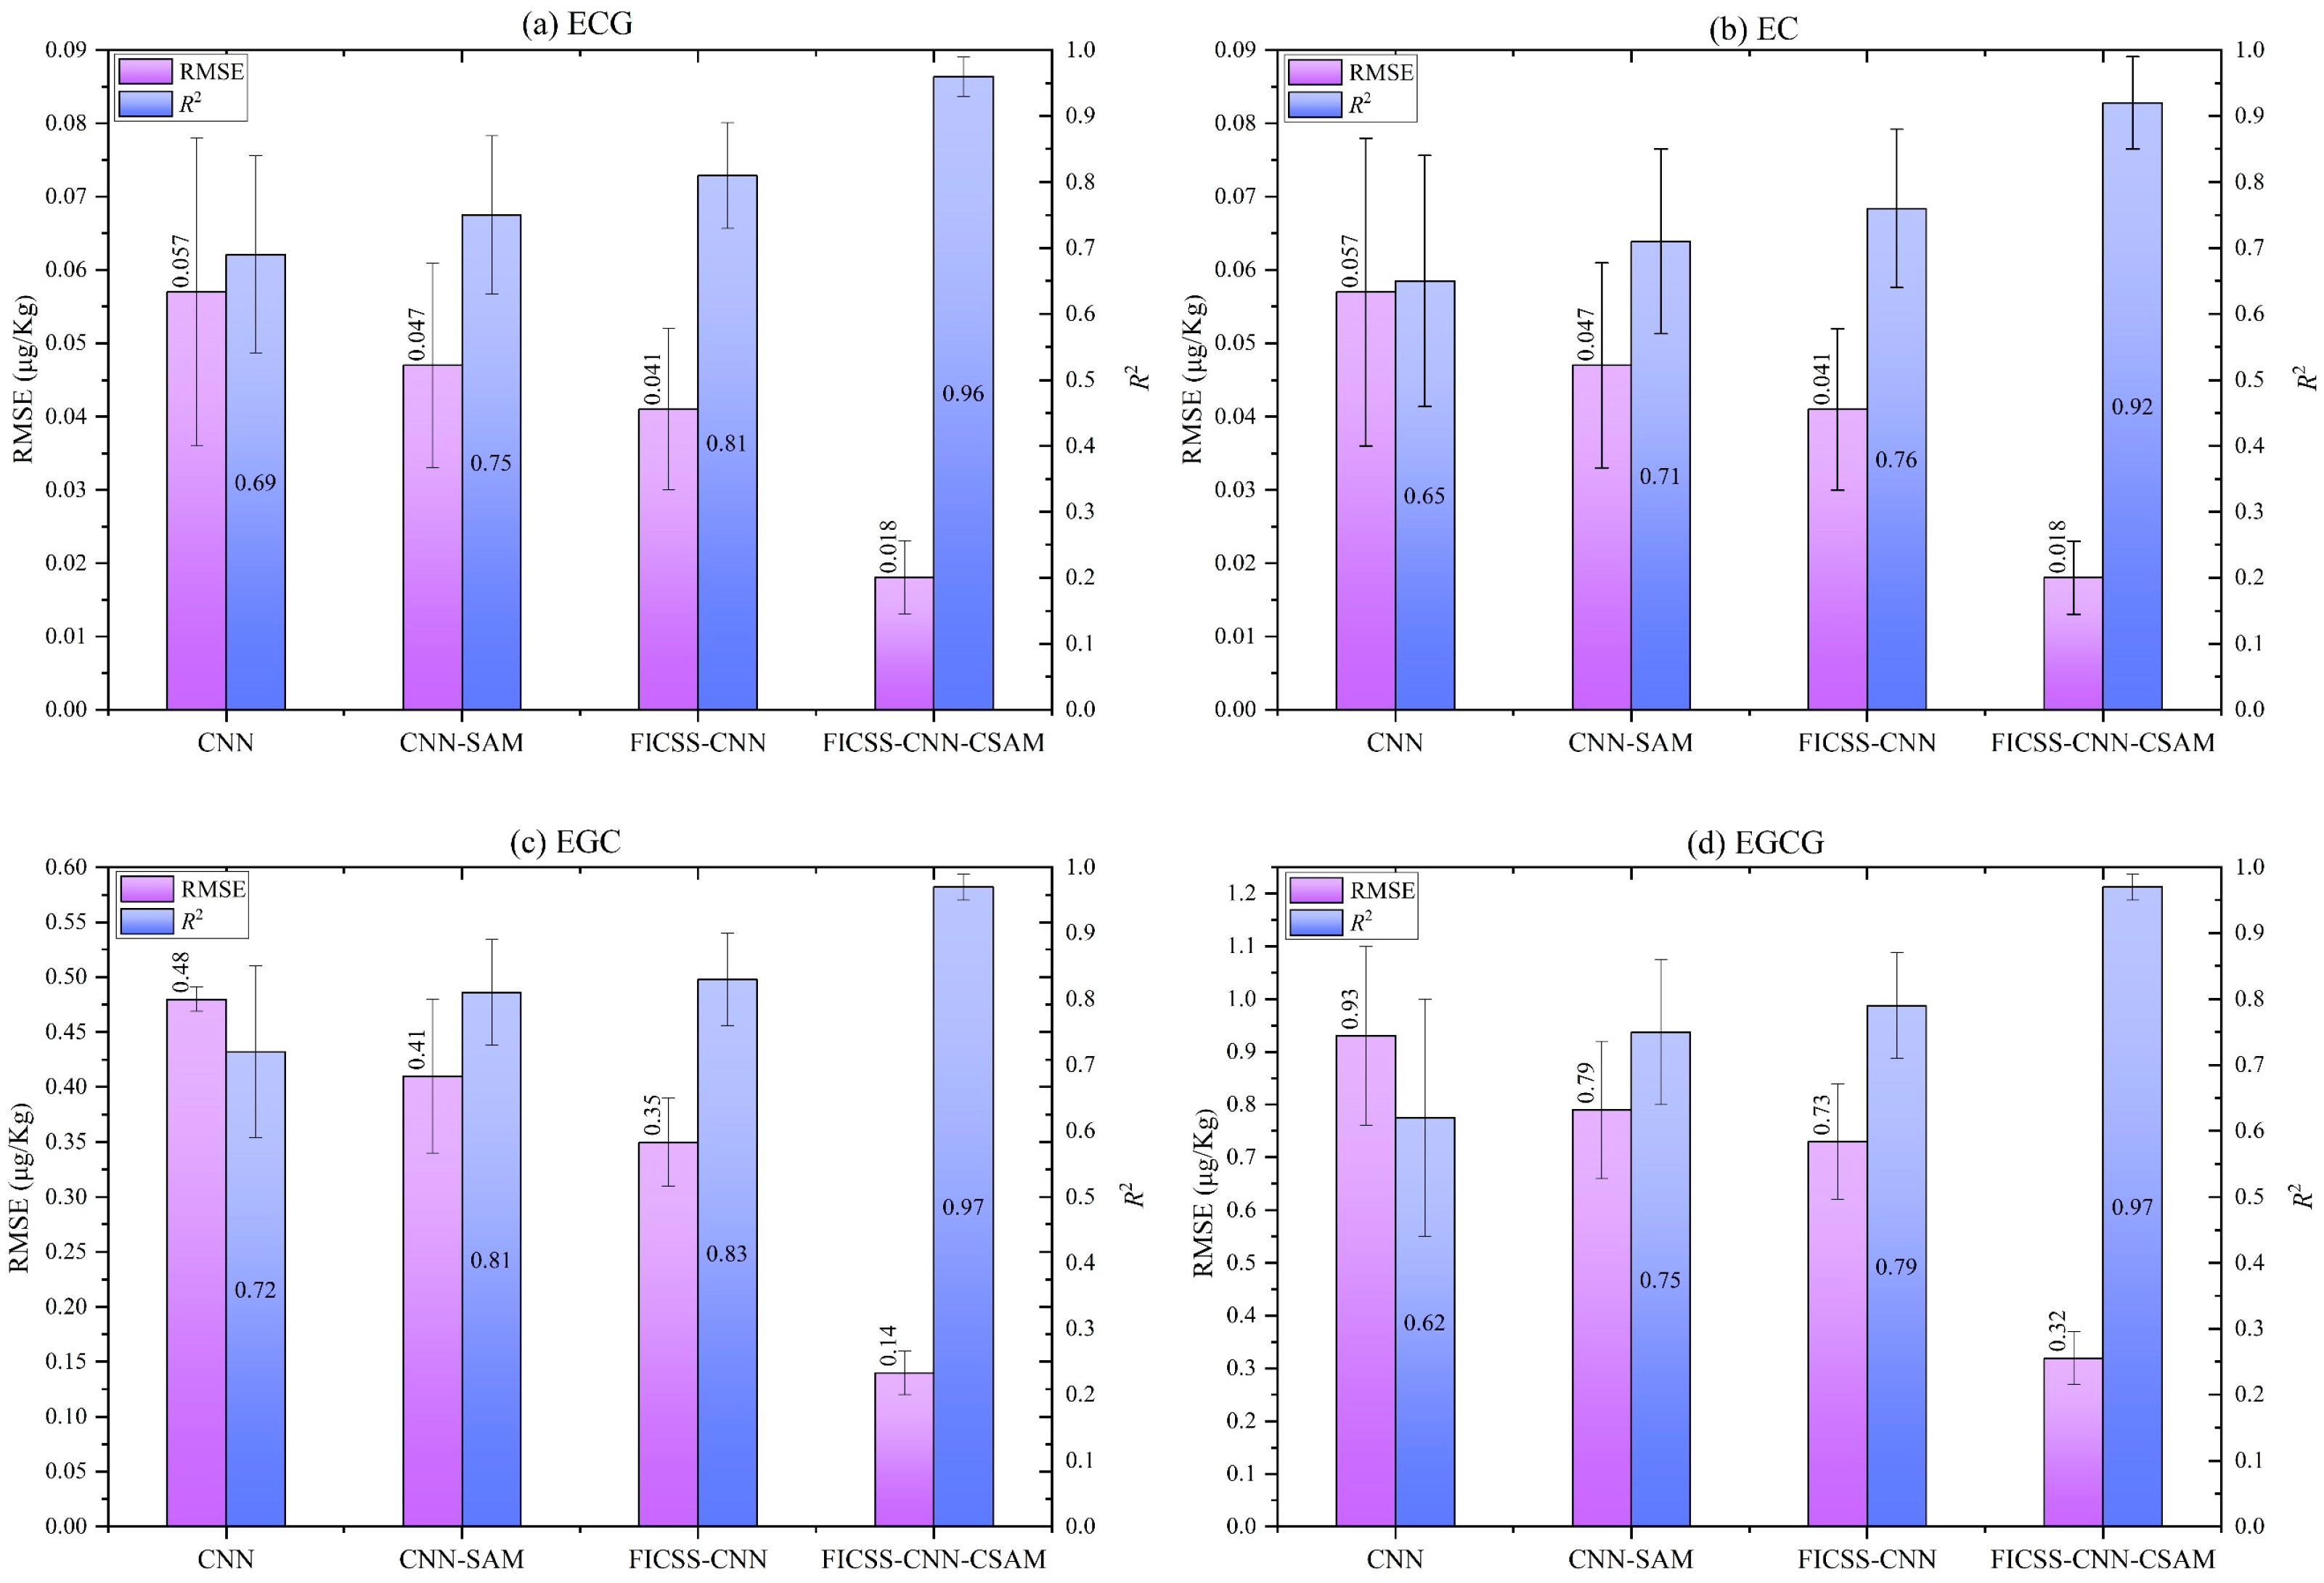
To validate the higher accuracy of the FICSS-CNN-CSAM model to simultaneously predict the various catechin contents in tea, we compared it with the CNN model, the CNN-CSAM model, and the FICSS-CNN model. All models in this study followed the same training strategy, with consistent structure and parameters for the CNN, as shown in Table 2. To mitigate the impact of random initialization in deep learning models, we used 10-fold cross-validation. The prediction results of the above four deep learning models for the contents of four catechins in tea are shown in Figure 8 and Table 3. Compared to the other three models, the FICSS-CNN-CSAM model demonstrate a significant advantage in simultaneously predicting the contents of the four catechins, as evidenced by the RMSE and R2 metrics.
Table 2.
A comparison of the evaluation metrics for prediction performance among the four models.
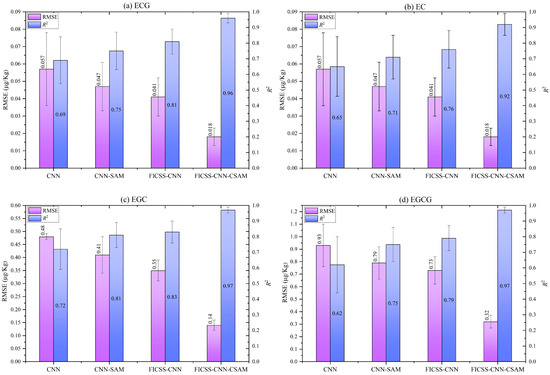
Figure 8.
A comparison of the prediction performance among four deep learning models.
Table 3.
The prediction results of the ablation experiment.
For the EC, compared to the baseline models, the FICSS-CNN-CSAM model achieves reductions in the RMSE value by 68.42%, 61.70%, and 56.09%, respectively. For the ECG, compared to the baseline models, the FICSS-CNN-CSAM model achieves reductions in the RMSE value by 78.43%, 73.81%, and 69.44%. For the EGC, compared to the baseline models, the FICSS-CNN-CSAM model achieves reductions in the RMSE value by 70.83%, 65.85%, and 60.00%. For the EGCG, compared to the baseline models, the FICSS-CNN-CSAM model achieves reductions in the RMSE value by 65.59%, 59.49%, and 56.16%.
Additionally, as shown in Figure 8, the FICSS-CNN-CSAM model exhibits a lower standard deviation and a more stable performance compared to other models in terms of prediction stability. These results indicate that the CNN models with attention mechanisms outperform the pure CNN models in the simultaneous prediction of catechin content. Moreover, the CNN models with attention mechanisms following wavelength selection by the FICSS algorithm outperform those without wavelength selection but with attention mechanisms.
4.4. The Attention Mechanism Ablation Experiment
In the previous experimental analysis, it has been demonstrated that the proposed FICSS-CNN-CSAM model can accurately predict various catechin contents in tea. To objectively compare the impacts of different attention mechanisms on the model’s predictive performance, we conducted an ablation experiment. This experiment compared the predictive performance of four models, nonattention (FICSS-CNN), CAM only (FICSS-CNN-CAM), SAM only (FICSS-CNN-SAM), and CAM placed after SAM (FICSS-CNN-SCAM), against our proposed model.
Table 3 compares the predictions of tea catechin content made by the five models. Compared to other models, the FICSS-CNN-CSAM model achieved the highest prediction accuracy. Based on the average R2 value predicted by these models for four types of catechin simultaneously, the FICSS-CNN-CSAM model outperformed the FICSS-CNN-CAM model by 7.05%, the FICSS-CNN-SAM model by 10.46%, the FICSS-CNN-SCAM model by 7.61%, and the FICSS-CNN model by 16.50%. Additionally, based on the RMSE, the FICSS-CNN-CSAM model’s predictive performance consistently surpassed that of the other four models.
In contrast to the experimental findings, our observations indicate that in CSAMs, the CAM plays a more crucial role than the SAM in the simultaneous and effective extraction of NIRS features from multiple catechins. When spatial attention is used alone, capturing the information interactions between specific channels becomes challenging. Therefore, the input features must be processed by the CAM before being passed to the SAM. This arrangement of CSAMs helps recognize the feature channels containing key information, reduces unnecessary interference, and improves the effectiveness of spatial attention.
5. Conclusions
In this study, we introduce a deep learning model, named FICSS-CNN-CSAM, aimed at enhancing the simultaneous estimation accuracy of multiple catechins using near-infrared spectroscopy. The FICSS-based wavelength selector effectively identifies the wavelength variables that distinctly represent the four catechins, thereby reducing spectral redundancy and facilitating the deconvolution of overlapping spectra. Additionally, the integration of channel and spatial attention mechanisms enables the efficient extraction of the deep features most pertinent to each catechin while mitigating unnecessary interference. Subsequently, this feature information is inputted into a CNN-based catechin content predictor, facilitating the simultaneous estimation of EC, ECG, EGC, and EGCG in black tea.
The findings from our experiments reveal that the FICSS-CNN-CSAM model achieves the highest precision when predicting EC, ECG, EGC, and EGCG content simultaneously, with R2 values of 0.92, 0.96, 0.97, and 0.97. Meanwhile, the corresponding RMSE values are 0.018, 0.11, 0.14, and 0.32. In comparison to baseline models and traditional chemometric models, the FICSS-CNN-CSAM model exhibits enhanced stability and predictive precision. High stability ensures a consistent performance across different datasets and conditions, making the model reliable for various production environments. Precision when predicting catechin content allows for more accurate quality control, enabling producers to optimize the grading and pricing of tea products. However, since the experimental samples only include naturally grown black tea, the model may perform differently across various types of tea, particularly those with unique chemical compositions or processing methods not represented in our sample set. Additionally, extreme variations in moisture content or particle size distribution could degrade the model’s predictive accuracy. Therefore, future research could expand the dataset to include a wider range of tea types, including those with distinct processing methods, to help improve the generalizability of the model.
Moreover, the CAM helps the model focus on the most informative spectral features by assigning higher importance to specific channels that are more relevant to predicting catechin content. By dynamically adjusting the attention weights, the CAM enables the model to adapt to variations in the spectral data, further enhancing stability. The SAM contributes to the model’s effectiveness by emphasizing spatially important features in the spectral data. It allows the model to capture local interactions and dependencies between the different spectral regions, which improves the model’s ability to generalize across different tea samples and conditions. The application of deep learning will further drive the development of new technologies in the field of non-destructive tea detection.
Author Contributions
Conceptualization, M.Z. and Y.W.; methodology, M.Z. and Y.L.; software, T.Z.; validation, X.D.; formal analysis, M.Z.; investigation, L.P.; data curation, Y.W.; writing—original draft preparation, M.Z., and T.Z.; writing—review and editing, M.Z. and L.P.; funding acquisition, Q.L., Y.Z., and Y.L. All authors have read and agreed to the published version of the manuscript.
Funding
This work was supported by the Guizhou Provincial Science and Technology Plan Project (with grant number [2024] General 165), Guizhou Vocational and Technical College of Industry 2023 School-Level Research Project (with grant number 2023ZK06), Guizhou Provincial Department of Science and Technology Plan Support Project (with grant number [2022] General 144), and the Guizhou Provincial Department of Science and Technology Plan Support Project (with grant number [2022] General 063).
Institutional Review Board Statement
Not applicable.
Informed Consent Statement
Not applicable.
Data Availability Statement
The data that support the findings of this study are available upon request from the corresponding author. The data are not publicly available due to privacy or ethical restrictions.
Acknowledgments
Chenhao Zhou (times27zhou@163.com, Department of Civil Engineering, Xi’an Jiaotong-Liverpool University, Suzhou 215123, Jiangsu, China) has made significant contributions in the areas of software, writing original draft preparation, and writing review and editing of the manuscript. All authors believe he can be considered as the 2nd author of this manuscript.
Conflicts of Interest
The authors declare no conflicts of interest.
References
- Wang, J.H.; Wang, Y.F.; Cheng, J.J.; Wang, J.; Sun, X.D.; Sun, S.; Zhang, Z.Y. Enhanced cross-category models for predicting the total polyphenols, caffeine and free amino acids contents in Chinese tea using NIR spectroscopy. LWT 2018, 96, 90–97. [Google Scholar]
- Huang, J.; Ren, G.; Sun, Y.; Jin, S.; Li, L.; Wang, Y.; Ning, J.; Zhang, Z. Qualitative discrimination of Chinese dianhong black tea grades based on a handheld spectroscopy system coupled with chemometrics. Food Sci. Nutr. 2020, 8, 2015–2024. [Google Scholar] [PubMed]
- Firmani, P.; De Luca, S.; Bucci, R.; Marini, F.; Biancolillo, A. Near infrared (NIR) spectroscopy-based classification for the authentication of Darjeeling black tea. Food Control 2019, 100, 292–299. [Google Scholar]
- Ignasimuthu, K.; Prakash, R.; Murthy, P.S.; Subban, N. Enhanced bioaccessibility of green tea polyphenols and lipophilic activity of EGCG octaacetate on gram-negative bacteria. LWT 2019, 105, 103–109. [Google Scholar]
- Jain, S.; Popli, H.; Aggarwal, G.; Gupta, M. Green tea-an antioxidant mystic herb. PharmaTutor 2018, 6, 23–31. [Google Scholar]
- Yan, X.; Xie, Y.; Chen, J.; Yuan, T.; Leng, T.; Chen, Y.; Xie, J.; Yu, Q. NIR Spectrometric Approach for Geographical Origin Identification and Taste Related Compounds Content Prediction of Lushan Yunwu Tea. Foods 2022, 11, 2976. [Google Scholar] [CrossRef]
- Wang, Y.J.; Li, T.H.; Li, L.Q.; Ning, J.M.; Zhang, Z.Z. Micro-NIR spectrometer for quality assessment of tea: Comparison of local and global models. Spectrochim. Acta Part A Mol. Biomol. Spectrosc. 2020, 237, 118403. [Google Scholar]
- El-Shahawi, M.S.; Hamza, A.; Bahaffi, S.O.; Al-Sibaai, A.A.; Abduljabbar, T.N. Analysis of some selected catechins and caffeine in green tea by high performance liquid chromatography. Food Chem. 2012, 134, 2268–2275. [Google Scholar]
- Ning, J.; Li, D.; Luo, X.; Ding, D.; Song, Y.; Zhang, Z.; Wan, X. Stepwise identification of six tea (Camellia sinensis (L.)) categories based on catechins, caffeine, and theanine contents combined with fisher discriminant analysis. Food Anal. Methods 2016, 9, 3242–3250. [Google Scholar]
- Wang, Y.; Li, M.; Li, L.; Ning, J.; Zhang, Z. Green analytical assay for the quality assessment of tea by using pocket-sized NIR spectrometer. Food Chem. 2021, 345, 128816. [Google Scholar]
- Liu, Y.; Wang, Y.; Xia, Z.; Wang, Y.; Wu, Y.; Gong, Z. Rapid determination of phytosterols by NIRS and chemometric methods. Spectrochim. Acta Part A Mol. Biomol. Spectrosc. 2019, 211, 336–341. [Google Scholar]
- Jia, J.M.; Zhou, X.F.; Li, Y.; Wang, M.; Liu, Z.Y.; Dong, C.W. Establishment of a rapid detection model for the sensory quality and components of Yuezhou Longjing tea using near-infrared spectroscopy. LWT 2022, 164, 113625. [Google Scholar]
- Turgut, S.S.; Entrenas, J.A.; Taşkın, E.; Garrido-Varo, A.; Pérez-Marín, D. Estimation of the sensory properties of black tea samples using non-destructive near-infrared spectroscopy sensors. Food Control 2022, 142, 109260. [Google Scholar]
- Dong, C.; Liu, Z.; Yang, C.; An, T.; Hu, B.; Luo, X.; Li, Y. Rapid detection of exogenous sucrose in black tea samples based on near-infrared spectroscopy. Infrared Phys. Technol. 2021, 119, 103934. [Google Scholar]
- Chen, Y.; Guo, M.; Chen, K.; Jiang, X.; Ding, Z.; Zhang, H.; Dong, C. Predictive models for sensory score and physicochemical composition of Yuezhou Longjing tea using near-infrared spectroscopy and data fusion. Talanta 2024, 273, 125892. [Google Scholar]
- Liu, Y.; Pan, K.; Liu, Z.; Dai, Y.; Duan, X.; Wang, M.; Shen, Q. Simultaneous Determination of Four Catechins in Black Tea via NIR Spectroscopy and Feature Wavelength Selection: A Novel Approach. Sensors 2024, 24, 3362. [Google Scholar] [CrossRef]
- Ding, Y.; Yan, Y.; Li, J.; Chen, X.; Jiang, H. Classification of tea quality levels using near-infrared spectroscopy based on CLPSO-SVM. Foods 2022, 11, 1658. [Google Scholar] [CrossRef]
- Li, M.; Pan, T.; Bai, Y.; Chen, Q. Development of a calibration model for near infrared spectroscopy using a convolutional neural network. J. Near Infrared Spectrosc. 2022, 30, 89–96. [Google Scholar]
- Liu, Y.; Zhou, S.; Han, W.; Li, C.; Liu, W.; Qiu, Z.; Chen, H. Detection of adulteration in infant formula based on ensemble convolutional neural network and near-infrared spectroscopy. Foods 2021, 10, 785. [Google Scholar] [CrossRef]
- Yang, J.; Wang, J.; Lu, G.; Fei, S.; Yan, T.; Zhang, C.; Tang, X. TeaNet: Deep learning on Near-Infrared Spectroscopy (NIR) data for the assurance of tea quality. Comput. Electron. Agric. 2021, 190, 106431. [Google Scholar]
- Luo, N.; Li, Y.; Yang, B.; Liu, B.; Dai, Q. Prediction Model for Tea Polyphenol Content with Deep Features Extracted Using 1D and 2D Convolutional Neural Network. Agriculture 2022, 12, 1299. [Google Scholar] [CrossRef]
- Niu, Z.; Zhong, G.; Yu, H. A review on the attention mechanism of deep learning. Neurocomputing 2021, 452, 48–62. [Google Scholar]
- Dong, Z.; Wang, J.; Sun, P.; Ran, W.; Li, Y. Mango variety classification based on convolutional neural network with attention mechanism and near-infrared spectroscopy. J. Food Meas. Charact. 2024, 18, 2237–2247. [Google Scholar]
- Yuan, Q.; Wang, J.; Zheng, M.; Wang, X. Hybrid 1D-CNN and attention-based Bi-GRU neural networks for predicting moisture content of sand gravel using NIR spectroscopy. Constr. Build. Mater. 2022, 350, 128799. [Google Scholar]
- Ur Rehman, N.; Al-Harrasi, A.; Boqué, R.; Mabood, F.; Al-Broumi, M.; Hussain, J.; Alameri, S. FT-NIRS Coupled with PLS Regression as a Complement to HPLC Routine Analysis of Caffeine in Tea Samples. Foods 2020, 9, 827. [Google Scholar] [CrossRef] [PubMed]
- GB/T 8313-2008; Determination of Total Polyphenols and Catechins Content in Tea. Chinese National Standard: Beijing, China, 2008.
- Wang, Y.; Zhao, P.; Zhang, Z. A deep learning approach using attention mechanism and transfer learning for electromyographic hand gesture estimation. Expert Syst. Appl. 2023, 234, 121055. [Google Scholar]
- Zhao, W.; Ding, W.; Zhang, S.; Zhang, Z. A deep learning approach incorporating attention mechanism and transfer learning for lithium-ion battery lifespan prediction. J. Energy Storage 2024, 75, 109647. [Google Scholar]
Disclaimer/Publisher’s Note: The statements, opinions and data contained in all publications are solely those of the individual author(s) and contributor(s) and not of MDPI and/or the editor(s). MDPI and/or the editor(s) disclaim responsibility for any injury to people or property resulting from any ideas, methods, instructions or products referred to in the content. |
© 2024 by the authors. Licensee MDPI, Basel, Switzerland. This article is an open access article distributed under the terms and conditions of the Creative Commons Attribution (CC BY) license (https://creativecommons.org/licenses/by/4.0/).