Abstract
The detection of glucose is crucial for diagnosing diseases such as diabetes and enables timely medical intervention. In this study, a disposable enzymatic screen-printed electrode electrochemical biosensor enhanced with machine learning (ML) for quantifying glucose in serum is presented. The platinum working surface was modified by chemical adsorption with biographene (BGr) and glucose oxidase, and the enzyme was encapsulated in polydopamine (PDP) by electropolymerisation. Electrochemical characterisation and morphological analysis (scanning and transmission electron microscopy) confirmed the modifications. Calibration curves in Cormay serum (CS) and selectivity tests with chronoamperometry were used to evaluate the biosensor’s performance. Non-linear ML regression algorithms for modelling glucose concentration and calibration parameters were tested to find the best-fit model for accurate predictions. The biosensor with BGr and enzyme encapsulation showed excellent performance with a linear range of 0.75–40 mM, a correlation of 0.988, and a detection limit of 0.078 mM. Of the algorithms tested, the decision tree accurately predicted calibration parameters and achieved a coefficient of determination above 0.9 for most metrics. Multilayer perceptron models effectively predicted glucose concentration with a coefficient of determination of 0.828, demonstrating the synergy of biosensor technology and ML for reliable glucose detection.
1. Introduction
Diabetes mellitus (DM) is one of the main causes of mortality and reduced life expectancy []. DM is a series of metabolic diseases characterised by hyperglycemia due to defects in insulin secretion, insulin action or both. The condition of chronic hyperglycemia can lead to long-term damage to, breakdown of, and/or dysfunction of various organs [,].
Several pathogenic processes are involved in the development of DM, from autoimmune destruction of pancreatic β-cells leading to insulin deficiency to changes that lead to resistance to the action of insulin and cause disturbances in the metabolism of carbohydrates, fats, and proteins. This dysfunction of insulin action is the result of insufficient secretion of the hormone and/or a reduced tissue response to the hormone at one or more points in the complex hormonal signaling pathways [].
It is possible to reduce glucose levels with lifestyle modification or medication in people with DM, especially if implemented early, which may even delay the progression of vascular complications. Long-term glycemic control and reduction in blood pressure and cholesterol also reduce the risk of adverse cardiovascular outcomes [].
Even with these alternatives, the effectiveness of these measures at the population level is low, mainly because many cases are not diagnosed, as the general population is not very adherent to treatment []. Therefore, there is an urgent need to introduce new techniques to combat DM worldwide, improve early detection, and use pharmacological and lifestyle interventions that prevent or delay disease progression [].
Conventional methods of glucose detection include laboratory and optical methods, which are widely used in clinical diagnostics and diabetes management []. In the colorimetric enzymatic method, glucose oxidase (GOx) is used to oxidise glucose. This produces hydrogen peroxide, which reacts with peroxidase and produces a measurable colour change that correlates directly with the glucose concentration [,,,,,,,]. In the enzymatic hexokinase method, glucose is converted to glucose-6-phosphate by hexokinase, followed by conversion to 6-phosphogluconate by glucose-6-phosphate dehydrogenase, producing NADPH. This NADPH is quantified by absorbance and provides highly accurate measurements. Infrared spectroscopy offers a non-invasive alternative by measuring the absorption of infrared light by tissue, utilising the unique vibrational frequencies of glucose molecules [,,].
Despite the usefulness of these methods, electrochemical biosensors have emerged as pioneering tools for glucose monitoring [,,,,,]. These devices integrate a biological sensing element with an electrochemical transducer and convert chemical or biological interactions into measurable electrical signals. Compared to conventional techniques, electrochemical biosensors are characterised by their rapid detection, cost-effectiveness, non-destructive analysis, and on-site monitoring capability. Their high sensitivity, continuous measurement capability, and potential for miniaturisation make them invaluable for real-time glucose management. As a result, electrochemical sensors not only complement conventional methods but also often surpass them. They pave the way for advanced, accessible, and efficient diabetes monitoring solutions [,,].
Enzymatic glucose biosensors have proven to be one of the most promising approaches for monitoring DM due to their high sensitivity and selectivity. GOx is often chosen as a biorecognition element due to its excellent stability, sensitivity, and selectivity [,,].
A key challenge in the development of enzymatic biosensors is the immobilisation of enzymes on the surface of the working electrode (WE). To solve this problem, many biosensors use nanomaterials to modify the electrode, which facilitates the attachment of enzymes and creates a supportive microenvironment that maintains enzymatic activity. In addition, these nanomaterials improve electron transfer between the redox centre of the enzyme or other electroactive species (e.g., mediators, reaction products) and the electrode surface [,,].
Biographene (BGr) offers remarkable advantages as an immobilisation matrix due to its biocompatibility and the functional groups on its surface in combination with the special properties of graphene, which makes it remarkably effective for biosensor applications [,]. Its large surface area increases the interface available for the attachment of enzymes, resulting in higher sensitivity and lower detection limits [,,]. In addition, the unique electronic properties of graphene promote efficient charge transfer between the electrode and the immobilised enzyme, which significantly improves the performance of the biosensor. Overall, the immobilisation of GOx on a BGr support represents a powerful combination of biocatalysis and materials science, as it combines the unique catalytic properties of the enzyme with the exceptional physical, chemical, and electronic properties of BGr. This synergy improves the performance of electrochemical biosensors in several ways, making them ideal for glucose monitoring, especially in real-time and point-of-care (PoC) applications.
In the field of biosensors and detection, machine learning (ML) emerges as a tool for data processing and analysis, e.g., in feature extraction, pattern identification or prediction of species, analyte concentrations and even unknown information in qualitative or quantitative assays.
The advantages of advanced ML methods over conventional approaches lie in their ability to study nonlinear dependencies suitable for complex biological samples. At the same time, they offer an unrivalled opportunity to solve urgent challenges in the field of biosensors [,,].
The convergence of biosensors with ML methods has crystallised a promising strategy aimed at putting testing technologies that enable comprehensive and timely testing into practice. In addition to enabling multiple determinations and improving the analytical performance of devices by discriminating overlapping signals, supervised ML models can enable accurate testing without the need for experimental methods to avoid analytical problems such as electrode fouling, matrix effects, chemical interference, and poor signal-to-noise ratio. ML can help read out the biosensor directly, automatically, accurately and quickly, which is particularly important for on-site detection or diagnosis [,].
Machine learning techniques for nonlinear regression provide a robust method for modelling complex and potentially highly nonlinear relationships between multiple variables, enabling valuable applications in biosensor research. By using these methods, researchers can develop models that are able to predict calibration curve parameters for biosensors or even directly estimate analyte concentrations, such as glucose, in biological samples. This predictive capability is crucial for the calibration of biosensors, where accuracy and reliability are essential for effective diagnostic use. In addition, these techniques allow us to identify and quantify relationships between different input factors and target variables, providing deeper insights into the underlying mechanisms that influence biosensor performance. Some examples of these ML algorithms are Support Vector Regressor (SVR), Multi-Layer Perceptron Regressor (MLP), Gradient Boosting Regressor (GB), Random Forest Regressor (RF), Decision Tree Regressor (DT), KernelRidge (KR) and K-Neighbors Regressor (KN) [,].
First-generation GOx-based electrochemical glucose biosensors were developed using two enzyme immobilisation methods, adsorption and encapsulation, with BGr as the immobilisation matrix. Using the data obtained during the construction and calibration of these biosensors, several non-linear regression algorithms were developed to understand if ML methods can predict the parameters of a calibration curve or even the glucose concentration in a sample without traditional calibration processes.
The integration of ML techniques into electrochemical biosensors for glucose has shown remarkable potential to improve their analytical performance and predictive capabilities. ML algorithms such as decision trees and multi-layer perceptron models have been successfully used to fit the calibration curves, predict glucose concentrations, and model complex non-linear relationships in biosensor data. For example, decision tree models have shown high accuracy in predicting calibration parameters, achieving coefficients of determination above 0.9 for critical metrics such as slope and y-intercept, while multi-layer perceptron models have shown robust performance in predicting glucose levels with a coefficient of determination of 0.828. These results illustrate how ML not only improves the precision and reliability of glucose quantification but also enables adaptive and robust sensor responses that pave the way for more efficient real-time and point-of-care glucose monitoring systems.
2. Materials and Methods
2.1. Chemicals and Solutions
Human serum was purchased from Cormay Diagnostics; D-(+)-Glucose (dextrose monohydrate) was acquired from Alfa Aesar; Glucose Oxidase HPS300 from Aspergillus nigger was obtained from Sekisui Diagnostics; phosphate buffered saline (PBS) tablets were purchased from VWR; creatinine was acquired from Fluka; uric acid (≥99% crystalline) was obtained from Sigma Aldrich; L-ascorbic acid was purchased from Riedel-De-Haen; dopamine hydrochloride was obtained from Thermo Scientifics and urea was purchased from Fragor.
2.2. Solutions
PBS solution (10 mM) was prepared by dissolving one pellet of concentrated PBS in ultrapure water from the Milli-Q system. GOx enzyme solutions (10 mg mL−1) and mixed solutions of GOx enzyme (10 mg mL−1) and dopamine (5 mM) were prepared in PBS for subsequent application to the electrodes.
To generate calibration curves for each biosensor, glucose standards were prepared in both PBS and Cormay serum (CS), which was filtered and diluted 50 times in PBS buffer. Commercial human serum was pre-treated with Amicon filters (50 kDa). After filtration, what was retained was discarded, and the filtrate was adjusted with PBS to obtain a 50-fold dilution.
A 50 mM glucose stock solution was prepared in serum. From this stock solution, glucose solutions were prepared by dilution in the following concentrations: 0.05 mM; 0.5 mM; 0.75 mM; 1 mM; 2.5 mM; 5 mM; 10 mM; 20 mM; 30 mM; 40 mM.
To study selectivity, solutions of potential interferents present in human serum were prepared, including uric acid (UA, 0.070 mg mL−1), ascorbic acid (AA, 0.015 mg mL−1), urea (0.400 mg mL−1), and creatinine (Creat, 0.013 mg mL−1). The reference solution used was a 5 mM glucose solution in PBS to simulate physiological conditions. Interferent concentrations were adjusted to reflect typical physiological values found in human serum.
2.3. Apparatus
Pt-SPE electrodes were purchased from Metrohm/DROPSENS and consisted of a working and counter electrode made of platinum and a reference electrode made of silver. Cyclic voltammetry (CV) and chronoamperometry (CA) were performed using a Metrohm Autolab potentiostat. A DropSens switch box (DRP-DSC) was used to create an interface between the electrodes and the potentiostat. Gilson micropipettes with adjustable volumes (0.2–2.0 µL, 2–20 µL, 20–200 µL, 100–1000 µL, and 1000–5000 µL) were used to prepare the various solutions required during the study for measurement volumes up to 5 mL. For larger volumes, the solutions were prepared in volumetric flasks between 5 and 20 mL. A Mettler Toledo balance with a measurement uncertainty of ±0.01 mg was used to weigh the reagents. In certain situations where the resolution of the reagent was lower, a Fisher Brand liquid stirrer with low surface tension was used. A P Selecta oven at 37 °C was used to dry the layers deposited on the electrodes.
Scanning electron microscopy (SEM) analyses were performed using a high-resolution scanning electron microscope, model JEOL JSM 6301 F, equipped with an Oxford INCA Energy 350 energy dispersive spectrometer and a Gatan Alto 2500 detector. Transmission electron microscopy (TEM) analyses were performed using a transmission electron microscope, model JEOL JEM 1400, with 120 kV transmission.
2.4. Synthesis of Biographene
BGr was obtained by exfoliation of graphite in the presence of the protein bovine serum albumin (BSA) according to reference [], which facilitates the dispersion of the material in water at room temperature, using a mixer. The process started with the suspension of graphite crystals (100 mg mL−1) in 200 mL of deionised water with a pH of 7.0 containing BSA (3.0 mg mL−1). To perform shearing, the suspension was processed in a blender for 30 min, with samples taken every 5 min to analyse the rate of exfoliation. The absorbance at 600 nm of the suspension was measured by UV–visible spectroscopy and was used to quantify the graphene concentration after removal of the unexfoliated graphite, which was separated by centrifugation at 1500 rpm for 45 min. In all exfoliation experiments, precise amounts of graphite, BSA and deionised water were added, and the speed of the blade was adjusted as required.
2.5. Biosensor Assembling
The methods for producing biosensors were evaluated by varying the number of BGr layers applied to the WE and by comparing two enzymatic immobilisation techniques: adsorption and encapsulation (Figure 1). In both methods, BGr was immobilised on the WE, followed by immobilisation of the GOx enzyme.
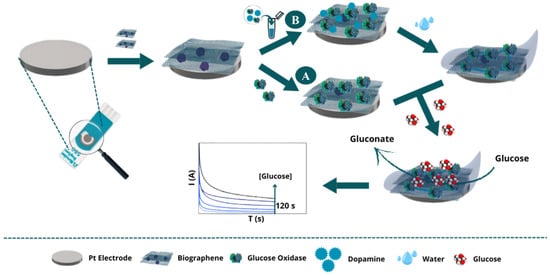
Figure 1.
Schematic illustration of the construction of a glucose detection biosensor. Initially, biographene is fixed onto the surface (common to both methods). In Method (A), the GOx enzyme is immobilised by chemical adsorption, followed by glucose detection by the biosensor, and measurement of the generated signal. In Method (B), a mixture of the GOx enzyme with dopamine is absorbed, followed by dopamine electropolymerisation, glucose detection by the biosensor, and evaluation of the biosensor’s analytical performance.
In Method A: Adsorption (Figure 1A), the GOx enzyme was directly immobilized on a working Pt-SPE electrode pre-modified with BGr. Two configurations of nanomaterial and enzyme layers were tested, with each layer consisting of 5 μL. First, two layers of BGr were sequentially applied to the WE surface, followed by two layers of GOx enzyme solution (10 mg mL−1 in PBS). After the application of each layer, the modified electrodes were incubated at 37 °C for 2 h. The biosensors were then stored overnight at 4 °C before calibration. In addition, a simplified configuration was tested in which a single layer of GOx enzyme was immobilised over a single layer of BGr.
In Method B: Encapsulation (Figure 1B), an alternative immobilization approach was used in which a solution containing both GOx enzyme (10 mg mL−1) and dopamine (Dop, 5 mM) in PBS was used. Like method A, one and two layers of the nanomaterial and GOx enzyme solution were tested. The solution was applied to the WE, which was then incubated in a humid environment at 37 °C for 2 h. Dopamine was electropolymerized using CV, creating a polydopamine (PDP) matrix that encapsulated the enzyme. Finally, the biosensors were stored overnight at 4 °C.
This systematic approach allowed the evaluation of the effects of the immobilization technique and the number of layers of BGr and GOx enzyme on the performance of the biosensors.
2.6. Electrochemical Measurments
The oxidation peak of glucose on the enzyme-modified SPE, representing the reaction catalysed by GOx, was assessed by CV. The potential range was between −0.1 and +0.8 V, with a scan rate of 0.01 V s−1, in a solution of PBS (control) and 5 mM glucose.
To monitor the surface modification of the Pt-SPE, the following steps were performed: (i) bare electrodes, (ii) after immobilisation of BGr and (iii) after immobilisation of GOx. CV measurements were performed in the potential range from −0.1 to +0.8 V and a scan rate of 0.01 V s−1, with 70 μL of PBS added to the electrode surface for each step.
The performance of the biosensor was evaluated in glucose-filtered Cormay serum diluted 50-fold. By applying a logarithm to the concentration values, it is possible to obtain a linear graph representing the current as a function of the logarithm of the concentrations. In this way, a calibration curve was obtained for the current values corresponding to 60 s and 120 s for each prepared biosensor. The calibration curve was obtained using CA at +0.4 V with standard glucose solutions ranging from 0.05 mM to 50 mM. For each measurement, the biosensor was incubated with 70 µL of the solution with the lowest concentration, followed by current measurements. The electrode surface was cleaned between measurements before progressively higher concentrations were tested. The current was recorded for 120 s, with measurements taken every 0.1 s. The slope of these straight lines also allows conclusions to be drawn about the sensitivity and quality of the response of the individual biosensors. The limit of detection (LOD) can also be calculated from the CA technique results. Equation (1) [,] shows how to obtain this value, where the LOD is determined using the standard deviation (σ) of three measurements of the blank signal. The LOD is then calculated by multiplying σ by 3 and dividing by the slope of the calibration curve:
2.7. Selectivity Studies
To calculate the selectivity of the developed biosensors, their amperometric response to a 5 mM glucose solution was analysed in the presence and absence of interferents using the competitive method. For this purpose, 5 mM glucose solutions were prepared with ascorbic acid (0.015 mg mL−1), uric acid (0.070 mg mL−1), creatinine (0.013 mg mL−1) or urea (0.400 mg mL−1).
The CA technique was performed for each of the solutions in the same way as previously described. Assuming that the electrochemical signal of the 5 mM glucose solution (Glu) corresponds to 100% of the signal, the interference was calculated using Equation (2):
This study was carried out for both the biosensor prepared by adsorption and the one prepared by encapsulation, with a BGr and a GOx layer, using current values referring to 60 s of the signal.
2.8. Machine Learning Study Components
Various nonlinear regression algorithms were applied in two different approaches. One approach was used to predict the equation of the calibration curve of a biosensor, i.e., the slope (m) and y-intercept (b), as well as the lower limit (LL) and upper limit (UL) of the linear detection range. The other approach aimed to predict the glucose concentration in a given sample.
2.8.1. Datasets
Two different datasets were used, one to predict the parameters of the biosensor calibration curve and the other to predict the glucose concentration. All data collected refer to biosensors used to measure glucose solutions in CS that were filtered and diluted 50-fold. Results were only considered if the calibration curves obtained had a correlation coefficient of more than 0.98. Similarly, only calibration curves whose slope was within a certain range, in which the most frequent and most common values in the entire work are found, were considered in order not to disturb the training process of the algorithm.
The dataset for predicting the parameters of the calibration curves consisted of 83 samples, each of which referred to one calibration curve. The following variables were considered as input variables: (1) Number of BGr layers; (2) Number of GOx layers; (3) time (s), time at which the current values were recorded; (4) [enzyme] (mM), enzyme concentration; (5) [dopamine] (mM), dopamine concentration; (6) [Glu] (mM), glucose concentration of the stock solution used to prepare the standards in the calibration process; (7) LL current (μA), current value corresponding to the lower limit of the linear detection range; (8) UL current (μA), current value corresponding to the upper limit of the linear detection range. The initial variables were m, b, LL and UL.
The dataset used to predict glucose concentrations consisted of 522 samples, each of which corresponded to a point on the previous calibration curves. Here, the same input variables were considered, except for the LL current, the UL current and the glucose concentration of the mother solution. Instead, the current value corresponding to a specific glucose concentration was taken into account.
2.8.2. Algorithms
All algorithms were imported from the Scikit-Learn library, which has simple and efficient tools for predictive data analysis. Thus, the algorithms applied were GB, KR, SVR, KN, RF, DT and MLR. Two different hyperparameter combinations were tested for the RF and DT algorithms. The configuration used for each algorithm can be seen in Table 1.

Table 1.
Algorithms studied and their defined hyperparameters.
2.8.3. Data Processing
Before the algorithms were applied to the data sets, the absolute correlation matrix of the input variables was calculated and variables with correlations greater than a threshold of 0.7 were removed. This resulted in the exclusion of the “number of GOx layers” column in both datasets.
Then, each algorithm was applied to predict each of the desired outcome variables. For each algorithm, 20 runs were performed. At the beginning of each run, the datasets were randomly split, 80% for the training phase and the remaining 20% for the testing phase. In each of these runs, all different combinations of input variables (CIV) were tested and the model whose CIV performed better at the end of that run was recorded. After the 20 runs, the set of input variables with the best performance was recorded. To calculate the performance of the regression models, the coefficient of determination (R2) was identified.
3. Results and Discussion
3.1. Biosensor Assembling: Electrochemical Characterisation
Figure S1 shows the electrochemical control of the BGr arrangement on the SPE surface. CV was performed in a potential range from −0.1 to +0.8 V at a scan rate of 0.01 V s−1, with measurements performed in PBS at pH 7.4. After immobilisation of BGr on the Pt-SPE electrode surface, an increase in current density and intensity was observed. This increase is due to the large surface area and excellent electrical conductivity of BGr, which improve electron transfer and the efficiency of the electrochemical reactions, resulting in a higher CV current density. These results confirm the successful immobilisation of the nanomaterial on the electrode surface. The next step in the GOx adsorption process was to deposit two layers of GOx on the BGr-modified electrode.
Immobilisation of GOx by Adsorption and Encapsulation
After immobilising two layers of enzyme on the BGr-modified working electrode surface, CV measurements were taken under the same conditions (Figure 2) to compare the electrochemical signals of PBS (control) and a 5 mM glucose solution. This was measured to determine the potential at which the enzyme oxidises glucose, using a concentration close to the physiological value.
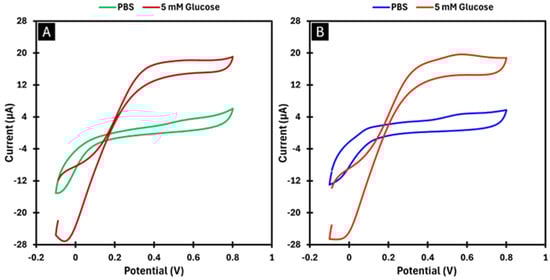
Figure 2.
Voltammograms obtained in PBS and in a 5 mM glucose solution at a scan rate of 0.01 V s−1. In Image (A), GOx was immobilised by adsorption. In Image (B), PDP was used as the immobilisation matrix for GOx.
As shown in Figure 2A, the current signal was higher in the presence of glucose. A peak is observed at approximately +0.4 V, which corresponds to the electro-oxidation potential of glucose. This peak represents the potential at which the reaction catalysed by the GOx enzyme occurs.
The procedure was repeated for the biosensor developed using the encapsulation method, also with two enzyme layers. As shown in Figure 2B, the results were comparable to those of the BGr-modified biosensor. These results confirm that the biosensor responds to glucose and demonstrate that the optimal potential to promote the enzymatic reaction for both preparation methods is +0.4 V. Consequently, this potential was chosen for CA to ensure significant amperometric responses. The relative standard deviation (RSD) between the measurements was 2.04% for the adsorption method and 11.6% for the encapsulation method.
3.2. Morphological Characterisation of Electrodes
The electrode was characterised by SEM for the unmodified Pt-SPE electrode and Pt-SPE electrodes modified with BGr, with GOx and with the GOx encapsulation methodology with PDP. BGr was also characterised by the TEM technique.
3.2.1. SEM Analysis
Figure 3 shows the results of the SEM analysis, which allowed us to verify differences in the surface morphology of the electrodes during the various stages of the construction of the biosensor.
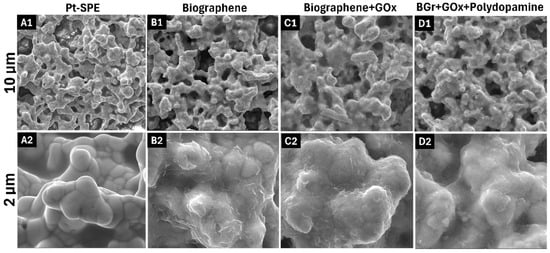
Figure 3.
SEM analysis at different magnifications: 1–10,000× = 10 µm; 2–50,000× = 2 µm. Unmodified platinum electrode (A1,A2); Biographene fixation (B1,B2); GOx immobilisation by adsorption (C1,C2); PDP as a matrix for the immobilisation of GOx (D1,D2).
Figure 3B confirms the presence of the BGr layer on the Pt-SPE surface, where deposited and agglomerated graphene layers can be observed. However, the immobilisation of the GOx enzyme could not be directly confirmed due to its small size, which is in the range of a few nanometres. Figure 3D illustrates the enzyme encapsulation method using PDP, where the presence of a thin film can be visualised, especially when compared with the image of the unmodified Pt-SPE (Figure 3A) and the electrode modified only with BGr (Figure 3B). These results confirm the presence of both the nanomaterial and the polymer on the surface of the working electrode.
3.2.2. TEM Analysis
Figure 4 shows the TEM microscopy analysis of the BGr nanomaterial. The TEM analysis allowed us to observe the graphene sheets that make up BGr in detail. The different orientations of the graphene sheets as well as the presence of porous regions (visible as white zones) indicate that the material is polycrystalline.
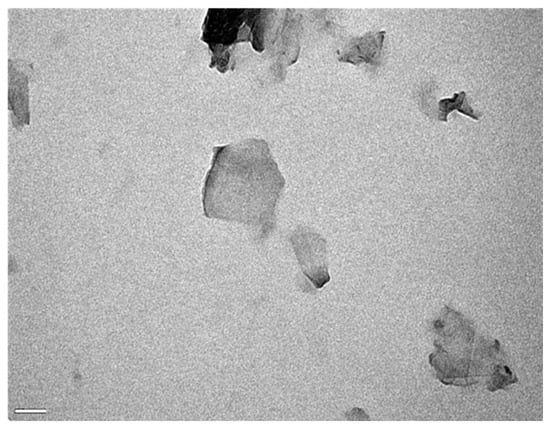
Figure 4.
Result of TEM analysis of BGr, with image obtained at 100,000× magnification.
3.3. Analytical Response of the Electrochemical Biosensor
3.3.1. Calibration in Human Serum
Calibration curves were created in Cormay human serum to establish the relationship between the measured current and the logarithm of the glucose concentration. The influence of the number of layers on the performance of the biosensor was analysed. Biosensors modified with one layer of BGr and GOx enzyme and those with two layers were evaluated for both preparation methods. Current values were recorded after 60 and 120 s (Figure 5, Figure 6, Figures S2 and S3) using the CA technique. The glucose concentrations used for calibration were 0 mM, 0.05 mM, 0.5 mM, 0.75 mM, 1 mM, 2.5 mM, 5 mM, 10 mM, 20 mM, 30 mM, 40 mM, and 50 mM.
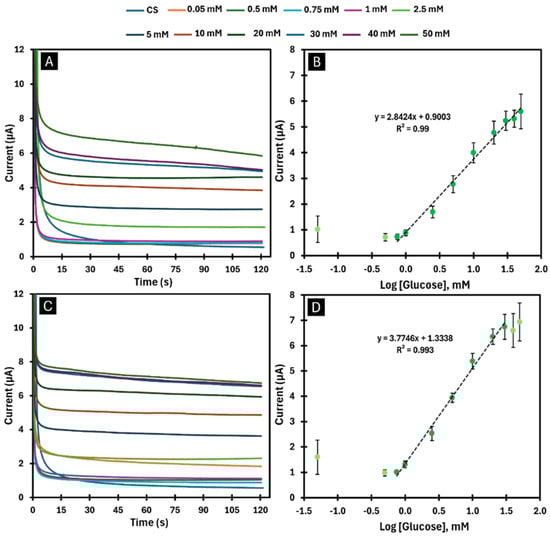
Figure 5.
Chronoamperograms and respective calibration curves obtained in CS, after immobilisation of one layer (A,B) and two layers (C,D) of GOx enzyme by adsorption. (A,C) show the chronoamperograms with the presence of GOx in response to the variation in glucose concentrations (0.05–50 mM). (B,D) display the calibration curves of the current response as a function of the logarithmic glucose concentration for the time of 60 s.
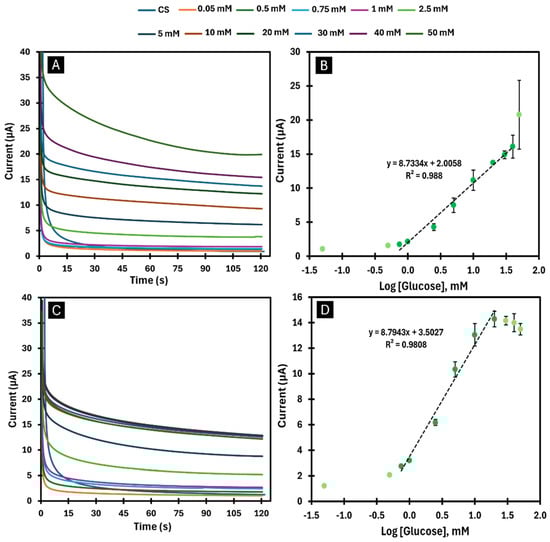
Figure 6.
Chronoamperograms and respective calibration curves obtained in CS, after immobilisation of one layer (A,B) and two layers (C,D) of GOx enzyme by encapsulation. (A,C) show the chronoamperograms with the presence of GOx in response to the variation in glucose concentrations (0.05–50 mM). (B,D) display the calibration curves of the current response as a function of the logarithmic glucose concentration for the time of 60 s.
Calibration curves were generated for biosensors with combinations of one and two layers developed by the adsorption and encapsulation methods. When one layer of GOx was immobilised by the adsorption method (Figure 5A and Figure 6B), a biosensor with a sensitivity of 2.8424 µA/log([Glu]) was obtained for a linear detection range between 0.75 and 50 mM with an LOD of 0.012 mM. When two layers of GOx were immobilised using the same method (Figure 5C,D), a biosensor with higher sensitivity (3.7746 µA/log([Glu])) was obtained for a linear detection range between 0.75 and 30 mM with an LOD of 0.089 mM. The encapsulation method, on the other hand, made it possible to obtain a highly sensitive biosensor (8.7334 µA/log([Glu])) for a linear detection range between 0.75 and 40 mM with an LOD of 0.078 mM when an enzyme layer was applied (Figure 6A,B). When applying two layers with the same method (Figure 6C,D), it was possible to obtain an even higher sensitivity (8.7943 µA/log([Glu])) for a linear detection range between 0.75 and 20 mM with an LOD of 0.051 mM.
When analysing the calibration curves obtained (Figure 6), it becomes clear that the use of more layers of BGr and GOx leads to biosensors with higher sensitivity, but with a shorter linear detection range. Comparing the two immobilisation methods, the encapsulation method provides a higher sensitivity than the adsorption method but has a shorter linear detection range. In all cases analysed, the results considering current values for 60 s were always more satisfactory, as they had a higher sensitivity with the same linear detection range as for 120 s (Figures S2 and S3).
Thus, of all the biosensors developed, the one in which a GOx layer was immobilised by the encapsulation method showed the best performance, as it exhibited high sensitivity (8.7334 µA/log([Glu])) over a comprehensive linear detection range (0.75–40 mM) with an LOD of 0.078 mM.
3.3.2. Selectivity Studies
Selectivity studies were performed to determine how serum species could potentially influence the response of the biosensor to the glucose target. The species analysed were ascorbic acid, uric acid, creatinine and urea.
As can be seen in Figure 7, none of the species caused interference of more than 15%. From this we can conclude that the biosensors developed by adsorption (Figure 7A) and encapsulation methods (Figure 7B) are highly selective for glucose.
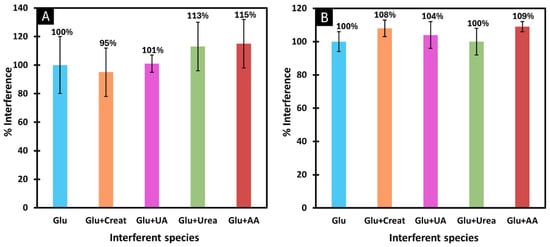
Figure 7.
Selectivity studies using a competitive method between glucose and the interfering species, after immobilisation of GOx by adsorption (A) and by encapsulation (B). The interfering species studied were creatinine, uric acid, urea and ascorbic acid.
3.4. Machine Learning Results
The best models obtained for each of the output variables analysed were plotted, as shown in Figure 8. The DT algorithm showed the best performance in predicting the parameters of the calibration curve: b (R2 = 0.979; CIV = number of BGr layers, time, [enzyme], [dopamine], LL current, UL current), m (R2 = 0.905; CIV = number of BGr layers, UL current), UL (R2 = 0.953; CIV = number of BGr layers, time, [enzyme], [dopamine], [Glu], LL current) and LL (R2 = 0.830; CIV = time, [enzyme], [dopamine], [Glu], LL current). This can be explained by the fact that the dataset used for this task was small. In contrast, for glucose prediction, for which a larger dataset was used, the model that performed better was the MLP (R2 = 0.828; CIV = number of BGr layers, time, [enzyme], [dopamine], current). Since models with coefficients of determination greater than 0.8 were obtained for all the output variables analysed, it can be concluded that the algorithms developed have a good predictive capacity for the proposed tasks.
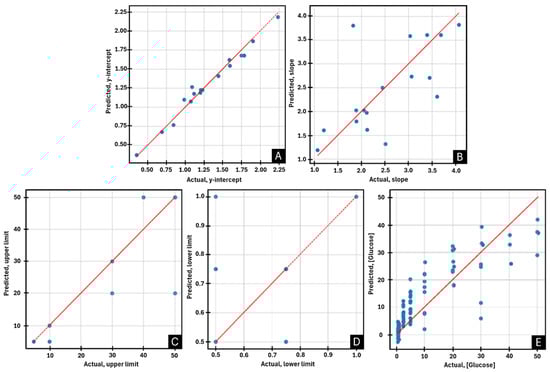
Figure 8.
Scatter plots illustrating the predictive performance of the best machine learning models for the following parameters: (A) y-intercept, (B) slope, (C) upper limit, (D) lower limit, and (E) glucose concentration.
4. Conclusions
By immobilising a GOx layer by the encapsulation method, a highly sensitive biosensor (8.7334 µA/log([Glu])) was obtained for a linear detection range between 0.75 mM and 40 mM with high selectivity for glucose. It could be seen that the use of more GOx layers leads to higher sensitivity but shortens the linear detection range. In addition, the encapsulation method resulted in biosensors with higher sensitivity than the adsorption method.
The DT algorithms proved capable of predicting the values b, m, UL and LL of a calibration curve with high reliability. The same could be observed considering the MLR algorithm for glucose concentration. It should be noted that the data set used was not very extensive. A larger amount of data could improve predictive ability. Similarly, increasing the number of iterations could lead to more reliable results. However, it is possible to change and test even more combinations of hyperparameters of the analysed models to obtain even better performances. Another way to improve these algorithms would be to include even more input variables that might affect the performance of a biosensor, such as the temperature at the time of measurement, the pH of the samples or even the enzyme solutions, the humidity and much more. It should also be noted that these data refer to glucose solutions in 50-fold diluted and filtered CS. An interesting study would be the prediction of calibration curves and glucose concentrations for human blood samples, considering all concentrations of interfering factors in human blood that could influence the measurements. Ideally, each biosensor should only be used once, as each measurement could influence subsequent results, especially through the loss of enzyme. The datasets in this work contain consecutive readings for different biosensors, which could also affect the performance of the algorithms and complicate the prediction work. Another interesting study would be to create a similar dataset to the one used, but this time perform only a single measurement for each biosensor. Although this study would require more resources and time, it would be possible to ensure a more secure analysis of the data and further improve the performance of the algorithms.
In conclusion, this study suggests that ML and nonlinear regression models can be used in the field of biosensors to predict their calibration curves without the need to perform the traditional calibration process, or even to predict the glucose concentration in samples without the need for calibration. This can reduce time, resources and money and ensures a more reliable measurement, as the biosensor has not undergone such a process and maintains the best quality.
Supplementary Materials
The following supporting information can be downloaded at: https://www.mdpi.com/article/10.3390/chemosensors13020052/s1. Figure S1. Graphical representation of CV readings in PBS buffer, comparing measurements before and after biographene fixation; Figure S2. Calibration curves obtained in CS after the adsorption-based immobilization of the GOx enzyme with one layer (A) and two layers (B), showing the current response as a function of logarithmic glucose concentration at 120 s; Figure S3. Calibration curves obtained in CS after the encapsulation-based immobilization of the GOx enzyme with one layer (A) and two layers (B), showing the current response as a function of logarithmic glucose concentration at 120 s.
Author Contributions
Conceptualization, F.T.C.M. and J.L.; methodology, A.A., D.d.S.O. and I.V.; validation, A.A., J.L. and A.I.P.; formal analysis, A.A., J.A.A., J.L., D.C. and A.I.P.; investigation, A.A., I.V., F.T.C.M. and J.L.; resources: F.T.C.M.; data curation: A.A., D.C., D.d.S.O. and J.L.; writing—A.A. and D.d.S.O.; writing—F.T.C.M., J.L., D.C., J.A.A. and A.I.P.; supervision, F.T.C.M., J.L., J.A.A. and D.C. All authors have read and agreed to the published version of the manuscript.
Funding
The authors acknowledge the financial support from the IBEROS+ project (Instituto de Biofabricación en Red para el Envejecimiento Saludable, INTERREG POCTEP/0072_IBEROS_MAIS_1_E) within the cooperation region of Galicia/Spain and North of Portugal. Additionally, they would like to thank the partial support from the Portuguese Foundation for Science and Technology (FCT), through grants UIDB/04730/2020 and NotUIDP/04730/2020.
Institutional Review Board Statement
Not applicable.
Informed Consent Statement
Not applicable.
Data Availability Statement
Data are contained within the article.
Conflicts of Interest
The authors declare no conflict of interest.
References
- Chetty, V.K.; Narayan, V. Diabetes 2030: Impact of globalization. Diabetes 2006, 55, A268–A269. [Google Scholar]
- Hu, F.B. Globalization of Diabetes The role of diet, lifestyle, and genes. Diabetes Care 2011, 34, 1249–1257. [Google Scholar] [CrossRef] [PubMed]
- International Diabetes Federation. Available online: https://idf.org/about-diabetes/what-is-diabetes/ (accessed on 1 February 2019).
- Elliott, T.; Pfotenhauer, K. Classification and Diagnosis of Diabetes. Prim. Care 2022, 49, 191–200. [Google Scholar] [CrossRef]
- Boylan, M. Part 3: Dietary and lifestyle factors in the management of type 2 diabetes mellitus. J. Aust. Tradit.-Med. Soc. 2007, 13, 89–92. [Google Scholar]
- Shahrestanaki, E.; Khonsari, N.; Seif, E.; Baygi, F.; Ejtahed, H.; Sheidaei, A.; Djalalinia, S.; Magliano, D.; Qorbani, M. The worldwide trend in diabetes awareness, treatment, and control from 1985 to 2022: A systematic review and meta-analysis of 233 population-representative studies. Front. Public Health 2024, 12, 1305304. [Google Scholar] [CrossRef]
- Zhou, B.; Lu, Y.; Hajifathalian, K.; Bentham, J.; Di Cesare, M.; Danaei, G.; Bixby, H.; Cowan, M.; Ali, M.; Taddei, C.; et al. Worldwide trends in diabetes since 1980: A pooled analysis of 751 population-based studies with 4.4 million participants. Lancet 2016, 387, 1513–1530. [Google Scholar] [CrossRef]
- Zhang, J.; Zhang, Z.; Zhang, K.; Ge, X.; Sun, R.; Zhai, X. Early detection of type 2 diabetes risk: Limitations of current diagnostic criteria. Front. Endocrinol. 2023, 14, 1260623. [Google Scholar] [CrossRef]
- Lee, T.; Kim, I.; Cheong, D.; Roh, S.; Jung, H.; Lee, S.; Kim, H.; Yoon, D.; Hong, Y.; Lee, G. Selective colorimetric urine glucose detection by paper sensor functionalized with polyaniline nanoparticles and cell membrane. Anal. Chim. Acta 2021, 1158, 338387. [Google Scholar] [CrossRef] [PubMed]
- Neubauerova, K.; Carneiro, M.; Rodrigues, L.R.; Moreira, F.T.C.; Sales, M.G.F. Nanocellulose-based biosensor for colorimetric detection of glucose. Sens. Bio-Sens. Res. 2020, 29, 100368. [Google Scholar] [CrossRef]
- Pinheiro, T.; Ferrao, J.; Marques, A.C.; Oliveira, M.J.; Batra, N.M.; Costa, P.; Macedo, M.P.; Aguas, H.; Martins, R.; Fortunato, E. Paper-Based In-Situ Gold Nanoparticle Synthesis for Colorimetric, Non-Enzymatic Glucose Level Determination. Nanomaterials 2020, 10, 2027. [Google Scholar] [CrossRef] [PubMed]
- Zhu, W.; Hao, N.; Yang, X.; Wang, K. Cascade-catalyzed Enzyme-free Colorimetric Detection of Glucose Based on Manganese Dioxide-oxygen Doped Carbon Nitride Composites. Chin. J. Anal. Chem. 2020, 48, 727–732. [Google Scholar] [CrossRef]
- Luo, X.G.; Xia, J.; Jiang, X.Y.; Yang, M.R.; Liu, S.L. Cellulose-Based Strips Designed Based on a Sensitive Enzyme Colorimetric Assay for the Low Concentration of Glucose Detection. Anal. Chem. 2019, 91, 15461–15468. [Google Scholar] [CrossRef] [PubMed]
- Wang, C.; Tan, R.; Li, L.; Liu, D. Dual-modal Colorimetric and Fluorometric Method for Glucose Detection Using Mn2 Sheets and Carbon Quantum Dots. Chem. Res. Chin. Univ. 2019, 35, 767–774. [Google Scholar] [CrossRef]
- Wang, X.; Li, F.; Cai, Z.Q.; Liu, K.F.; Li, J.; Zhang, B.Y.; He, J.B. Sensitive colorimetric assay for uric acid and glucose detection based on multilayer-modified paper with smartphone as signal readout. Anal. Bioanal. Chem. 2018, 410, 2647–2655. [Google Scholar] [CrossRef]
- Kang, B.H.; Park, M.; Jeong, K.H. Colorimetric Schirmer Strip for Tear Glucose Detection. Biochip J. 2017, 11, 294–299. [Google Scholar] [CrossRef]
- de Courten, D.; Baumann, L.; Scherer, L.; Wolf, M. Opto-fluidic chip for continuous inline monitoring of glucose with kinetic enzymatic fluorescence detection. In Proceedings of the 26th European Conference on Solid-State Transducers, Eurosensor 2012, Krakow, Poland, 9–12 September 2012; pp. 1203–1206. [Google Scholar]
- Ahn, J.; Kim, H.; Park, K.; Park, H. A Personal Glucose Meter for Label-Free and Washing-Free Biomolecular Detection. Anal. Chem. 2018, 90, 11340–11343. [Google Scholar] [CrossRef] [PubMed]
- Kim, H.; Ahn, J.; Park, K.; Park, H. Portable glucose meter-based label-free strategy for target DNA detection. Sens. Actuators B-Chem. 2020, 310, 127808. [Google Scholar] [CrossRef]
- Nguyen, H.H.; Lee, S.H.; Lee, U.J.; Fermin, C.D.; Kim, M. Immobilized Enzymes in Biosensor Applications. Materials 2019, 12, 121. [Google Scholar] [CrossRef]
- Tong, X.; Jiang, L.; Ao, Q.; Lv, X.; Song, Y.; Tang, J. Highly stable glucose oxidase polynanogel@MXene/chitosan electrochemical biosensor based on a multi-stable interface structure for glucose detection. Biosens. Bioelectron. 2024, 248, 115942. [Google Scholar] [CrossRef]
- De Zio, S.; Becconi, M.; Soldà, A.; Malferrari, M.; Lesch, A.; Rapino, S. Glucose micro-biosensor for scanning electrochemical microscopy characterization of cellular metabolism in hypoxic microenvironments. Bioelectrochemistry 2023, 150, 108343. [Google Scholar] [CrossRef] [PubMed]
- Khosravi, S.; Soltanian, S.; Servati, A.; Khademhosseini, A.; Zhu, Y.; Servati, P. Screen-Printed Textile-Based Electrochemical Biosensor for Noninvasive Monitoring of Glucose in Sweat. Biosensors 2023, 13, 684. [Google Scholar] [CrossRef] [PubMed]
- Reza, M.; Song, H.; Lee, Y.; Asaduzzaman, M.; Cha, C.; Park, J. An Electrochemical Microneedle Biosensor with Wide Linear Range for Continuous Glucose Monitoring. In Proceedings of the 2023 IEEE Sensors, Vienna, Austria, 29 October–1 November 2023. [Google Scholar]
- Zhao, Y.; Huang, J.; Huang, Q.; Tao, Y.; Gu, R.; Li, H.; Liu, H. Electrochemical biosensor employing PbS colloidal quantum dots/Au nanospheres-modified electrode for ultrasensitive glucose detection. Nano Res. 2023, 16, 4085–4092. [Google Scholar] [CrossRef]
- Kumar, P.; Nesakumar, N.; Gopal, J.; Sivasubramanian, S.; Vedantham, S.; Rayappan, J. Clinical validation of electrochemical biosensor for the detection of methylglyoxal in subjects with type-2 diabetes mellitus. Bioelectrochemistry 2024, 155, 108601. [Google Scholar] [CrossRef] [PubMed]
- Mahobiya, S.; Balayan, S.; Chauhan, N.; Rosario, W.; Kuchhal, N.; Islam, S.; Jain, U. Fabricating a rapid and low-cost electrochemical biosensor with imprints of glycated albumin molecules to detect diabetes using bimetallic Au-Pt nanoparticles on μSPE. Appl. Surf. Sci. Adv. 2023, 16, 100425. [Google Scholar] [CrossRef]
- Dawson, K.; Baudequin, M.; O’Riordan, A. Single on-chip gold nanowires for electrochemical biosensing of glucose. Analyst 2011, 136, 4507–4513. [Google Scholar] [CrossRef] [PubMed]
- Gengan, S.; Gnanamuthu, R.; Sankaranarayanan, S.; Reddy, V.; Marepally, B.; Biroju, R. Electrochemical modified Pt nanoflower @ rGO for non-enzymatic electrochemical sensing of glucose. Sens. Actuators A-Phys. 2023, 353, 114232. [Google Scholar] [CrossRef]
- Govindaraj, M.; Srivastava, A.; Muthukumaran, M.; Tsai, P.; Lin, Y.; Raja, B.; Rajendran, J.; Ponnusamy, V.; Selvi, J. Current advancements and prospects of enzymatic and non-enzymatic electrochemical glucose sensors. Int. J. Biol. Macromol. 2023, 253, 126680. [Google Scholar] [CrossRef]
- Jiang, D.; Liu, T.; Chu, Z.; Wang, Y. Advances in nanostructured material-based non-enzymatic electrochemical glucose sensors. Anal. Methods 2023, 15, 6344–6361. [Google Scholar] [CrossRef]
- Welch, E.C.; Powell, J.M.; Clevinger, T.B.; Fairman, A.E.; Shukla, A. Advances in Biosensors and Diagnostic Technologies Using Nanostructures and Nanomaterials. Adv. Funct. Mater. 2021, 31, 2104126. [Google Scholar] [CrossRef]
- Hayat, A.; Catanante, G.; Marty, J.L. Current Trends in Nanomaterial-Based Amperometric Biosensors. Sensors 2014, 14, 23439–23461. [Google Scholar] [CrossRef] [PubMed]
- Sassolas, A.; Blum, L.J.; Leca-Bouvier, B.D. Immobilization strategies to develop enzymatic biosensors. Biotechnol. Adv. 2012, 30, 489–511. [Google Scholar] [CrossRef]
- Pattammattel, A.; Kumar, C.V. Kitchen Chemistry 101: Multigram Production of High Quality Biographene in a Blender with Edible Proteins. Adv. Funct. Mater. 2015, 25, 7088–7098. [Google Scholar] [CrossRef]
- Ben Hassine, A.; Raouafi, N.; Moreira, F.T.C. Novel biomimetic Prussian blue nanocubes-based biosensor for Tau-441 protein detection. J. Pharm. Biomed. Anal. 2023, 226, 115251. [Google Scholar] [CrossRef] [PubMed]
- Holzinger, M.; Le Goff, A.; Cosnier, S. Nanomaterials for biosensing applications: A review. Front. Chem. 2014, 2, 63. [Google Scholar] [CrossRef]
- Cao, L.Y.; Liu, Y.L.; Zhang, B.H.; Lu, L.H. In situ Controllable Growth of Prussian Blue Nanocubes on Reduced Graphene Oxide: Facile Synthesis and Their Application as Enhanced Nanoelectrocatalyst for H2O2 Reduction. Acs Appl. Mater. Interfaces 2010, 2, 2339–2346. [Google Scholar] [CrossRef]
- Pumera, M. Graphene-based nanomaterials and their electrochemistry. Chem. Soc. Rev. 2010, 39, 4146–4157. [Google Scholar] [CrossRef] [PubMed]
- Kazemi, N.; Abdolrazzaghi, M.; Light, P.; Musilek, P. In-human testing of a non-invasive continuous low-energy microwave glucose sensor with advanced machine learning capabilities. Biosens. Bioelectron. 2023, 241, 115668. [Google Scholar] [CrossRef] [PubMed]
- Kirubakaran, S.; Bennet, M.; Shanker, N. Non-Invasive antenna sensor based continuous glucose monitoring using pancreas dielectric radiation signal energy levels and machine learning algorithms. Biomed. Signal Process. Control 2023, 85, 105072. [Google Scholar] [CrossRef]
- Sharma, H.; Kalita, D.; Naskar, U.; Mishra, B.; Kumar, P.; Mirza, K. Prediction of Glucose Sensor Sensitivity in the Presence of Biofouling Using Machine Learning and Electrochemical Impedance Spectroscopy. IEEE Sens. J. 2023, 23, 18785–18797. [Google Scholar] [CrossRef]
- Stewart, M.; Warden, P.; Plancher, B.; Katti, S.; Reddi, V. Machine Learning Sensors. Commun. ACM 2023, 66, 25–28. [Google Scholar] [CrossRef]
- Giordano, G.; Ferreira, L.; Bezerra, I.; Barbosa, J.; Costa, J.; Pimentel, G.; Lima, R. Machine learning toward high-performance electrochemical sensors. Anal. Bioanal. Chem. 2023, 415, 3683–3692. [Google Scholar] [CrossRef] [PubMed]
- Yazici, I.; Shayea, I.; Din, J. A survey of applications of artificial intelligence and machine learning in future mobile networks-enabled systems. Eng. Sci. Technol.-Int. J.-Jestech 2023, 44, 101455. [Google Scholar] [CrossRef]
- Rather, N.; Simorangkir, R.; Buckley, J.; O’Flynn, B.; Tedesco, S. Evaluation of Machine Learning Models for a Chipless RFID Sensor Tag. In Proceedings of the 2023 17th European Conference on Antennas and Propagation, EUCAP, Florence, Italy, 26–31 March 2023. [Google Scholar]
- Kumar, C.; Pattammattel, A. BioGraphene: Direct Exfoliation of Graphite in a Kitchen Blender for Enzymology Applications. Ration. Des. Enzym.-Nanomater. 2016, 571, 225–244. [Google Scholar] [CrossRef]
- Labuda, J.; Brett, A.M.O.; Evtugyn, G.; Fojta, M.; Mascini, M.; Ozsoz, M.; Palchetti, I.; Palecek, E.; Wang, J. Electrochemical nucleic acid-based biosensors: Concepts, terms, and methodology (IUPAC Technical Report). Pure Appl. Chem. 2010, 82, 1161–1187. [Google Scholar] [CrossRef]
- Thevenot, D.R.; Toth, K.; Durst, R.A.; Wilson, G.S. Electrochemical biosensors: Recommended definitions and classification. Anal. Lett. 2001, 34, 635–659. [Google Scholar] [CrossRef]
Disclaimer/Publisher’s Note: The statements, opinions and data contained in all publications are solely those of the individual author(s) and contributor(s) and not of MDPI and/or the editor(s). MDPI and/or the editor(s) disclaim responsibility for any injury to people or property resulting from any ideas, methods, instructions or products referred to in the content. |
© 2025 by the authors. Licensee MDPI, Basel, Switzerland. This article is an open access article distributed under the terms and conditions of the Creative Commons Attribution (CC BY) license (https://creativecommons.org/licenses/by/4.0/).