Article

Liquid-Gated Graphene Field Effect Transistor for High-Performance Label-Free Sensing of Polycyclic Aromatic Hydrocarbons

1
Center for Advanced Analytical Science, Guangzhou Key Laboratory of Sensing Materials & Devices, Guangdong Engineering Technology Research Center for Photoelectric Sensing Materials & Devices, Key Laboratory of Optoelectronic Materials and Sensors in Guangdong Provincial Universities, School of Chemistry and Chemical Engineering, Guangzhou University, Guangzhou 510006, China
2
School of Chemical Engineering and Technology, Sun Yat-Sen University, Guangzhou 510006, China
*
Authors to whom correspondence should be addressed.
These authors contributed equally to this work.
Chemosensors 2025, 13(2), 56; https://doi.org/10.3390/chemosensors13020056
Submission received: 31 December 2024 / Revised: 2 February 2025 / Accepted: 5 February 2025 / Published: 7 February 2025

Abstract

:
Polycyclic aromatic hydrocarbons (PAHs) are one of the most toxic environmental pollutants, which are very harmful to the human body. It is crucial to find convenient and effective detection methods of PAHs for preventing and controlling environmental pollution. Low-dimensional material-based field effect transistor (FET) sensors exhibit the advantages of a small size, simple structure, fast response, and high sensitivity. In this work, graphene (Gr) has been selected as the channel material for FET sensors for PAH detections. Through π-π electron stacking interactions, PAHs could be spontaneously adsorbed on the surface of the Gr and affect its electronic carrier transport behavior. Based on the relationship between the concentrations and the changes in the Dirac point of the Gr, the sensor achieved an effective response to PAHs in a broad range from 10−10 to 10−6 mol/L and a limit of detection of 10−10 mol/L was obtained, which was lower than that provided by the World Health Organization (3.46 × 10⁻⁹ mol/L), in drinking water. The results demonstrate a great application of the FET sensors in environmental analysis, and provide an important way for rapid and in situ monitoring of PAHs.

1. Introduction

Polycyclic Aromatic Hydrocarbons (PAHs), a group of organic pollutants comprising two or more fused aromatic rings, mainly originate from improper industrial emissions, waste handling in chemical plants, and coal processing. Due to their hydrophobicity and lipid solubility, these contaminants tend to accumulate in aquatic organisms and undergo biomagnification through the food chain, posing toxic, mutagenic, and carcinogenic hazards to biological organs [1,2,3,4]. Thus, the permissible concentration for PAHs in drinking water has been set by the World Health Organization (WHO) at 3.46 × 10⁻⁹ mol/L [5]. Given the significant health risks posed by PAHs to humans, the rapid and precise detection of PAHs in water is important for environmental management and food safety. Currently, high-performance liquid chromatography [6], fluorescence spectrometry [7], and electrochemical immunoassays [8] have been employed for PAH detection. These techniques offer high accuracy and precision of analysis for it. However, the sample preparation process is cumbersome and requires expensive equipment, skilled technicians, and a relatively long analysis time. These techniques are suitable for quality supervision by administrative regulatory departments and are not well-suited for fast real-time testing requirements. Therefore, while developing the traditional laboratory quantitative detection and analysis methods, it is necessary to find a convenient, rapid, and sensitive method for the detection of PAHs for on-site detection.
Latif et al. developed a conductometric sensor based on molecularly imprinted polymers (MIPs) as the recognition layer for the detection of PAHs in water [9]. The sensor utilizes screen-printed interdigitated gold electrodes on a glass substrate, coated with a molecularly imprinted polyurethane layer, to achieve selectivity for its template molecules and exhibit high sensitivity. However, the sensitivity of such sensors to non-template PAHs may be low and the manufacturing processes are relatively complex. Qu and Li proposed a fluorescence detection method for PAHs, combining CdTe quantum dots (QDs) and cyclodextrins. By varying the cavity size of the cyclodextrin, only a specific PAH could bind, thereby quenching the quantum dots’ fluorescence [10]. However, the limit of detection of 0.58 μM for phenanthrene for this method do not meet the requirement of the WHO.
Field effect transistor (FET) chemical sensors, characterized by their low noise, low power consumption, ease of integration and miniaturization, exhibit promising applications in environmental monitoring, food safety, disease diagnosis, clinical treatment, and other fields [11,12,13,14]. Two-dimensional material-based FETs have attracted extensive interest due to their atomic-scale thickness, nanoscale dimensions, exceptional mechanical flexibility, and high specific surface area of the channel materials, making them an ideal platform for developing high-sensitivity sensors. The large specific surface area of the two-dimensional materials makes the impact of external stimuli on the transport properties of the devices very high. Graphene (Gr), as a typical two-dimensional material with hexagonally arranged carbon atoms, all of which are exposed on its surface, has been widely used as the channel materials of FET sensors for various analytes such as metal ions, biomolecules, and gas molecules [15,16,17,18]. In this study, based on the fact that π-electrons on the surface of Gr exhibit robust π-π electron stacking interactions with PAHs [19], a Gr-based FET sensor for high-performance label-free sensing of PAHs has been built. The pyrene molecule was selected as a representative material of PAHs for testing, which was predominant among the PAHs in the environment and a significant hazard for health and the environment [20]. A series of characterizations, including atomic force microscopy (AFM), Raman spectroscopy, ultraviolet-visible absorption spectroscopy (UV-vis), and carrier transport measurements (such as output and transfer curves), have been conducted to establish the fundamental mechanisms and relationships between the displacement of the Dirac point in the liquid-gated Gr-FET and PAHs. The detection limit of this sensing method for PAHs has been determined to be 10−10 mol/L, significantly exceeding the permissible concentration of PAHs set by the WHO (3.46 × 10⁻⁹ mol/L) in drinking water [5]. The liquid-gated Gr-FET sensing platform exhibits immense potential for the label-free, high-sensitivity, and simple detection of PAHs.

2. Materials and Methods

2.1. Reagents and Materials

The monolayer Gr film (>95%) was obtained from Nanjing MKNANO Tech. Co., Ltd., (Nanjing, China) and stored in a vacuum drying chamber. Poly (dimethyl siloxane) (PDMS) thin film was purchased from Wealth-Fun S&T Ltd., (Wuhan, China); Au (≥99.999%, 3 mm Au pellet) and Cr (≥99.5–99.99%, Cr pellet bulk) were purchased from Zhongnuo Advanced Material (Beijing) Technology Co., Ltd., (Beijing, China). Anhydrous ethanol (≥99.5%, analytical reagent grade, anhydrous) was purchased from Sinopharm Chemical Reagent Co., Ltd., (Shanghai, China). Acetone (≥99.5%, analytical reagent grade, anhydrous) was purchased from Guangzhou Chemical Reagent (Guangzhou, China). Isopropanol (≥99.5%, analytical reagent grade, anhydrous) was purchased from Shanghai Macklin Biochemical Technology Co., Ltd., (Shanghai, China). Pyrene, anthracene, phenacene, and phosphate-buffered saline (PBS) were purchased from Sigma-Aldrich (Shanghai, China).

2.2. Fabrication of Liquid-Gated Gr-FET Sensors

A liquid-gated Gr-FET was fabricated utilizing chemical vapor deposition (CVD)-grown monolayer Gr. The fabrication process primarily encompassed two steps: the first step involved oxygen plasma etching of Gr, and the second step comprised the electrode deposition process. The detailed process of the preparation is shown in Figure S1; a spin-coating process was initially employed to apply the AZ 5214 photoresist onto a silicon at speeds of 1000 r for 10 s and 4000 r for 60 s, and then baked at 150 °C for 2 min on a hot plate. Laser direct writing was performed using a Micro Writer ML3 (Durham, UK), followed by development with the RZX-3038 developer, yielding a clear photoresist pattern. The sample was then placed in an oxygen plasma etcher to remove the exposed Gr preventing short circuits in the device, after which acetone was used to remove the photoresist, obtaining the desired device channel material pattern. Then, photolithography was conducted to select appropriate electrodes. After that, thermal deposition of the Cr/Au (10 nm/60 nm in thickness) layer and a lift-off process took place to define the position and shape of drain and source electrodes. A PDMS film of suitable size was then applied, with a circular trench created in the center using a hole-punching tool, and affixed to the silicon bearing the device. PBS was added as the electrolyte solution.

2.3. Characterization

The surface morphology and thickness of the monolayer Gr film was measured by atomic force microscopy (Billerica, MA, USA) under the standard tapping mode. Raman spectra were obtained by a confocal Raman microscopic system (Paris, France) with an exciting laser wavelength of 532 nm, which was calibrated by the standard Si peak at 520.7 cm−1 before spectra collection. UV-vis absorption spectra were obtained using a UV-vis spectrophotometer (Kyoto, Japan). For the UV absorption spectra, a transmission mode of the spectrometer was utilized, with the “lg 1/T” serving as the vertical coordinate. All the electrical properties (transfer and output characteristics) and the sensing performance of liquid-gated Gr-FET were tested by using a Keithley 2636B (Solon, OH, USA) semiconductor analyzer combined with a probe platform in the ambient condition.

3. Results and Discussion

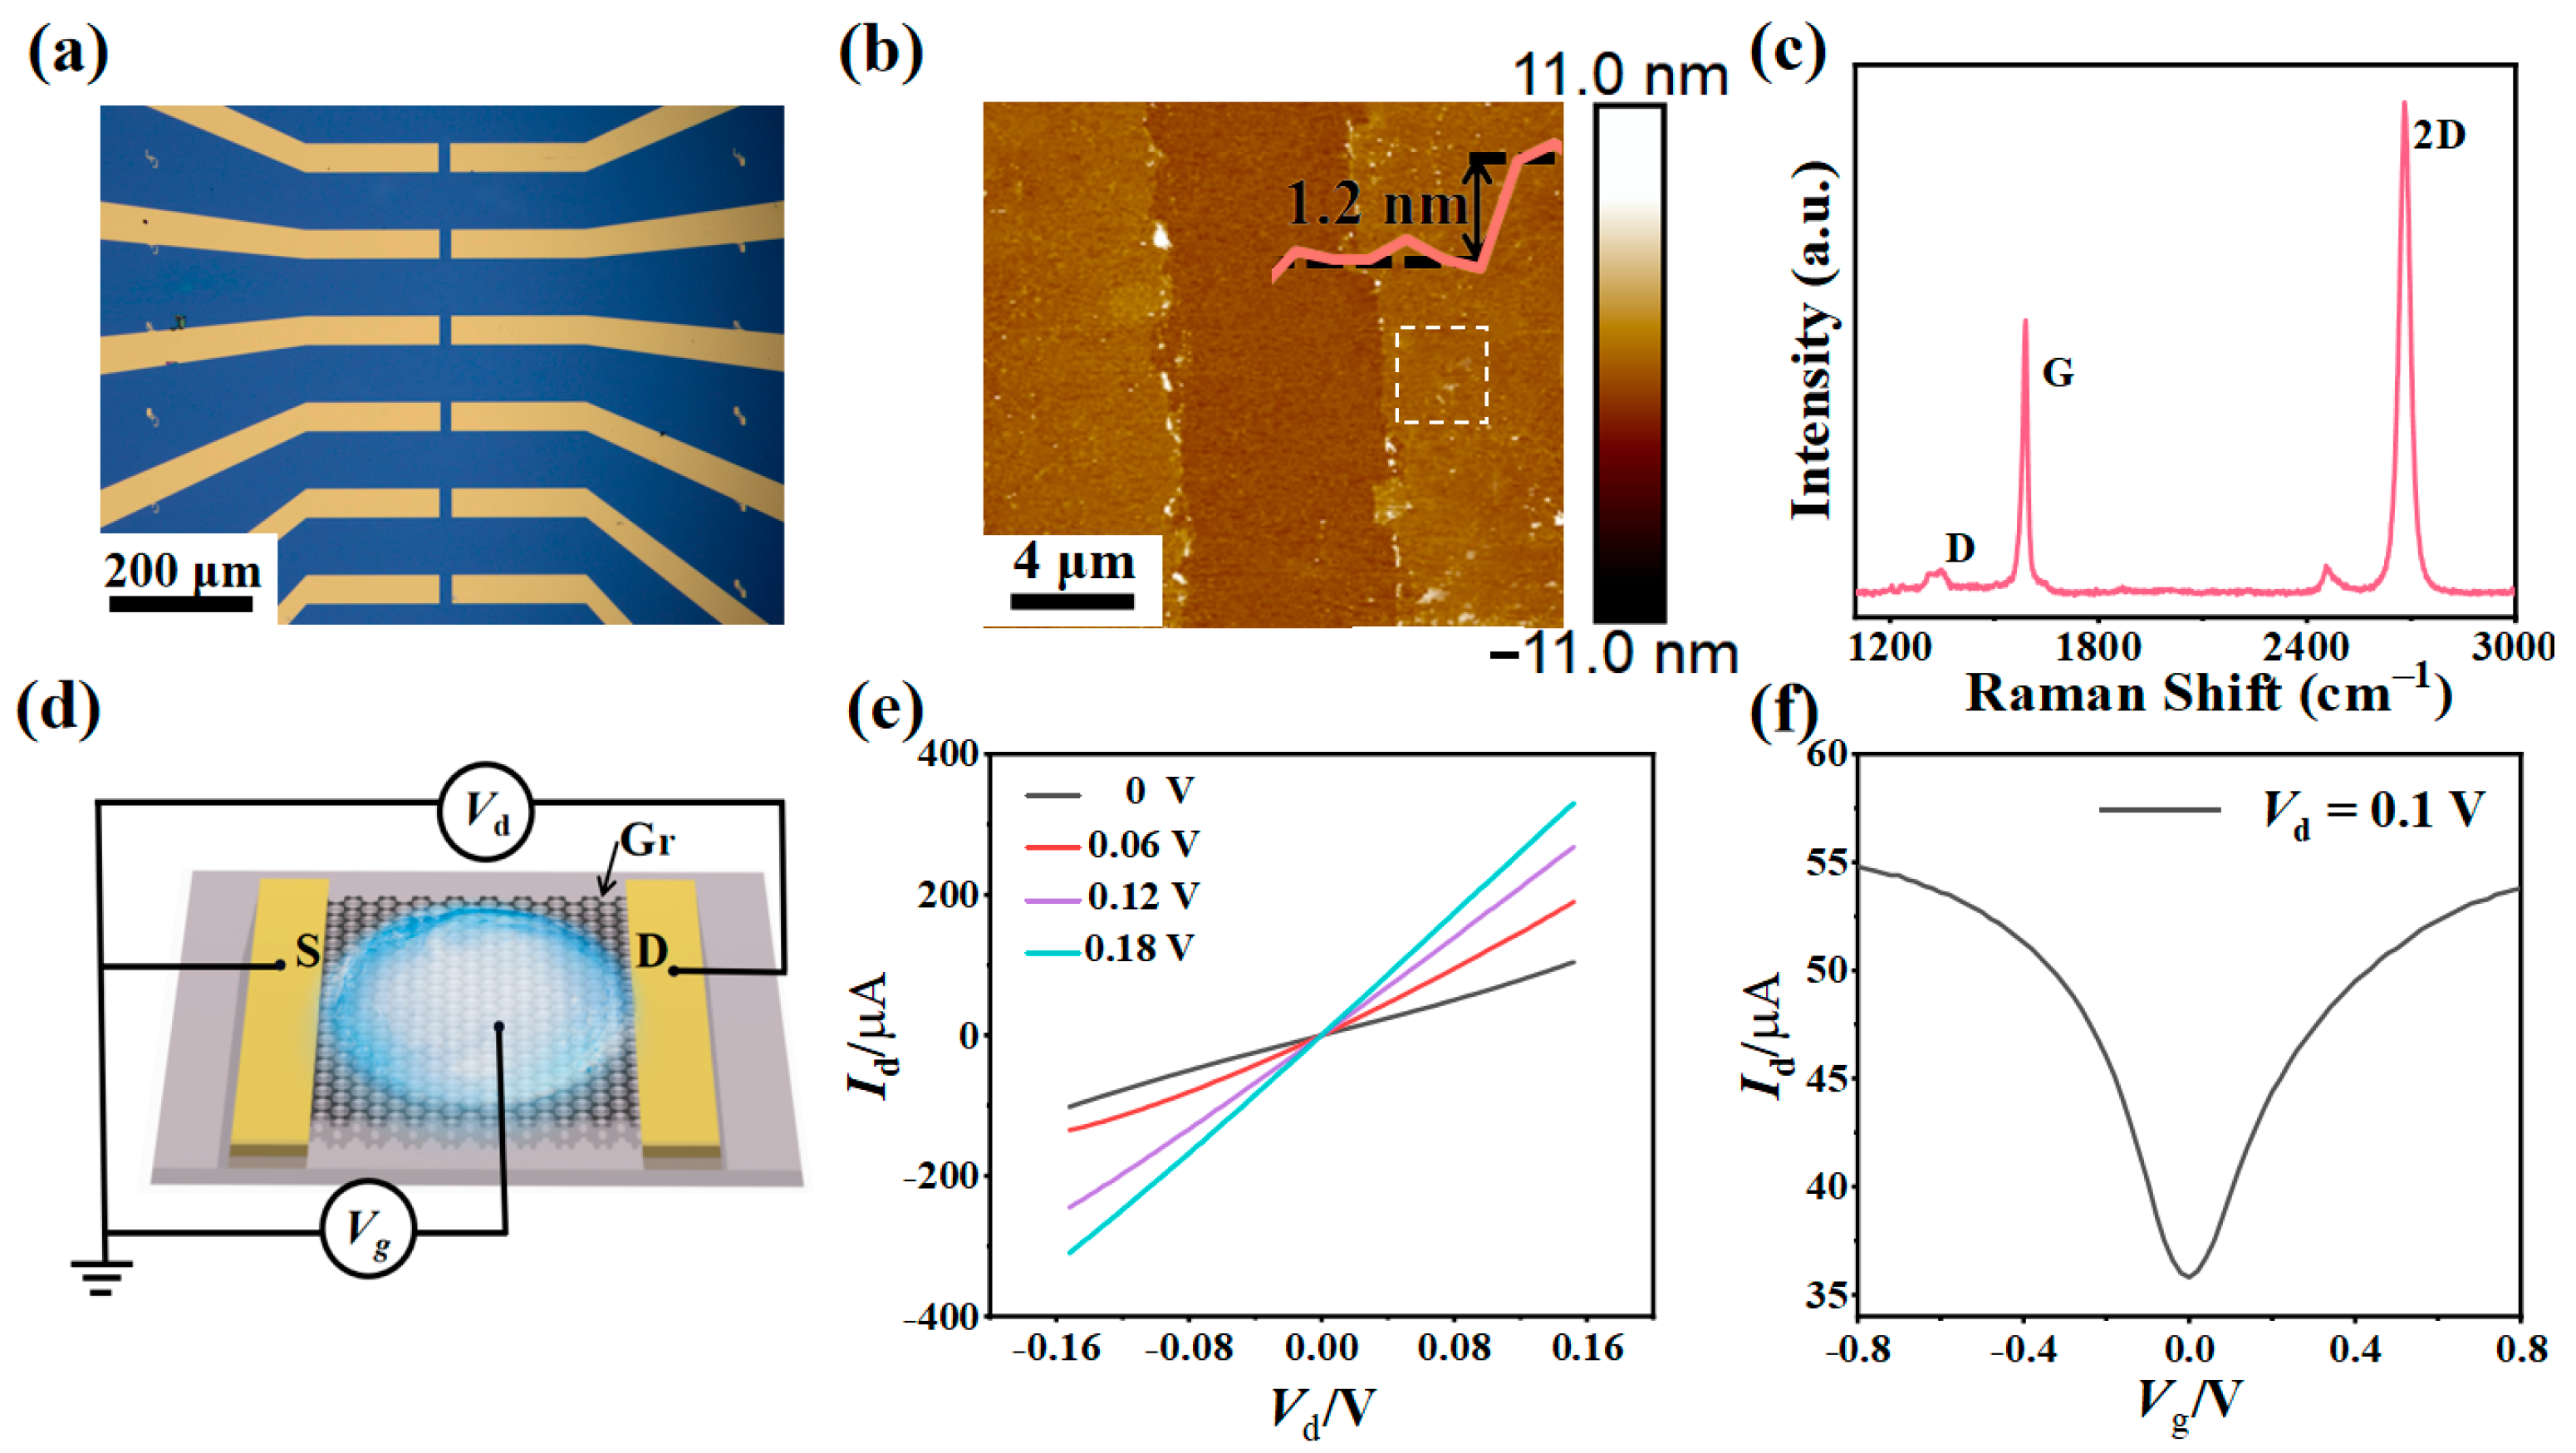
3.1. Structure and Electrical Properties of Liquid-Gated Gr-FET Sensor

The structural and electrical properties of the liquid-gated Gr-FET were characterized. An optical microscope image of the Gr-FET is depicted in Figure 1a, and reveals that the channel length and width of the device are 100 μm and 50 μm, respectively. AFM was employed to characterize the morphology and height of the Gr layer. As illustrated in Figure 1b, the thickness of the pristine Gr is estimated to be 1.20 nm, suggesting the presence of a monolayer of Gr. This thickness value, larger than the theoretical thickness of Gr (0.34 nm), is due to some adsorbed molecules on the interface between Gr and the substrate during the transfer process [21,22]. Based on the characteristic Raman D peak (the breathing mode of phonons of A1g symmetry), the G peak (the doubly degenerate zone center E2g mode), and the 2D peak (the second order of zone-boundary phonons), the number of layers, the defect density, and change in carrier concentration (electron or hole) in Gr could be revealed, as Raman spectroscopy is an effective method for the investigation of the intrinsic physical properties of carbon nanomaterials [23]. As illustrated in Figure 1c, typical Raman peaks at 1350.1 cm−1, 1593.6 cm−1, and 2694.3 cm−1 corresponding to the D peak, G peak and 2D peak could be observed [24]. The value of I2D/IG (the intensity ratio of 2D and G peak (I2D/IG = 2.02)) larger than 2.0 indicates the Gr has a monolayer structure [25].
The schematic structure of a liquid-gated Gr-FET is shown in Figure 1d, where a PDMS container was fixed on top of the transistor for holding the electrolyte solution. The electrolyte within the container establishes a connection between the gate and the source-drain electrodes, as well as the Gr channel. The detailed fabrication process of the device is illustrated in Figures S1 and S2. The output characteristics of the liquid-gated Gr-FET as a function of gate voltage (Vg) are shown in Figure 1e, with the Vg ranging from 0 to 0.18 V in steps of 0.06 V. The linear relation of the Id-Vd curve exhibited a highly stable ohmic contact between the Gr and source-drain electrodes, indicating that the liquid-gated Gr-FET sensor provided a reliable electrical signal for detection of the target analytes. The doping status of Gr was further investigated by the Id-Vg characteristics. As shown in Figure 1f, Gr exhibits ambipolar characteristics with a Dirac point at 0.0 V, where electron-dominated transport occurs at negative Vg and hole-dominated transport at positive Vg. The transfer characteristics of the same device before and after 6 days storage in air were tested to evaluate the stability of liquid-gated Gr-FET, which is an important factor for the practical application of the device as a sensing platform. As shown in Figure S3, almost no change could be seen from the device after 5 days, indicating that the liquid-gated Gr-FET device has good environmental stability.

3.2. Sensing Mechanism of Liquid-Gated Gr-FET Sensor

Based on the non-covalent π-π interactions between PAHs and carbon materials reported before [26], the sensing potential of PAHs was initially assessed by the liquid-gated Gr-FET device, the adsorption schematic of which is illustrated in Figure 2a. The AFM characterization of the morphology and height of Gr following the adsorption of pyrene solution is depicted in Figure 2b. The thickness of Gr increased from an initial 1.2 nm to 2.6 nm after exposure to the pyrene solution, and the surface roughness increased from 0.53 nm to 0.96 nm, indicating the successful adsorption of pyrene molecules onto Gr. Furthermore, the surface roughness at the SiO2 positions remained unaltered, suggesting that pyrene displays selective adsorption behavior to Gr. To further validate the successful adsorption of pyrene, UV-Vis was employed to investigate. The UV-vis absorption spectra of the 1.00 × 10⁻⁹ mol/L pyrene solution is shown as the black line in Figure 2c. A Gr film on a silicon slice 1 × 1 cm in size was then added to the solution. After five minutes, the Gr film was taken out and the UV-vis absorption of the treated pyrene solution was tested, as shown by the red line in Figure 2c. In comparison, a significant decrease in absorbance in the UV-vis spectra proves that the pyrene molecules were successfully adsorbed on the Gr film [20].
The electrical properties of the device were studied to explore the interaction between pyrene and Gr. The transfer characteristic curves of liquid-gate Gr-FET before and after the adsorption of the pyrene solution are depicted in Figure 3a. When pyrene at a concentration of 1 μL 10−6 mol/L was adsorbed onto Gr, the transfer curves (depicted in red line) exhibit a negative voltage shift, with the Dirac point moving from 0.0 V to −0.192 V, indicating the occurrence of N-type doping to the channel materials of the device. To deeply investigate the doping effect of pyrene on Gr, Raman characterization was carried out. The shift variations of the Raman characteristic peaks are indicators of the doping effect of the Gr, and their intensity ratio (I2D/IG) can provide significant clues for understanding the charge transfer process within the sample. The characteristic Raman spectra of Gr before and after adsorption of pyrene solution are presented in Figure 3b and Figure S4, which was calibrated by Si standard silicon peaks. The G peak exhibits a shift from 1593.5 cm−1 to 1590.5 cm−1, the 2D peak displays a shift from 2694.3 cm−1 to 2686.7 cm−1, and the D peak shows a shift from 1346.9 cm−1 to 1343.8 cm−1. The observed shifts of the characteristic peaks to lower wavenumbers are indicative of an N-doping effect [27,28], which is caused by the π-π interactions between pyrene and Gr. As illustrated in Table S1, the peak intensity ratio of I2D/IG demonstrates a decrease from 2.19 to 1.91. It proves a charge transfer process between pyrene and Gr exists, which indicates the pyrene molecules acting as electron donors to increase the electron concentration in the Gr. This leads to the Fermi level (Ef) of Gr being driven above the Dirac point near the bottom of the conduction band, which in turn results in N-type doping, as shown in Figure 3c.

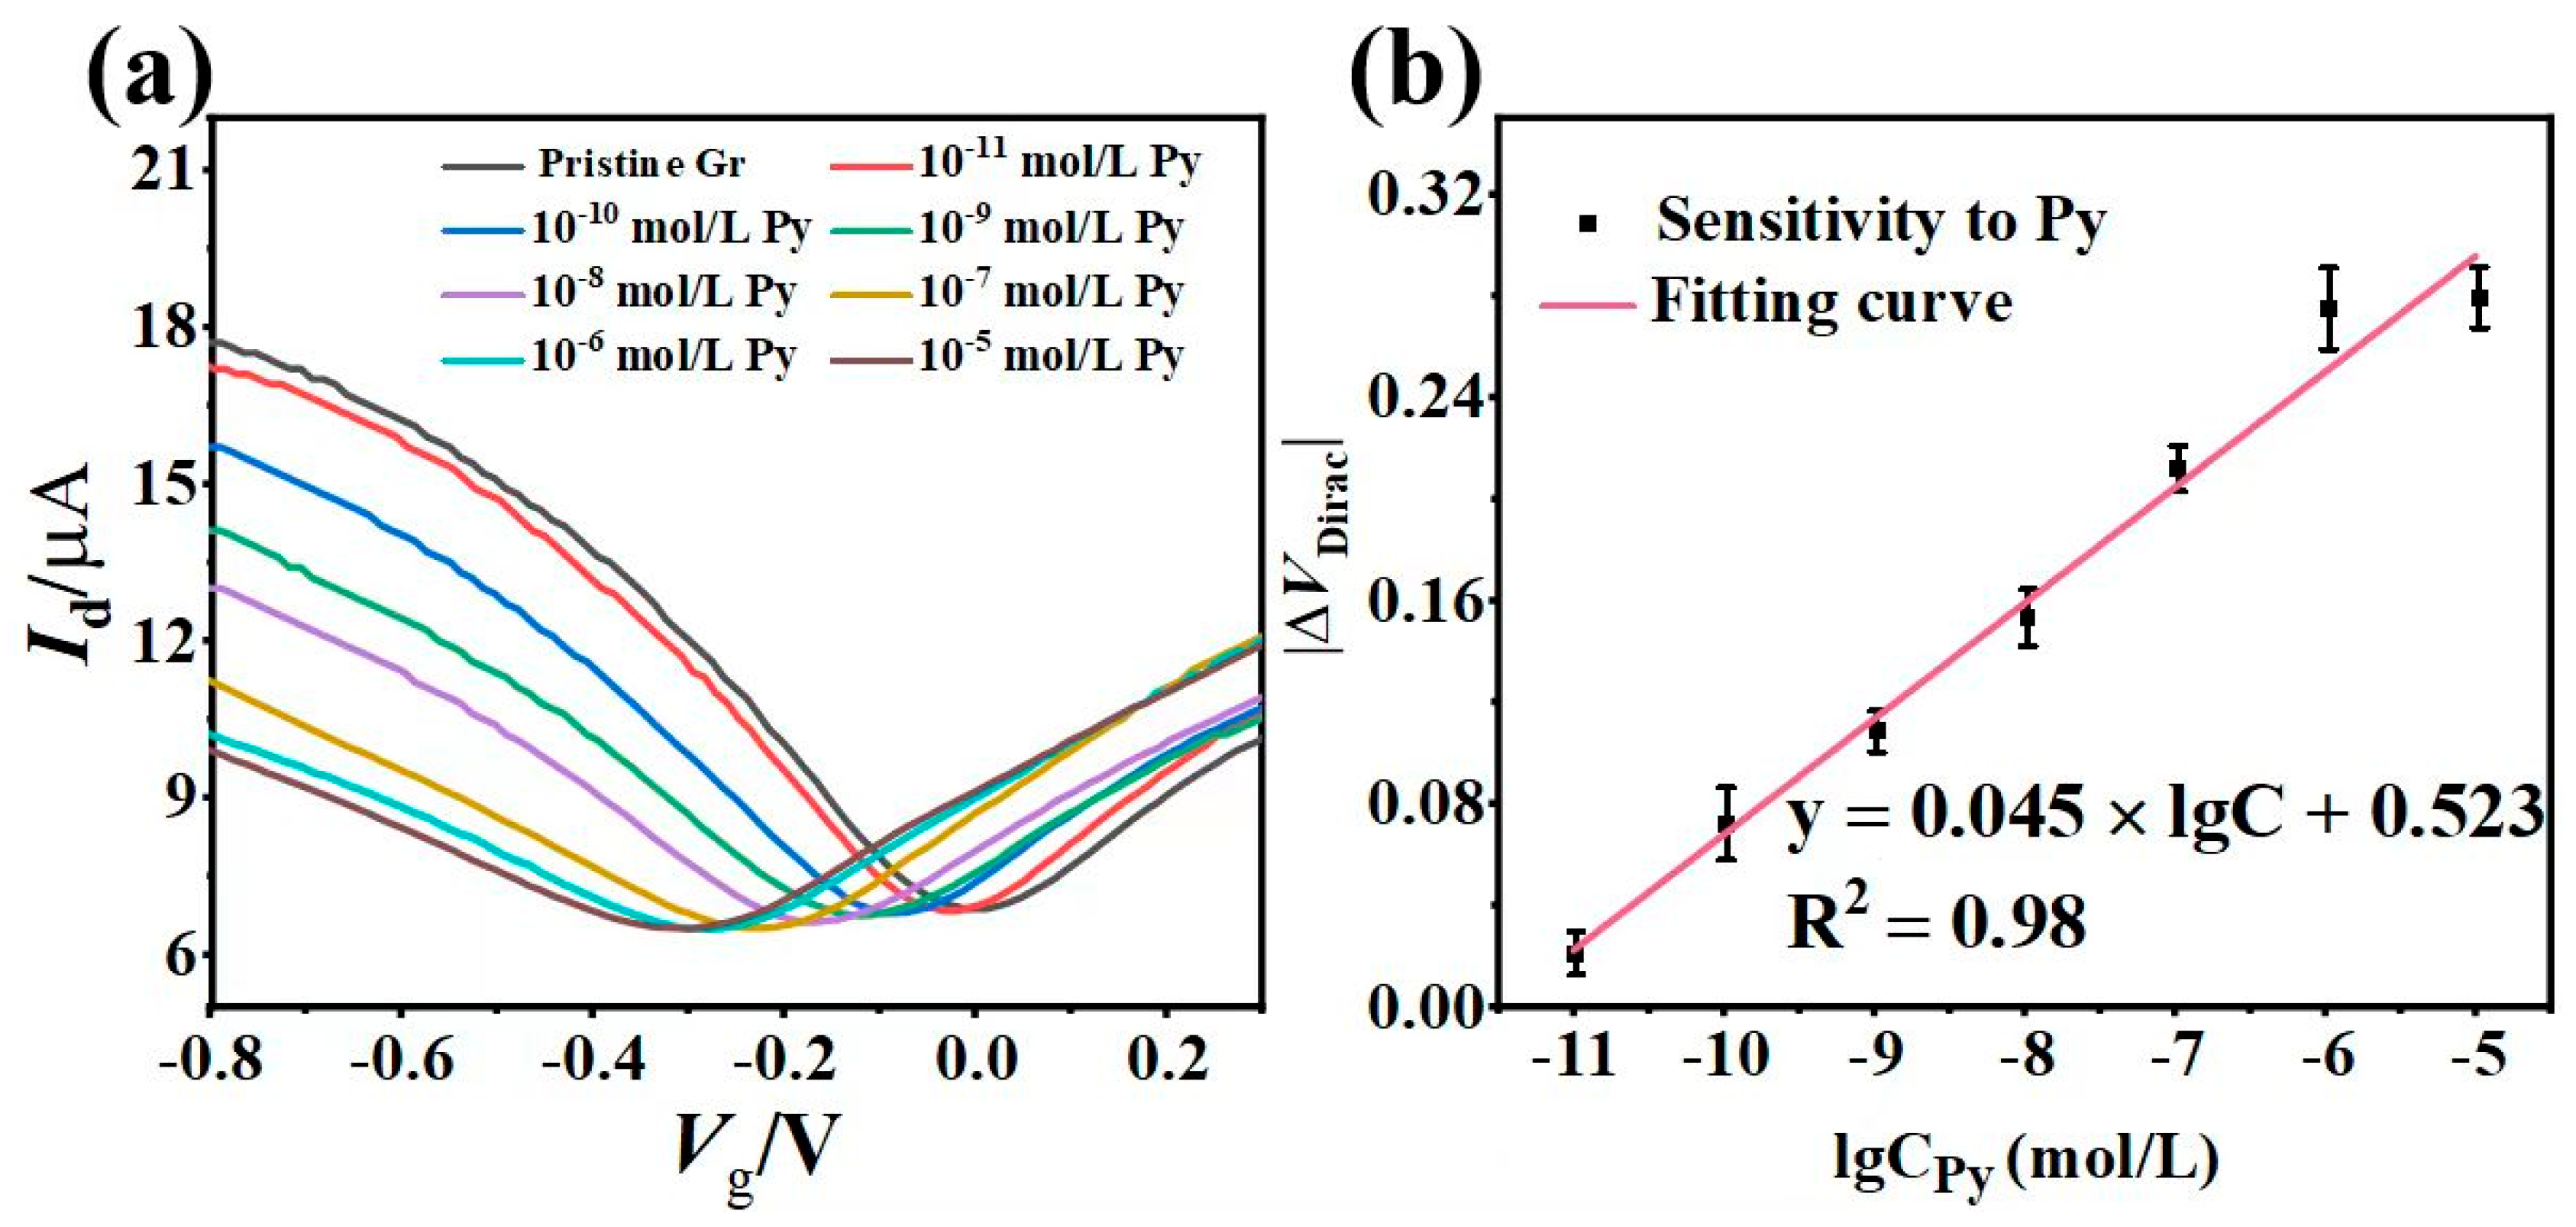
3.3. Pyrene Detection with the Liquid-Gated Gr-FET Sensor

As the adsorption between pyrene and Gr affects the electrical properties of liquid-gated Gr-FETs, the analytical relationships and analytical methods were further studied, as follows. The optimal adsorption time was firstly explored by introducing the 1 μL pyrene solution with a concentration of 10−9 mol/L into the liquid-gated Gr-FET. The transfer characteristic curves tested at 0 s, 30 s, 60 s, 90 s, 120 s, and 150 s are shown in Figure S5. It was observed that as the adsorption time increased, the trend in the Dirac point shift weakened. When the adsorption time exceeded 2 min, the liquid-gated Gr-FET reached its sensing saturation. In this case, adsorption time for the following research on the relationship between concentration and the Dirac point shift of the device was fixed to be 2 min. The transfer characteristics of the liquid-gated Gr-FET in response to varying concentrations of pyrene are illustrated in Figure 4a. It is observed that as the concentration of pyrene increases, and the Dirac point of the liquid-gated Gr-FET shifts towards the negative voltage direction, indicating an increasing number of pyrene molecules adsorbing onto Gr. To further demonstrate the feasibility of the liquid-gated Gr-FET sensor for quantitative detection of PAHs, five parallel experiments were conducted for establishing a relationship between the shift in the Dirac voltage (ΔVDirac) and the logarithm of pyrene concentration, as depicted in Figure 4b. A linear relationship of the |ΔVDirac| with pyrene concentration was obtained, which was fitted as y = 0.045 × lgC + 0.523 (R2 = 0.98) in the range of 10−11 to 10−5 mol/L. For the pyrene sample with a concentration of 10−11 mol/L, the signal-to-noise ratio of the parallel testing result is less than 3 (0.022/0.009 = 2.53), whereas for the pyrene sample with a concentration of 10−10 mol/L, the signal-to-noise ratio was greater than 3 (0.073/0.014 = 5.21). This demonstrates that the lowest detection limit of the liquid-gated Gr-FET for pyrene is 10−10 mol/L, which is lower than the permissible concentration of PAHs set by the WHO at 3.46 × 10⁻⁹ mol/L.

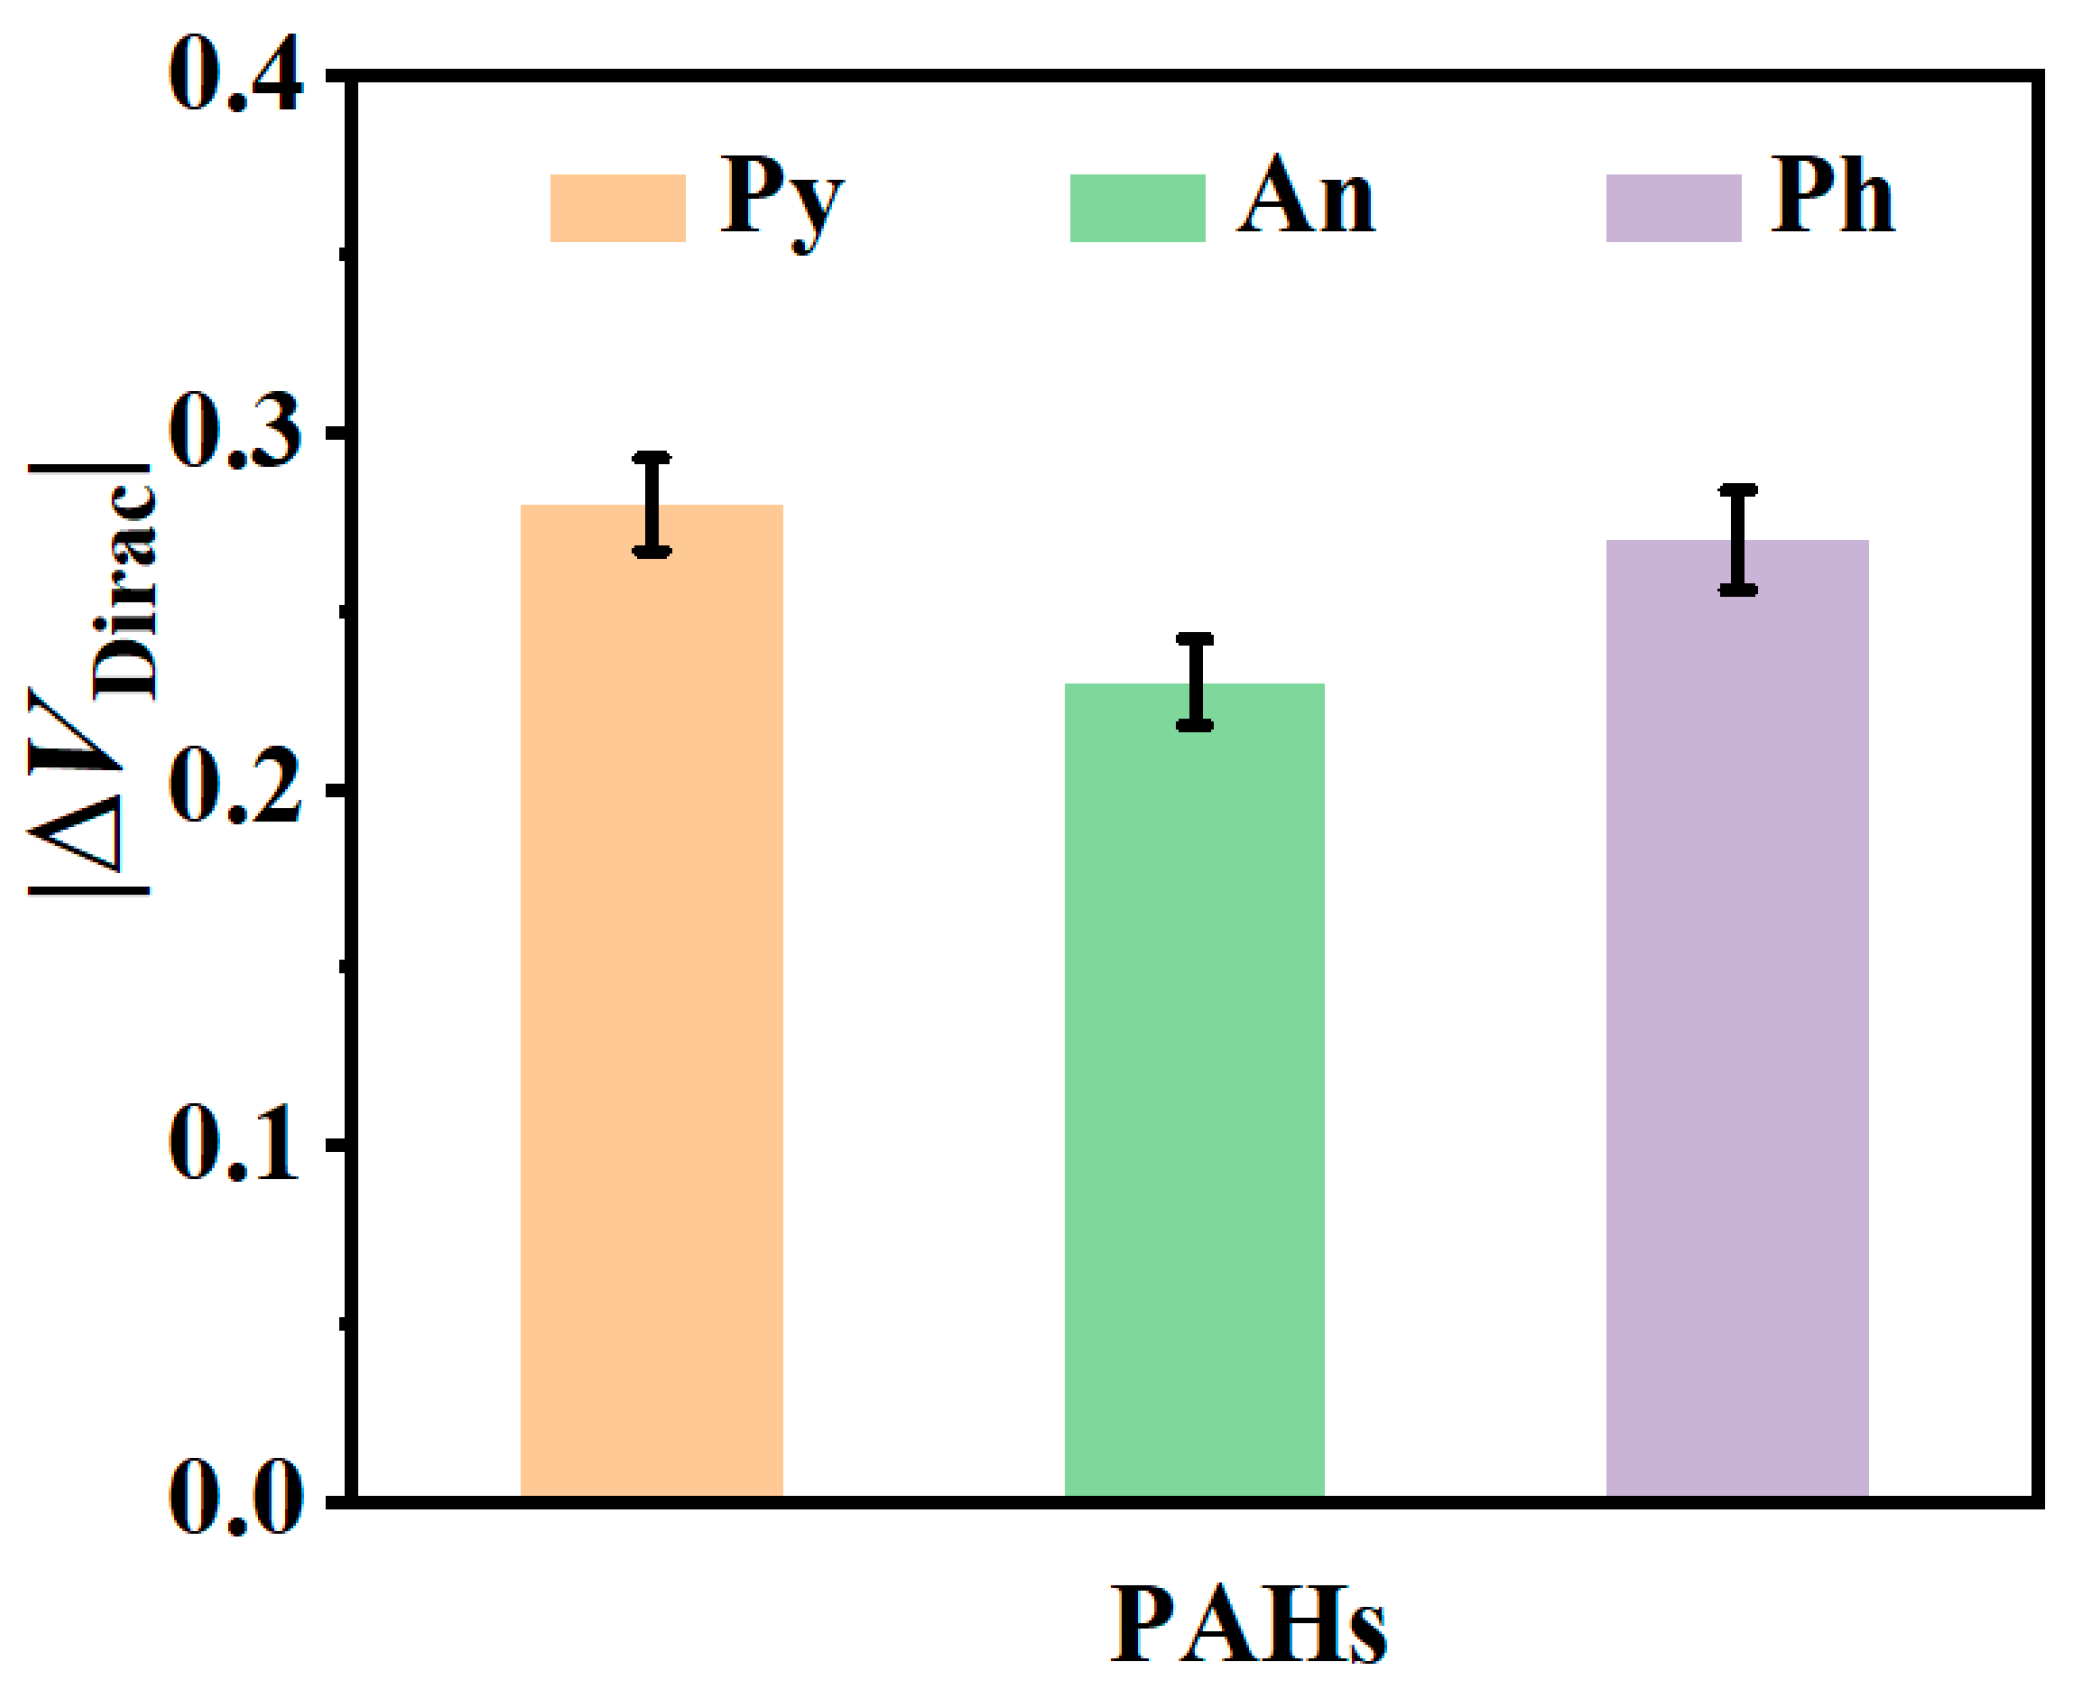
3.4. Application of Liquid Gr-FET Sensor for PHA Detection

The 1.00 × 10⁻⁹ mol/L pyrene solution applied as a testing sample was determined by the liquid-gated Gr-FET sensor on the standard calibration curve in Figure 4b. As the results show in Figure S6, the concentration was determined to be 1.12 × 10⁻⁹ mol/L, and the recovery was found to be 89.1%, which indicates that the sensor possesses a robust quantitative detection capability for pyrene. Furthermore, the sensing capability of the liquid-gated Gr-FET sensor was extended to more types of PAHs molecules: pyrene, anthracene, and phenacene. As illustrated in Figure 5, high response values were also observed in the presence of different PAH solutions, demonstrating the capability of the sensor for detecting other kinds of PAHs. Reversibility is an important feature of chemical sensors. The results of VDirac change in a liquid-gated Gr-FET sensor after five cycles of pyrene exposure/acetone washing are shown in Figure S7. It could be observed that the device could be restored to its initial state after acetone washing. To verify the practical application of the device in sensing PAHs in the environment, a 10 mL water solution was taken from the Zhujiang river next to the Guangzhou higher education mega center as a sample, which was artificially contaminated with pyrene. After pretreatment, the sample was tested by standard high-performance liquid chromatography (HPLC) and the liquid-gated Gr-FET sensor. The content of the pyrene in the sample was measured to be 1.07 × 10⁻⁹ mol/L by the HPLC and 1.12 × 10⁻⁹ mol/L by the liquid-gated Gr-FET sensor. The deviation of the result from the liquid-gated Gr-FET sensor to the standard method was calculated to be 4.7%, indicating that the device shows great potential for practical applications in testing PAHs in aqueous environments. In comparison with the latest studies such as with DNA/Cu2O-GS-FET [29], electrochemical impedance spectroscopy [30], square wave voltammetry [31], and surface-enhanced Raman and infrared absorption spectroscopies [32], as shown in Table 1, the liquid-gated Gr-FET is capable of detecting PAHs over a broader range (10−10 to 10−6 mol/L), low detection limit (10−10 mol/L), and short detection time (2 min).

4. Conclusions

In summary, a liquid-gated Gr-FET-based micro-nano sensor with a short detection time, wide detection range, and high sensitivity has been obtained in this work. All characterization results from Raman spectroscopy, AFM, UV-vis, and electrical performance have demonstrated that pyrene can adsorb onto the surface of the sensing material Gr, thereby inducing an N-type doping effect on the charge carrier transport behavior of the liquid-gated Gr-FET. Based on the modulating effect of pyrene on the liquid-gated Gr-FET, a good fitting curve between different pyrene concentrations and the change in the Dirac point of the Gr was obtained, with a correlation coefficient of 0.98. The detection range of the liquid-gated Gr-FET for PAHs can range from 10−10 to 10−6 mol/L, and it exhibits excellent stability. All practical application test results indicate that the liquid-gated Gr-FET holds great potential in environmental analysis, providing a good way for the accurate monitoring and rapid detection of PAHs in aqueous solutions.

Supplementary Materials

The following supporting information can be downloaded at https://www.mdpi.com/article/10.3390/chemosensors13020056/s1, Figure S1: Design and fabrication of liquid-gated Gr-FET sensor; Figure S2: Physical diagram of liquid-gated Gr-FET; Figure S3: Stability of liquid-gated Gr-FET; Figure S4: The low-wavelength range of Raman spectra of monolayer Gr before and after pyrene adsorption; Figure S5: Adsorption of pyrene molecules by liquid-gated Gr-FETs as function of time; Figure S6: The voltage response of the liquid-gated Gr-FET to an unknown sample; Figure S7: Reversibility studies by successive exposure and washing of liquid-gated Gr-FET. Table S1: Typical Raman spectral data of Gr and Gr exposed to pyrene.

Author Contributions

Conceptualization, C.K., X.X., Z.G. and L.N.; methodology, C.K.; software, X.X.; validation, C.K. and X.X.; formal analysis, C.K. and X.X.; investigation, C.K. and X.X.; resources, Y.B. and L.N.; data curation, C.K. and Y.B.; writing—original draft preparation, C.K. and X.X.; writing—review and editing, Z.G.; visualization, Z.G.; supervision, Z.G., Y.B. and L.N.; project administration, Z.G.; funding acquisition, L.N. All authors have read and agreed to the published version of the manuscript.

Funding

This research was funded by the National Key Research and Development Program of China (2023YFB3210103); National Major Scientific Instruments and Equipment Development Project of the National Natural Science Foundation of P. R. China (22227804); National Natural Science Foundation of China (22434007, 22374032); Project of Department of Education of Guangdong Province (2023KTSCX101); Key Discipline of Materials Science and Engineering, Bureau of Education of Guangzhou (No. 202255464); and the Science and Technology Projects in Guangzhou (2023A03J0075).

Institutional Review Board Statement

Not applicable.

Informed Consent Statement

Not applicable.

Data Availability Statement

Data are available from the authors under reasonable request.

Acknowledgments

We acknowledge the facility and technical assistance from the School of Chemistry and Chemical Engineering, Guangzhou University.

Conflicts of Interest

The authors declare no conflicts of interest.

References

  1. Hao, J.N.; Yan, B. Determination of Urinary 1-Hydroxypyrene for Biomonitoring of Human Exposure to Polycyclic Aromatic Hydrocarbons Carcinogens by a Lanthanide-functionalized Metal-Organic Framework Sensor. Adv. Funct. Mater. 2016, 27, 1603856. [Google Scholar] [CrossRef]
  2. Li, Q.; Zheng, Q.; Shi, J.; Yan, Y.; Guo, X.; Yang, H. Magnetic optimizing surface-enhanced Raman scattering (SERS) strategy of detection and in-situ monitoring of photodegradation of Benzo[a]pyrene in water. Anal. Chim. Acta 2025, 1336, 343466. [Google Scholar] [CrossRef] [PubMed]
  3. Ni, N.; Li, X.; Yao, S.; Shi, R.; Kong, D.; Bian, Y.; Jiang, X.; Song, Y. Biochar applications combined with paddy-upland rotation cropping systems benefit the safe use of PAH-contaminated soils: From risk assessment to microbial ecology. J. Hazard. Mater. 2021, 404, 124123. [Google Scholar] [CrossRef] [PubMed]
  4. Zhang, L.; Wang, X.; Chen, C.; Wang, R.; Qiao, X.; Waterhouse, G.I.N.; Xu, Z. A surface-enhanced Raman scattering sensor for the detection of benzo[a]pyrene in foods based on a gold nanostars@reduced graphene oxide substrate. Food Chem. 2023, 421, 136171. [Google Scholar] [CrossRef] [PubMed]
  5. World Health Organization. Guidelines for Drinking-Water Quality; World Health Organization: Geneva, Switzerland, 2004; Volume 1. [Google Scholar]
  6. Hu, T.; Xia, Y.; Wang, Y.; Lin, L.; An, R.; Xu, L.; Qing, X. Fast Determination and Source Apportionment of Eight Polycyclic Aromatic Hydrocarbons in PM10 Using the Chemometric-Assisted HPLC-DAD Method. Chemosensors 2024, 12, 220. [Google Scholar] [CrossRef]
  7. Qu, B.; Li, P.; Bai, L.; Qu, Y.; Li, Z.; Zhang, Z.; Zheng, B.; Sun, J.; Jing, L. Atomically Dispersed Zn-N5 Sites Immobilized on g-C3N4 Nanosheets for Ultrasensitive Selective Detection of Phenanthrene by Dual Ratiometric Fluorescence. Adv. Mater. 2023, 35, 2211575. [Google Scholar]
  8. Lin, Y.-Y.; Liu, G.; Wai, C.M.; Lin, Y. Magnetic beads-based bioelectrochemical immunoassay of polycyclic aromatic hydrocarbons. Electrochem. Commun. 2007, 9, 1547–1552. [Google Scholar] [CrossRef]
  9. Latif, U.; Ping, L.; Dickert, F. Conductometric Sensor for PAH Detection with Molecularly Imprinted Polymer as Recognition Layer. Sensors 2018, 18, 767. [Google Scholar] [CrossRef]
  10. Qu, F.; Li, H. Selective molecular recognition of polycyclic aromatic hydrocarbons using CdTe quantum dots with cyclodextrin as supramolecular nano-sensitizers in water. Sens. Actuators B Chem. 2009, 135, 499–505. [Google Scholar] [CrossRef]
  11. Guo, Z.; Zeng, Y.; Meng, F.; Qu, H.; Zhang, S.; Hu, S.; Fan, S.; Zeng, H.; Cao, R.; Prasad, P.N.; et al. In-situ neutron-transmutation for substitutional doping in 2D layered indium selenide based phototransistor. eLight 2022, 2, 9. [Google Scholar] [CrossRef]
  12. Li, J.; Wu, D.; Yu, Y.; Li, T.; Li, K.; Xiao, M.-M.; Li, Y.; Zhang, Z.-Y.; Zhang, G.-J. Rapid and unamplified identification of COVID-19 with morpholino-modified graphene field-effect transistor nanosensor. Biosens. Bioelectron. 2021, 183, 113206. [Google Scholar] [CrossRef]
  13. Sun, M.; Zhang, C.; Lu, S.; Mahmood, S.; Wang, J.; Sun, C.; Pang, J.; Han, L.; Liu, H. Recent Advances in Graphene Field-Effect Transistor Toward Biological Detection. Adv. Funct. Mater. 2024, 34, 2405471. [Google Scholar] [CrossRef]
  14. Yao, L.; Gao, S.; Liu, S.; Bi, Y.; Wang, R.; Qu, H.; Wu, Y.; Mao, Y.; Zheng, L. Single-Atom Enzyme-Functionalized Solution-Gated Graphene Transistor for Real-Time Detection of Mercury Ion. ACS Appl. Mater. Interfaces 2020, 12, 6268–6275. [Google Scholar] [CrossRef] [PubMed]
  15. Fang, J.; Hu, Y.; Han, Y.; Du, J.; Zhang, G.; Liu, Y. Electrical study of a novel pyrene boned graphene nanoribbon film and its specific aniline sensing feature. Chem. Eng. J. 2023, 471, 144443. [Google Scholar] [CrossRef]
  16. Lei, Y.; Zeng, R.; Li, Y.-T.; Xiao, M.-M.; Zhang, Z.-Y.; Zhang, G.-J. Real-time monitoring of cellular Ca2+ efflux with renewable graphene field effect transistor biosensor. Carbon 2023, 201, 616–623. [Google Scholar] [CrossRef]
  17. Lei, Y.-M.; Xiao, M.-M.; Li, Y.-T.; Xu, L.; Zhang, H.; Zhang, Z.-Y.; Zhang, G.-J. Detection of heart failure-related biomarker in whole blood with graphene field effect transistor biosensor. Biosens. Bioelectron 2017, 91, 1–7. [Google Scholar] [CrossRef]
  18. Ruiz, E.; Varenne, C.; De Lima, B.S.; Gueye, T.; Pauly, A.; Brunet, J.; Mastelaro, V.R.; Ndiaye, A.L. Investigating the Metallic Nanoparticles Decoration on Reduced Graphene Oxide-Based Sensors Used to Detect Sulfur Dioxide. Chemosensors 2024, 12, 24. [Google Scholar] [CrossRef]
  19. Huang, T.; Tang, X.; Luo, K.; Wu, Y.; Hou, X.; Tang, S. An overview of graphene-based nanoadsorbent materials for environmental contaminants detection. TrAC Trends Anal. Chem. 2021, 139, 116255. [Google Scholar] [CrossRef]
  20. Almeida, J.R.; Gravato, C.; Guilhermino, L. Challenges in assessing the toxic effects of polycyclic aromatic hydrocarbons to marine organisms: A case study on the acute toxicity of pyrene to the European seabass (Dicentrarchus labrax L.). Chemosphere 2012, 86, 926–937. [Google Scholar] [CrossRef]
  21. Wu, G.; Dai, Z.; Tang, X.; Lin, Z.; Lo, P.K.; Meyyappan, M.; Lai, K.W.C. Graphene Field-Effect Transistors for the Sensitive and Selective Detection of Escherichia coli Using Pyrene-Tagged DNA Aptamer. Adv. Healthc. Mater. 2017, 6, 1700736. [Google Scholar] [CrossRef]
  22. Shearer, C.J.; Slattery, A.D.; Stapleton, A.J.; Shapter, J.G.; Gibson, C.T. Accurate thickness measurement of graphene. Nanotechnology 2016, 27, 125704. [Google Scholar] [CrossRef] [PubMed]
  23. Li, Z.; Zhang, W.; Li, Y.; Wang, H.; Qin, Z. Activated pyrene decorated graphene with enhanced performance for electrochemical energy storage. Chem. Eng. J. 2018, 334, 845–854. [Google Scholar] [CrossRef]
  24. Ferrari, A.C.; Meyer, J.C.; Scardaci, V.; Casiraghi, C.; Lazzeri, M.; Mauri, F.; Piscanec, S.; Jiang, D.; Novoselov, K.S.; Roth, S.; et al. Raman Spectrum of Graphene and Graphene Layers. Phys. Rev. Lett. 2006, 97, 187401. [Google Scholar] [CrossRef] [PubMed]
  25. Reina, A.; Jia, X.; Ho, J.; Nezich, D.; Son, H.; Bulovic, V.; Dresselhaus, M.S.; Kong, J. Large Area, Few-Layer Graphene Films on Arbitrary Substrates by Chemical Vapor Deposition. Nano Lett. 2009, 9, 30–35. [Google Scholar] [CrossRef] [PubMed]
  26. McQueen, E.W.; Goldsmith, J.I. Electrochemical Analysis of Single-Walled Carbon Nanotubes Functionalized with Pyrene-Pendant Transition Metal Complexes. J. Am. Chem. Soc. 2009, 131, 17554–17556. [Google Scholar] [CrossRef] [PubMed]
  27. Putri, A.D.; Chotimah, N.; Ujjain, S.K.; Wang, S.; Futamura, R.; Vallejos-Burgos, F.; Khoerunnisa, F.; Morimoto, M.; Wang, Z.; Hattori, Y.; et al. Charge-transfer mediated nanopore-controlled pyrene derivatives/graphene colloids. Carbon 2018, 139, 512–521. [Google Scholar] [CrossRef]
  28. Wu, G.; Tang, X.; Meyyappan, M.; Lai, K.W.C. Doping effects of surface functionalization on graphene with aromatic molecule and organic solvents. Appl. Surf. Sci. 2017, 425, 713–721. [Google Scholar] [CrossRef]
  29. Babolghani, F.M.; Mohammadi-Manesh, E. Simulation and experimental study of FET biosensor to detect polycyclic aromatic hydrocarbons. Appl. Surf. Sci. 2019, 488, 662–670. [Google Scholar] [CrossRef]
  30. Munoz, J.; Campos-Lendinez, A.; Crivillers, N.; Mas-Torrent, M. Selective Discrimination of Toxic Polycyclic Aromatic Hydrocarbons in Water by Targeting π-Stacking Interactions. ACS Appl. Mater. Interfaces 2020, 12, 26688–26693. [Google Scholar] [CrossRef]
  31. Sehatnia, B.; Sabzi, R.E.; Kheiri, F.; Nikoo, A. Sensitive molecular determination of polycyclic aromatic hydrocarbons based on thiolated Calix[4]arene and CdSe quantum dots (QDs). J. Appl. Electrochem. 2014, 44, 727–733. [Google Scholar] [CrossRef]
  32. Sánchez-Alvarado, A.B.; Zhou, J.; Jin, P.; Neumann, O.; Senftle, T.P.; Nordlander, P.; Halas, N.J. Combined Surface-Enhanced Raman and Infrared Absorption Spectroscopies for Streamlined Chemical Detection of Polycyclic Aromatic Hydrocarbon-Derived Compounds. ACS Nano 2023, 17, 25697–25706. [Google Scholar] [CrossRef]
Figure 1. (a) Optical micrograph of liquid-gated Gr-FET. (b) AFM image of monolayer Gr (inset: AFM height profile (red line) and roughness (inside the white dashed line)). (c) Raman spectrum of monolayer Gr. (d) Schematic illustration of structure of liquid-gated Gr-FET(S: source electrode, D: drain electrode). (e) Id-Vd characteristics at different gate voltages under ambient conditions. (f) Id-Vg characteristics under ambient conditions at Vd = 0.1 V.
Chemosensors 13 00056 g001
Figure 2. (a) Schematic diagram of adsorption of PAHs on liquid-gated Gr-FET. (b) AFM image of liquid-gated Gr-FET exposed to PAHs. (inset: AFM height profile (red line) and roughness (inside the white dashed line)). (c) UV-vis absorption spectra of liquid-gated Gr-FET exposed to PAHs.
Chemosensors 13 00056 g002
Figure 3. (a) Transport characteristics of liquid-gated Gr-FET before and after pyrene adsorption. (b) Typical Raman spectra of monolayer Gr before and after pyrene adsorption. (c) Schematic diagram of band structure of monolayer Gr before and after pyrene absorption (Ef: Fermi Level; CB: Conduction Band; VB: Valence Band.).
Chemosensors 13 00056 g003
Figure 4. (a) Id-Vg curves obtained from liquid-gated Gr-FET exposed to pyrene solution with different concentrations ranging from 10−11 mol/L to 10−5 mol/L under ambient condition. (b) Linear fitting curves of relative response (|ΔVDirac|) with different pyrene concentration. Error bar represents standard deviation (n = 5).
Chemosensors 13 00056 g004
Figure 5. The responsiveness of the sensor for different PHA solutions.
Chemosensors 13 00056 g005
Table 1. Comparative table between different detection methods reported in literature and this work.
Type of SensingRange (M)TimeMatrixReference
DNA/Cu2O-GS-FETField Effect Transistor2 × 10−3–3 × 10−21.5 hElectrolyte solution[29]
ITO-SAM-Nap-NH2Electrochemical Impedance Spectroscopy3.90 × 10−7–5.46 × 10−73 minAqueous[30]
Fe3O4-Calix[4]arene @CdSeSquare Ware Voltammetry1.5 × 10−6–25 × 10−612 hWater[31]
SERS + SEIRASurface-Enhanced Raman and Infrared Absorption Spectroscopies3.95 × 10−8GNS[32]
Liquid-gated G-FETField Effect Transistor10−10–10−62 minPBSThis work
Disclaimer/Publisher’s Note: The statements, opinions and data contained in all publications are solely those of the individual author(s) and contributor(s) and not of MDPI and/or the editor(s). MDPI and/or the editor(s) disclaim responsibility for any injury to people or property resulting from any ideas, methods, instructions or products referred to in the content.

