Article

Study of a Sensitive and Selective Electrochemical Biosensor for Glucose Based on Bi2Ru2O7 Pyrochlore Clusters Combined with MWCNTs

by
Jelena Isailović
1,
Aleksandra Dapčević
2,
Milan Žunić
3,
Matjaž Finšgar
4,
Kristijan Vidović
1,
Nikola Tasić
1,* and
Samo B. Hočevar
1,*
1
Department of Analytical Chemistry, National Institute of Chemistry, Hajdrihova 19, SI-1000 Ljubljana, Slovenia
2
Department of General and Inorganic Chemistry, Faculty of Technology and Metallurgy, University of Belgrade, Karnegijeva 4, 11000 Belgrade, Serbia
3
University of Belgrade, Institute for Multidisciplinary Research, Kneza Višeslava 1, 11000 Belgrade, Serbia
4
Faculty of Chemistry and Chemical Engineering, University of Maribor, Smetanova 17, SI-2000 Maribor, Slovenia
*
Authors to whom correspondence should be addressed.
Chemosensors 2025, 13(3), 109; https://doi.org/10.3390/chemosensors13030109
Submission received: 14 January 2025 / Revised: 10 March 2025 / Accepted: 13 March 2025 / Published: 15 March 2025

Abstract

:
The development of sensitive, selective, and reliable glucose biosensors remains a persistent challenge in clinical diagnostics. In this study, we exploited the advantageous (electro)catalytic properties of bismuth ruthenate (Bi2Ru2O7) pyrochlore clusters, known for their high surface activity and metallic-like conductivity, and the favorable physicochemical properties of multi-walled carbon nanotubes (MWCNTs) by combining them with glucose oxidase (GOD) in a sensitive and selective disposable glucose biosensor. The integration of Bi2Ru2O7 enabled an enhanced and more reproducible response of the biosensor along with fast and improved communication between the supporting electrode and the upper biosensing layer. The architecture of the biosensor involves the deposition of an MWCNT layer on a ferrocyanide-modified screen-printed carbon electrode (FCN-SPCE), followed by the application of a biorecognition layer including GOD and Bi2Ru2O7 clusters. The voltammetric biosensor showed excellent electroanalytical performance, capable of detecting low glucose concentrations with a detection limit of 40 µM along with a linear response across the examined concentration range of 1.0–20.0 mM. The biosensor exhibited good reproducibility with a relative standard deviation (RSD) of 1.2% and interference-free operation against several of the most common interfering compounds. The practical applicability of the biosensor was demonstrated by the determination of glucose in a real serum sample spiked with different concentrations of glucose.

1. Introduction

Diabetes is a chronic and increasingly widespread illness that affects a significant portion of the global population [1,2,3]. Characterized by abnormal blood glucose levels, diabetes can lead to severe complications, including heart attacks, blindness, nerve damage, and kidney failure [4]. If left untreated, it can result in serious health problems and even death. Diabetes is generally classified into two main types, i.e., type 1, where the body/organism fails to produce sufficient insulin, and type 2, where the body becomes resistant to insulin’s activity. Both types disrupt the ability to process carbohydrates, fats, and proteins, impairing insulin’s effectiveness in tissues. Given the growing prevalence of diabetes and its significant impact on individuals, society, and the economy, it is crucial to develop further early point-of-need detection devices that are both effective and user-friendly [5,6,7].
Advanced one-shot glucose sensing devices hold great promise for accurately analyzing samples with exact signal readouts, which could significantly reduce the rate of mortality and disability associated with diabetes [8,9]. Such devices are particularly valuable for the early recognition of diabetes, allowing for timely interventions to manage the condition better. Enzymatic electrochemical biosensors have emerged as a highly effective tool for glucose determination. These biosensors leverage the selectivity and efficiency of enzymes to catalyze glucose oxidation, generating an electrical signal proportional to the glucose concentration [10]. Moreover, the integration of enzymes with (electro)catalytic (nano)materials enables the construction of highly sensitive and selective biosensors [11]. Numerous methods have been developed for enzyme immobilization and signal enhancement, including gels, organic polymer hosts, carbon-based materials, and (electro)catalytic metals and metal oxides [12,13]. Among them, nanostructured materials like nanosized colloidal gold, Ni-based nanoparticles, metal–organic frameworks (MOFs), Co-based nanoparticles, Cu-based materials, MXenes, and carbon nanotubes have demonstrated significant success in synergy with selective enzymes for biosensing applications [14,15,16].
Pyrochlore-type compounds A2B2O7 (A = Pb, Bi, B = Ru, Ir, or Os) are notable for energy-related and electronic applications like temperature sensors and thick-film resistors [17,18]. Bismuth ruthenate (Bi2Ru2O7) stands out for its bifunctional (electro)catalytic properties in OER and ORR, high structural stability, and potential use in sodium–air batteries [19]. Resembling RuO2 in (electro)catalytic properties, it has been proposed as a cathode in SOFCs and a photocatalyst in nanocomposites [20,21]. Despite its catalytic advantages, pyrochlore use in sensors is rare, such as a Pb2Ru1.9V0.1O7−δ-based sensors for NO/NO2 detection [22]. Herein, the aim was to exploit the attractive (electro)catalytic properties of pyrochlore compounds, which have already found their use in some electrochemical applications, but interestingly, there are no reports on using Bi2Ru2O7 in biosensing, except in our very recent study where pyrochlore clusters were introduced in electrochemical immunosensing of the SARS-CoV-2 spike protein [23]. In general, the atomic ratio between Bi and Ru in a Bi2Ru2O7 pyrochlore is stoichiometric, and a somewhat lower percentage of oxygen versus the theoretical value suggests the presence of oxygen vacancies, altering the electronic structure of the pyrochlore and forming mid-gap states that act as charge carriers. The (electro)catalytic mechanism of the pyrochlore remains not completely disentangled, although it was proposed that the (electro)catalytic activity may depend on the bond strength between the cation B and oxygen. Nevertheless, it is assumed that the pyrochlore decreases the kinetic barrier rather than taking part in the electrochemical reactions with consumption [24].
In the present work, the integration of Bi2Ru2O7 pyrochlore clusters into the biosensor architecture resulted in an improved overall electroanalytical performance of the glucose biosensor. From the signal transduction perspective, we take advantage of the metallic-like conductivity of pyrochlore clusters at room temperature, as well as their high surface reactivity due to the presence of oxygen vacancies within the structure. We demonstrate the fabrication, characterization, and operation of a voltammetric glucose biosensor that harnesses the combined effects of Bi2Ru2O7 pyrochlore clusters wired with MWCNTs and GOD integrated on a ferrocyanide-modified disposable screen-printed carbon working electrode (FCN-SPCE). This biosensing architecture has resulted in a low detection limit, exceptional reproducibility, stability, and interference-free operation. The analytical performance of the biosensor was tested on a human serum, making it a step closer to real practical applications in point-of-need setup.

2. Materials and Methods

2.1. Apparatus

Electrochemical measurements were carried out using a portable potentiostat/galvanostat PalmSens4 (PalmSens BV, Houten, The Netherlands) in combination with a cable connector for screen-printed electrodes (DRP-CAC 71606, Metrohm DropSens, Herisau, Switzerland) and PSTrace 5.9 software (PalmSens BV). The supporting screen-printed electrode system consisted of a ferrocyanide-bulk-modified carbon working electrode (FCN-SPCE; the diameter of the working electrode was 4 mm), a silver quasi-reference electrode, and a carbon counter electrode (DRP-F10, Metrohm DropSens), designed to work with microvolume solution droplets, i.e., at least 50 μL for measurements and typically less than 10 μL for modification purposes.

2.2. Reagents and Solutions

L-ascorbic acid (Kemika, Zagreb, Croatia), Nafion (5 wt.% in mixture of lower aliphatic alcohols and water, Merck, Rahway, New Jersey, United States), uric acid (≥99%), glycine (99%), maltose monohydrate (99%), D-(−)-fructose (≥99%), D-(+)-galactose (99.5%), acetaminophen (98%), acetylsalicylic acid (99%), D-(+)-glucose (99.5%), GOD from Aspergillus Niger (250,000 units), MWCNTs (carbon > 95%, outer diameter × length = 6–9 nm × 5 µm), and AB human serum (all from Sigma-Aldrich, St. Louis, MO, USA) were of analytical-grade purity. MWCNTs were functionalized using a modified procedure from [25]; 0.5 g of commercially available MWCNTs were dispersed in 150 mL of 15 M HNO₃ and stirred for 4 h at 40 °C. The resulting mixture was filtered multiple times, and the filter cake was thoroughly rinsed with purified water. Finally, the functionalized MWCNTs were air-dried at 80 °C. A 2.8 µL suspension of 90 mg mL−1 MWCNTs in purified water was added to 50 µL of 5.0% Nafion and 0.447 mL purified water to attain a 0.5 mg mL−1 MWCNT modification suspension. The modification suspension was stored in the refrigerator at 4 °C and a relative humidity of 65%. Before use, the modification suspension was vortexed for 1 min. An enzyme–(electro)catalyst mixture was prepared by mixing GOD, Nafion (0.5%), 0.1 M phosphate-buffered saline (PBS, pH = 7.4), and Bi2Ru2O7 pyrochlore clusters in purified water. Test solutions yielding the desired glucose concentrations were prepared in 0.1 M PBS. AB human serum was prepared by diluting it with 0.1 M PBS (1:5) and stored in the refrigerator at 4 °C and 65% relative humidity. All solutions used in this work were prepared with water purified by the Elix 10/Milli-Q Gradient unit (Millipore, Bedford, MA, USA).

2.3. Synthesis and Characterization of Bi2Ru2O7 Pyrochlore Clusters

A stoichiometric mixture of α-Bi2O3 (Fluka, 99.8%) and RuO2×H2O (Acros Organics, >54% Ru) was dry-homogenized for about 30 min in an agate mortar, heated at 900 °C for 3 h (heating rate 4 °C min–1) in an open Pt-crucible in a chamber furnace, and then cooled down to room temperature. Field-emission scanning electron microscopy (FE-SEM) images and the energy-dispersive X-ray spectrometry (EDX) analysis of Bi2Ru2O7 pyrochlore clusters were obtained with a SUPRA 35 VP instrument (Carl Zeiss, Oberkochen, Baden-Württemberg, Germany) equipped with an Inca 400 instrument (Oxford Instruments, Oxford, UK).
X-ray photoelectron spectroscopy (XPS) analyses of Bi2Ru2O7 pyrochlore clusters were conducted using a Supra+ system from Kratos (Manchester, UK) with an Al Kα source as the excitation source. The spectra were referenced by aligning the C-C/C-H peak in the C 1s to 284.8 eV. The electrode with Bi2Ru2O7 clusters was mounted on the sample holder using double-sided carbon tape. Measurements were conducted at a take-off angle of 90°, focusing on a spot size of 300 by 700 µm, with a pass energy set at 20 eV. ESCApe 1.5 software from Kratos was utilized for data collection and analysis.

2.4. Modification of the Working Electrode and Fabrication of the Biosensor

The working FCN-SPCE was first modified with the MWCNT suspension. Before modifying the electrode surface, the MWCNT modification suspension was vortexed for 1 min, followed by drop-casting 4.0 µL of the modification suspension onto the FCN-SPCE surface. After drying in the air for one hour at room temperature (23 °C and relative humidity of 52%), a 3.0 µL droplet of the enzyme–(electro)catalyst mixture (see Reagents and Solutions section) was applied to the MWCNT-modified FCN-SPCE. After drying for two hours at room temperature, the biosensor was ready to use. A schematic showing the step-by-step fabrication is shown in Figure S1.

2.5. Electrochemical Measurements

Cyclic voltammetric (CV) measurements were carried out in a potential range of +0.40 V to –0.30 V (unless specified otherwise) using a scan rate of 100 mV s−1.

3. Results

3.1. Material Characterization

As-synthesized Bi2Ru2O7 clusters can be indexed as cubic pyrochlore-type oxides (space group Fdm), with no other phases or oxides, as observed in our preliminary study (Figure S2). In addition, insights into their morphology were obtained by FE-SEM analysis, as shown in Figure 1a.
The sub-micrometer particles exhibit an irregular polyhedral shape, including triangular, square, and rectangular faces, forming micrometer-scale clusters. We also performed an EDX analysis; as seen in Table 1, the atomic concentration ratio between Bi and Ru is nearly stoichiometric concerning the theoretical formula of Bi2Ru2O7. A slightly lower percentage of oxygen at some of the analyzed spot acquisition sites compared to the theoretical value is a common feature of the pyrochlore structures, indicating the presence of oxygen vacancies [26].
The FE-SEM analysis revealed that the MWCNTs create a highly interconnected network of tubular structures (Figure 1b). These nanotubes are thin, less than ca. 30 nm in width, yet they extend to micrometer-scale lengths. Their physicochemical properties assure efficient wiring between the underlying supporting electrode modified with ferrocyanide moieties and the upper biosensing layer, which includes the (electro)catalytic Bi2Ru2O7 pyrochlore clusters and GOD.
Additional information on the chemical composition of the Bi2Ru2O7 clusters was obtained using high-resolution XPS analysis on the as-synthesized powder dispersed on the electrode surface (Figure 2). The XPS analysis confirmed the presence of Ru, Bi, O, and C on the electrode surface; the latter most likely corresponds to the adventitious carbonaceous species adsorbed on the electrode surface. The Bi2Ru2O7 clusters can be identified through the Bi 4f spectra shown in Figure 2a, indicating two different environments of Bi, i.e., pyrochlore-related Bi 4f5/2 and Bi 4f7/2 features at 163.7 and 158.4 eV, respectively, as well as Bi 4f5/2 and Bi 4f7/2 features at 165.0 eV and 159.7 eV, respectively, corresponding to Bi2O3 [27,28]. Regarding the O 1s environment shown in Figure 2b, a metal oxide feature at 529.8 eV was observed, along with the intense spectral feature for O from organic species that most likely corresponds to oxidized adventitious carbonaceous species. Metallic centers in the pyrochlore structure are also visible through low-intensity features presented in Figure 2c, corresponding to the Bi 4d and Ru 3p environment and the formation of the Ru 3d5/2 signal located on the negative binding energy side of the C 1s spectra (Figure 2d). In addition, the XRD pattern obtained for a synthesized Bi2Ru2O7 powder is depicted in Figure S2, along with the inset showing the theoretical crystal structure of the cubic Bi2Ru2O7.

3.2. Optimization of the Glucose Biosensor

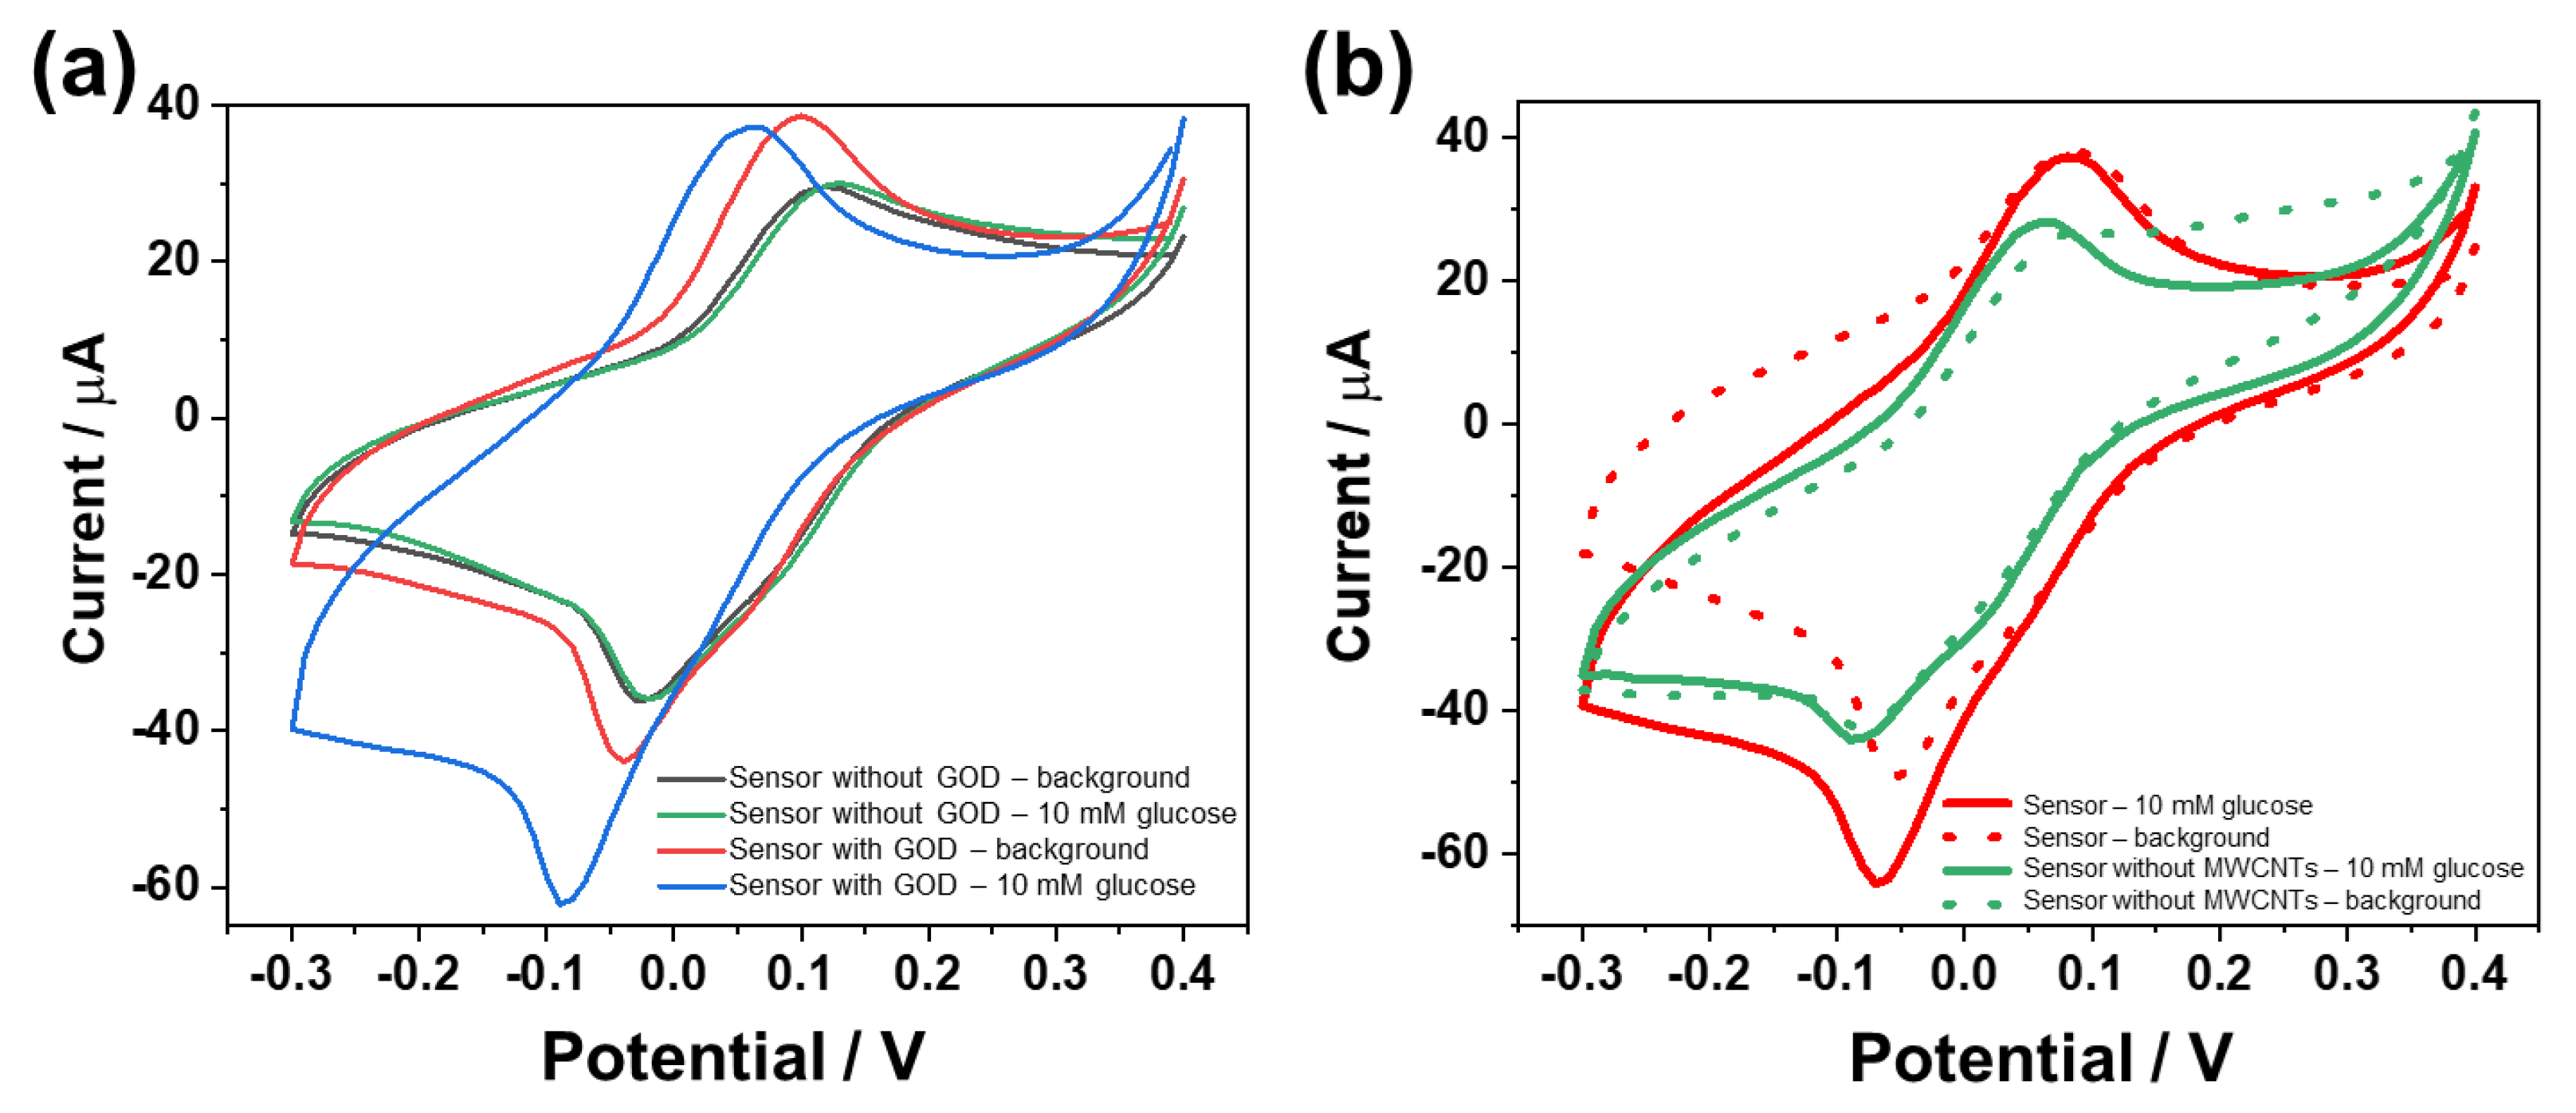
The operating mechanism of the developed glucose biosensor is based on the increased CV reduction peak of the Fe(II)/Fe(III) redox couple at the FCN-SPCE surface, observed at ca. −0.08 V when the target analyte, i.e., glucose, is present. The increase in the electrochemical signal corresponds to the local increase in the Fe(III) species caused by hydrogen peroxide, a byproduct of the GOD activity in the presence of glucose. To corroborate that the signal arises exclusively in the presence of GOD in the biosensor layer, comparative measurements were carried out using the biosensors with and without an integrated enzyme. As illustrated in Figure 3a, no signal from glucose was detected in the absence of GOD (green line); in contrast, the presence of GOD revealed an intense signal corresponding to glucose (blue line) versus background (red line). Importantly, this study also confirmed that the (electro)catalytic Bi2Ru2O7 pyrochlore combined with MWCNTs does not interfere with the (electro)analytical signal.
The experiments showed improved biosensing performance when integrating both the MWCNTs and Bi2Ru2O7 layers into the architecture of the glucose biosensor; the corresponding cyclic voltammograms are shown in Figure 3b. A biosensor including the Bi2Ru2O7 pyrochlore wired with MWCNTs showed well-defined redox signals attributed to the facilitated electrochemical redox reaction of the Fe(II/III) redox couple [29]. The biosensor exhibited increased electron transfer capabilities due to the increased electron exchange sites provided by the bismuth metallic centers and the MWCNTs compared to the biosensor that included only pyrochlore particles without MWCNTs. Assumedly, the metallic centers interact synergistically with the π-electron system of the MWCNTs, resulting in enhanced electron flow and overall electroactivity due to lower polarization/charge transfer resistance, which facilitates the reduction of Fe(III) and increases the electrochemical signals [29,30]. Interestingly, when the biosensor included only MWCNTs but was without Bi2Ru2O7 pyrochlore, it showed less intense signals and lower reproducibility.
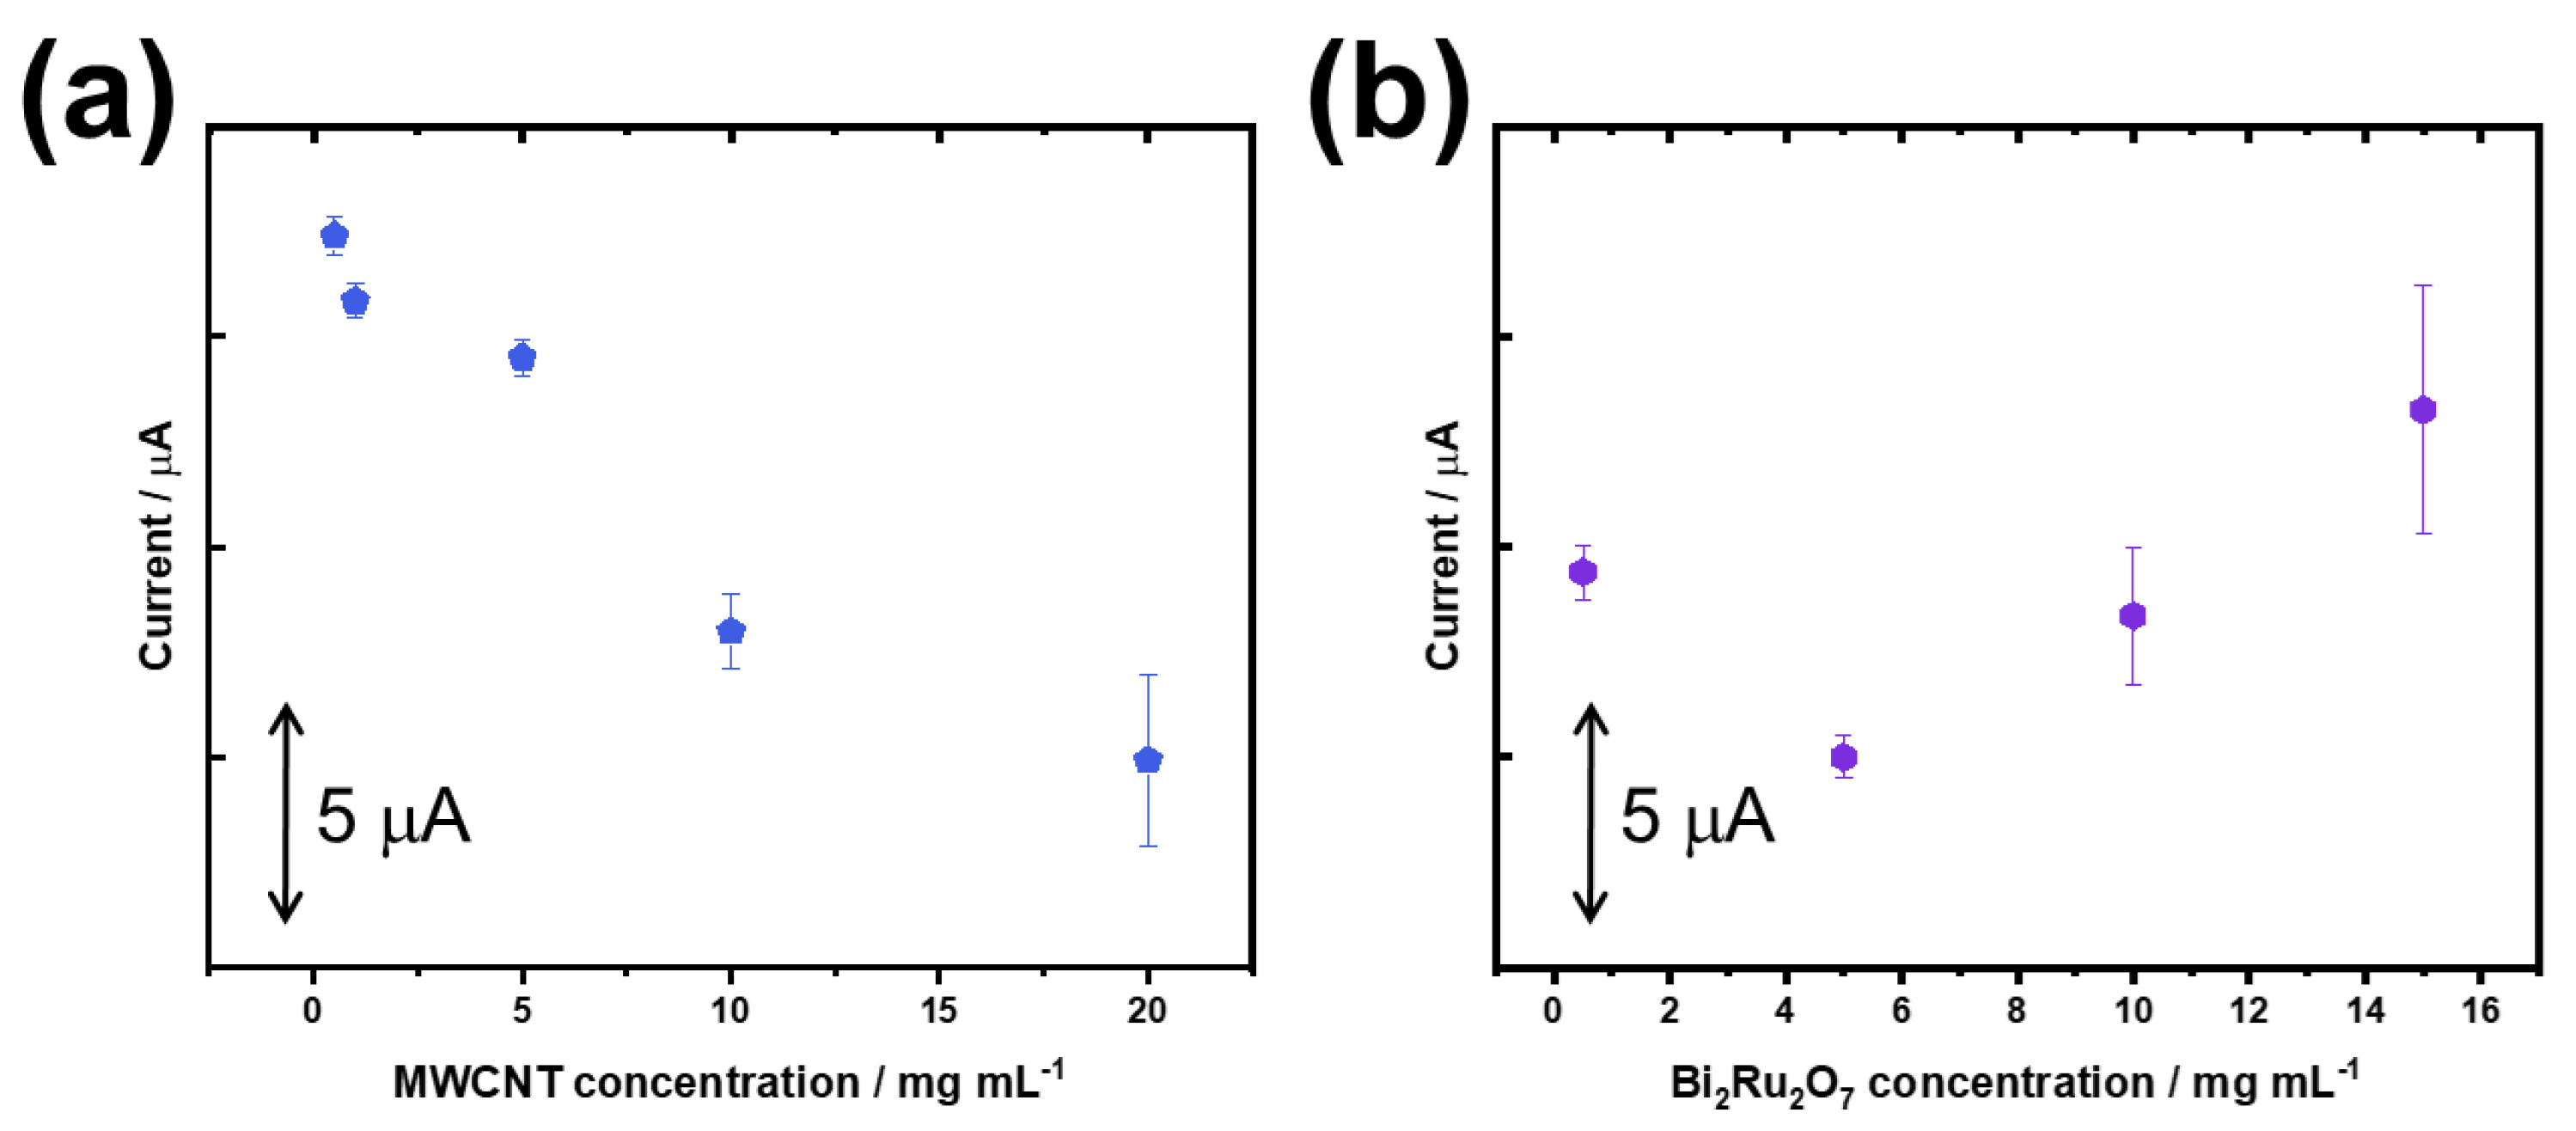
The subsequent study tackled the optimization of the MWCNTs’ content, which were added to the biosensing architecture via a drop-casting procedure. As described in the Materials and Methods section, the MWCNT suspension was prepared by admixing MWCNTs in a 0.5% Nafion solution in ethanol. Variations in the concentration of the water-based MWCNT suspension revealed a notable effect on the CV measurements and on the physical behavior of the drop-casted MWCNT-containing droplets. Increasing the MWCNT concentration resulted in the non-uniform settling of particles on the electrode surface; this phenomenon was observable visually and manifested as an uneven particle–conglomerate distribution, as revealed in Figure S3. This suggests that the Nafion, with a concentration of 0.5%, intended to function as an immobilization and anti-leaching matrix for the MWCNTs, was inefficient at higher concentrations of MWCNTs. Furthermore, an increase in MWCNT concentration decreased the reduction peak (Figure 4a), likely due to hindered electron transfer caused by excessive material agglomeration and reduced effective surface area for electron conduction. This study revealed that the two lowest tested concentrations of MWCNTs exhibited the highest electrochemical activity and biosensor reproducibility, the latter discussed below. Hereinafter, an MWCNT concentration of 0.5 mg mL−1 was selected.
In the next study, the effect of Bi2Ru2O7 pyrochlore cluster loading was followed upon the biosensor’s response. The recorded CV measurements in Figure 4b reveal an inconsistency in signal intensity with the increase in Bi2Ru2O7 concentration; while the signal first decreased and then increased with a higher concentration of Bi2Ru2O7, reproducibility of the biosensor decreased. This can be attributed to an increase in electron exchange sites on one hand, and, on the other hand, the commencement of the Bi2Ru2O7 pyrochlore cluster leaching from the biosensor’s structure. The compromise regarding signal intensity and biosensor reproducibility was attained with a Bi2Ru2O7 concentration of 0.5 mg mL−1, which was used in all further experiments presented below.
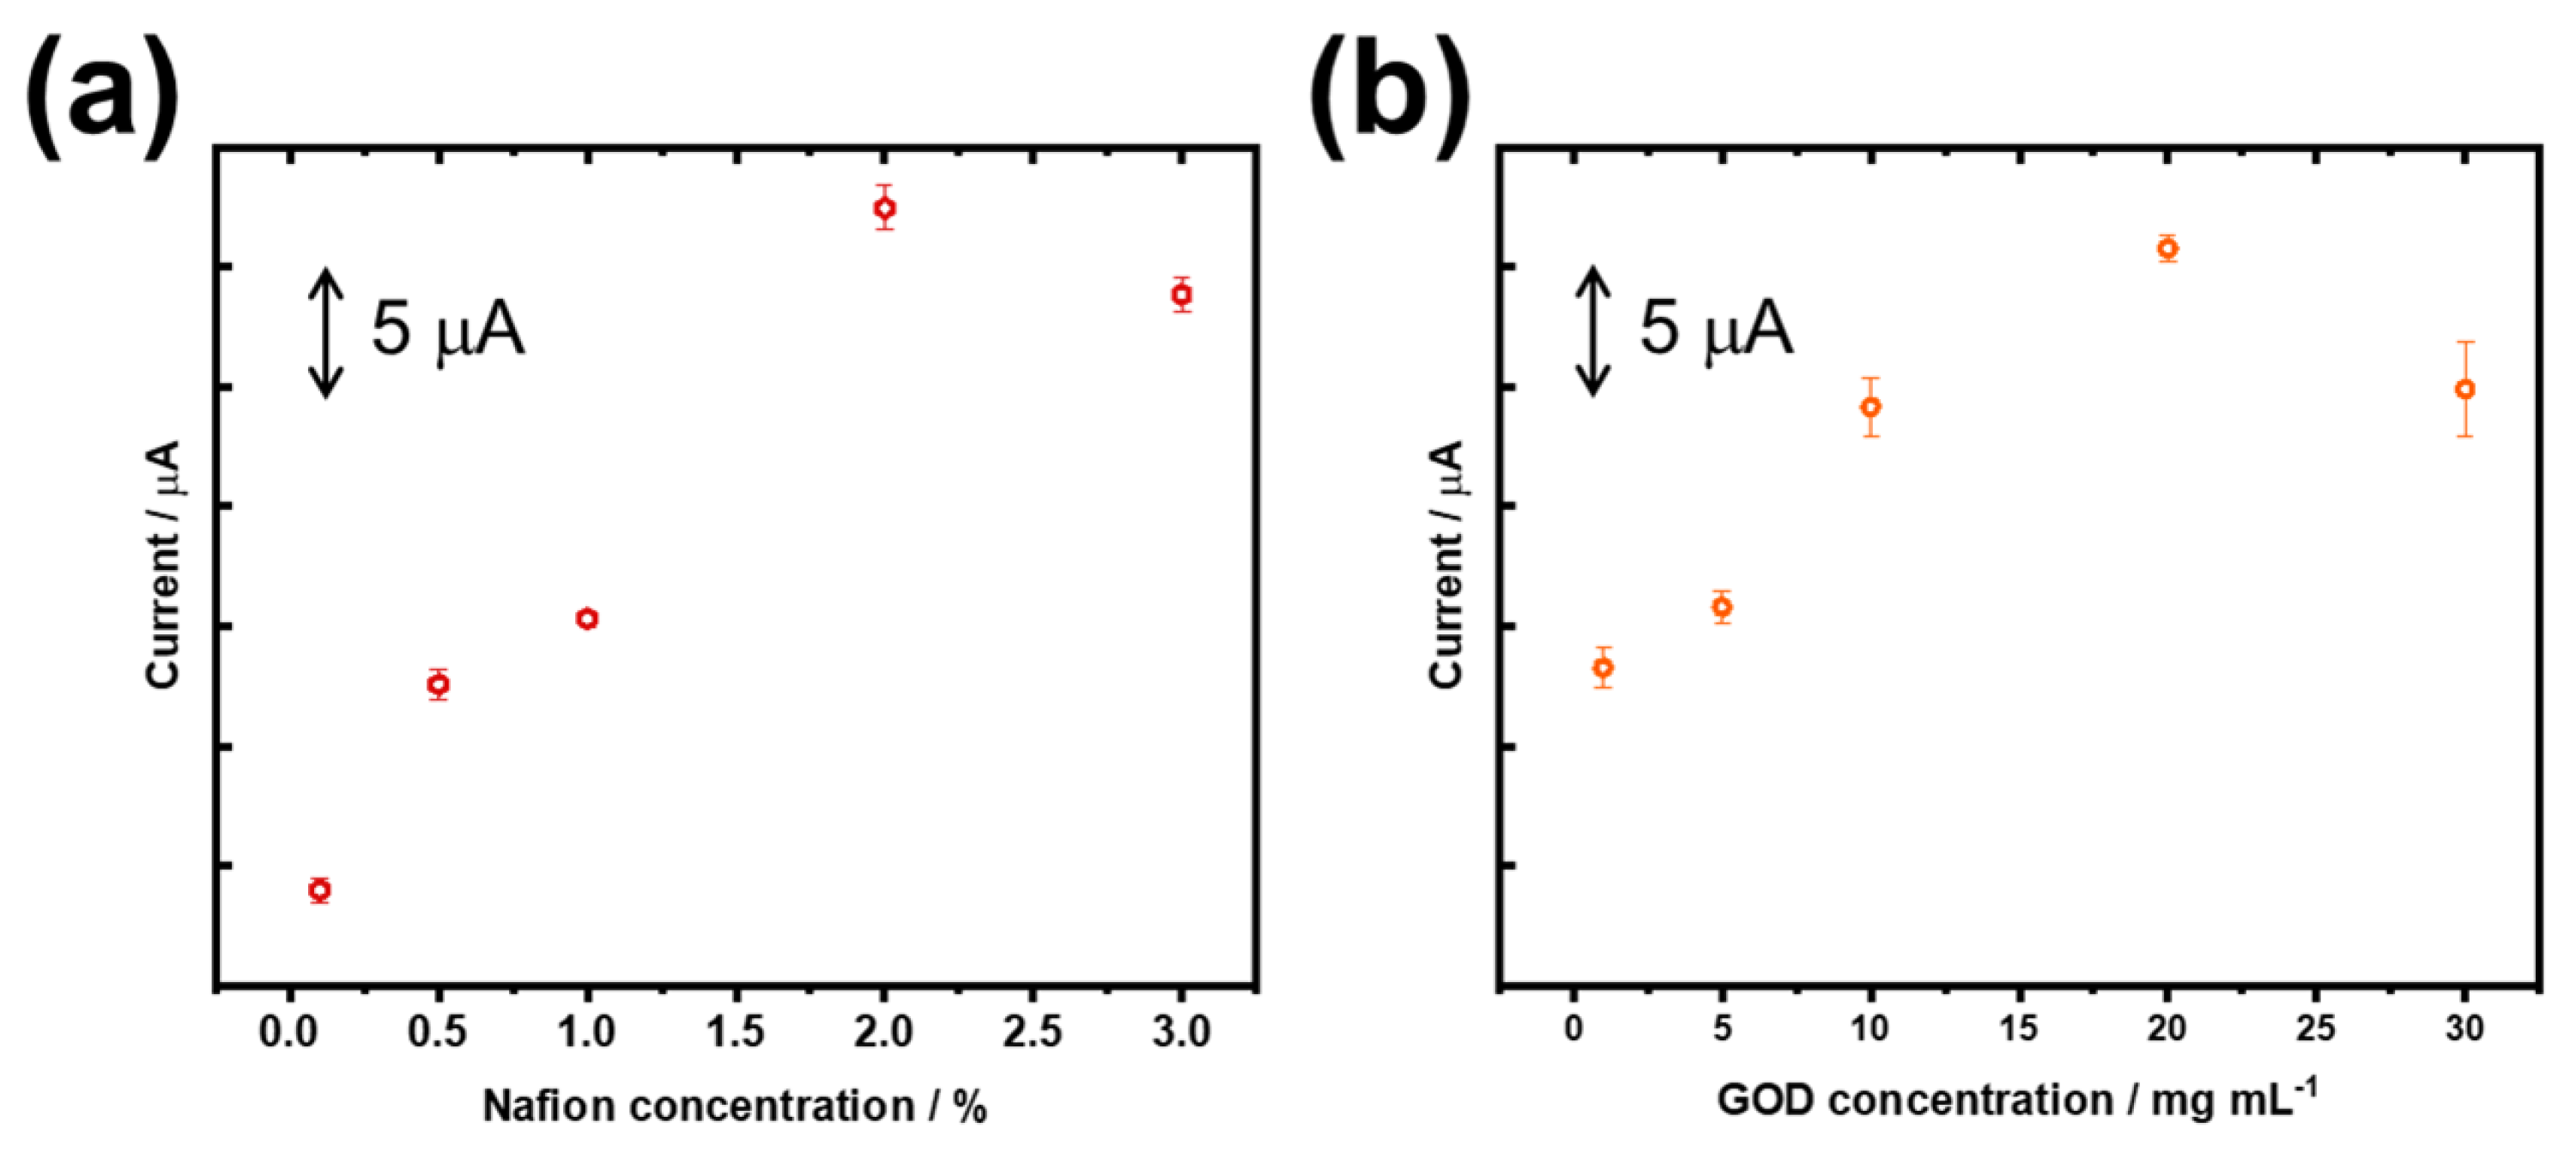
In the biosensor’s architecture, Nafion serves dual purposes, i.e., it acts as an adhesive to immobilize GOD and (electro)catalytic moieties, and, at the same time, it functions as a selective membrane, enhancing selectivity by excluding negatively charged interfering species. This selective behavior arises from the unique polymeric structure of Nafion [31]. The following study investigates the effect of Nafion concentration on the biosensor’s performance. The results indicated that increasing the Nafion concentration led to increased CV signals; however, at concentrations above 1.0%, the characteristic shape of the cyclic voltammogram began to change, exhibiting a shoulder at less negative potentials versus the peak potential, as shown in Figure S4. This change probably indicates an inhibition of the analyte diffusion due to the excessive thickness of the Nafion layer. Additionally, the cathodic current decreased at Nafion concentrations above 2.0%, further supporting the hypothesis of impaired diffusion due to membrane over-thickening (Figure 5a and Figure S4) [30,31]. Based on these findings, a Nafion concentration of 0.5% was selected as optimal, providing satisfactory signal height and reproducibility.
Finally, the influence of GOD concentration upon the biosensor operation was evaluated, as shown in Figure 5b. With increasing the GOD concentration in the range of 2.5–20.0 mg mL−1, the signal significantly increased, whereas at a concentration exceeding 20.0 mg mL−1 GOD, the biosensor exhibited less intense signals along with decreased reproducibility, which was likely due to the increased leaching of GOD from the biosensing layer. Consequently, a concentration of 20.0 mg mL−1 GOD was identified as the most suitable and was used for further studies.

3.3. Analytical Performance of the Biosensor

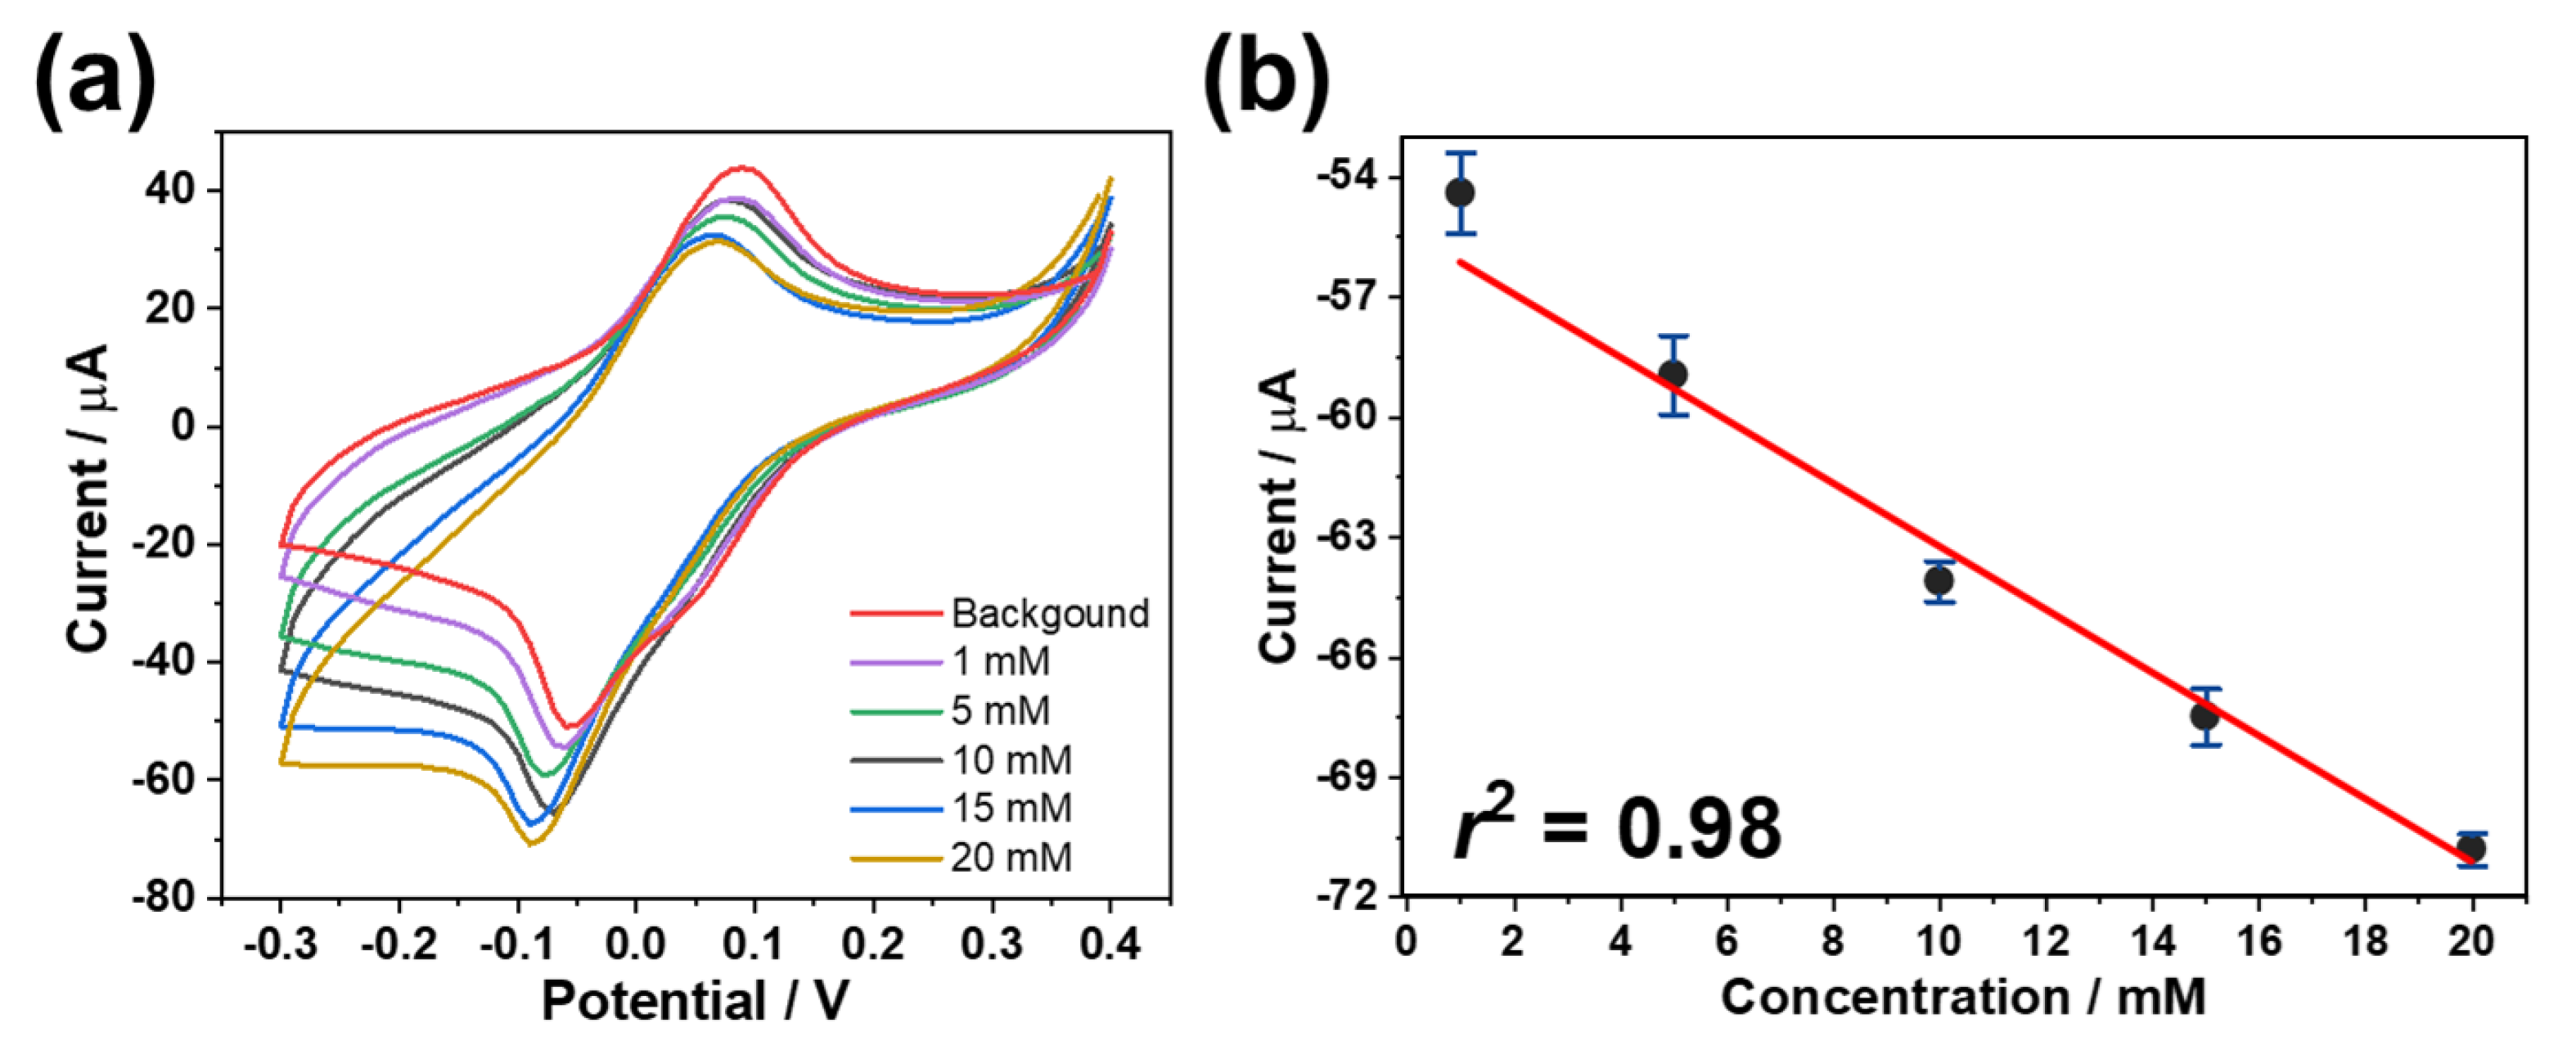
The electroanalytical performance of the glucose biosensor was monitored while changing the concentration of glucose. Within the examined clinically significant concentration range of 1.0–20.0 mM, the biosensor exhibited a well-defined and satisfactory linear response, characterized by a square of the correlation coefficient (r2) of 0.98, as shown in Figure 6. Parameters of the calibration curve are as follows: y = a + b·x; a = −54.915 ± 1.000 μA; and b = −0.815 ± 0.066 μA mM−1. A low limit of detection (LOD) was achieved, i.e., 40 µM, using the 3σ criterion. Furthermore, the biosensor exhibited excellent reproducibility with a relative standard deviation (RSD) of only 1.2%, underscoring its reliability for precise glucose quantification.

3.4. Selectivity and Stability Studies

The applicability of the glucose biosensor was also evaluated in the presence of selected potentially interfering physiological compounds in real samples. This included (i) measurements of each individual interfering compound at its highest concentration level expected in the human body and after the addition of 10.0 mM glucose (Figure S5) and (ii) measurements of all potentially interfering compounds together before and after the addition of 10.0 mM glucose, as shown in Figure 7. This also involved the common interfering compounds in serum, and their typical concentration ranges are as follows: ascorbic acid (11–50 µM), uric acid (0.2–0.4 mM), glycine (0.1– 0.6 mM), maltose monohydrate (<0.1 mM), galactose (<0.03 mM), fructose (11–50 µM), acetaminophen (33–166 µM), and acetylsalicylic acid (0.6–1.7 mM). To evaluate their effects on the response of the biosensor, the corresponding solutions were prepared at the following concentrations, which were even higher than the indicated upper limits: ascorbic acid (0.1 mM), uric acid (0.5 mM), glycine (1.0 mM), maltose monohydrate (0.1 mM), galactose (0.1 mM), fructose (0.1 mM), acetaminophen (0.2 mM), and acetylsalicylic acid (2.0 mM). This approach allows a rigorous assessment of the selectivity of the developed biosensor.
No distinguishable analytical signals were observed for maltose, fructose, galactose, uric acid, ascorbic acid, acetylsalicylic acid, or glycine, as shown in Figure 7 and Figure S6. Only acetaminophen exhibited an oxidation peak at approximately +0.28 V; however, this peak does not interfere with the reduction signal of glucose in the potential range of the cathodic sweep.
The stability of the biosensor was evaluated both in the absence and presence of 10.0 mM glucose. Figure 8 shows the response of the biosensor on days 3, 5, and 7. On these days, the CV measurements were recorded in 0.1 M PBS with and without glucose, and the results indicate that the biosensor maintained satisfactory stability.

3.5. Real Sample Determination

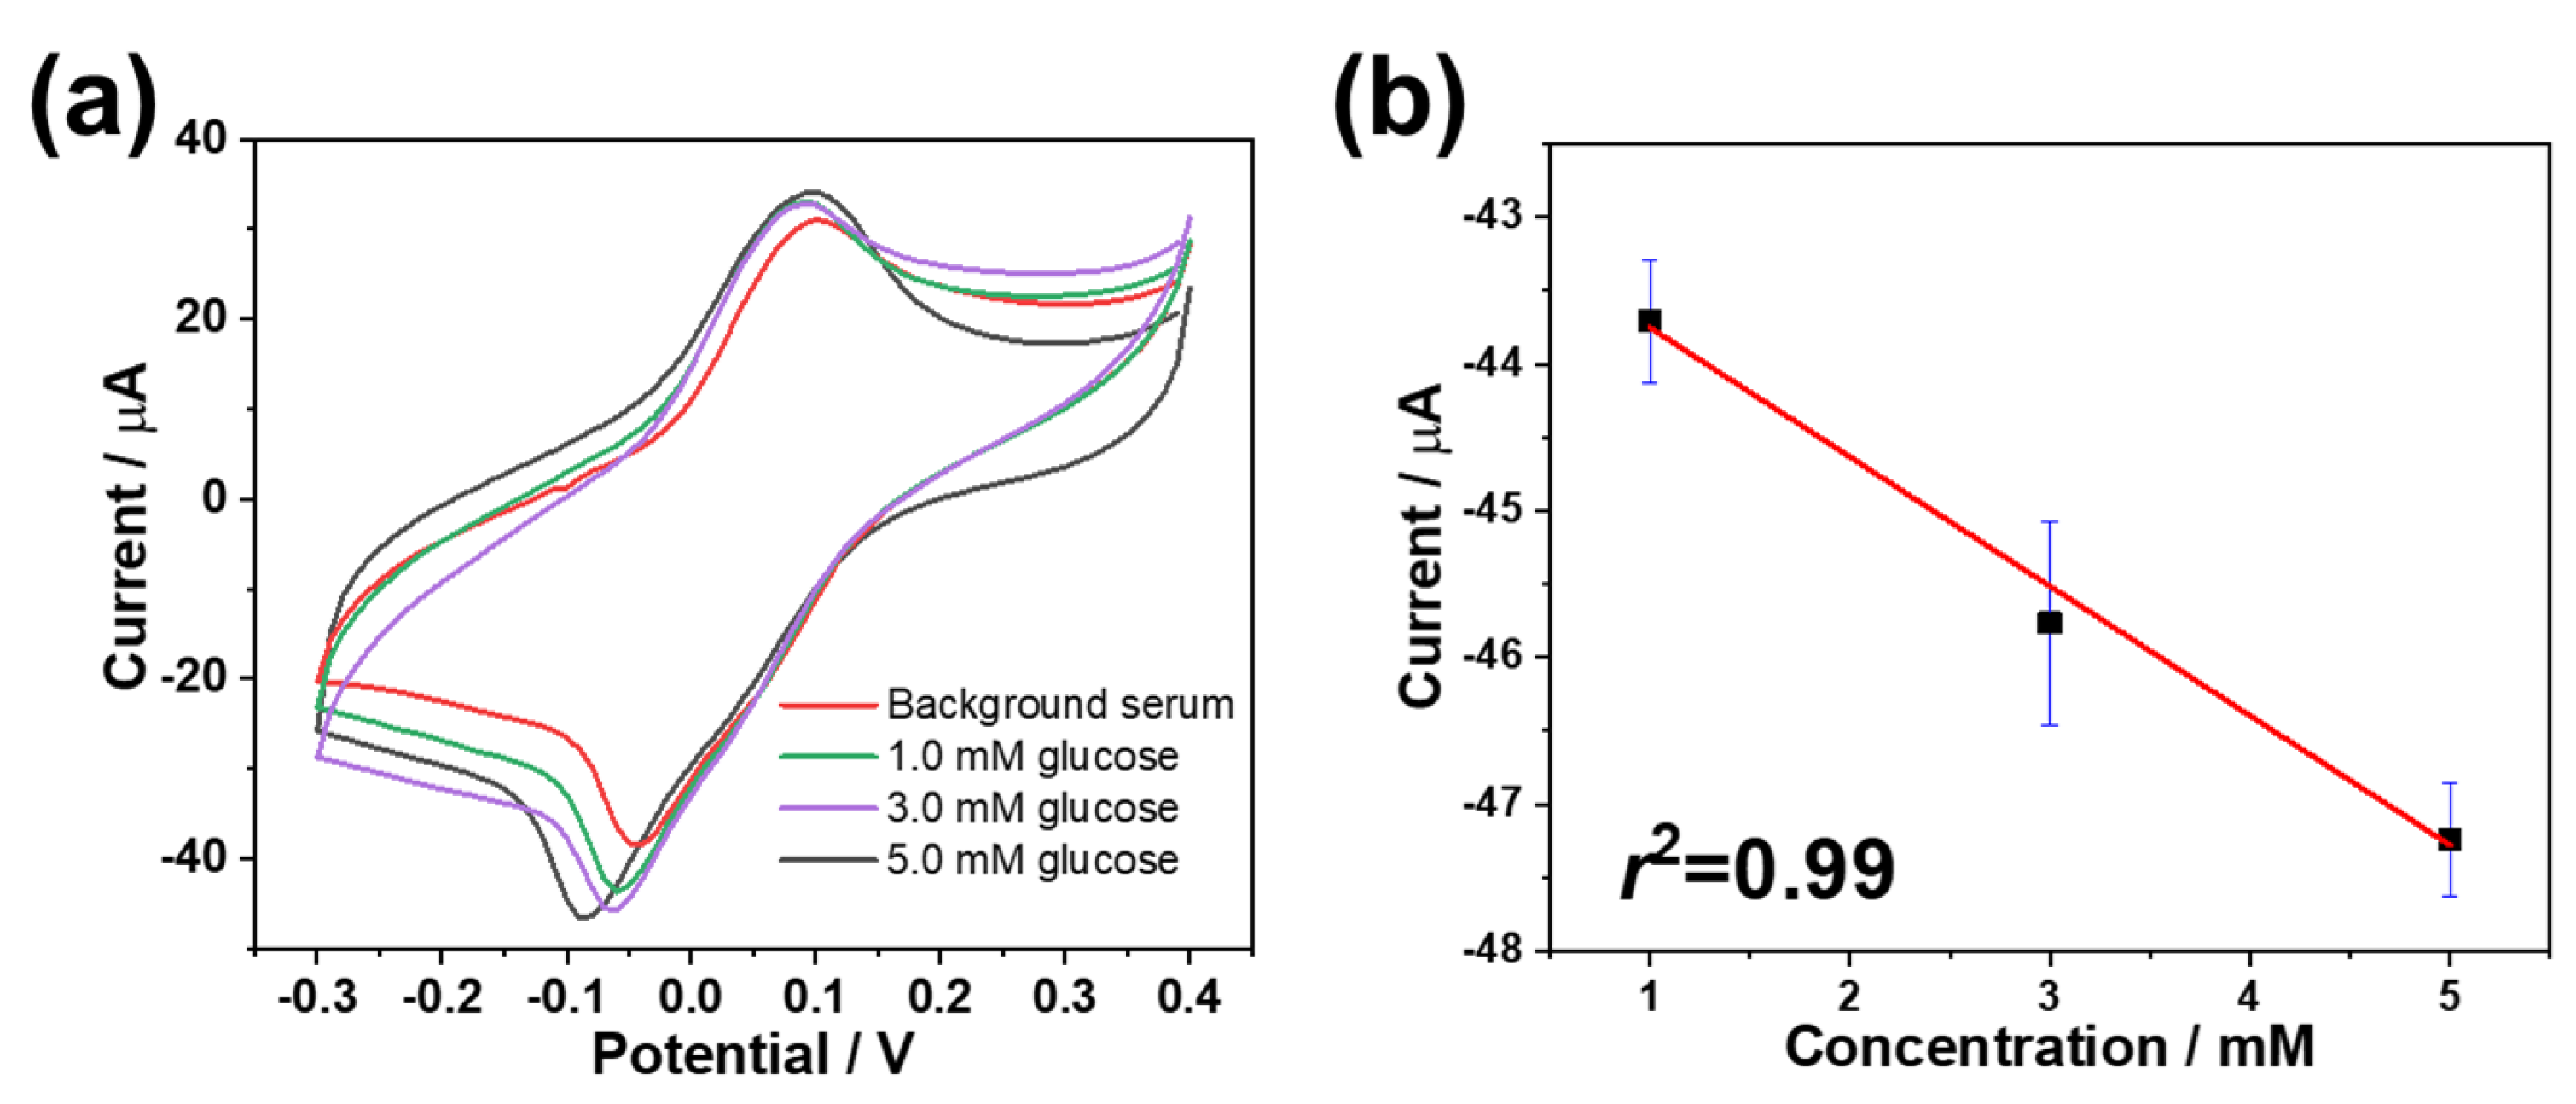
The performance of the biosensor was tested in a real human serum sample spiked with different concentrations of glucose. The experiment was carried out by diluting human serum 1:5 with PBS, and the diluted serum was spiked with 1.0, 3.0, and 5.0 mM glucose, as shown in Figure 9. Firstly, 20 µL of the diluted and non-spiked serum was measured as a background, followed by the measurement of glucose-spiked serum samples. The biosensor exhibited distinct signals for all three tested glucose concentrations with a favorable r2 value of 0.99. In comparison with the results obtained in the 0.1 M PBS, taking into account a complex matrix of the real human serum, the fact that each measurement was performed at a single disposable glucose biosensor, and a slightly lower inherent reproducibility of the commercially available FCN-SPCE, a somewhat lower reproducibility (error bars in Figure 6b vs. Figure 9b) should be considered.

3.6. Comparison to Other Voltammetric Glucose Biosensors

To assess the electroanalytical capability of the newly developed biosensor, its LOD, accessible linear range, and selectivity parameters were compared with previously reported glucose biosensors, as summarized in Table 2.
For consistency, all the biosensors considered in this comparison utilized modified screen-printed electrodes, enabling a direct evaluation of their performances. Notably, the proposed biosensor exhibited excellent selectivity and good reproducibility. While many compared biosensors were tested with only a few interfering substances, our biosensor demonstrated robust performance, remaining unaffected by eight different interfering compounds at their upper threshold concentrations. Notably, the biosensor performed well in real human serum, i.e., in a complex matrix containing numerous potentially interfering compounds. The low LOD of the biosensor ranks among the top-performing glucose detection systems. These findings suggest that the enzymatic biosensor architecture, involving (electro)catalytic materials such as Bi2Ru2O7 supported by MWCNTs, deserves further attention in the development of sensitive and selective biosensing devices.

4. Conclusions

This study presents the development, optimization, and analytical performance of a sensitive and selective electrochemical glucose biosensor. The architecture of the biosensor exploits a combination of a supporting FCN-SPCE, its modification with a layer of MWCNTs, and a layer comprising (electro)catalytic Bi2Ru2O7 pyrochlore clusters together with GOD and Nafion, the latter serving as an immobilization matrix for GOD and the (electro)catalyst, as well as a protection against interferences. The biosensor exhibited favorable electroanalytical properties for the determination of glucose when used in combination with a cyclic voltammetric detection mode. It showed a good linear response in the clinically relevant concentration range, a low LOD of 40 μM, and excellent reproducibility with an RSD of only 1.2%. Notably, when tested against eight potentially present interfering compounds above their upper threshold concentrations, the biosensor showed highly selective and interference-free operation. The applicability of the biosensor was successfully demonstrated by measuring glucose in spiked real human serum samples. These findings highlight the competitive performance of the novel glucose biosensor and its architecture, leveraging (electro)catalytic properties of Bi2Ru2O7 pyrochlore, its combination with highly conductive MWCNTs, and highly selective enzymatic biorecognition building blocks, further corroborating the important role of (electro)catalytically active materials in the development of electrochemical biosensors.

Supplementary Materials

The following supporting information can be downloaded at https://www.mdpi.com/article/10.3390/chemosensors13030109/s1.

Author Contributions

Conceptualization, J.I. and S.B.H.; methodology, J.I., N.T. and S.B.H.; validation, J.I.; formal analysis, J.I., A.D., M.Ž., M.F., K.V. and N.T.; investigation, J.I., A.D., M.Ž., M.F. and N.T.; resources, A.D., M.Ž., M.F. and S.B.H.; data curation, J.I. and S.B.H.; writing—original draft preparation, J.I., N.T. and S.B.H.; writing—review and editing, M.F., K.V., N.T. and S.B.H.; visualization, J.I., N.T. and S.B.H.; supervision, S.B.H. and N.T.; project administration, A.D., M.Ž., M.F. and S.B.H.; funding acquisition, A.D., M.Ž., M.F. and S.B.H. All authors have read and agreed to the published version of the manuscript.

Funding

This research received funding from the Slovenian Research and Innovation Agency (Research Programs P1-0034 and P2-0118 and Research Project J1-4416) and the Ministry of Science, Technological Development and Innovation of the Republic of Serbia (Contract No. 451-03-65/2024-03/200135 and Contract No. 451-03-66/2024-03/200053). The project was co-financed by the Republic of Slovenia, the Ministry of Higher Education, Science and Innovation, and the European Union under the European Regional Development Fund.

Institutional Review Board Statement

Not applicable.

Informed Consent Statement

Not applicable.

Data Availability Statement

Data available upon request.

Conflicts of Interest

The authors declare no conflicts of interest. The funders had no role in the design of the study; in the collection, analyses, or interpretation of data; in the writing of the manuscript; or in the decision to publish the results.

References

  1. Slaughter, G.; Kulkarni, T. Detection of Human Plasma Glucose Using a Self-Powered Glucose Biosensor. Energies 2019, 12, 825. [Google Scholar] [CrossRef]
  2. Cho, N.H.; Shaw, J.E.; Karuranga, S.; Huang, Y.; da Rocha Fernandes, J.D.; Ohlrogge, A.W.; Malanda, B. IDF Diabetes Atlas: Global estimates of diabetes prevalence for 2017 and projections for 2045. Diabetes Res. Clin. Pract. 2018, 138, 271–281. [Google Scholar] [CrossRef]
  3. Wang, Y.; Wang, J. Diagnostic significance of serum FGD5-AS1 and its predictive value for the development of cardiovascular diseases in patients with type 2 diabetes. Diabetol. Metab. Syndr. 2022, 14, 20. [Google Scholar] [CrossRef] [PubMed]
  4. Hwang, D.W.; Lee, S.; Seo, M.; Chung, T.D. Recent advances in electrochemical non-enzymatic glucose sensors—A review. Anal. Chim. Acta 2018, 29, 1–34. [Google Scholar] [CrossRef] [PubMed]
  5. Bruen, D.; Delaney, C.; Florea, L.; Diamond, D. Glucose Sensing for Diabetes Monitoring: Recent Developments. Sensors 2017, 17, 1866. [Google Scholar] [CrossRef] [PubMed]
  6. Sridara, T.; Upan, J.; Saianand, G.; Tuantranont, A.; Karuwan, C.; Jakmunee, J. Non-Enzymatic Amperometric Glucose Sensor Based on Carbon Nanodots and Copper Oxide Nanocomposites Electrode. Sensors 2020, 20, 808. [Google Scholar] [CrossRef]
  7. Martín, A.; Kim, J.; Kurniawan, J.F.; Sempionatto, J.R.; Moreto, J.R.; Tang, G.; Campbell, A.S.; Shin, A.; Lee, M.Y.; Liu, X.; et al. Epidermal Microfluidic Electrochemical Detection System: Enhanced Sweat Sampling and Metabolite Detection. ACS Sens. 2017, 2, 1860–1868. [Google Scholar] [CrossRef]
  8. Kim, J.; Campbell, A.S.; Wang, J. Wearable non-invasive epidermal glucose sensors: A review. Talanta 2018, 177, 163–170. [Google Scholar] [CrossRef]
  9. Emaminejad, S.; Gao, W.; Wu, E.; Davies, Z.A.; Nyein, H.Y.Y.; Challa, S.; Ryan, S.P.; Fahad, H.M.; Chen, K.; Shahpar, Z.; et al. Autonomous sweat extraction and analysis applied to cystic fibrosis and glucose monitoring using a fully integrated wearable platform. Proc. Natl. Acad. Sci. USA 2017, 114, 4625–4630. [Google Scholar] [CrossRef]
  10. Mehdizadeh, B.; Maleknia, L.; Amirabadi, A.; Shabani, M. Glucose sensing by a glassy carbon electrode modified with glucose oxidase/chitosan/graphene oxide nanofibers. Diam. Relat. Mater. 2020, 109, 108073. [Google Scholar] [CrossRef]
  11. Mohamad, N.R.; Marzuki, N.H.C.; Buang, N.A.; Huyop, F.; Wahab, R.A. An overview of technologies for immobilization of enzymes and surface analysis techniques for immobilized enzymes. Biotechnol. Biotechnol. Equip. 2015, 29, 205–220. [Google Scholar] [CrossRef]
  12. Sehit, E.; Altintas, Z. Significance of nanomaterials in electrochemical glucose sensors: An updated review (2016–2020). Biosens. Bioelectron. 2020, 159, 112165. [Google Scholar] [CrossRef]
  13. Gorle, D.B.; Ponnada, S.; Kiai, M.S.; Nair, K.K.; Nowduri, A.; Swart, H.C.; Ang, E.H.; Nanda, K.K. Review on recent progress in metal-organic framework-based materials for fabricating electrochemical glucose sensors. J. Mater. Chem. B 2021, 9, 7927–7954. [Google Scholar] [CrossRef]
  14. Abellán-Llobregat, A.; Jeerapan, I.; Bandodkar, A.; Vidal, L.; Canals, A.; Wang, J.; Morallón, E. A stretchable and screen-printed electrochemical sensor for glucose determination in human perspiration. Biosens. Bioelectron. 2017, 91, 885–891. [Google Scholar] [CrossRef] [PubMed]
  15. Bauer, M.; Wunderlich, L.; Weinzierl, F.; Lei, Y.; Duerkop, A.; Alshareef, H.N.; Baeumner, A.J. Electrochemical multi-analyte point-of-care perspiration sensors using on-chip three-dimensional graphene electrodes. Anal. Bioanal. Chem. 2021, 413, 763–777. [Google Scholar] [CrossRef]
  16. Jugović, B.; Grgur, B.; Antov, M.; Knežević-Jugović, Z.; Stevanović, J.; Gvozdenović, M. Polypyrrole-based Enzyme Electrode with Immobilized Glucose Oxidase for Electrochemical Determination of Glucose. Int. J. Electrochem. Sci. 2016, 11, 1152–1161. Available online: http://www.electrochemsci.org/papers/vol11/110201152.pdf (accessed on 14 January 2025). [CrossRef]
  17. Hrovat, M. Temperature Sensors Made by Combinations of Some Standard Thick Film Materials. J. Mater. Sci. Lett. 2000, 19, 651–655. [Google Scholar] [CrossRef]
  18. Dziedzic, A.; Golonka, L. Electrical Properties of Conductive Materials Used in Thick-Film Resistors. J. Mater. Sci. 1988, 23, 3151–3155. [Google Scholar] [CrossRef]
  19. Kim, M.; Ju, H.; Kim, J. Single Crystalline Bi2Ru2O7 Pyrochlore Oxide Nanoparticles as Efficient Bifunctional Oxygen Electrocatalyst for Hybrid Na-Air Batteries. Chem. Eng. J. 2019, 358, 11–19. [Google Scholar] [CrossRef]
  20. Esposito, V.; Luong, B.H.; Di Bartolomeo, E.; Wachsman, E.D.; Traversa, E. Applicability of Bi2Ru2O7 Pyrochlore Electrodes for ESB and BIMEVOX Electrolytes. J. Electrochem. Soc. 2006, 153, A2232. [Google Scholar] [CrossRef]
  21. Bamiduro, G.J.; Zahran, E.M. Pd@Bi2Ru2O7/BiVO4 Z-Scheme Heterojunction Nanocomposite Photocatalyst for the Degradation of Trichloroethylene. ACS Appl. Mater. Interfaces 2023, 15, 59337–59347. [Google Scholar] [CrossRef] [PubMed]
  22. Shimizu, Y.; Nishi, H.; Suzuki, H.; Maeda, K. Solid-State NOx Sensor Combined with NASICON and Pb–Ru-Based Pyrochlore-Type Oxide Electrode. Sens. Actuators B Chem. 2000, 65, 141–143. [Google Scholar] [CrossRef]
  23. Tasić, N.; Vranešič, N.; Metarapi, D.; Mervič, K.; Žunić, M.; Dapčević, A.; Finšgar, M.; Hočevar, S.B. Protein Stacking on the APTES-Functionalized Pyrochlore Bi2Ru2O7 Clusters for Ultrasensitive and Selective Immunosensing. ACS Appl. Mater. Interfaces 2025, 17, 10792–10801. [Google Scholar] [CrossRef] [PubMed]
  24. Park, J.; Jang, H.; Lee, S.Y.; Jeon, J.; Kim, M.G. Redox reaction does not facilitate oxygen evolution on bismuth ruthenate pyrochlore. J. Mater. Chem. A 2022, 10, 561–569. [Google Scholar] [CrossRef]
  25. Jun, L.Y.; Mubarak, N.M.; Yon, L.S.; Bing, C.H.; Khalid, M.; Abdullah, E.C. Comparative Study of Acid Functionalization of Carbon Nanotube via Ultrasonic and Reflux Mechanism. J. Environ. Chem. Eng. 2018, 6, 5889–5896. [Google Scholar] [CrossRef]
  26. Carbonio, R.E.; Alonso, J.A.; Martínez, J.L. Oxygen Vacancy Control in the Defect Pyrochlore: A Way to Tune the Electronic Bandwidth. J. Phys. Condens. Matter 1999, 11, 361–369. [Google Scholar] [CrossRef]
  27. Shukla, A.K.; Kannan, A.M.; Hegde, M.S.; Gopalakrishnan, J. Effect of Counter Cations on Electrocatalytic Activity of Oxide Pyrochlores towards Oxygen Reduction/Evolution in Alkaline Medium: An Electrochemical and Spectroscopic Study. J. Power Sources 1991, 35, 163–173. [Google Scholar] [CrossRef]
  28. Felthouse, T. Expanded Lattice Ruthenium Pyrochlore Oxide Catalysts II. Catalyst Surface Investigations by Electron Microscopy, X-Ray Photoelectron Spectroscopy, and Temperature-Programmed Reduction and Oxidation. J. Catal. 1991, 127, 421–444. [Google Scholar] [CrossRef]
  29. Chipeture, A.T.; Apath, D.; Moyo, M.; Shumba, M. Multiwalled carbon nanotubes decorated with bismuth (III) oxide for electrochemical detection of an antipyretic and analgesic drug paracetamol in biological samples. J. Anal. Sci. Technol. 2019, 10, 22. [Google Scholar] [CrossRef]
  30. Dighole, R.P.; Munde, A.V.; Mulik, B.B.; Sathe, B.R. Bi2O3 Nanoparticles Decorated Carbon Nanotube: An Effective Nanoelectrode for Enhanced Electrocatalytic 4-Nitrophenol Reduction. Front. Chem. 2020, 8, 325. [Google Scholar] [CrossRef]
  31. Myndrul, V.; Iatsunskyi, I.; Babayevska, N.; Jarek, M.; Jesionowski, T. Effect of Electrode Modification with Chitosan and Nafion® on the Efficiency of Real-Time Enzyme Glucose Biosensors Based on ZnO Tetrapods. Materials 2022, 15, 4672. [Google Scholar] [CrossRef] [PubMed]
  32. Maity, D.; Minitha, C.R.; Kumar, R.T.R. Glucose oxidase immobilized amine terminated multiwall carbon nanotubes/reduced graphene oxide/polyaniline/gold nanoparticles modified screen-printed carbon electrode for highly sensitive amperometric glucose detection. Mater. Sci. Eng. C Mater. Biol. Appl. 2019, 105, 110075. [Google Scholar] [CrossRef] [PubMed]
  33. Chong, S.F.; Razak, K.A.; Nor, N.M.; Ridhuan, N.S.; Zakaria, N.D. Electrochemical Glucose Detection using Screen-Printed Carbon Electrode Modified Silica-Encapsulated Iron Oxide Nanoparticles. Mater. Today Proc. 2019, 17, 1189–1196. [Google Scholar] [CrossRef]
  34. Hu, T.; Wang, D.; Xu, J.; Chen, K.; Li, X.; Yi, H.; Ni, Z. Glucose sensing on screen-printed electrochemical electrodes based on porous graphene aerogel @prussian blue. Biomed. Microdevices 2022, 24, 14. [Google Scholar] [CrossRef]
  35. Niamsi, W.; Larpant, N.; Kalambate, P.K.; Primpray, V.; Karuwan, C.; Rodthongkum, N.; Laiwattanapaisal, W. Paper-Based Screen-Printed Ionic-Liquid/Graphene Electrode Integrated with Prussian Blue/MXene Nanocomposites Enabled Electrochemical Detection for Glucose Sensing. Biosensors 2022, 12, 852. [Google Scholar] [CrossRef]
  36. Phetsang, S.; Jakmunee, J.; Mungkornasawakul, P.; Laocharoensuk, R.; Ounnunkad, K. Sensitive amperometric biosensors for detection of glucose and cholesterol using a platinum/reduced graphene oxide/poly(3-aminobenzoic acid) film-modified screen-printed carbon electrode. Bioelectrochemistry 2019, 127, 125–135. [Google Scholar] [CrossRef]
  37. Phasuksom, K.; Sirivat, A. Chronoampermetric detection of enzymatic glucose sensor based on doped polyindole/MWCNT composites modified onto screen-printed carbon electrode as portable sensing device for diabetes. RSC Adv. 2022, 12, 28505–28518. [Google Scholar] [CrossRef]
  38. Ji, D.; Liu, L.; Li, S.; Chen, C.; Lu, Y.; Wu, J.; Liu, Q. Smartphone-based cyclic voltammetry system with graphene modified screen printed electrodes for glucose detection. Biosens. Bioelectron. 2017, 98, 449–456. [Google Scholar] [CrossRef]
Figure 1. FE-SEM images of as-synthesized Bi2Ru2O7 clusters, including acquisition sites for the EDX analysis (a) and an FE-SEM image of the MWCNTs (b).
Chemosensors 13 00109 g001
Figure 2. High-resolution XPS spectra for (a) Bi 4f, (b) O 1s, (c) Bi 4d and Ru 3p, and (d) C 1s, measured on as-synthesized Bi2Ru2O7 clusters drop-casted onto supporting electrode.
Chemosensors 13 00109 g002
Figure 3. CV measurements recorded in 0.1 M PBS (pH = 7.4) using a sensor without integrated GOD in the presence (green) and absence (black) of 10 mM glucose and a biosensor with integrated GOD in the presence (blue) and absence (red) of 10 mM glucose (a); CV measurements recorded using a biosensor with only Bi2Ru2O7 pyrochlore clusters (green) and with both MWCNTs and Bi2Ru2O7 pyrochlore clusters (red) included (b). The dotted CV measurements correspond to backgrounds. Scan rate of 100 mV s−1.
Chemosensors 13 00109 g003
Figure 4. CV peak currents recorded in 0.1 M PBS containing 10 mM glucose, with the biosensor fabricated using different loadings of MWCNTs, i.e., 0.5, 1.0, 5.0, 10.0, and 20.0 mg mL−1 (a), and Bi2Ru2O7, i.e., 0.5, 5.0, 10.0, and 30.0 mg mL−1 (b). Other conditions are as in Figure 3.
Chemosensors 13 00109 g004
Figure 5. CV peak currents recorded in 0.1 M PBS containing 10 mM glucose, with the biosensor fabricated using different loadings of Nafion, i.e., 0.1, 0.5, 1.0, 2.0, and 3.0% (a), and GOD, i.e., 1, 5, 10, 20, and 30 mg mL−1 (b). Other conditions are as in Figure 3.
Chemosensors 13 00109 g005
Figure 6. CV measurements recorded for successive increments of glucose concentrations in the range of 1.0–20.0 mM (a) and the corresponding calibration plot (b). Other conditions are as in Figure 3.
Chemosensors 13 00109 g006
Figure 7. CV measurements recorded for a background (red), eight selected interferants mixed together (green), and eight selected interferents combined with 10.0 mM glucose (blue). Other conditions are as in Figure 3.
Chemosensors 13 00109 g007
Figure 8. CV signal dependence on the storage duration in the absence (red) and presence (blue) of 10 mM glucose. Storage conditions: refrigerator (4 °C, 65% relative humidity) (a). CV measurements of three sets of biosensors stored in the refrigerator for 3, 5, and 7 days in the absence and presence of 10.0 mM glucose (b). Other conditions are as in Figure 3.
Chemosensors 13 00109 g008
Figure 9. CV measurements recorded in a diluted serum (red) and in serum spiked with 1.0 (green), 3.0 (purple), and 5.0 mM (black) glucose concentrations (a) and the corresponding calibration plot (b). Other conditions are as in Figure 3.
Chemosensors 13 00109 g009
Table 1. EDX data obtained at the acquisition sites are shown in Figure 1a.
SpectrumRu, at.%Bi, at.%O, at.%
138.537.723.9
242.232.025.8
315.212.772.1
414.116.669.3
516.013.570.5
620.117.162.8
Table 2. Comparative performance study of the newly developed biosensor with other FCN-SPCE-based biosensors for the detection of glucose.
SensorTechniqueLOD 1 [mM]AR 2
[mM]
Int 3Ref.
GOD immobilized amine terminated MWCNTs/rGO 4/PANI 5/AuNPs 6CA 70.0641–10No[32]
Nafion Silica-Encapsulated Iron Oxide NPsCA0.22<3/[33]
Porous graphene aerogel@Prussian blueCA0.150.5–6No[34]
Ionic-Liquid/Graphene Electrode Integrated with Prussian Blue/MXene NanocompositesCA0.0240.05–15No[35]
Pt/rGO/poly(3-aminobenzoic acid) filmCA0.04430.25–6AA 8, UA 9[36]
Doped polyindole/MWCNTs compositesCA0.010.01–50No[37]
Graphene-modified screen-printed electrodesCV 100.0260.1–10AA[38]
MWCNTs/Bi2Ru2O7 +GOD-modified FCN-SPCECV0.0401.0–20.0NoThis work
1 LOD, 2 analytical range, 3 selectivity study, 4 reduced graphene oxide, 5 polyaniline, 6 Au nanoparticles, 7 chronoamperometry, 8 ascorbic acid, 9 uric acid, 10 CV.
Disclaimer/Publisher’s Note: The statements, opinions and data contained in all publications are solely those of the individual author(s) and contributor(s) and not of MDPI and/or the editor(s). MDPI and/or the editor(s) disclaim responsibility for any injury to people or property resulting from any ideas, methods, instructions or products referred to in the content.