Communication

Fluorescence Detection of 4-Hydroxy-2,5-dimethyl-3(2H)-furanone Based on Fluorescence Resonance Energy Transfer and Competitive Host–Guest Recognition

1
Jiangsu Engineering Laboratory of Smart Carbon-Rich Materials and Device, School of Chemistry and Chemical Engineering, Southeast University, Nanjing 211189, China
2
Beijing Life Science Academy, Beijing 102200, China
*
Authors to whom correspondence should be addressed.
Chemosensors 2025, 13(3), 110; https://doi.org/10.3390/chemosensors13030110
Submission received: 25 December 2024 / Revised: 11 March 2025 / Accepted: 14 March 2025 / Published: 16 March 2025

Abstract

:
Sweetening compounds are commonly incorporated into food products to enhance their texture and flavor, thereby indicating product quality. 4-Hydroxy-2,5-dimethyl-3(2H)-furanone (HDMF) is a sweet aromatic compound characterized by its pineapple-like baking scent. While it serves as a taste enhancer in various industries, including wine production and soy sauce manufacturing, HDMF also exhibits DNA-damaging activity in foods. In this study, a fluorescence detection method based on fluorescence resonance energy transfer (FRET) for the sensitive detection of HDMF was developed. Initially, gold nanoparticles were deposited onto the surface of Fe3O4 to create fluorescence-quenching materials. Subsequently, thiol-functionalized β-cyclodextrin (SH-β-CD) was modified to provide cavities that allow the fluorescent dye rhodamine 6G (R6G) to enter. The fluorescence of R6G remains quenched until HDMF is present because it will compete with R6G for binding sites within the SH-β-CD cavities through competitive host–guest recognition. Furthermore, the fluorescence intensity of R6G at 553 nm exhibited a strong linear correlation with the logarithmic value of HDMF concentration over a range from 5 × 10⁻⁷ M to 10−4 M. This rapid and sensitive fluorescence detection strategy rooted in FRET and competitive host–guest recognition demonstrated significant potential for detecting HDMF in food products.

1. Introduction

Sweet compounds, both naturally occurring and added to cigarettes, mitigate the harshness of smoke and significantly enhance the overall taste experience. To evaluate cigarette quality, it is essential to identify the key sweet components in cigarette smoke [1,2]. These compounds can be classified into five groups: sugar alcohols, furans, pyrans, ketones, and phenols. Notable contributors to the sweet flavor profile include glucose, fructose, maltol, 4-Hydroxy-2,5-dimethyl-3(2H)-furanone (HDMF), 5-methylfural, and 2-furaldehyde [3,4,5,6]. HDMF is an aromatic compound characterized by a baking flavor reminiscent of pineapples. It is found in fresh fruits such as pineapple and strawberries [7,8]. While it serves as a taste enhancer in various industries including wine production and soy sauce manufacturing, HDMF also exhibits DNA-damaging activity when present in foods [9,10,11,12,13,14,15]. Consequently, although its application in the food industry for flavor enhancement is viable, careful evaluation of its content is imperative.
Common methods for detecting HDMF include liquid chromatography (LC), mass spectrometry (MS), gas chromatography (GC), and stable isotope dilution assays [16,17,18,19]. Although these techniques can detect multiple targets simultaneously, they often involve time-consuming, complex procedures. Therefore, there is a pressing need for simpler methodologies that allow for more sensitive and rapid detection of HDMF. Spectral analysis has gained popularity due to its straightforward processes. Techniques such as UV–visible spectroscopy and fluorescence are commonly employed [15]. Among these methods, fluorescence has become particularly favored owing to its superior sensitivity and simplicity. Recent advancements have led to assays with lower detection limits by Förster resonance energy transfer (FRET). In this context, when two chromophores overlap within a proximity range of 1–10 nm, the fluorescence signal from one chromophore can be quenched by another one [20].
Gold nanoparticles (Au NPs) are extensively used as energy receptors due to their ease of chemical modification and high fluorescence quenching coefficients [21,22]. Additionally, Fe3O4 nanoparticles (Fe3O4 NPs) possess numerous advantageous properties including electrical conductivity, magnetic characteristics, and biocompatibility [23,24,25]. Materials containing Fe3O4 NPs could be effectively magnetically separated without requiring pretreatment [26,27]. On the other hand, Fe3O4 NPs are also excellent fluorescence quenchers because of their wide UV–vis absorption and large surface areas, which have great application potential in fluorometric detection [28,29]. However, the quenching effects of Fe3O4 and Au nanoparticles alone are limited. Therefore, Fe3O4@Au composites have been established to achieve a better quenching effect. Thiol-functionalized β-cyclodextrin (SH-β-CD) possesses a hollow cylindrical structure with a hydrophilic outer surface and a lipophilic inner cavity [21]. Hydrophobic molecules selectively enter the cavities of SH-β-CD through host–guest recognition. Different guest molecules exhibit varying binding affinities to the cavities of SH-β-CD and compete for these spaces when present simultaneously [30,31]. This competitive mechanism allows for the indirect detection of target substances that lack direct signals by monitoring signal changes from competing entities. Thus, various sensors based on SH-β-CD have been created [32,33].
In this study, we established a fluorescence method for detecting HDMF using Fe3O4@Au-CD as a fluorescence sensor, as illustrated in Scheme 1A. The Fe3O4 NPs were ammoniated to acquire a positive charge, enabling them to interact with negatively charged Au NPs via electrostatic forces. Subsequently, SH-β-CD was conjugated to the Fe3O4@Au composite through an Au-S bond. The resulting Fe3O4@Au-CD exhibited an enhanced quenching effect compared to either standalone Fe3O4 or Au NPs and served as an effective fluorescence quencher for HDMF detection (Scheme 1B). When R6G coexisted with Fe3O4@Au-CD, it entered the cavities of SH-β-CD, leading to its fluorescence being quenched via FRET. In the presence of HDMF within this reaction system, it displaced R6G through host–guest interactions, allowing entry into SH-β-CD’s cavities. This resulted in the activation of R6G’s fluorescence. With the increased amount of HDMF, the fluorescence intensity of R6G increased, with a good linear relationship between fluorescence intensities and the lg value of HDMF concentrations in the range of 5 × 10⁻⁷ M to 10−4 M. This simple and sensitive fluorescence detection method based on FRET and competitive host–guest recognition showed good application potential in HDMF detection.

2. Experiment

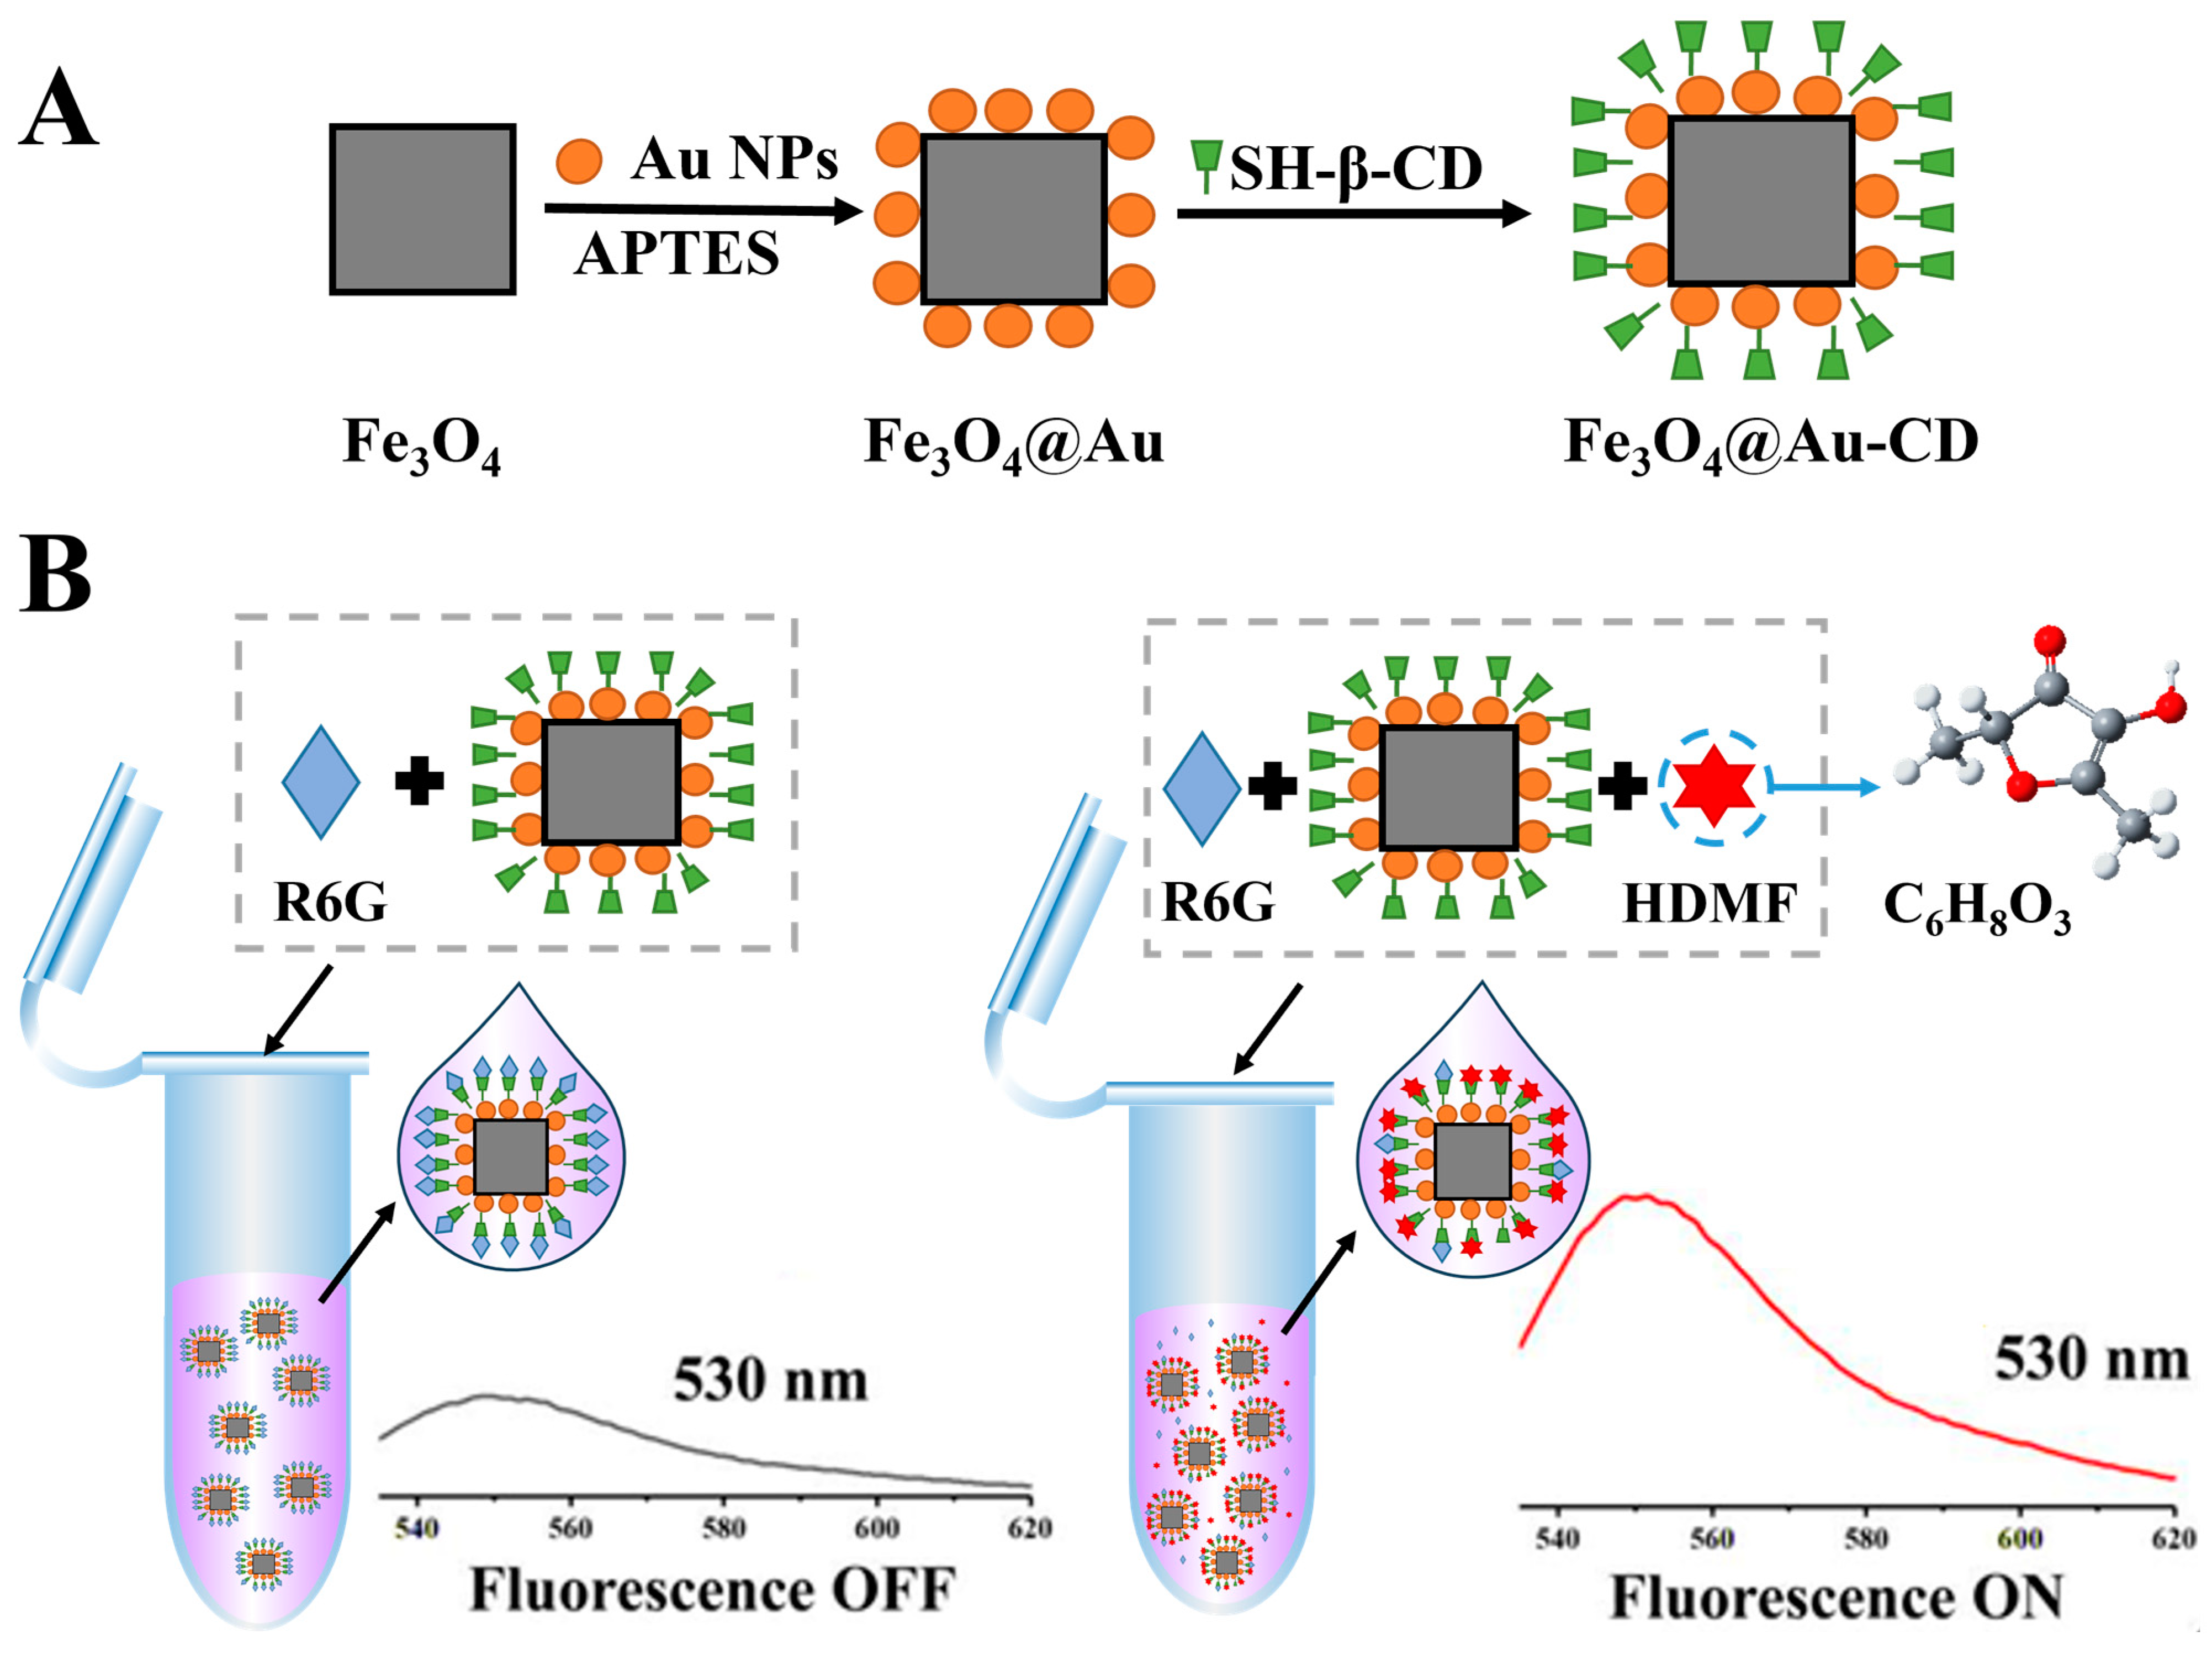
2.1. Preparation of Fe3O4@Au-CD

The synthesis of Au nanoparticles (about 13 nm) was carried out as follows. An amount of 50 mL of HAuCl4·4H2O (2%) solution was heated to boiling while stirring at 2000 rpm. Then, 5 mL of 44 mM sodium citrate solution was quickly added and stirred for 15 min. The solution was kept under stirring until it cooled to room temperature. The synthesized Au NPs were collected and stored at 4 °C for later use.
A total of 8 mg of Fe3O4 NPs (about 100 nm), dispersed in 15 mL of ethanol, were mixed with 400 μL of 3-APTES under vigorous stirring for 4 h to obtain the ammoniated surface. The precipitates (Fe3O4-NH2) were washed three times with ethanol and water to remove excess APTES. Subsequently, the Fe3O4-NH2 was dispersed in 5 mL of water and mixed with another 5 mL of Au NP solution under gentle stirring for 8 h to form the Fe3O4@Au. The precipitates were washed three times with water to remove the unbounded Au NPs. Then, 15 mL of 0.067 mg mL−1 SH-β-CD was added and stirred for 4 h to fabricate the Fe3O4@Au-CD for later experiments. The final products were washed with water to remove superfluous SH-β-CD and re-dispersed in 5 mL water for further use.

2.2. Fluorescence Detection of HDMF

A 40 μL sample of Fe3O4@Au-CD from the solution above was mixed with 20 μL of 0.1 M R6G to create the FRET system. A 100 μL solution of HDMF with varying concentrations (from 0.5 to 100 μM) was added to compete with R6G for binding. The resulting reaction mixture was then diluted to a final volume of 1 mL and shaken for 20 min for the competitive reactions of R6G and HDMF. Following this, the fluorescence of R6G was measured at an excitation wavelength of 530 nm on an FS5 spectrofluorometer.

2.3. HDMF Detection in Real Samples

The samples selected for this study were pineapple drinks and tobacco. The pineapple drink sample was prepared by diluting 1 mL of pineapple drink into 10 mL of water solution. The tobacco sample was obtained from commercially available cigarettes. A 10 mL solution containing 0.1 g of tobacco powder was ultrasonicated for 30 min. The tobacco sample solution was obtained after filtration. Different concentrations (5 × 10⁻⁷ M, 5 × 10⁻⁶ M, 5 × 10⁻⁵ M) of HDMF were spiked into the pineapple drinks and tobacco solutions to be determined. Each spiked sample was displayed in three parallel experiments.

3. Results and Discussion

3.1. Characterization of Fe3O4@Au-CD

Morphologies of Fe3O4@Au-CD were characterized by high-resolution transmission electron microscopy (HRTEM). The HRTEM (Figure 1A) and scanning transmission electron microscopy (STEM) (Figure 1B) images showed that small spherical nanoparticles were adsorbed on the surface of the large cube nanoparticles. The energy-dispersive X-ray spectroscopy (EDX) elements mapping images illustrated how Au NPs (Figure 1D) were adsorbed onto the surface of the cube Fe3O4 NPs (Figure 1C) and SH-β-CD was bonded to the surface of the particles (Figure 1E). Zeta potential was used to confirm the modification step (Figure 1F). The Fe3O4 had a negative charge and the zeta potential value was −13.1 mV. After the modification of APTES, the zeta potential value of Fe3O4 was positive, with a value of 6.9 mV. Au NPs showed a negative charge due to sodium citrate, which made Fe3O4@Au and Fe3O4@Au-CD negative. The Fe3O4 NPs were ammoniated to be positively charged, which were prone to attract negatively charged Au NPs [34]. SH-β-CD bound to Fe3O4@Au via Au-S bonds [35]. According to the UV–vis spectrophotometer (Figure 1G), Fe3O4 NPs had good absorption in 400 nm to 800 nm [26,28]. The absorbance of Fe3O4@Au and Fe3O4@Au-CD increased in the band of 550 nm to 700 nm due to the loaded Au NPs. Compared with bare AuNPs, the absorption peak of Fe3O4@Au and Fe3O4@Au-CD had a red shift due to the change in surface charge [36,37]. These characterization results indicated the successful preparation of the Fe3O4@Au-CD.

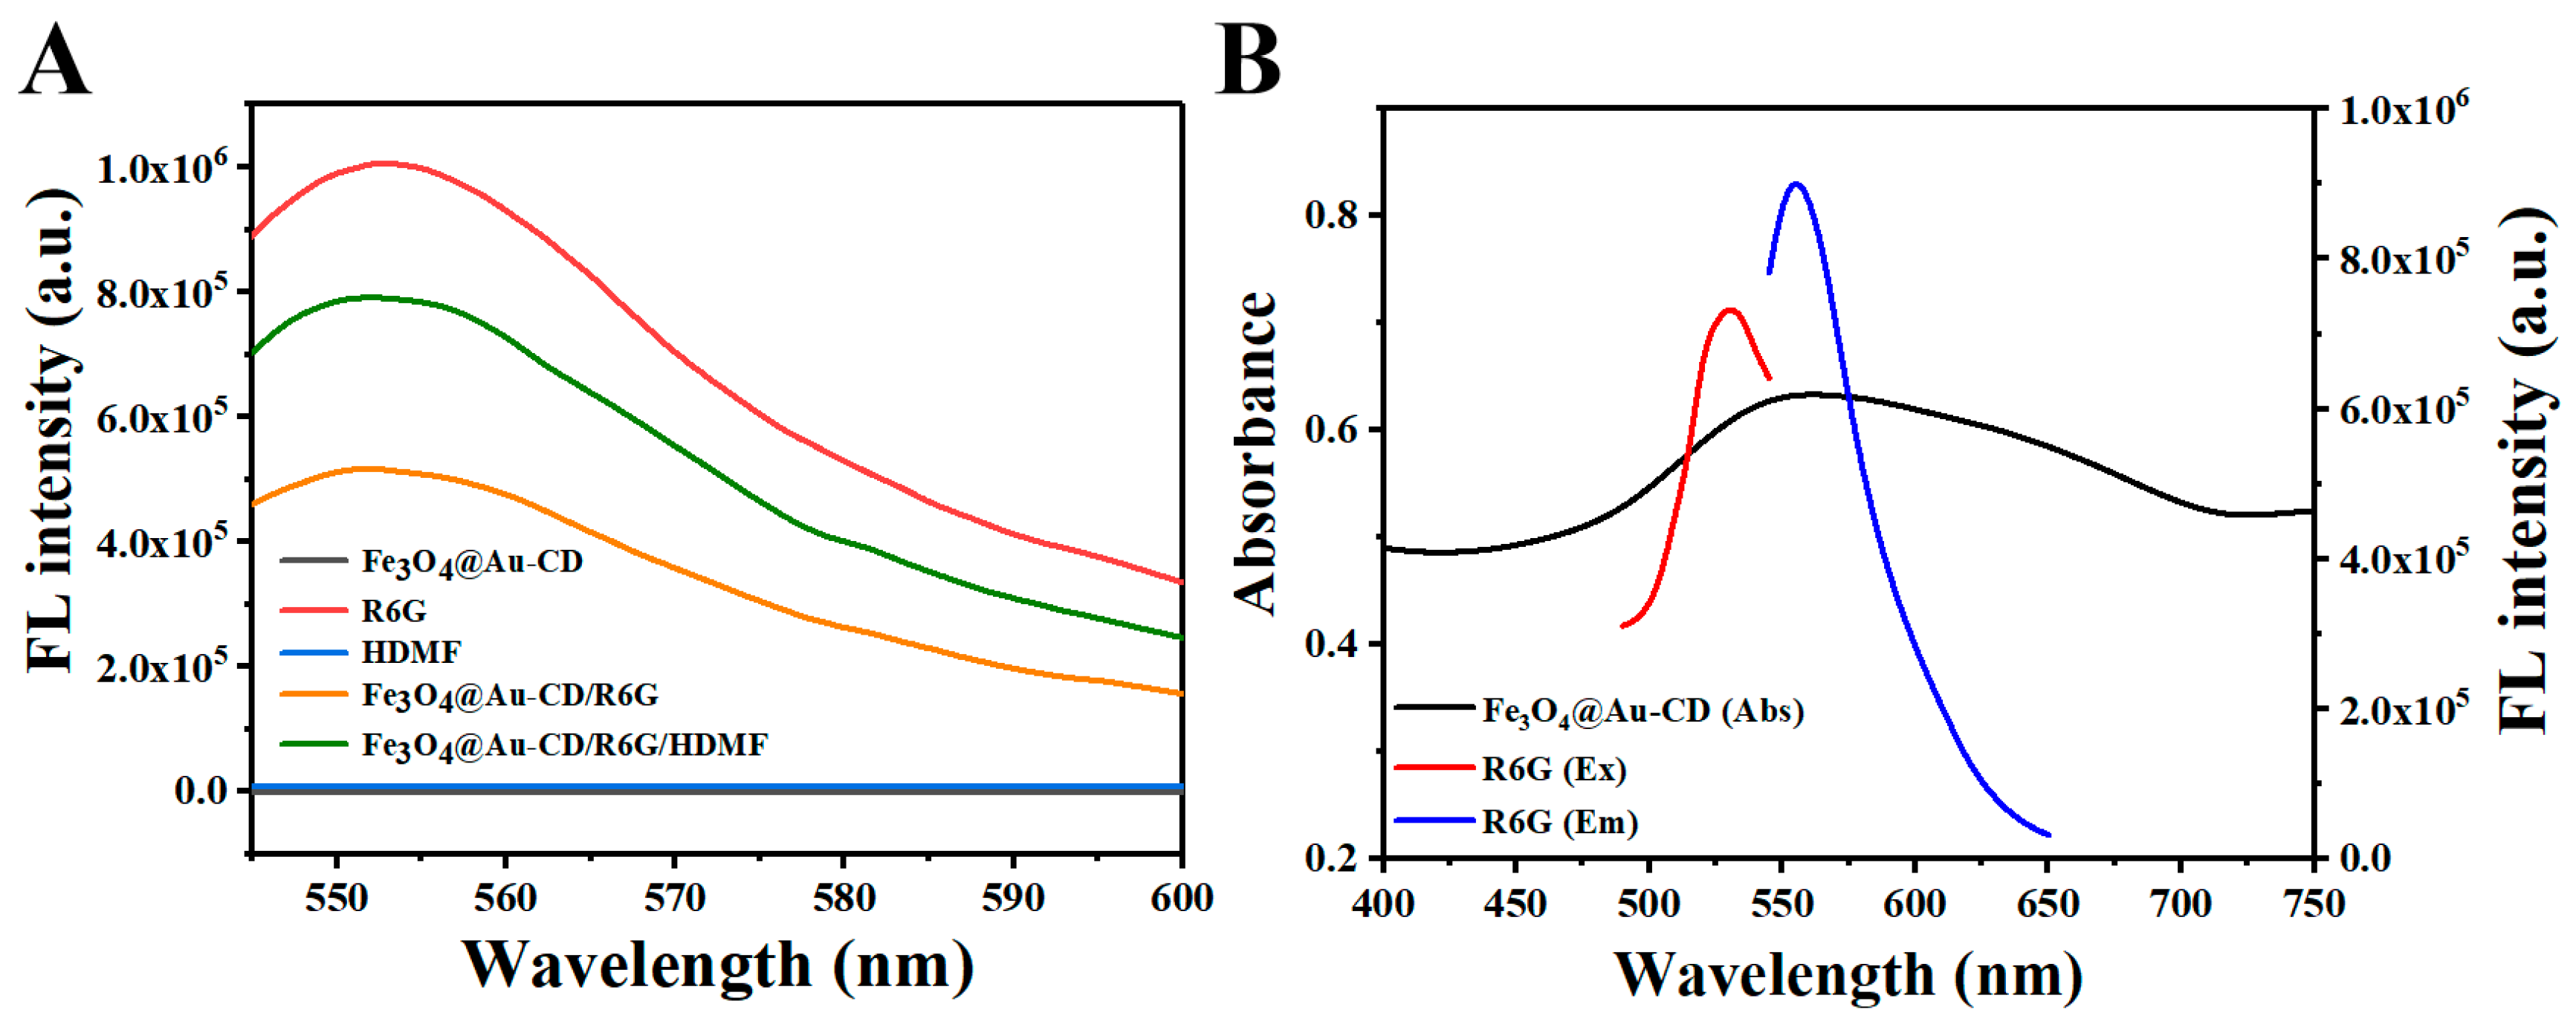
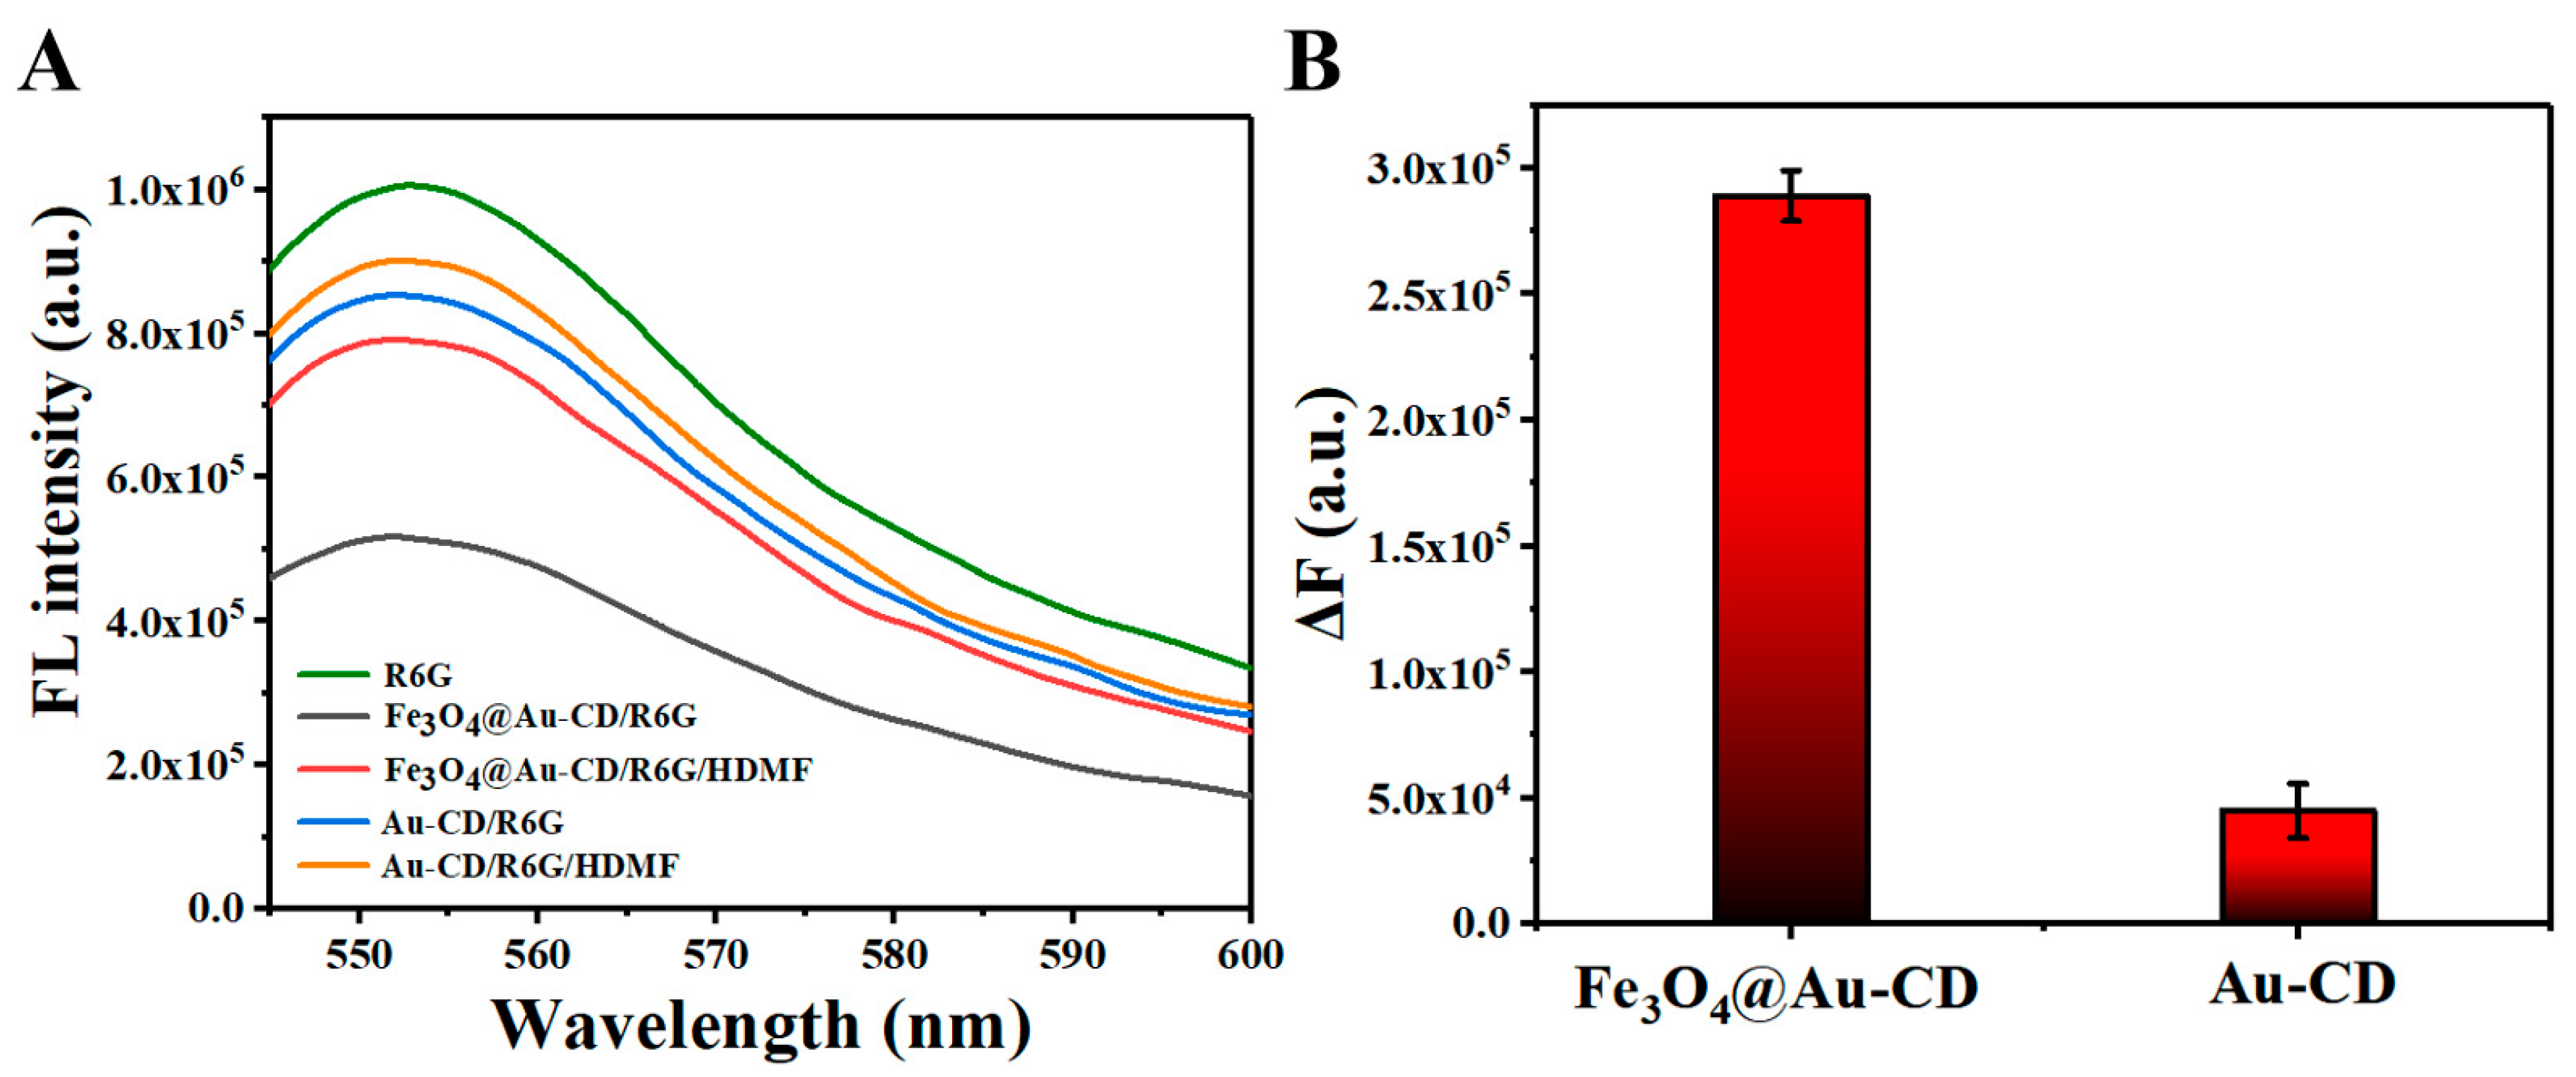
3.2. Feasibility of Detecting HDMF

The feasibility of the fluorescence method for detecting HDMF was evaluated. As shown in Figure 2A, when the excitation wavelength was 530 nm, neither the Fe3O4@Au-CD (black curve) nor the target HDMF (blue curve) had a fluorescence signal. The red curve in Figure 2A showed an obvious fluorescence emission peak when the R6G existed alone and the maximum fluorescence intensity peak was at 553 nm. However, the fluorescence intensity of R6G at 553 nm decreased sharply when Fe3O4@Au-CD and R6G were mixed (orange curve in Figure 2A), which implied that the fluorescence signal of R6G was quenched by Fe3O4@Au-CD.
The absorption spectrum of Fe3O4@Au-CD overlapped with the fluorescence emission spectrum of R6G, as shown in Figure 2B, indicating the possibility of FRET. On the other hand, the fluorescence excitation spectrum of R6G also overlapped with the absorption spectrum of R6G, which suggested that the inner filter effect (IFE) also caused the quenching [38]. However, when Fe3O4@Au-CD, R6G, and the target HDMF coexisted, the fluorescence intensity of R6G was restored (green curve in Figure 2A). The reason was that HDMF could replace R6G for the cavities of β-CD, which released the R6G into the solution. The IFE does not require the distance between the fluorophore and the quencher [39], so the fluorescence signal changing from “off” to “on” was caused by the disruption of FRET. These results prove that it is feasible to establish a fluorescence method for HDMF detection based on FRET and competitive host–guest recognition.

3.3. Optimization of HDMF Detection

To improve the detection performance of the method, experimental conditions were optimized. Firstly, the optimal sensing material was studied. Au NPs were good quenchers, so the effect of Au-CD as a fluorescence sensor on the detection results was investigated. As shown in Figure 3A, Au-CD had a weak fluorescence quenching effect for R6G. In contrast to Fe3O4@Au-CD, bare Au-CD showed minimal changes in fluorescence intensity for HDMF detection (Figure 3A,B). The reason is that R6G has the maximum fluorescence emission peak at 553 nm, while Au-CD had a weak absorbance at this band (Figure S1). As a result, no efficient FRET occurred under these circumstances. On the other hand, Fe3O4@Au-CD had a strong absorption peak at 553 nm since it combined the excellent absorption performance of Fe3O4 and Au NPs (Figure 1G). Thus, Fe3O4@Au-CD was chosen as the fluorescence quencher in the fluorescence detection of HDMF.
The amounts of Au NPs and SH-β-CD in the synthetic process of Fe3O4@Au-CD were optimized. The absorbance of Fe3O4@Au at 553 nm increased with the increasing volume of Au NPs, reaching a plateau at 5 mL (Figure S2). The fluorescence intensity of the solution reached the lowest when SH-β-CD was 1.0 mg (Figure S3). Further increases in SH-β-CD led to the aggregation of Fe3O4@Au-CD, which prevented the combination of R6G and Fe3O4@Au-CD [40,41]. Therefore, 5 mL Au NPs and 1 mg β-CD were used to prepare Fe3O4@Au-CD.
The volume of Fe3O4@Au-CD and reaction time were also optimized. The fluorescence intensity increased with the increment of Fe3O4@Au-CD, leveling off at 40 μL of Fe3O4@Au-CD (Figure S4). Figure S5 indicated that Fe3O4@Au-CD and R6G reacted completely within 20 min. Thus, 40 μL Fe3O4@Au-CD solution and 20 min reaction time were selected.

3.4. HDMF Detection

Various concentrations of HDMF were detected under optimal conditions. As illustrated in Figure 4A,B, the fluorescence signal increased with HDMF concentrations ranging from 5 × 10⁻⁷ M to 10−4 M. When the concentration of HDMF was more than 100 μM, the fluorescence intensity increased slightly. The fluorescence intensity at 553 nm showed a good linear relationship with the logarithm of HDMF ranging from 5 × 10⁻⁷ M to 10−4 M as shown in the inset in Figure 4B. The corresponding linear equation was F = 112,624 lgC + 618,672 (R2 = 0.986), where F represents the fluorescence intensity at 553 nm and C is HDMF concentration (5 × 10⁻⁷ M to 10−4 M). The limit of detection (LOD) was calculated to be 198.9 nM, based on the formula LOD = 3 × Sb/a. The Sb was the blank standard deviation. The variable “a” was obtained from linear fitting on the fluorescence intensity of the blank and 500 nM based on the formula a = (F500 nM − Fblank)/(500 nM). This is the first time that a fluorescence method has been constructed to detect HDMF. Compared with previously reported methods, the proposed fluorescence method for HDMF detection was more sensitive, rapid, and convenient (Table S1).

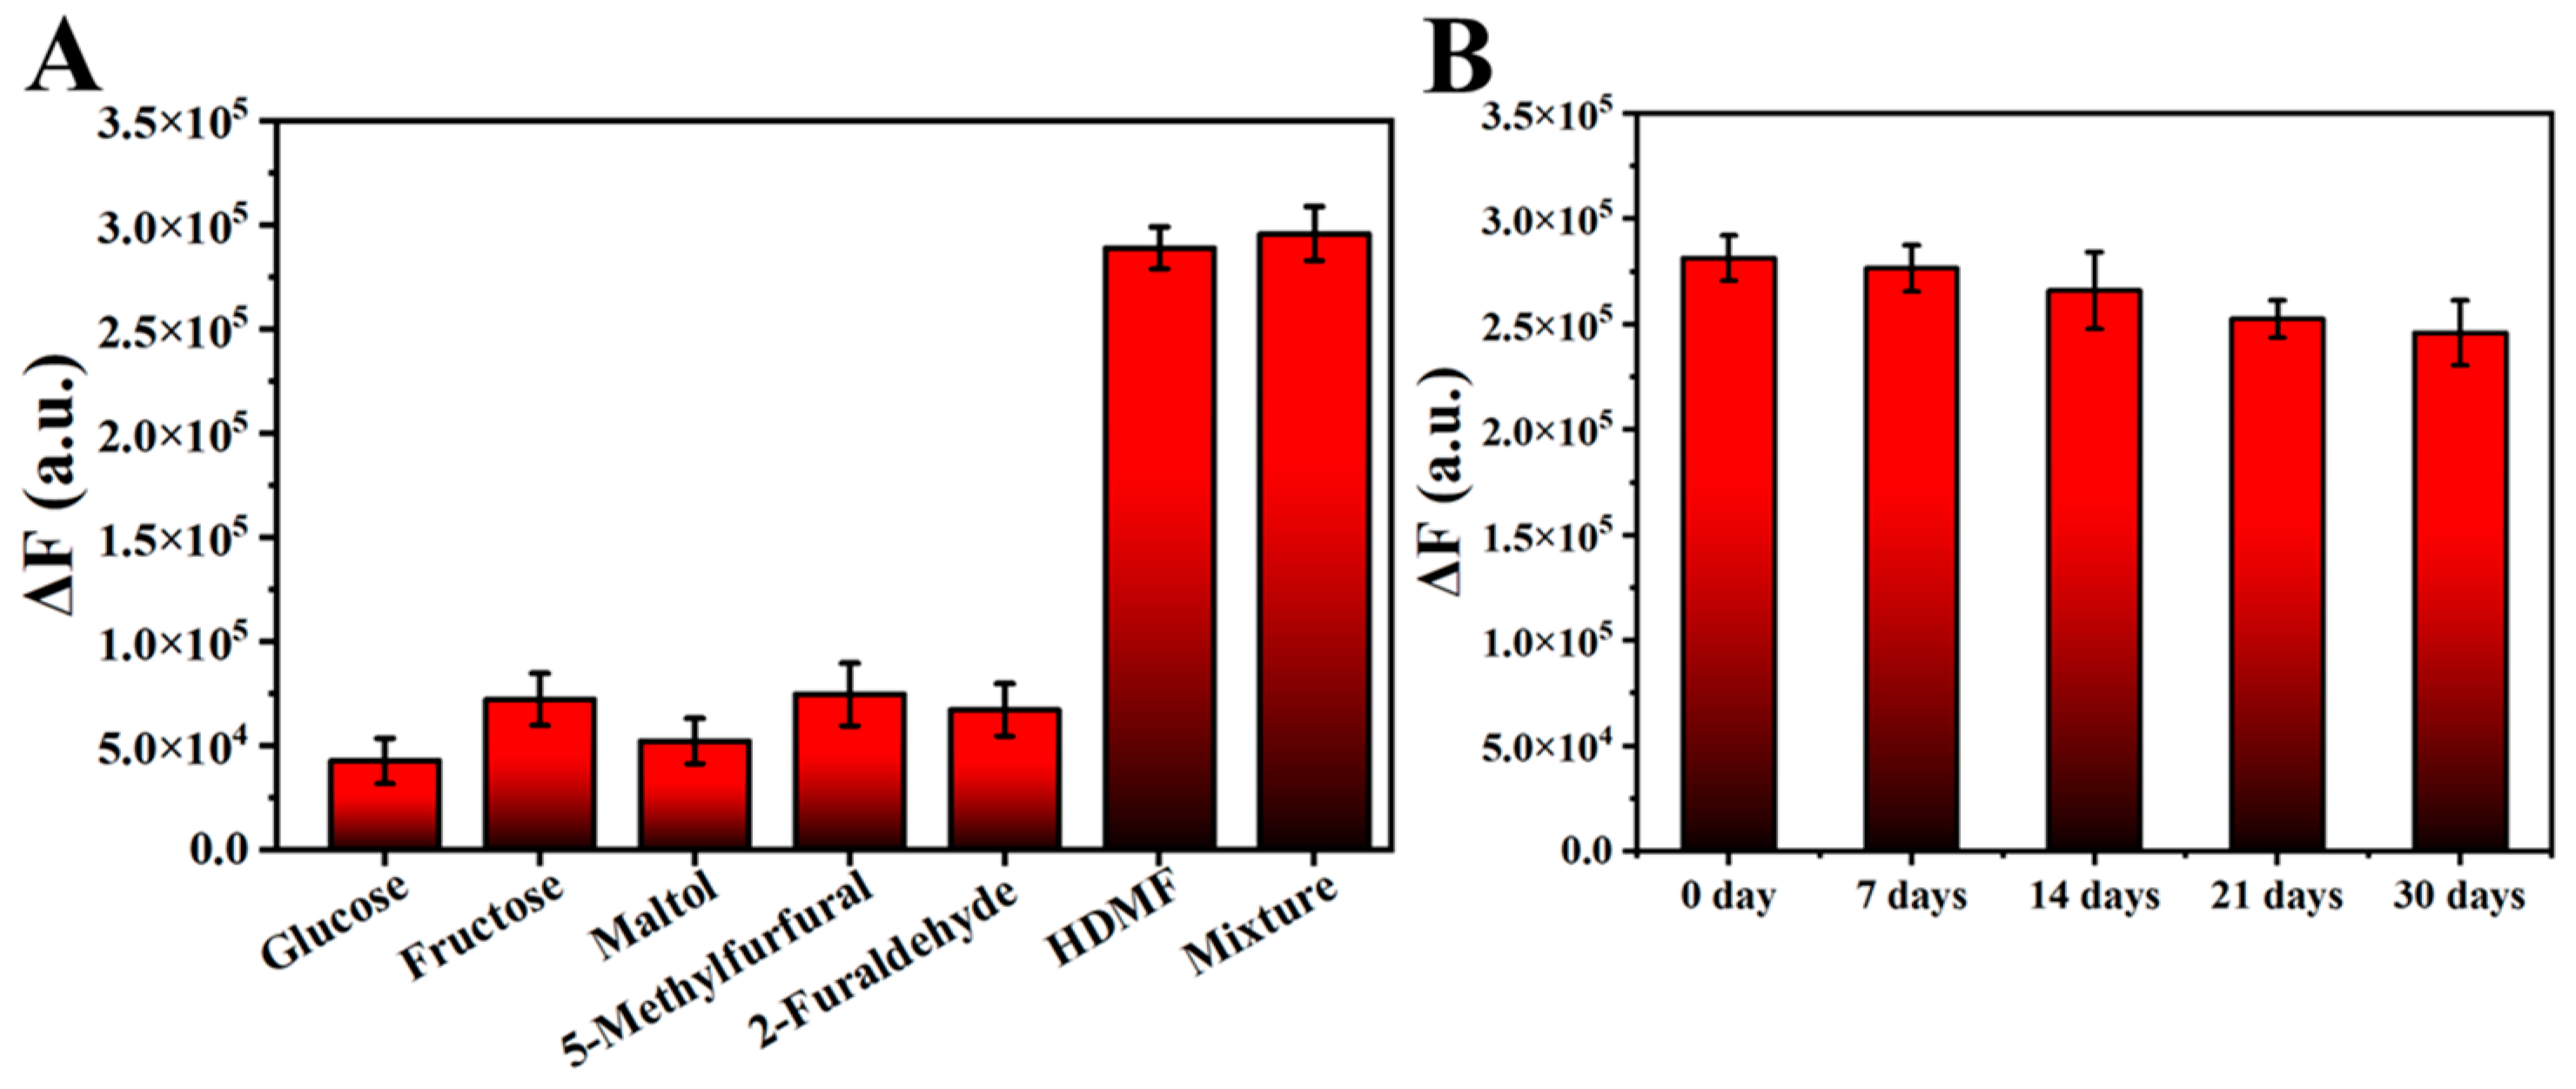
3.5. Selectivity and Stability of the HDMF Detection

The specificity of the proposed method for HDMF detection was studied. Glucose, fructose, maltol, 5-methylfural, and 2-furaldehyde are the main sweet compounds that contribute to the sweet taste in cigarettes. The structures of the compounds above are shown in Figure S6. The concentration of HDMF was 100 μM while the other five compounds were 1 mM, as shown in Figure 5. The mixture of 100 μM HDMF and equal concentrations of glucose, fructose, maltol, 5-methyl furfural, and 2-furaldehyde were used to test the interference. The results showed that little interference was observed from these sweet compounds (Figure 5A). It was proven that changes in fluorescence intensity in the presence of these five sweet compounds were much lower than those in the presence of HDMF (Figure 5A), which proved that the described fluorescence method had good specificity for HDMF detection.
The stability of the proposed method was also investigated. As shown in Figure 5B, after 7, 14, 21, and 30 days, the fluorescence method for HDMF detection remained reasonable, suggesting that the proposed fluorescence method for HDMF detection had excellent stability.

3.6. Application of the HDMF Detection in Real Samples

To evaluate the practical applications of the described fluorescence method, we spiked pineapple drink and tobacco solution samples with HDMF. HDMF cannot be detected in blank cigarettes and beverages. The recovery results are listed in Table 1. The average recoveries of pineapple drink and tobacco samples were 91.2%~110.6% and 93.9%~104.6%, respectively. The corresponding relative standard deviations (RSDs) were less than 6.6% and 7.9%, respectively. These results indicate that the proposed assay has good applicability in real samples.

4. Conclusions

In summary, this study presents the first instance of constructing a fluorescence sensor for the detection of HDMF specifically. In this paper, the synthesized Fe3O4@Au-CD was utilized as a fluorescence quencher for HDMF detection. When R6G entered the cavities of SH-β-CD, its fluorescence was effectively quenched by Fe3O4@Au-CD through FRET. However, in the presence of the target compound HDMF, it displaced R6G to occupy the β-CD cavities. As the concentration of HDMF increased, more R6G molecules were replaced, resulting in enhanced fluorescence intensity. A strong linear correlation was observed between fluorescence intensity and the logarithmic value of HDMF concentration within a range from 5 × 10⁻⁷ M to 10−4 M, with a LOD of 198.9 nM. This method is believed to detect HDMF in practical environments if further optimized, including additional tests for selectivity and repeatability across more batches. This straightforward and susceptible fluorescence detection method holds significant potential for application in food flavor evaluation.

Supplementary Materials

The following supporting information can be downloaded at: https://www.mdpi.com/article/10.3390/chemosensors13030110/s1, Figure S1: UV–vis absorption spectra of Au-CD and Fe3O4@Au-CD and the fluorescence emission spectrum of R6G; Figure S2: Optimization of the volume of Au NPs; Figure S3: Optimization of the amount of SH-β-CD; Figure S4: Optimization of the volume of Fe3O4@Au-CD; Figure S5: Optimization of the reaction time; Figure S6: The structure of compounds used in the selectivity test; Table S1: Comparison of the analytical performance of various reported methods for HDMF detection [15,17,19,42].

Author Contributions

Conceptualization, X.Z. and Y.Z.; methodology, X.Z.; software, Y.Z.; validation, X.Z., C.W. and Y.Z.; formal analysis, X.Z.; investigation, X.Z., C.W. and Y.Z.; resources, X.Z. and Y.Z.; data curation, X.Z., C.W. and Y.Z.; writing—original draft preparation, X.Z. and Y.Z.; writing—review and editing, P.L. and W.W.; visualization, D.W. and S.S.; supervision, X.Z., D.W. and S.S.; project administration, P.L. and W.W.; funding acquisition, P.L. and W.W. All authors have read and agreed to the published version of the manuscript.

Funding

This work was supported by Beijing Life Science Academy (No. 2023000CC0170).

Institutional Review Board Statement

Not applicable.

Informed Consent Statement

Not applicable.

Data Availability Statement

Data are contained within the article and Supplementary Materials.

Conflicts of Interest

The authors declare no conflict of interest.

References

  1. Haynes, A.; Winnall, W.R.; Brennan, E.; Dunstone, K.; Benowitz, N.L.; Ashley, D.L.; Samet, J.M.; Hatsukami, D.K.; Wakefield, M.A. Tobacco constituents, flavorants, and paper permeability of factory-made and roll-your-own cigarettes on the Australian market. Nicotine Tob. Res. 2024, 26, 289–297. [Google Scholar] [CrossRef] [PubMed]
  2. Talhout, R.; Opperhuizen, A.; van Amsterdam, J.G.C. Sugars as tobacco ingredient: Effects on mainstream smoke composition. Food Chem. Toxicol. 2006, 44, 1789–1798. [Google Scholar] [CrossRef] [PubMed]
  3. Wang, L.; Cardenas, R.B.; Watson, C. An isotope dilution ultra high performance liquid chromatography-tandem mass spectrometry method for the simultaneous determination of sugars and humectants in tobacco products. J. Chromatogr. A 2017, 1514, 95–102. [Google Scholar] [CrossRef]
  4. Tang, K.; Liang, L.; Cai, Y.; Mou, S. Determination of sugars and alditols in tobacco with high performance anion-exchange chromatography. J. Sep. Sci. 2007, 30, 2160–2166. [Google Scholar] [CrossRef]
  5. Rodrigues, M.; de Oliveira, R.B.; dos Santos, G.L.A.A.; de Oliveira, K.M.; Reis, A.S.; Furlanetto, R.H.; Júnior, L.A.Y.B.; Coelho, F.S.; Nanniet, M.R. Rapid quantification of alkaloids, sugar and yield of tobacco (Nicotiana tabacum L.) varieties by using Vis–NIR–SWIR spectroradiometry. Spectrochim. Acta A Mol. Biomol. Spectrosc. 2022, 274, 121082. [Google Scholar] [CrossRef]
  6. Baker, R.R.; Bishop, L.J. The pyrolysis of tobacco ingredients. J. Anal. Appl. Pyrol. 2004, 71, 223–311. [Google Scholar] [CrossRef]
  7. Yan, X.; Pan, S.; Liu, X.; Tan, M.; Zheng, X.; Du, W.; Wu, M.; Song, Y. Profiling the major aroma-active compounds of microwave-dried jujube slices through molecular sensory science approaches. Foods 2023, 12, 3012. [Google Scholar] [CrossRef]
  8. Chen, Y.; Guo, X.; Gao, T.; Zhang, N.; Wan, X.; Schwab, W.; Song, C. UGT74AF3 enzymes specifically catalyze the glucosylation of 4-hydroxy-2,5-dimethylfuran-3(2H)-one, an important volatile compound in Camellia sinensis. Hortic. Res. 2020, 7, 25. [Google Scholar] [CrossRef]
  9. Schwab, W. Natural 4-hydroxy-2,5-dimethyl-3(2H)-furanone (Furaneol®). Molecules 2013, 18, 6936–6951. [Google Scholar] [CrossRef]
  10. Rögner, N.S.; Mall, V.; Steinhaus, M. Impact of malt extract addition on odorants in wheat bread crust and crumb. J. Agric. Food Chem. 2021, 69, 13586–13595. [Google Scholar] [CrossRef]
  11. Zheng, W.; Liu, X.; Huang, Y.; Lu, J.; Zhang, Y. Volatile aroma compounds in wines from Chinese wild/hybrid species. J. Food Biochem. 2018, 43, e12684. [Google Scholar] [CrossRef]
  12. Feng, Y.; Xie, Z.; Huang, M.; Tong, X.; Hou, S.; Tin, H.; Zhao, M. Decoding temperature-driven microbial community changes and flavor regulation mechanism during winter fermentation of soy sauce. Food Res. Int. 2024, 117, 113756. [Google Scholar] [CrossRef] [PubMed]
  13. Ferreira, V.; Aznar, M.; López, R.; Cacho, C. Quantitative gas chromatography–olfactometry carried out at different dilutions of an extract. Key differences in the odor profiles of four high-quality Spanish aged red wines. J. Agric. Food Chem. 2001, 49, 4818–4824. [Google Scholar] [CrossRef]
  14. Zhai, Y.; Guo, M.; Meng, Q.; Song, H. Characterization of key odor-active compounds in high quality high-salt liquid-state soy sauces. J. Food Compos. Anal. 2023, 117, 105148. [Google Scholar] [CrossRef]
  15. Hu, G.; Hernandez, M.; Zhu, H.; Shao, S. An efficient method for the determination of furan derivatives in apple cider and wine by solid phase extraction and high performance liquid chromatography—Diode array detector. J. Chromatogr. A 2013, 1284, 100–106. [Google Scholar] [CrossRef]
  16. Wu, T.; Cadwallader, K.R. Identification of characterizing aroma components of roasted chicory “coffee” brews. J. Agric. Food Chem. 2019, 67, 13848–13859. [Google Scholar] [CrossRef]
  17. Xie, Z.; Zeng, D.; Wang, J.; Zhao, M.; Feng, Y. Dispersive liquid-liquid microextraction coupled with gas chromatography-mass spectrometry (GC-MS) for the determination of soy sauce aroma compounds. Food Control 2023, 152, 109838. [Google Scholar] [CrossRef]
  18. Dein, M.; Moore, A.; Ricketts, C.; Huynh, C.; Munafo, J.P., Jr. Characterization of odorants in chardonnay marc skins. J. Agric. Food Chem. 2021, 69, 12262–12269. [Google Scholar] [CrossRef]
  19. Prata, R.; Petrarca, M.H.; Filho, J.T.; Godoy, H.T. Simultaneous determination of furfural, 5-hydroxymethylfurfural and 4-hydroxy-2,5-dimethyl-3(2H)-furanone in baby foods available in the Brazilian market. J. Food Compos. Anal. 2021, 99, 103874. [Google Scholar] [CrossRef]
  20. Su, B.; Zhang, Z.; Sun, Z.; Tang, Z.; Xie, X.; Chen, Q.; Cao, H.; Yu, X.; Liu, X.; Hammock, B.D. Fluonanobody-based nanosensor via fluorescence resonance energy transfer for ultrasensitive detection of ochratoxin A. J. Hazard. Mater. 2022, 422, 126838. [Google Scholar] [CrossRef] [PubMed]
  21. Li, Y.; Cai, J.; Liu, F.; Yang, H.; Lin, Y.; Li, S.; Huang, X.; Lin, L. Construction of a turn off-on fluorescent nanosensor for cholesterol based on fluorescence resonance energy transfer and competitive host-guest recognition. Talanta 2019, 201, 82–89. [Google Scholar] [CrossRef]
  22. Liu, X.; Atwater, M.; Wang, J.; Huo, Q. Extinction coefficient of gold nanoparticles with different sizes and different capping ligands. Colloids Surf. B Biointerfaces 2007, 58, 3–7. [Google Scholar] [CrossRef] [PubMed]
  23. Wan, H.; Lv, M.; Liu, X.; Chen, G.; Zhang, N.; Cao, Y.; Wang, H.; Ma, R.; Qiu, G. Activating hematite nanoplates via partial reduction for electrocatalytic oxygen reduction reaction. ACS Sustain. Chem. Eng. 2019, 7, 11841–11849. [Google Scholar] [CrossRef]
  24. Zhou, Z.; Wu, C.; Liu, H.; Zhu, X.; Zhao, Z.; Wang, L.; Xu, Y.; Ai, H.; Gao, J. Surface and interfacial engineering of iron oxide nanoplates for highly efficient magnetic resonance angiography. ACS Nano 2015, 9, 3012–3022. [Google Scholar] [CrossRef] [PubMed]
  25. Beiranvand, M.; Farhadi, S.; Mohammadi-Gholami, A. Adsorptive removal of tetracycline and ciprofloxacin drugs from water by using a magnetic rod-like hydroxyapatite and MIL-101(Fe) metal–organic framework nanocomposite. RSC Adv. 2022, 12, 34438–34453. [Google Scholar] [CrossRef]
  26. Wang, T.; Liu, S.; Zhou, Z.; Wang, W.; Ren, S.; Liu, B.; Gao, Z. Dual-responsive amplification strategy for ultrasensitive detection of norovirus in food samples: Combining magnetic relaxation switching and fluorescence assay. Sens. Actuators B Chem. 2023, 396, 134573. [Google Scholar] [CrossRef]
  27. Zhang, P.; Chen, G.; Wang, Z.; Ma, J.; Jia, Q. Fe3O4@Au@cyclodextrin-molecularly imprinted polymers labeled with SERS nanotags for ultrasensitive detection of transferrin. Sens. Actuators B Chem. 2022, 361, 131669. [Google Scholar] [CrossRef]
  28. Chen, Q.; Rong, S.; Cen, Y.; Xu, G.; Xie, Z.; Yang, J.; Sun, Y.; Hu, Q.; Wei, F. A facile fluorescent sensor based on carbon dots and Fe3O4 nanoplates for the detection of hyaluronidase activity. Sens. Actuators B Chem. 2021, 346, 130434. [Google Scholar] [CrossRef]
  29. Yin, C.; Gong, C.; Chu, J.; Wang, X.; Yan, C.; Qian, S.; Wang, Y.; Rao, G.; Wang, H.; Liu, Y.; et al. Ultrabroadband photodetectors up to 10.6 µm based on 2D Fe3O4 Nanosheets. Adv. Mater. 2020, 32, 2002237. [Google Scholar] [CrossRef]
  30. Yan, S.; Chen, Y.; Zhang, S.; Gao, L.; Wang, J.; Dai, H. Dual-signal amplification sensing platform based on competitive host-guest cycling recognition process for ultrasensitive detection of thyroglobulin. Sens. Actuators B Chem. 2024, 405, 135036. [Google Scholar] [CrossRef]
  31. Rosen, C.B.; Kwant, R.L.; MacDonald, J.I.; Rao, M.; Francis, M.B. Capture and recycling of sortase a through site-specific labeling with lithocholic acid. Angew. Chem. Int. Ed. 2016, 55, 8585–8589. [Google Scholar] [CrossRef]
  32. Fang, F.; Zhang, Z.; Zhang, P.; Zhang, X.; Ma, H.; Wei, Y. Fluorescence detection of amantadine based on competitive β-Cyclodextrin host-guest inclusion process. Colloids Surf. A Physicochem. Eng. Asp. 2024, 681, 132801. [Google Scholar] [CrossRef]
  33. Zhao, X.; Shen, H.; Huo, B.; Wang, Y.; Gao, Z. A novel bionic magnetic SERS aptasensor for the ultrasensitive detection of deoxynivalenol based on “dual antennae” nano-silver. Biosens. Bioelectron. 2022, 211, 114383. [Google Scholar] [CrossRef]
  34. An, G.S.; Shin, J.R.; Hur, J.U.; Oh, A.H.; Kim, B.; Jung, Y.; Choi, S. Fabrication of core-shell structured Fe3O4@Au nanoparticle via self-assembly method based on positively charged surface silylation/polymerization. J. Alloys Compd. 2019, 798, 360–366. [Google Scholar] [CrossRef]
  35. Zhu, H.; Goswami, N.; Yao, Q.; Chen, T.; Liu, Y.; Xu, Y.; Chen, D.; Lu, J.; Xie, J. Cyclodextrin–gold nanocluster decorated TiO2 enhances photocatalytic decomposition of organic pollutants. J. Mater. Chem. A 2018, 6, 1102–1108. [Google Scholar] [CrossRef]
  36. Miao, Y.; Gan, N.; Li, T.; Cao, Y.; Hu, F.; Chen, Y. An ultrasensitive fluorescence aptasensor for chloramphenicol based on FRET between quantum dots as donor and the magnetic SiO2@Au NPs probe as acceptor with exonuclease-assisted target recycling. Sens. Actuators B Chem. 2016, 222, 1066–1072. [Google Scholar] [CrossRef]
  37. Xu, Z.; Hou, Y.; Sun, S. Magnetic core/shell Fe3O4/Au and Fe3O4/Au/Ag nanoparticles with tunable plasmonic properties. J. Am. Chem. Soc. 2007, 129, 8698–8699. [Google Scholar] [CrossRef]
  38. Yu, D.; Zhang, X.; Qi, Y.; Ding, S.; Cao, S.; Zhu, A.; Shi, G. Pb2+-modified graphene quantum dots as a fluorescent probe for biological aminothiols mediated by an inner filter effect. Sens. Actuators B Chem. 2016, 235, 394–400. [Google Scholar] [CrossRef]
  39. Zheng, M.; Xie, Z.; Qu, D.; Li, D.; Du, P.; Jing, X.; Sun, Z. On-off-on fluorescent carbon dot nanosensor for recognition of chromium(VI) and ascorbic acid based on the inner filter effect. ACS Appl. Mater. Interfaces 2013, 5, 13242–13247. [Google Scholar] [CrossRef]
  40. Jin, W.; Huang, P.; Wei, G.; Cao, Y.; Wu, F. Visualization and quantification of Hg2+ based on anti-aggregation of label-free gold nanoparticles in the presence of 2-mercaptobenzothiazole. Sens. Actuators B Chem. 2016, 233, 223–229. [Google Scholar] [CrossRef]
  41. Liang, B.; Han, L. Displaying of acetylcholinesterase mutants on surface of yeast for ultra-trace fluorescence detection of organophosphate pesticides with gold nanoclusters. Biosens. Bioelectron. 2020, 148, 111825. [Google Scholar] [CrossRef] [PubMed]
  42. Douaki, A.; Abera, B.D.; Cantarella, G.; Shkodra, B.; Mushtaq, A.; Ibba, P.; Inam, A.K.M.S.; Petti, L.; Lugli, P. Flexible Screen Printed Aptasensor for Rapid Detection of Furaneol: A Comparison of CNTs and AgNPs Effect on Aptasensor Performance. Nanomaterials 2020, 10, 1167. [Google Scholar] [CrossRef] [PubMed]
Scheme 1. Schematic diagram of the mechanism for the detection of HDMF. (A) The synthesis of Fe3O4@Au-CD. (B) Fluorescence detection of HDMF based on FRET and competitive host–guest recognition of R6G and HDMF.
Chemosensors 13 00110 sch001
Figure 1. HRTEM (A), STEM (B), and EDX elemental mapping (CE) images of Fe3O4@Au-CD. (F) Zeta potential analysis of Fe3O4, Fe3O4-NH2, Fe3O4@Au, and Fe3O4@Au-CD. (G) UV–vis absorption spectra of Fe3O4, Au NPs, SH-β-CD, Fe3O4@Au, and Fe3O4@Au-CD.
Chemosensors 13 00110 g001
Figure 2. (A) FL emission spectra of Fe3O4@Au-CD, R6G, HDMF, Fe3O4@Au-CD/R6G, and Fe3O4@Au-CD/R6G/HDMF, respectively. (B) The UV–vis absorption spectrum of Fe3O4@Au-CD and the fluorescence excitation and emission spectra of R6G.
Chemosensors 13 00110 g002
Figure 3. (A) The fluorescence emission spectra of R6G, Fe3O4@Au-CD/R6G, Fe3O4@Au-CD/R6G/HDMF, Au-CD/R6G, Au-CD/R6G/HDMF. (B) The effect of different sensors on the change in fluorescence intensity. The error bars represented the standard deviations of three repetitive measurements.
Chemosensors 13 00110 g003
Figure 4. (A) Fluorescence emission spectra for HDMF detection. The concentration of HDMF was from 500 nM to 500 μM. (B) Plots of the fluorescence intensity at 553 nm versus different concentrations of HDMF (0, 0.5, 1, 5, 10, 25, 50 and 100 μM). Inset: the linear fitting between the fluorescence intensity at 553 nm and the lg value of HDMF concentration. Error bars represent standard deviations of three repetitive measurements.
Chemosensors 13 00110 g004
Figure 5. The selectivity (A) and stability (B) of the fluorescence method for the detection of HDMF. The error bars represent the standard deviations of three repetitive measurements.
Chemosensors 13 00110 g005
Table 1. Recovery analysis of HDMF in beverage and cigarette.
SamplesFound (M)Added (M)Found (M)Recovery (%)RSD (%)
BeverageNot found5 × 10−74.93 × 10−798.76.6
5 × 10−65.53 × 10−6110.65.6
5 × 10−54.56 × 10−591.25.5
CigaretteNot found5 × 10−74.96 × 10−799.17.0
5 × 10−64.69 × 10−693.93.2
5 × 10−55.23 × 10−5104.67.9
Disclaimer/Publisher’s Note: The statements, opinions and data contained in all publications are solely those of the individual author(s) and contributor(s) and not of MDPI and/or the editor(s). MDPI and/or the editor(s) disclaim responsibility for any injury to people or property resulting from any ideas, methods, instructions or products referred to in the content.

