Article

Pushing Peak Shapes to Perfection by High-Temperature Focus GC-IMS

1
Institute for Instrumental Analysis and Bioanalytics, Technische Hochschule Mannheim, Paul-Wittsack-Str. 10, 68163 Mannheim, Germany
2
Department of Food Chemistry and Analysis, Institute of Food, Technology and Food Chemistry, Technische Universität Berlin, TIB 4/3-1, Gustav-Meyer-Allee 25, 13355 Berlin, Germany
*
Author to whom correspondence should be addressed.
Chemosensors 2025, 13(4), 131; https://doi.org/10.3390/chemosensors13040131
Submission received: 31 January 2025 / Revised: 27 March 2025 / Accepted: 1 April 2025 / Published: 4 April 2025

Abstract

:
Gas chromatography–ion mobility spectrometry (GC-IMS) is a powerful technique in the field of food and flavor analysis specifically, as well as for the determination of volatile organic compounds (VOCs) in general. It offers high sensitivity and selectivity, combined with a robust design. Sample preparation is typically not required, and operating principles under ambient conditions facilitate routine analysis and usage at points of care. As of now, a plethora of applications of GC-IMS exist in the fields of food analysis, primarily for determining flavors and evaluating the authenticity of food. However, the general issue of peak tailing has, so far, not been addressed in IMS. Typical drift tube applications (DTIMS) are designed with emphasis to high detection sensitivities and feature large void volumes. This study aimed to develop an optimized IMS instrument design (“focus IMS”) which allows for signal mapping of eluting compounds. Due to an optimized flow architecture of sample and drift gases, in combination with an increased drift tube temperature, peak tailing is decreased significantly. In this study, the influence of drift gas flow and IMS cell temperature on the peak shape of several relevant allergenic terpenes was investigated. The peak quality optimization of DTIMS approaches for especially high-boiling substances facilitates the analysis of complex matrices, such as cosmetics, Citrus peel, and essence oils, as well as terpenes and terpenoids in general.

1. Introduction

In recent years, an increasing number of applications of gas chromatography–ion mobility spectrometry (GC-IMS) in the quality analysis of food and other products such as food contact materials and cosmetics have been published [1,2,3]. GC-IMS shows advantages in terms of sample preparation, cost reduction, and greener analytics [4]. In comparison to gas chromatography–mass spectrometry (GC-MS), there is no need for an energy-intensive vacuum system and nitrogen is a feasible carrier gas option, while GC-MS still mainly relies on helium in most use cases. The simple and robust technology and its impressive sensitivity for polar and medium polar compounds, paired with the simplified and the nearly “no-sample-preparation-needed” headspace approach, make GC-IMS an ideal strategy for point-of-need analytics [4]. Several authors have described applications of GC-IMS for the quality control of, e.g., honey or olive oil, as well as applications for evaluating the authenticity of juices and essential oils [5,6,7,8,9,10]. While GC-IMS proved to be highly proficient in these fields, a typical observation in all published studies on GC-IMS is a distinct peak tailing effect in the IMS cell. Even when samples do not contain a high number and amount of high-boiling volatile organic compounds (VOCs), such as terpenes or related compounds, disadvantageous peak tailing was clearly present in all cases. This effect manifests when samples are rich in terpenes or high-boiling VOCs, and culminates in peak tailings of 60 s for, e.g., geraniol, carvone, pinene, citral, and β-caryophyllene, in particular, in the presence of complex matrices such as those from Citrus peels [3,9,11]. This leads to an interference of signals when co-elution of different compounds occurs in complex matrices. A recent study reported on a dependency of the IMS cell temperature on peak shape and reduced peak tailing at temperatures above 100 °C for alcohols, phenylpropanoids, and terpenoids [12]. Specifically, the latter are a highly complex and abundant class of natural compounds, playing an important role in the chemical and pharmaceutical industries, e.g., in flavorings, foods and beverages, and cosmetics [13,14].
The most commonly used commercial GC-IMS systems are drift tube-based IMS (DTIMS). Due to the collisions with drift gas molecules, each analyte features a certain drift time. This depends on its mass, charge, geometric structure and further temperature, drift gas, and the electric field strength [15,16]. Ionization is typically achieved with the use of beta emitters and since the usage of low-dose radiation tritium sources below 1 GBq is exempted from permission in the European Union, there are nowadays more low-dose tritium systems with an dose-level of approximately 100 MBq [7,9,16,17,18]. The ionization process is a reaction cascade initiated by collisions of electrons from the beta emitter 3H with the drift gas atmosphere of nitrogen or air [16]. In a clean atmosphere, proton–water clusters are formed, dependent on moisture and temperature of drift gas atmosphere [16,19,20]. Collisions between these clusters and sample molecules lead to adduct ion formation of monomers and dimers [16]. Further, the analyte concentration is an important variable in GC-IMS. It affects the formation of monomers and dimers and, further, leads to tailing effects in high-boiling volatile compounds [20,21]. For weak electric fields, commonly between 100 and 350 V·cm−1, the Mason–Schamp equation is applicable for the calculation of the ion mobility, K, based on the detected drift times of the ions [12,22].
Within the development of the classical DTIMS in the 1970s, the main goal was set on maximum sensitivity rather than optimal signal mapping. Up to now, commercially available cells are typically not optimized based on their flow dynamics, which results in partially substantial tailing effects. Consequently, a complex composition of samples often results in the co-elution of different compounds. This is particularly critical for compounds with similar drift times, such as monoterpenes. In a worst-case scenario, a separation is neither possible in drift time nor in retention time due to these tailing effects. Figure 1 shows an optimized flow architecture of the focus system in comparison to a conventional DTIMS setup. The main improvement is an optimized sample and drift gas flow architecture, which effectively reduces the void volume in the ionization region. This is realized by a linear guided flow of the drift gas, leading to an optimized flow equilibrium and flow transient dynamics, dependent on drift and sample gas flow. As can be seen in Figure 1b, the drift gas flow now guides the sample flow directly to the gas outlet of the IMS cell, which reduces diffusion within this region. This flow architecture helps to improve the chromatographic peak shape and, ultimately, also peak resolution, which typically increases selectivity and overall sensitivity due to a higher signal/noise (S/N) ratio.
A further key component for optimal peak shapes is to maintain optimal chromatographic conditions. Peak tailing in GC may result from several different effects, such as overloading, incorrect liner dimensions, adsorption or condensation effects. To minimize adsorption and condensation effects, transfer lines used to connect the separation column with the detection system require an appropriately high temperature to minimize condensation effects. However, commercial DTIMS systems up to now have typically been designed for simple and potentially mobile applications and are usually limited to temperatures below 100 °C, which, among other reasons, was done to balance system complexity (and price) and the average user’s demands. While this concept is sufficient for VOCs with comparatively low boiling points, it shows its limitations in the well-described tailing effects of higher boiling VOCs, such as terpenoids [3,12]. With increasing interest in such applications however, this required a change in perspective. Therefore, the IMS cell described in this study not only features the optimized flow architecture as described above, but, further, allows an extended temperature range of up to 180 °C. While this is still “colder” in comparison to typical GC-EI-MS sources with operating temperatures of 300 °C or more, this still leads to a substantial reduction in adsorption or condensation effects in higher boiling compounds in the source region as compared to commercially available, low-temperature DTIMS systems.
For the characterization of peak shapes in chromatography, statistical moments are often used, most commonly with Gaussian peak shapes, as discussed in numerous publications. A schematic figure is provided in Figure S1 [24,25,26,27,28]. To describe peak shapes and symmetry, several factors are described in the literature. For the peak width, the most commonly described method involves the full width at half maximum (FWHM) with 2.355 σ for a Gaussian distribution [26]. The description of the peak asymmetry in GC-MS is often calculated via the USP tailing factor or the asymmetric factor [26,28]. In this context, the tailing factor is an important parameter. Ideally, a peak should feature a Gaussian shape, as illustrated in Figure S1, and a symmetry between the front and back half of the peak at a defined peak height, corresponding to a tailing factor of 1.0. When GC-IMS systems were commercialized, the focus was set on maintaining the highest sensitivity possible; however, optimized peak shapes were not in the focus of research and development in the last few decades, which also reflects in the fact that there is no common definition for the tailing factor, mainly due to the 2D nature of the signals. In a former study by our group, we described the tailing factor as the half width parameters at 10% height and the distance in the first half (Equation (1)) [12].
Tailing   factor IMS = wf _ 10 + wt _ 10 2 · wf _ 10
where
  • wf_10 = width of the front half at 10% of the peak height;
  • wt_10 = width of the back half at 10% of the peak height.
An optimized peak shape is the basis for reliable analytical strategies in complex matrices, such as those of food, flavorings, and cosmetics. One important example that underlines the relevance of the point of care capabilities of GC-IMS is the need for monitoring approaches in the use of terpenoids in cosmetics and fragrances, as both their allergenic potential and their relevance in the evaluation of authenticity of different Citrus fruit products is high. The EU regulation 2023/1545 for the labeling of fragrance allergens in cosmetic products was updated in July 2023 with 56 new entries, including Citrus limon, Citrus aurantium amara, and Citrus aurantium dulcis peel oil, and, as such, there is an increased demand for more sophisticated and selective analytical approaches [29,30]. In the context of Citrus fruit products, the highly complex profiles of up to 300 different VOCs are a challenging, but promising, source of information [31]. In general, Citrus fruit oils can be differentiated into two groups: Citrus juice oils recovered during the concentration process and Citrus fruit peel oils resulting from the upcycling of the peels [32,33,34]. Oils of different Citrus fruits vary in concentrations of substances and in composition. In general, monoterpene hydrocarbons constitute the major volatile fraction in limonene, β-pinene, γ-terpinene, and similar compounds. Further VOCs are sesquiterpene hydrocarbons, such as β-caryophyllene, monoterpene alcohols (e.g., geraniol, or α-terpineol) and aldehydes, such as citral or nonanal [31]. While some major compounds (e.g., limonene) have only a limited aroma impact, some low-abundance compounds are particularly important for Citrus flavors and have distinct effects on aroma [32]. Due to this complex pattern of VOCs at different concentrations, peak tailing commonly leads to interference in signals and, finally, to a substantial loss of information. Even though there has recently been research in the field of hyper-fast GC in combination with flow-optimized IMS cells, peak tailing and peak shape, in general, especially with conventional GCs, are an existing and unaddressed issue in the analysis of volatile flavor compounds, such as terpenes, in the field of HS-GC-IMS analysis [35].
Consequently, the aim of this study was to systematically minimize effects that lead to excessive tailing in GC-IMS systems: first, using an optimized flow architecture and, second, using high IMS drift tube temperatures to reduce condensation effects. As an example, a number of representative terpenes and terpenoids were selected. These insights could be beneficial for the optimization of GC-IMS-based strategies in the analysis of complex flavor and essential oil samples, as well as in cosmetic products containing contact allergens, such as citronellol or geraniol.

2. Materials and Methods

2.1. Reagents and Samples

Analytical standards of ethyl butyrate (CAS: 105-54-4), (R)-(+)-limonene (CAS: 5989-27-5), γ–terpinene (CAS: 99-85-4), geraniol (CAS: 106-24-1), and geranyl acetate (CAS: 105-87-3) were purchased from Sigma-Aldrich Chemie GmbH, Taufkirchen, Germany. Citral (CAS: 5392-40-5) and β–pinene (CAS: 18172-67-3) were purchased from Alfa Aesar by Thermo Fisher GmbH, Kandel, Germany, and α–terpineol (CAS: 98-55-5) and citronellol (CAS: 106-22-9) were purchased from Acros Organics by Thermo Fisher GmbH, Kandel, Germany. Methyl-n-methylanthranilate (CAS: 85-91-6) was purchased from Thermo Fisher GmbH, Kandel, Germany; sabinene (CAS: 3387-41-5) from Molekula GmbH, München, Germany; (S)-(+)-carvone (CAS: 2244-16-8) from Merck KGaA, Darmstadt, Germany; and β-caryophyllene (CAS: 87-44-5) by Carl Roth GmbH & Co. KG, Karlsruhe, Germany. Canola oil (Brassica napus seed oil) was the solvent for the standards and obtained by GLOBUS-Holding GmbH & Co. KG, St. Wendel, Germany.
Two standards were prepared; the first one included 0.2 mg/g. ethyl butyrate, sabinene, β-pinene, (R)-(+)-limonene, γ–terpinene, α–terpineol and (S)-(+)-carvone. The second standard was prepared with 0.2 mg/g citral, citronellol, and geraniol in a concentration of 0.4 mg/g β-caryophyllene, geranyl acetate, and methyl-n-methylanthranilate.
In Table 1, the flavor compounds with their physical properties are displayed. For the experiment, several compounds were selected, covering esters, aldehydes, monoterpenes, monoterpene alcohols, a monoterpenoid acetate ester, as well as a sesquiterpene. Generally, the compounds are in a mass range between 116 g/mol to 204 g/mol and show boiling points from 120 °C to nearly 260 °C, representing a large range of flavor-active VOCs.

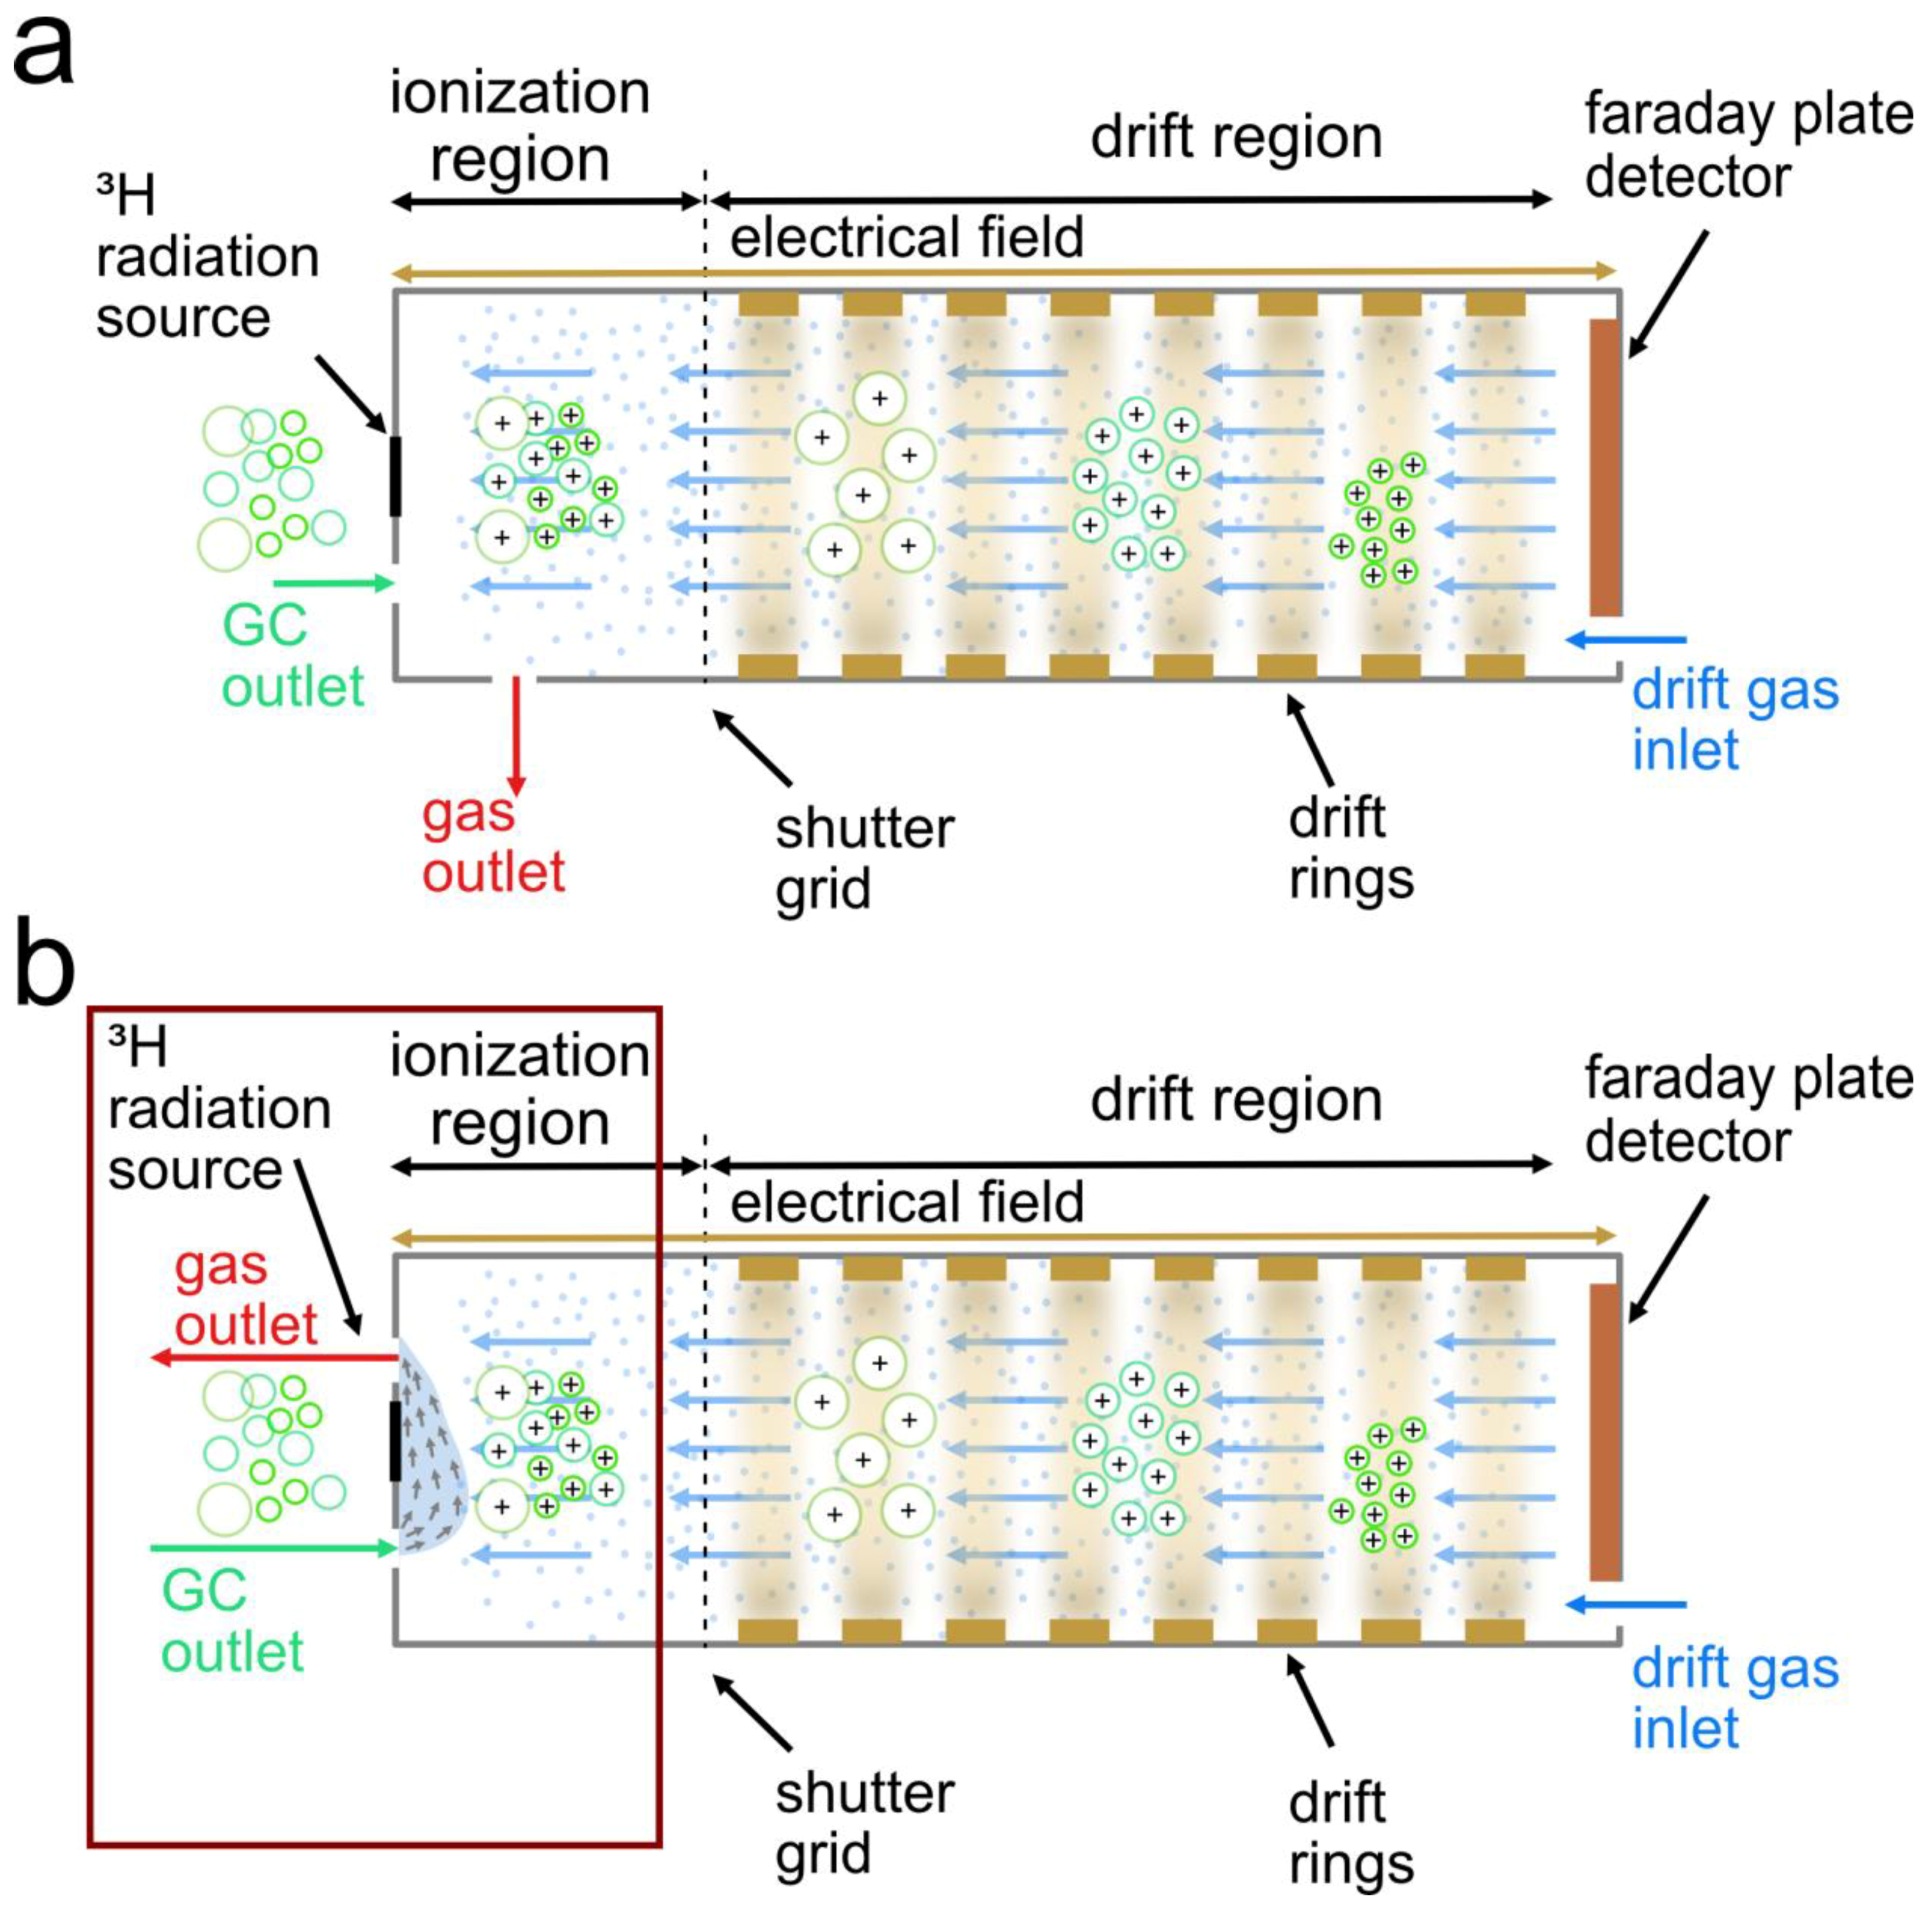
2.2. Instrumentation

All measurements were performed with a prototype high-temperature focus IMS (Gesellschaft für analytische Sensorsysteme mbH, Dortmund, Germany), coupled to a 6890N gas chromatograph (Agilent Technologies Inc., Santa Clara, CA, USA), equipped with a CombiPAL headspace sampling unit (CTC Analytics AG, Zwingen, Switzerland). Prior to the measurements, the headspace conditions were optimized via design of experiment (DOE), using 20 analysis runs and a central composite design (CCD) approach. The temperature range was set between 50 °C and 110 °C and the incubation time in a range of 300–1100 s. Further, the influence of the injection volume was evaluated in a range from 250 to 1200 µL. To optimize the peak areas while minimizing the incubation temperature, the parameters that follow in Table 2, were set for the measurements:
Static headspace injection was carried out with an incubation at 85 °C for 12 min and 400 rpm. A headspace volume of 1 mL was injected by a gastight 2.5 mL syringe (Trajan Scientific Australia Pty Ltd., Ringwood, Australia). To avoid condensation effects, the headspace syringe was heated to 100 °C. The syringe was flushed for 5 min after each injection with nitrogen to avoid cross contamination effects. Chromatographic separation was performed on a HP-5 capillary column (operating temperature: −60–325 °C/350 °C; SN: USB345942H) with a 30 m × 0.32 mm × 0.25 μm film thickness (Agilent Technologies Inc., Santa Clara, CA, USA). The injection was performed using a split/splitless injector at 200 °C and a split ratio of 1:20. The carrier gas was nitrogen with a purity of 99.99%, at constant pressure of 6.7 psi. The GC oven was programmed to go from 40 °C to 120 °C at 5 °C/min and from 120 °C to 240 °C at 12 °C/min, resulting in a run time of 26 min, followed by a post run of 4 min at 240 °C. The transfer line to the IMS was set to 200 °C.
The prototype high-temperature focus IMS setup is based on a 3H ionization source (approx. 100 MBq ß-emission). The drift tube has a diameter of 15.2 mm and a length of 53 mm. The material was stainless steel and PEEK. For the experiments, the IMS was operated in the positive ion mode at a constant voltage of 2.5 kV with different drift gas flows of nitrogen, explained in the following section. The injection voltage was 2500 V and the blocking voltage 70 V. The drift gas flow was controlled using a mass flow controller (Voegtlin Instruments AG, Aesch, Switzerland). The IMS cell was heated with two high-performance cartridge heaters. Thus, the prototype allows for temperature control of the drift tube up to 180 °C. Each spectrum was scanned an average of six times, using an injection pulse width of 100 μs, a repetition rate of 21 ms, and a sampling frequency of 228 kHz.

2.3. Experimental Design for High-Temperature Focus IMS

Within the experiment, the effect of temperature and drift gas flow was evaluated. As gas density is highly dependent on the temperature, a full factorial design was selected. Selected temperatures were 80 °C, 100 °C, 120 °C, 140 °C, and 160 °C, while drift gas flow was set to 100 mL/min, 125 mL/min, 150 mL/min, 175 mL/min, and 200 mL/min, respectively. Consequently, there are 25 different IMS settings for the evaluation of temperature and drift gas settings. Further measurements of two standards with common volatile compounds of different terpenes and Citrus fruit-related substances were taken in triplicate, resulting in 150 analyses.

2.4. Data Processing and Evaluation

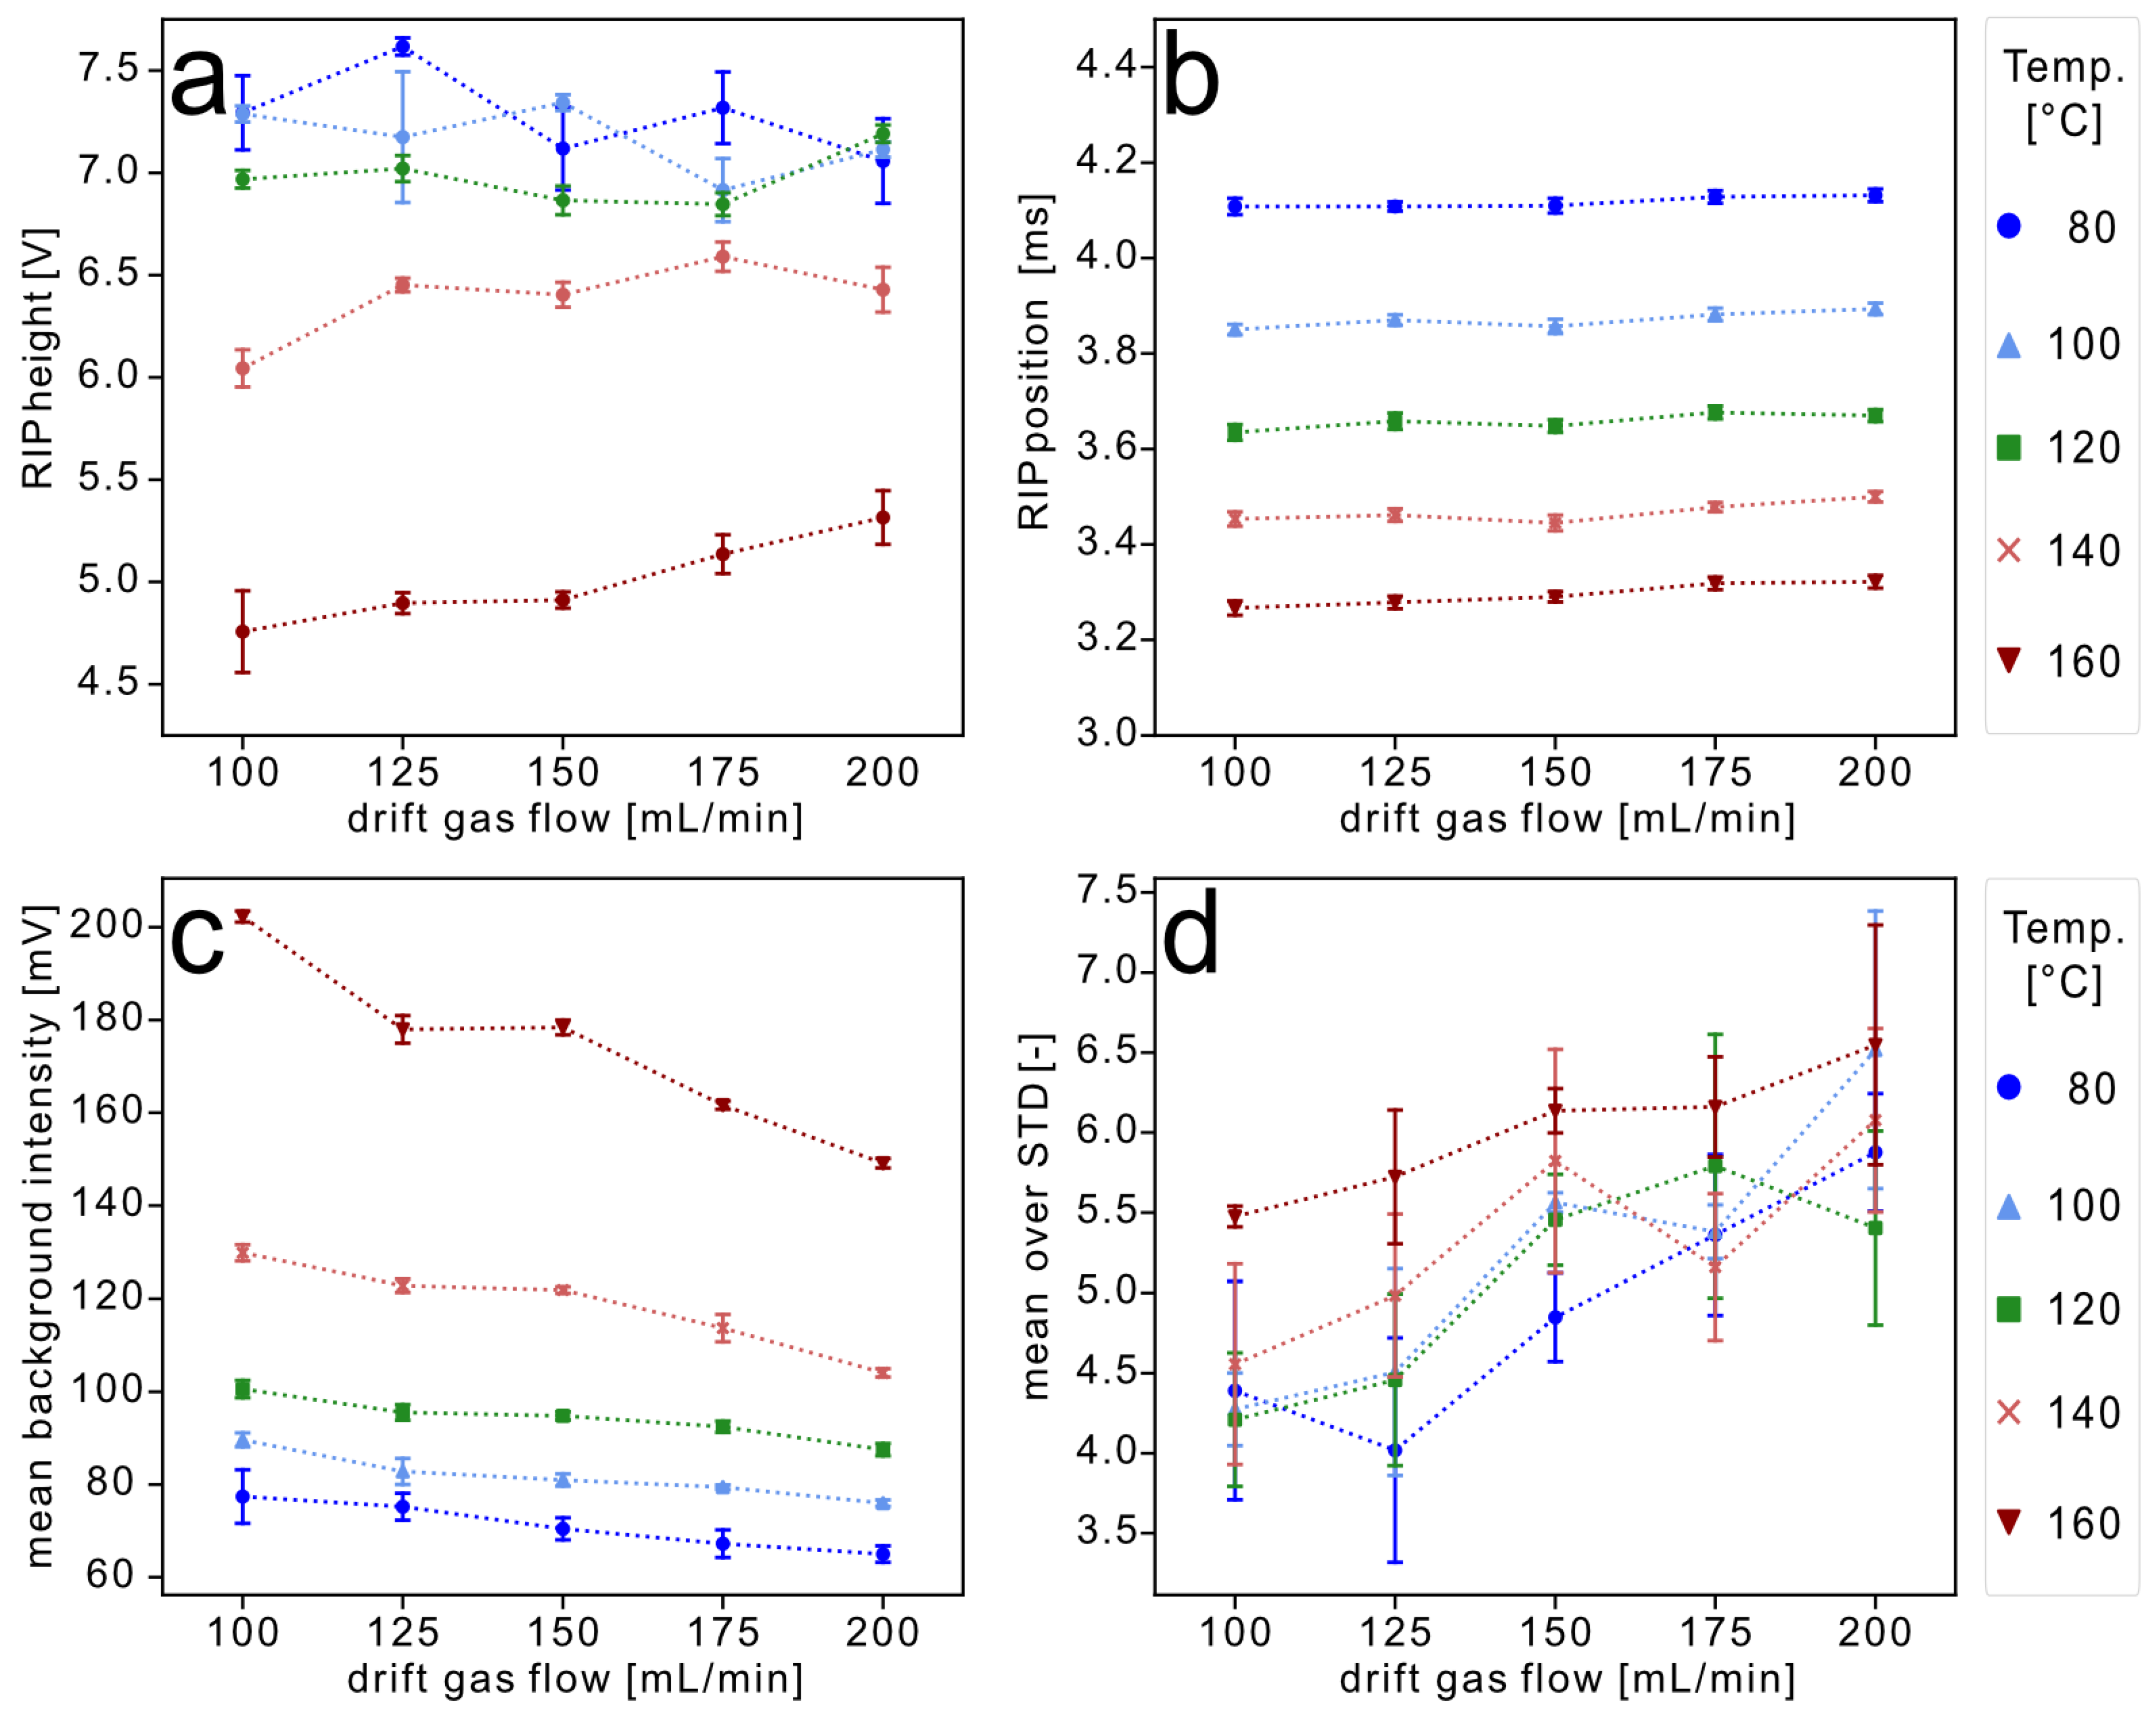
2.4.1. Reactant Ion Peak (RIP) and Background Calculations

For the evaluation of the RIP height and the RIP position, the .mea-files were imported with gc-ims-tools [29] and subsequently preprocessed. Intensity values of the spectra, as well as the drift time data, were accessed and further evaluated using the functions .argmax() for the RIP position and .max() for the RIP height from numpy [36]. The signal height was converted to [V], as the raw data are in binary format. For the calculation of the background intensity, drift time values were set relative to the RIP and data between 1.05 ms and 1.20 ms of the drift time axis were used. For the retention time axis, the area between 1150 s and 1300 s was evaluated and data were further processed with numpy .mean() and .std() functions [36].

2.4.2. Data Processing of the Experiments for High-Temperature Focus IMS

The .mea files were imported by gc-im-tools. For drift and retention time dimensions, the prominence and minimum peak height were set, and further local maxima were calculated using the scipy.signal.find_peaks() function [37]. Therefore, the spectrum was projected onto the drift time axis by calculating the values along the retention time axis, with the given prominence and minimum peak height. GC spectra at detected peaks were extracted and, further, the retention time dimension was evaluated with defined values of prominence and the minimum peak height. Several peak and spectrum parameters were evaluated, such as drift time [ms], retention time [s], the position of the RIP [ms], and drift tube temperature [°C]. In addition, the peak height, the peak width, and the left and right horizontal intersection points at 10% and 50% height were calculated. FWHM was assessed as the difference between the right and left intersection points at a peak height of 50%. The tailing factor was calculated using Equation (1).

3. Results and Discussion

3.1. RIP and Background Calculations

Within this study, the height and position of the RIP were evaluated, as well as the background and the standard deviation (STD) of the background. Results are shown in Figure 2. In Figure 2a, the RIP height is shown at different drift gas flows, depending on the IMS cell temperature. While the RIP heights at 80 °C, 100 °C and 120 °C were approximately constant in a range between 7 and 7.5 V, the RIP heights at 140 °C and 160 °C were significantly decreased. At 160 °C, the RIP height was decreased to values between 4.75 and 5.35 V. Further, there was an increase in the RIP height observable with an increasing drift gas flow. This effect was perceptible at a cell temperature of 140 °C, with an increase from 6.035 V at 100 mL/min to 6.430 V at 200 mL/min, and, at 160 °C, from 4.757 V at 100 mL/min to 5.318 V at 200 mL/min.
The decrease in the RIP height at high temperatures is most likely caused due to a decrease in moisture and, consequently, fewer proton water clusters. At higher drift gas flows, this effect is less distinct, due to a subsequent higher moisture content in the gas atmosphere. For RIP position, shown in Figure 2b, no observable effects of a shift at different drift gas flow rates were noticed. The dependence of the RIP position and IMS cell temperatures were already described earlier in the literature and are in line with the Mason–Schamp Equation [9,12]. In Figure 2c, the mean background intensities are visualized and show that higher temperatures lead to higher mean background intensities. This correlation was also reported by Capitain et al. recently [12]. However, all data curves featured a distinct decrease in the mean background intensity at higher drift gas flow rates. The decrease in the mean background intensity was most prominent at 160 °C, with a decrease from 202.28 mV at 100 mL/min to 149.09 mV at 200 mL/min, with a loss of 0.497 mV/mL·min−1. A decrease in the mean background intensity was also prominent at the other cell temperatures, e.g., at 80 °C, with a loss of 0.124 mV/mL·min−1 from 77.40 mV at a drift gas flow rate of 100 mL/min to 64.98 mV at 200 mL/min. In Figure 2d, the mean background intensity over STD is visualized, which affects the signal-to-noise ratio (SNR). In a previous study, Capitain et al. demonstrated that, for higher IMS cell temperatures, this term increased and, therefore, the SNR decreases. For SNR, further, the peak height is relevant, which was already observed in lower peak heights at IMS cell temperatures of 160 °C and above. Due to the significantly lower RIP heights and fewer proton water clusters, this is also expected in the focus IMS prototype. However, not only does the temperature affect the mean over STD, but an increase in drift gas flow also leads to an increase in mean background intensity over STD. Further, increased drift gas flows affect the flow equilibrium between sample and drift gas and cause a dilution or washout effect in the analytes.

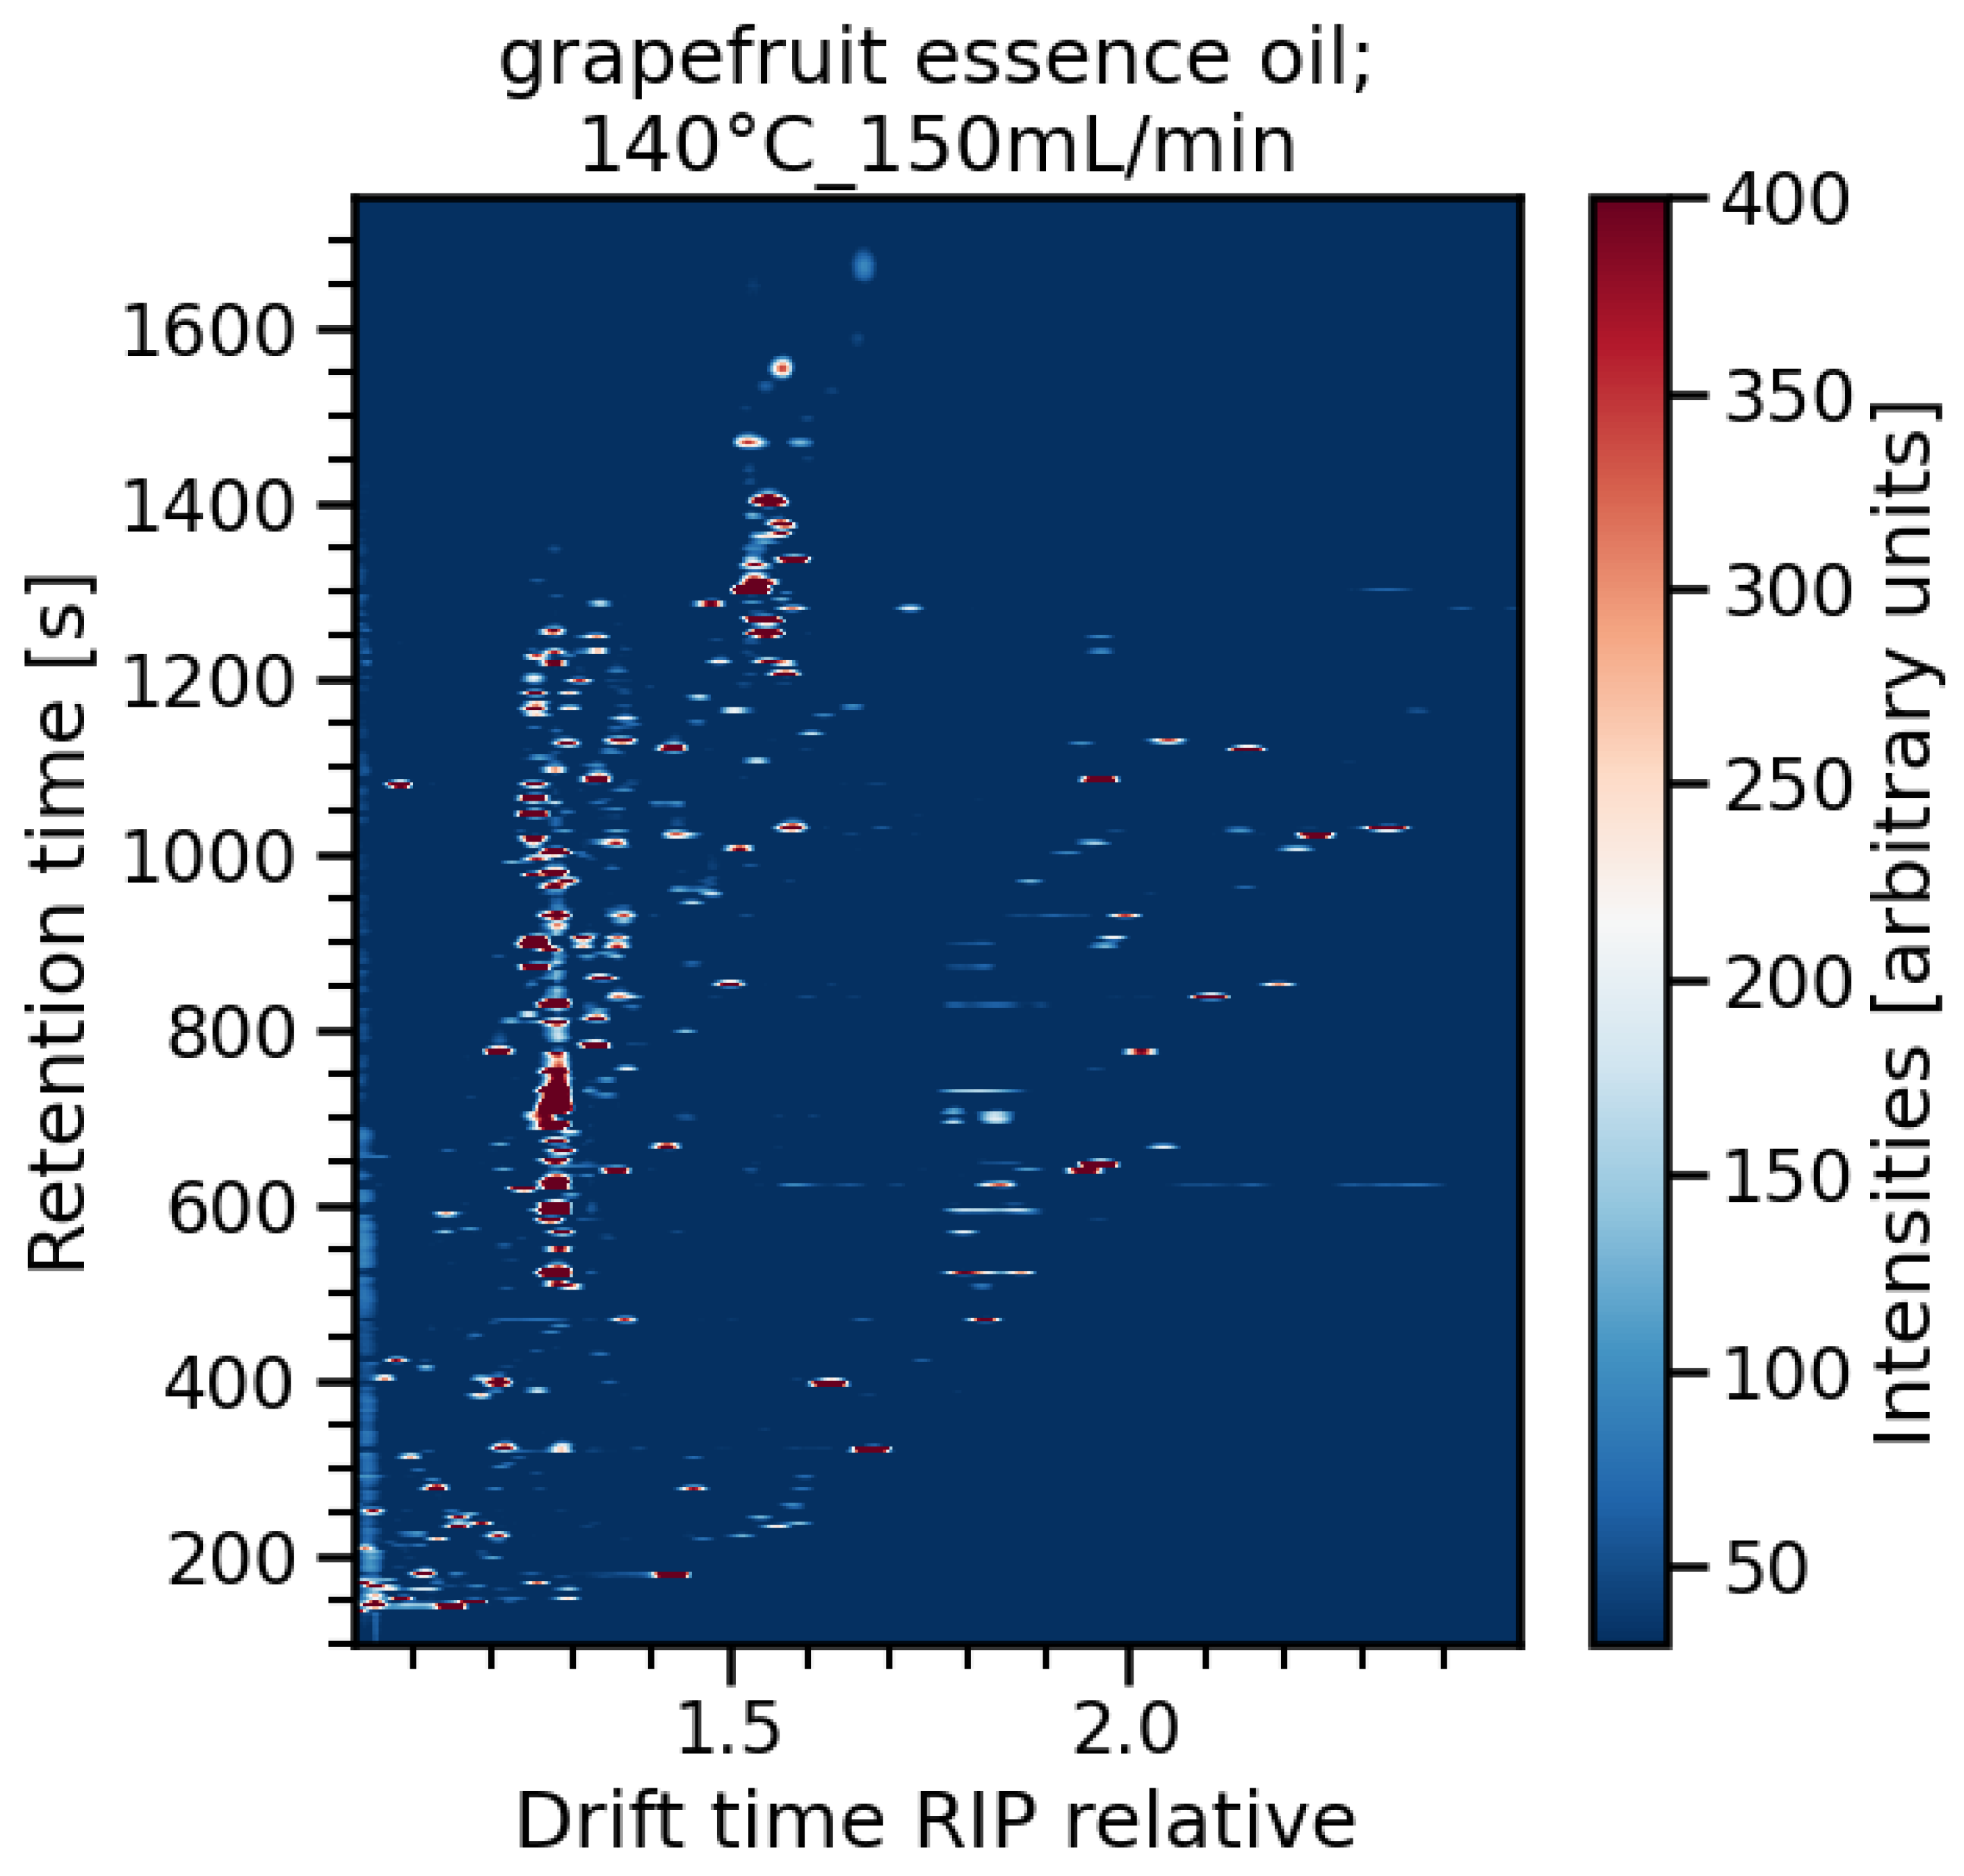
3.2. Data Evaluation of the Experiments for High-Temperature Focus IMS

As shown in previous experiments, the influence of IMS cell temperature and drift gas flow depend on the substance group, boiling point, and the type of formed proton adducts [12]. Within the next section, the impacts of drift tube temperature being between 80 and 160 °C and different drift gas flows in a range of 100–200 mL/min on the peak shape of terpenes and other flavor compounds were evaluated. As the selected substances are common in complex matrices, such as those of essential oils or essence oils, the quality parameters of peak height, FWHM, and tailing factor were evaluated.
While it has already been shown that higher IMS cell temperatures have a beneficial effect on peak tailing and peak width for alcohols, ketones, and other, different contact allergens in the work of Capitain et al., this effect was also observed for all investigated flavor compounds [12]. However, the focus drift gas flow resulted in distinct reduction in tailing factors by a factor of 2–3, even at lower temperatures of 80 °C and 100 °C, in comparison to the classic DTIMS flow design. In Figure 3, a direct comparison of two spectra, acquired with a classic IMS flow and a focus IMS flow is shown. It was generated with a reference containing citral, i.e., the mixture of the isomers geranial and neral, and geraniol. Both systems were operated at 120 °C; however, the focus IMS system featured a substantial improvement in peak tailing and peak shape in general. Most likely, this optimized peak shape is the result of the optimized flow architecture with a smaller void volume in the ionization region and the better compound transient dynamics and superior washout properties of the analytes.
In comparison to other HS-GC-IMS studies with focuses on terpenes and flavor compounds, this study revealed an improved peak shape, especially for (S)-(+)-carvone, citronellol, geraniol, or the sesquiterpene β-caryophyllene (see Figure S2) [3,9,12]. The peak shapes of these compounds are particularly important for analytics in the fields of fragrance and cosmetics, as the substances are listed as allergenic compounds in cosmetic products. Since July 2023, this list has been updated with pinene, geranyl acetate, and several other terpenoid substances, as well as peel oils of different Citrus fruits [29]. All cosmetic products newly listed on the European market containing one of the listed substances must comply with the restrictions as of 31 July 2026, and existing products must comply as of 31 July 2028. Thus, reliable analytical procedures for the determination of the 56 newly added compounds have gained new relevance. With improved peak shapes, analytics of terpenes, terpenoids, and other fragrance allergens in complex cosmetic matrices are substantially simplified in HS-GC-IMS approaches, which do not demand time-consuming sample pre-treatment steps and energy-consuming vacuum systems, such as GC-MS.
Within the following paragraphs, the already mentioned peak quality parameters of the evaluated substances are displayed and discussed. For enhanced readability, 3 of the 13 analytes are visualized exemplarily, while all other graphs have been included in the Supplementary Data. In Figure 4, the impact of the drift gas flow and IMS cell temperature up to the peak height, the FWHM, and the tailing factor on the peaks of (R)-(+)-limonene, as well as the quantitatively predominate volatile compound of Citrus peel oils, the monoterpene alcohol α-terpineol, and β-caryophyllene are visualized, covering a major part of the elution range [31]. The peak height of the monoterpene (R)-(+)-limonene was observed to increase at higher temperatures. While an improved peak height was visible from 80 °C to 140 °C, there was no further improvement from 140 °C to 160 °C. This effect is most likely explainable due to adsorption effects at rather low drift tube temperatures, leading towards peak tailing and higher FWHM values at low drift tube temperatures. The peak heights of the monoterpene alcohol α-terpineol and the sesquiterpene β-caryophyllene did indicate a similar trend at higher temperatures, up to 140 °C. However, for both compounds, a decrease in peak height was observable at higher drift gas flow rates, presumably caused by the faster washout of sample gas at higher drift gas flows.
The FWHM of (R)-(+)-limonene decreased with an increasing drift gas flow, as well as with higher temperatures. In addition, the FWHM of (R)-(+)-limonene and similar substances were lower at drift tube temperatures up to 120 °C, in comparison to the monoterpene alcohols and late-eluting compounds, such as β-caryophyllene. With an increase to 140 °C and 160 °C IMS cell temperature, the FWHM of monoterpenes, monoterpene alcohols, and monoterpene aldehydes showed comparable values in the range of approx. 5–7.5 s. The FWHM value of α-terpineol of nearly 20 s at 80 °C IMS cell temperature decreased by more than a factor of 2 at 100 °C cell temperature (see Figure 4e). The drift gas flow only affected the FWHM at flow rates of 175 mL/min and 200 mL/min at 80 °C drift tube temperature. The peak shape of the larger molecule β-caryophyllene also showed a significant impact on the IMS cell temperature. This is attributed to reduced condensation and adsorption effects, which is particularly important for late-eluting compounds with higher boiling points. At 80 °C, the FWHM was in the range of 25 s and an increase in drift tube temperature to 120 °C already decreased the value to 15–20 s, and was halved to approx. 12.5 s at 160 °C for all the experimental drift gas settings. Interestingly, the effects were substance-specific: while the peak symmetry of (R)-(+)-limonene and β-caryophyllene did not indicate a substantial effect of IMS cell temperature and drift gas flow rates, for α-terpineol, drift tube temperatures of 120 °C or even higher showed a beneficial effect on peak symmetry. Here, tailing factors at 140 °C and 160 °C decreased to less than 1.2 relative to a temperature of 100 °C at all drift gas flow rates.
For ethyl butyrate monomer and dimer, a decreased peak height at higher temperatures was observed, with a minimum of 160 °C (Figure S3a,d). In contrast to terpenes, ethyl butyrate is a smaller molecule with a boiling point of 120–121 °C, while the boiling points of (R)-(+)-limonene and γ-terpinene range around 180 °C. Thus, adsorption effects are less likely to have a distinct influence on the peak height of ethyl butyrate monomer and dimer. Peak intensity was negatively affected by the significantly decreased RIP height and less proton water clusters at higher drift tube temperatures. A reduced FWHM was observed at higher temperatures for both signals. Further, there was a decrease in FWHM at higher drift gas flows; however, the effect of temperature was higher still (see Figure S3b,e). The tailing factors of ethyl butyrate monomer and dimer decreased with higher drift tube temperatures, as well as with higher drift gas flows, resulting in more symmetric peaks (Figure S3c,f).
For the monoterpenes γ-terpinene, sabinene, and β-pinene, similar effects to those of (R)-(+)-limonene were observed, with an improved peak height up to an IMS cell temperature of 140 °C. The FWHM of β-pinene decreased notably for higher drift tube temperatures and an increasing drift gas flow, while the FWHM of the sabinene peak only featured a decrease at temperatures of 140 °C and 160 °C and higher drift gas flows of 175 mL/min and 200 mL/min (see Figure S4b,e). However, the signal of β-pinene exhibited a slight peak fronting, with a tailing factor below 0.9. For γ-terpinene, a symmetric peak shape with values between 1.0 and 1.15 was obtained (see Figure S5c).
For geraniol, similar effects to α-terpineol were observed. At 80 °C, the FWHM ranged between 13 and 19 s, independent from the evaluated drift gas flows. With an increase to 160 °C, the values decreased to approx. 6.5–7 s (see Figure S5e). In contrast to the peak widths, the tailing factors responded clearly to drift gas flow changes by a decrease from 3.5 to 2.0 with increased drift gas flows at 80 °C (see Figure S5f).
ß-Citronellol featured a different behavior at temperatures above 120 °C, with the formation of a distinct monomer signal and only a low abundant dimer signal (see Figure S6a,d). Similar effects were already described for the dimer of cinnamal in previous research [12]. While a number of studies explicitly discusses the dependency of analyte concentration on monomer and dimer formation, the influence of high temperatures for monomer and dimer formation have not been researched yet, and should be evaluated in further studies [3,21]. The impact of the drift gas flow to the FWHM of ß-citronellol was limited (Figure S6b,e). Analogous to α-terpineol and geraniol, the tailing factors decreased substantially at higher IMS cell temperatures.
Citral, the mixture of the isomers geranial and neral, featured similar results: for both substances, the monomer and dimer were evaluated. While the neral monomer and dimer showed an increase in peak height up to a temperature of 160 °C, the geranial monomer and dimer signals increased up to a temperature of 140 °C, but showed a moderate decrease at a temperature of 160 °C (see Figure S7a,d). The FWHM of the geranial monomer peak decreased by a factor of 3.5 with an increase in drift tube temperature of 80 °C to 140 °C and 160 °C. Further, a higher drift gas flow indicated a positive effect regarding FWHM, limited to a drift tube temperature of 80 °C. The FWHM of the geranial dimer did show comparable effects, but was reduced by a factor of two. For the tailing factors of the geranial monomer and dimer, a decent peak symmetry was observed at drift tube temperatures of 120 °C and above (see Figure S7c,f). In comparison to the peak tailing at 80 °C, there is a reduction by a factor of three and two, respectively, for the monomer and dimer. The dimer indicated a smaller tailing factor with an increased drift gas flow at 80 °C and 100 °C drift tube temperature, though this effect is negligible at higher temperatures. In comparison to the monomer of geranial, the FWHM of the neral monomer at a drift tube temperature of 80 °C is substantially smaller, while the FWHM of the dimer was observed in a similar range (see Figure S8b,e). The tailing factors of the neral monomer featured a decrease, with higher drift gas flows of 175 mL/min and 200 mL/min at 80 °C. Again, a significant impact of drift tube temperature to peak symmetry was observable for the neral monomer and dimer. This effect was previously described by Capitain et al. for citral, citronellol, and geraniol [12]. However, the focus drift gas flow architecture depicted a beneficial impact on peak symmetry, in comparison to previous studies, where, for instance, the peak shape of the geranial monomer indicated severe tailing [3,12]. In the previous evaluation of a high-temperature drift tube IMS, tailing factors of the neral dimer were observed distinctly above 15.0 and in a range of 7.5 for the monomer at 80 °C and with a drift gas flow of 150 mL/min [12]. These values were observed to be significantly reduced with the focus flow design, to 3.10 ± 0.25 for the neral dimer and 2.73 ± 0.11 for the neral monomer, resulting in reductions by factors of five and three, respectively. At a drift tube temperature of 160 °C and a drift gas flow of 200 mL/min, the dimer of neral was not detected, supposedly due to the dilution effects of the higher drift gas flow and the increased background noise, as already described in the previous sections.
For the (S)-(+)-carvone monomer and dimer, peak height reaches a maximum at drift tube temperatures of 120 °C and 140 °C, and an decrease is indicated at 160 °C, similar to the data for geranial. The monomer showed a FWHM at 80 °C and 150 mL/min of 27.64 ± 1.76 s, and a tailing factor of 2.89 ± 0.33. These values decreased significantly at a drift tube temperature of 160 °C and drift gas flow of 150 mL/min to 6.97 ± 0.17 and 1.03 ± 0.06, respectively. For the dimer peak, this is also observable. However, there is no significant optimization of FWHM and tailing factor with a further increase in temperature from 140 °C to 160 °C (see Figure S9b,c,e,f).
The peak height and peak shape quality parameters of the late-eluting compounds methyl-n-methylanthranilate and geranyl acetate are comparable to β-caryophyllene. Peak height increased with higher temperatures, while, again, the effect between 140 °C and 160 °C was minimal (see Figure S10a,d). Further, a decrease in peak height was observed with an increase in drift gas flow for all of the late-eluting compounds. The FWHM of these compounds featured a decrease by more than a factor of two with an increase in drift tube temperature to 140 °C (see Figure S10b,e). The tailing factors of geranyl acetate and β-caryophyllene were not affected by the drift gas flow; however, a decrease in tailing factor was observed for methyl-n-methylanthranilate (see Figure S10c). Even though the peak shape of these compounds featured comparatively large FWHM, prior studies show peaks with lengths of approximately 100 s for β-caryophyllene and methyl-n-methylanthranilate [9,11]. Thus, there is a significant improvement regarding peak shape due to the focus flow design in combination with a high-temperature drift tube.
Complex signal patterns, such as those found in Citrus peel or essential oils, require optimization of DTIMS systems. The broad spectrum of eluting compounds, including alcohols, esters, ketones, and terpenes, terpenoids, and sesquiterpenes, demands optimal separation and peak shapes for substances with a boiling point range of approximately 80 °C up to 260 °C. In Figure 5, the complexity of an exemplary grapefruit essential oil GC-IMS spectrum is visualized, set at 150 mL/min drift gas flow and with a cell temperature of 140 °C. The spectrum features well-separated, narrow, and symmetric peaks even for high-boiling VOCs, such as the sesquiterpenes, while current research indicates significant peak tailing and broad peak widths [38,39]. This is, in particular, beneficial for the analysis of highly complex samples such as the aforementioned Citrus peel and essence oils, but also for cosmetics, complex foods, and beverages.

4. Conclusions

The presented results demonstrate that the peak shape quality of selected flavor compounds is substantially improved by the focus drift gas flow architecture and higher IMS drift tube temperatures. Peak shape and peak tailing are remarkably reduced in comparison to other experiments with common DTIMS. Especially at drift tube temperatures of 80 °C and 100 °C, tailing factors and FWHM values are reduced by a factor > 2. The positive effects are observable for all chemical compounds from esters to monoterpenes, monoterpene alcohols, and sesquiterpenes. Thus, measurements of complex flavor samples can be optimized, along with peak tailing, and, consequently, the interference of analytes is reduced. The influence of the temperature for peak shapes of terpenes is more prominent than the drift gas flow; however, at typical IMS cell temperatures of 80 °C and 100 °C, a drift gas flow increased to 175 mL/min or 200 mL/min resulted in a slight improvement in peak shape for most of the flavor compounds. An increase in drift tube temperature from 140 to 160 °C featured only a negligible improvement. For most of the investigated VOCs, an IMS cell, adjustable up to 140 °C, in combination with the focus flow technique at 150 mL/min drift gas flow, can improve peak symmetry and FWHM already significantly. In conjunction with the system’s immanent soft ionization and the higher temperature range of up to 180 °C, the prototypic focus high-temperature IMS widens the analytical scope to higher boiling terpenoids and even sesquiterpenes without the so-far-dominating tailing effects. Overall, the approach allows for a more detailed analysis of cosmetics, flavorings, food products and quality control of terpenes and terpenoids using HS-GC-IMS.

Supplementary Materials

The following supporting information can be downloaded at: https://www.mdpi.com/article/10.3390/chemosensors13040131/s1, Figure S1: Schematics of peak parameters of width and asymmetry, including full width at 0.607 of maximum (w607), full width at half maximum (FWHM) and base width (BLW). Further, width at 5% (wf_05) and 10% (wf_10) of the peak height of the front half and width at 5% (wt_05) and 10% (wt_10) of the peak height of the back half, respectively.; Figure S1. GC-IMS spectrum of standard 1 and 2 at 120° C IMS cell temperature and 150 ml/min drift gas flow.; Figure S2: Effect of drift gas flow and drift tube temperature on peak height (a and d), FWHM (b and e) and tailing factor (c and f) of ethyl butyrate monomer and dimer.; Figure S3: Effect of drift gas flow and drift tube temperature on peak height (a and d), FWHM (b and e) and tailing factor (c and f) of sabinene and β-pinene.; Figure S4: Effect of drift gas flow and drift tube temperature on peak height (a and d), FWHM (b and e) and tailing factor (c and f) of γ-terpinene and geraniol.; Figure S5: Effect of drift gas flow and drift tube temperature on peak height (a and d), FWHM (b and e) and tailing factor (c and f) of citronellol monomer and dimer.; Figure S6: Effect of drift gas flow and drift tube temperature on peak height (a and d), FWHM (b and e) and tailing factor (c and f) of geranial monomer and dimer.; Figure S7: Effect of drift gas flow and drift tube temperature on peak height (a and d), FWHM (b and e) and tailing factor (c and f) of neral monomer and dimer.; Figure S8: Effect of drift gas flow and drift tube temperature on peak height (a and d), FWHM (b and e) and tailing factor (c and f) of (S)-(+)-carvone monomer and dimer.; Figure S9: Effect of drift gas flow and drift tube temperature on peak height (a and d), FWHM (b and e) and tailing factor (c and f) of methyl-n-methylanthranilate and geranyl acetate.

Author Contributions

L.B.: Writing—Original draft, Data curation, Visualization, Formal analysis, Conceptualization. S.R.: Writing—review and editing, Supervision. P.W.: Writing—review and editing, Funding acquisition, Supervision, Conceptualization. All authors have read and agreed to the published version of the manuscript.

Funding

This research was financially supported within the project “DeepAuthent” (FKZ: 13FH138KX0) by the Federal Ministry of Education and Research (BMBF), Berlin, Germany.

Institutional Review Board Statement

Not applicable.

Informed Consent Statement

Not applicable.

Data Availability Statement

The data presented in this study are available on request from the corresponding author.

Acknowledgments

The authors further thank G.A.S Gesellschaft für Analytische Sensorsysteme mbH, Dortmund, Germany, for providing the prototypic high-temperature focus ion mobility spectrometer and their technical expertise.

Conflicts of Interest

The authors declare no conflicts of interest.

References

  1. Hernández-Mesa, M.; Ropartz, D.; García-Campaña, A.M.; Rogniaux, H.; Dervilly-Pinel, G.; Le Bizec, B. Ion Mobility Spectrometry in Food Analysis: Principles, Current Applications and Future Trends. Molecules 2019, 24, 2706. [Google Scholar] [CrossRef]
  2. Vautz, W.; Zimmermann, D.; Hartmann, M.; Baumbach, J.I.; Nolte, J.; Jung, J. Ion mobility spectrometry for food quality and safety. Food Addit. Contam. 2006, 23, 1064–1073. [Google Scholar] [CrossRef] [PubMed]
  3. Brendel, R.; Schwolow, S.; Rohn, S.; Weller, P. Comparison of PLSR, MCR-ALS and Kernel-PLSR for the quantification of allergenic fragrance compounds in complex cosmetic products based on nonlinear 2D GC-IMS data. Chemom. Intell. Lab. Syst. 2020, 205, 104128. [Google Scholar] [CrossRef]
  4. Parastar, H.; Weller, P. Towards greener volatilomics: Is GC-IMS the new Swiss army knife of gas phase analysis? TrAC Trends Anal. Chem. 2024, 170, 117438. [Google Scholar] [CrossRef]
  5. Gerhardt, N.; Birkenmeier, M.; Schwolow, S.; Rohn, S.; Weller, P. Volatile-Compound Fingerprinting by Headspace-Gas-Chromatography Ion-Mobility Spectrometry (HS-GC-IMS) as a Benchtop Alternative to 1H NMR Profiling for Assessment of the Authenticity of Honey. Anal. Chem. 2018, 90, 1777–1785. [Google Scholar] [CrossRef]
  6. Gerhardt, N.; Schwolow, S.; Rohn, S.; Pérez-Cacho, P.R.; Galán-Soldevilla, H.; Arce, L.; Weller, P. Quality assessment of olive oils based on temperature-ramped HS-GC-IMS and sensory evaluation: Comparison of different processing approaches by LDA, kNN, and SVM. Food Chem. 2019, 278, 720–728. [Google Scholar] [CrossRef]
  7. Brendel, R.; Schwolow, S.; Rohn, S.; Weller, P. Volatilomic Profiling of Citrus Juices by Dual-Detection HS-GC-MS-IMS and Machine Learning-An Alternative Authentication Approach. J. Agric. Food Chem. 2021, 69, 1727–1738. [Google Scholar] [CrossRef]
  8. Garrido-Delgado, R.; Del Dobao-Prieto, M.M.; Arce, L.; Valcárcel, M. Determination of volatile compounds by GC-IMS to assign the quality of virgin olive oil. Food Chem. 2015, 187, 572–579. [Google Scholar] [CrossRef]
  9. Rodríguez-Maecker, R.; Vyhmeister, E.; Meisen, S.; Rosales Martinez, A.; Kuklya, A.; Telgheder, U. Identification of terpenes and essential oils by means of static headspace gas chromatography-ion mobility spectrometry. Anal. Bioanal. Chem. 2017, 409, 6595–6603. [Google Scholar] [CrossRef]
  10. Schanzmann, H.; Augustini, A.L.R.M.; Sanders, D.; Dahlheimer, M.; Wigger, M.; Zech, P.-M.; Sielemann, S. Differentiation of Monofloral Honey Using Volatile Organic Compounds by HS-GCxIMS. Molecules 2022, 27, 7554. [Google Scholar] [CrossRef]
  11. Lv, W.; Lin, T.; Ren, Z.; Jiang, Y.; Zhang, J.; Bi, F.; Gu, L.; Hou, H.; He, J. Rapid discrimination of Citrus reticulata ‘Chachi’ by headspace-gas chromatography-ion mobility spectrometry fingerprints combined with principal component analysis. Food Res. Int. 2020, 131, 108985. [Google Scholar] [CrossRef] [PubMed]
  12. Capitain, C.C.; Zischka, M.; Sirkeci, C.; Weller, P. Evaluation of IMS drift tube temperature on the peak shape of high boiling fragrance compounds towards allergen detection in complex cosmetic products and essential oils. Talanta 2023, 257, 124397. [Google Scholar] [PubMed]
  13. Breitmaier, E. Terpenes: Flavors, Fragrances, Pharmaca, Pheromones; 1. Reprint; Wiley-VCH: Weinheim, Germany, 2008; ISBN 9783527317868. [Google Scholar]
  14. Schrader, J.; Bohlmann, J. Biotechnology of Isoprenoids; Springer International Publishing: Cham, Switzerland, 2015; ISBN 978-3-319-20106-1. [Google Scholar]
  15. Borsdorf, H.; Rudolph, M. Gas-phase ion mobility studies of constitutional isomeric hydrocarbons using different ionization techniques. Int. J. Mass Spectrom. 2001, 208, 67–72. [Google Scholar] [CrossRef]
  16. Borsdorf, H.; Eiceman, G.A. Ion Mobility Spectrometry: Principles and Applications. Appl. Spectrosc. Rev. 2006, 41, 323–375. [Google Scholar] [CrossRef]
  17. European Parliament and the Council of the European Union. Council Directive 2013/59/Euratom of 5 December 2013 Laying Down Basic Safety Standards for Protection against the Dangers Arising from Exposure to Ionising Radiation. Off. J. Eur. Union 2013. Available online: https://eur-lex.europa.eu/legal-content/EN/TXT/HTML/?uri=CELEX:32013L0059 (accessed on 2 April 2025).
  18. Garrido-Delgado, R.; Dobao-Prieto, M.M.; Arce, L.; Aguilar, J.; Cumplido, J.L.; Valcárcel, M. Ion mobility spectrometry versus classical physico-chemical analysis for assessing the shelf life of extra virgin olive oil according to container type and storage conditions. J. Agric. Food Chem. 2015, 63, 2179–2188. [Google Scholar] [CrossRef]
  19. Eiceman, G.A.; Nazarov, E.G.; Rodriguez, J.E.; Berglof, J.F. Positive reactant ion chemistry for analytical, high temperature ion mobility spectrometry (IMS): Effects of electric field of the drift tube and moisture, temperature, and flow of the drift gas. Int. J. Ion Mobil. Spectrom. 1998, 1, 28–37. [Google Scholar]
  20. Ewing, R.G.; Eiceman, G.A.; Stone, J. Proton-bound cluster ions in ion mobility spectrometry. Int. J. Mass Spectrom. 1999, 193, 57–68. [Google Scholar] [CrossRef]
  21. Pomareda, V.; Guamán, A.V.; Mohammadnejad, M.; Calvo, D.; Pardo, A.; Marco, S. Multivariate curve resolution of nonlinear ion mobility spectra followed by multivariate nonlinear calibration for quantitative prediction. Chemom. Intell. Lab. Syst. 2012, 118, 219–229. [Google Scholar] [CrossRef]
  22. Mason, E.A.; Schamp, H.W. Mobility of gaseous lons in weak electric fields. Ann. Phys. 1958, 4, 233–270. [Google Scholar] [CrossRef]
  23. G.A.S. Gesellschaft für Analytische Sensorsysteme mbH. FOCUS-Ion Mobility Spectrometer®: Sensitivity meets Selectivity: Welcome the New Level of IMS Performance. 2021. Available online: https://www.gas-dortmund.de/data-live-gas/docs/pdf/Technical_Note_FOCUS_2108.pdf (accessed on 27 March 2025).
  24. Morton, D.W.; Young, C.L. Analysis of Peak Profiles Using Statistical Moments. J. Chromatogr. Sci. 1995, 33, 514–524. [Google Scholar] [CrossRef]
  25. Grushka, E. Characterization of exponentially modified Gaussian peaks in chromatography. Anal. Chem. 1972, 44, 1733–1738. [Google Scholar] [CrossRef] [PubMed]
  26. Kalambet, Y. Data acquisition and integration. In Gas Chromatography, 2nd ed.; Poole, C.F., Ed.; Elsevier: Amsterdam, The Netherlands, 2021; pp. 505–524. ISBN 9780128206751. [Google Scholar]
  27. Kalambet, Y.; Kozmin, Y.; Mikhailova, K.; Nagaev, I.; Tikhonov, P. Reconstruction of chromatographic peaks using the exponentially modified Gaussian function. J. Chemom. 2011, 25, 352–356. [Google Scholar] [CrossRef]
  28. Pápai, Z.; Pap, T.L. Analysis of peak asymmetry in chromatography. J. Chromatogr. A 2002, 953, 31–38. [Google Scholar] [CrossRef] [PubMed]
  29. European Parliament and the council of the European Union. Commission Regulation (EU) 2023/1545 of 26 July 2023 amending Regulation (EC) No 1223/2009 of the European Parliament and of the Council as regards labelling of fragrance allergens in cosmetic products. Off. J. Eur. Union 2023. Available online: https://eur-lex.europa.eu/legal-content/EN/TXT/HTML/?uri=CELEX:32023R1545 (accessed on 2 April 2025).
  30. European Parliament and the council of the European Union. Regulation (EC) No 1223/2009 of the European Parliament and of the Council of 30 November 2009 on Cosmetic Products. Off. J. Eur. Union 2009. Available online: https://eur-lex.europa.eu/legal-content/EN/TXT/HTML/?uri=CELEX:32009R1223 (accessed on 2 April 2025).
  31. Wang, Y.; Wang, S.; Fabroni, S.; Feng, S.; Rapisarda, P.; Rouseff, R. Chemistry of citrus flavor. In The Genus Citrus; Talon, M., Caruso, M., Gmitter, F.G., Eds.; Woodhead Publishing, an Imprint of Elsevier: Duxford, UK, 2020; pp. 447–470. ISBN 9780128121634. [Google Scholar]
  32. Rouseff, R.L.; Ruiz Perez-Cacho, P.; Jabalpurwala, F. Historical review of citrus flavor research during the past 100 years. J. Agric. Food Chem. 2009, 57, 8115–8124. [Google Scholar] [CrossRef]
  33. Berk, Z. Production of citrus juice concentrates. In Citrus Fruit Processing; Elsevier: Amsterdam, The Netherlands, 2016; pp. 187–217. ISBN 9780128031339. [Google Scholar]
  34. Wolford, R.W.; Kesterson, J.W.; Attaway, J.A. Physicochemical properties of citrus essential oils from Florida. J. Agric. Food Chem. 1971, 19, 1097–1105. [Google Scholar] [CrossRef]
  35. Nitschke, A.; Hitzemann, M.; Winkelholz, J.; Kirk, A.T.; Lippmann, M.; Thoben, C.; Wittwer, J.A.; Zimmermann, S. A hyper-fast gas chromatograph coupled to an ion mobility spectrometer with high repetition rate and flow-optimized ion source to resolve the short chromatographic peaks. J. Chromatogr. A 2024, 1736, 465376. [Google Scholar] [CrossRef]
  36. Harris, C.R.; Millman, K.J.; van der Walt, S.J.; Gommers, R.; Virtanen, P.; Cournapeau, D.; Wieser, E.; Taylor, J.; Berg, S.; Smith, N.J.; et al. Array programming with NumPy. Nature 2020, 585, 357–362. [Google Scholar] [CrossRef]
  37. Virtanen, P.; Gommers, R.; Oliphant, T.E.; Haberland, M.; Reddy, T.; Cournapeau, D.; Burovski, E.; Peterson, P.; Weckesser, W.; Bright, J.; et al. SciPy 1.0: Fundamental algorithms for scientific computing in Python. Nat. Methods 2020, 17, 261–272. [Google Scholar] [CrossRef]
  38. Wang, H.; Wang, P.; Wang, F.; Chen, H.; Chen, L.; Hu, Y.; Liu, Y. Integrated HS-GC-IMS and UPLC-Q-Orbitrap HRMS-based metabolomics revealed the characteristics and differential volatile and nonvolatile metabolites of different citrus peels. Curr. Res. Food Sci. 2024, 8, 100755. [Google Scholar] [CrossRef]
  39. Lin, Y.; Yu, G.; Zhang, S.; Zhu, G.; Yi, F. Comparative analysis of the differences in volatile organic components of three lavender essential oils in Ili region using sensory evaluation, GC-IMS and GC-MS techniques. J. Chromatogr. A 2024, 1731, 465197. [Google Scholar] [CrossRef]
Figure 1. Schematic setup of the classic 3H-drift time ion mobility spectrometer (a) and the focus 3H-drift time ion mobility spectrometer (b). The box in Figure 1b highlights the optimized flow architecture in the ionization region (not to scale) which significantly reduces diffusion-based effects due to the shorter dwell-times of the analyte molecules in the source region (adopted from [23]).
Chemosensors 13 00131 g001
Figure 2. Effect of drift gas flow on reactant ion peak (RIP) height (a), the RIP position (b), mean background intensity (c), and mean background intensity over standard deviation (STD) (d), dependent on drift tube temperature (n = 3).
Chemosensors 13 00131 g002
Figure 3. GC-IMS spectra from a reference mixture of citral and geraniol, acquired with a conventional IMS cell (left spectrum) and a focus IMS cell (right spectrum). Both measurements were performed at 120 °C IMS cell temperature and 150 mL/min drift gas flow.
Chemosensors 13 00131 g003
Figure 4. Effects of drift gas flow and drift tube temperature on peak height (a,d,g), the FWHM (b,e,h), and the tailing factor (c,f,i) of (R)-(+)-limonene, α-terpineol, and β-caryophyllene.
Chemosensors 13 00131 g004
Figure 5. GC-IMS spectrum of pink grapefruit essence oil at 140 °C and 150 mL/min.
Chemosensors 13 00131 g005
Table 1. Structural formula, physical properties, and appearance of the selected flavor compounds.
CompoundMolar Mass [g/mol]Boiling Point [°C]StructureAppearance
Ethyl butyrate (CAS: 105-54-4)116.16 120–121Chemosensors 13 00131 i001Sweet oranges
(C. sinensis (L.) Osbeck), mandarins
(C. reticulata)
Sabinene (CAS: 3387-41-5)136.23163–164Chemosensors 13 00131 i002All Citrus fruits
β—Pinene (CAS: 18172-67-3)136.23165–167Chemosensors 13 00131 i003All Citrus fruits
(R)-(+)-Limonene (CAS: 5989-27-5)136.23176–177Chemosensors 13 00131 i004All Citrus fruits
γ—Terpinene (CAS: 99-85-4)136.23181–183Chemosensors 13 00131 i005All Citrus fruits
α—Terpineol (CAS: 98-55-5)154.25 218–221Chemosensors 13 00131 i006All Citrus fruits
(S)-(+)-Carvone (CAS: 2244-16-8)150.22 230–231Chemosensors 13 00131 i007All Citrus fruits
Geraniol (CAS: 106-24-1)154.25 229–230Chemosensors 13 00131 i008All Citrus fruits
Geranyl acetate (CAS: 105-87-3)196.29 240–245Chemosensors 13 00131 i009All Citrus fruits
β-Citronellol (CAS: 106-22-9)156.26 224Chemosensors 13 00131 i010All Citrus fruits
Citral (CAS: 5392-40-5)152.23 227–229Chemosensors 13 00131 i011All Citrus fruits
Methyl-N-Methylanthranilate
(CAS: 85-91-6)
165.19 255–256 Chemosensors 13 00131 i012Mandarins
(C. reticulata)
β-Caryophyllene (CAS: 87-44-5)204.35256–259Chemosensors 13 00131 i013Grapefruits
(C. × paradisi)
Table 2. Optimized headspace incubation settings and GC parameters.
Headspace Sampling and GC Settings
Incubation time12 min
Incubation temperature85 °C
Injection volume1.0 mL
Syringe temperature100 °C
Inlet temperature200 °C
Split ratio1:20
Inlet pressure6.7 psi, const. pressure
GC columnHP-5 (30 m × 0.32 mm × 0.25 μm)
Oven program40 °C → 120 °C with 5 °C/min
120 °C → 240 °C with 12 °C/min
Disclaimer/Publisher’s Note: The statements, opinions and data contained in all publications are solely those of the individual author(s) and contributor(s) and not of MDPI and/or the editor(s). MDPI and/or the editor(s) disclaim responsibility for any injury to people or property resulting from any ideas, methods, instructions or products referred to in the content.

