Article

A Photo-Controllable DNAzyme-Based Nanosensor for miRNA Imaging in Living Cells

Guangdong Provincial Key Laboratory of Sensing Technology and Biomedical Instrument, School of Biomedical Engineering, Sun Yat-Sen University, Shenzhen Campus of Sun Yat-Sen University, Shenzhen 518107, China
*
Authors to whom correspondence should be addressed.
Chemosensors 2025, 13(4), 123; https://doi.org/10.3390/chemosensors13040123
Submission received: 31 December 2024 / Revised: 12 March 2025 / Accepted: 28 March 2025 / Published: 2 April 2025

Abstract

:
MircroRNA (miRNA) exhibits abnormal expression in many cancer diseases, and the detection and analysis of miRNA are significant for the early diagnosis of diseases and research on miRNA functions. In this work, we construct a UV-triggered DNAzyme (UTD) nanosensor for the early detection of miRNA in tumor cells. As the nanodevice was delivered into cells and irradiated by UV light, the controllable imaging of miRNA in living cells was achieved. This method effectively avoids false signal issues, providing a new strategy for high-spatiotemporal-resolution imaging of miRNA in living cells.

1. Introduction

MiRNAs play a crucial role in maintaining the cellular environment and have been found to be aberrationally expressed in numerous cancerous diseases [1,2,3]. As a biomarker, the detection of miRNA is of great significance for the early diagnosis of diseases and the study of miRNA functions. However, traditional gene detection methods cannot be used for the determination of low-abundance miRNA [4,5]. In addition, due to the short sequences and high homology of miRNA, it is also challenging to distinguish between different miRNAs [6]. To overcome these limitations, signal amplification processes become a key strategy to enhance detection sensitivity [7]. Among them, enzyme-free signal amplification systems (such as DNAzymes) have been developed for highly specific miRNA detection [8,9,10]. Although DNAzymes are effective tools for RNA imaging in living cells, they still face some limitations: (1) the transfection of DNAzymes requires efficient and biocompatible nanocarriers; (2) the stability of DNAzymes within cells is relatively poor and could negatively impact their detection capability, especially for low-abundance targets, as there is a higher chance of signal leakage [11]; (3) the auxiliary factors required for the reaction (usually metal ions) are present in limited quantities within cells. These factors all limit their application in live-cell imaging technologies [12].
With the assistance of nanodevices, DNAzymes can be effectively delivered into cells. Additionally, light’s precise delivery in terms of timing, spatial location, intensity, and wavelength makes it an important tool for regulating biological events [13]. By incorporating photosensitive switch elements into nucleic acids or proteins, targeted release of drugs or signaling molecules can be achieved [14,15]. The introduction of photoactivation design in DNA nanodevice construction provides high-precision spatiotemporal control for sensing and imaging, effectively avoiding false-positive signals [16]. Recently, photoactivated DNA nanodevices have been increasingly applied to intracellular sensing and imaging of metal ions, small molecules, and miRNA [17,18,19]. However, due to poor tissue permeability and limitations related to phototoxicity, there is relatively little research on photoactivated nanodevices for in vivo miRNA imaging.
Therefore, we constructed a UV-triggered DNAzyme (UTD) nanodevice in this work, which is activated by ultraviolet light, for the imaging of miR-21, a widely reported miRNA biomarker for tumors [20]. By modifying hairpin probes and blocked DNAzyme chains on honeycomb MnO2 nanoflowers (hMNs), the UTD@hMN nanodevice was prepared and delivered into cells. Following cellular internalization, the hMNs undergo enzymatic degradation within the endosomal compartment, thereby releasing functional nucleic acid probes into the cytoplasm. Upon UV irradiation, the photocleavage linker bond (PC linker) breaks [21,22], leading to the exposure of stick end, which cause the hybridization of miR-21 and blocker chain. The activated DNAzyme then recognizes and cleaves the substrate HP-S, restoring the fluorescent signal. The dual-gated device can release the DNAzyme probe in a spatiotemporally controlled manner after entering the cell and report the fluorescence signal only in the presence of miR-21. Compared with only one target of miR-21, dual gating can avoid false-positive signals caused by hydrolysis and other factors. This strategy achieves controlled imaging of miR-21 with a detection limit of 110 pM, significantly reducing potential false-positive risks.

2. Materials and Methods

2.1. Materials

The nucleic acids were purchased from Sangon Biotech. Co., Ltd., (Shanghai, China) and are listed in Table 1. KMnO4, oleic acid (OA), and MnCl2·4H2O were purchased from Aladdin Scientific Corp., (Shanghai, China). 2-[4-(2-hydroxyethyl) piperazin-1-yl] ethanesulfonic acid (HEPES, 1M) buffer was purchased from Solarbio Sciences & Technology Co., Ltd., (Beijing, China). Dulbecco’s modified eagle medium (DMEM), fetal bovine serum (FBS), and Lipo 3000 were purchased from Thermo Fisher Scientific (Shanghai, China). All aqueous solutions were prepared in deionized water purchased from Macklin Biochemical Technology Co., Ltd., (Shanghai, China).

2.2. Polyacrylamide Gel Electrophoresis

Here, 12% non-denaturing polyacrylamide gel electrophoresis was utilized to characterize the nucleic acid circuit and verify its feasibility. First, a 5× TBE buffer solution was prepared, followed by the preparation of the 12% gel electrophoresis solution (4 mL H2O, 0.8 mL of 5× TBE, 3.2 mL of 30% acrylamide solution, 80 μL of 10% ammonium persulfate, and 6.4 μL of TEMED). After quickly mixing, the solution was poured into the gel cassette and allowed to sit for 60 min. The solidified acrylamide gel was immersed in a 1× TBE electrophoresis tank, and DNA samples premixed with loading buffer were added (10 μL) into the corresponding lanes. Electrophoresis was conducted at 80 V for 70 min. Afterward, the gel was stained with 4S Gelred for 30 min and imaged using a gel imaging system (ChemiScope 6200 Touch, Clinx Science Instruments Co., Ltd., Shanghai, China).

2.3. Preparation of hMNs and UTD@hMNs

To prepare the hMNs [23], KMnO4 (0.1 g) was mixed with 50 mL of ultrapure water and vigorously stirred for 30 min at 800 rpm. Subsequently, 1.0 mL of OA was added to the mixture and stirred continuously for 5 h at 1500 rpm. The product was then centrifuged at 10,000 rpm for 10 min and washed three times each with deionized water and ethanol. Finally, the product was redispersed in water and stored at 4 °C.
The DNAzyme and the blocking strand were mixed at a 1:1 molar ratio in HEPES buffer solution (10 mM HEPES, pH 7.2, 150 mM NaCl, 2.5 mM MgCl2) and co-incubated at 37 °C for 1 h to prepare the DNAzyme-blocked strand complex. Subsequently, the DNAzyme-blocked strand (1 μL, 10 μM) and HP-S (1 μL, 10 μM) were added to hMNs (10 μL, 1 mg/mL) and incubated at room temperature for 20 min. HEPES buffer solution was then added to achieve a final concentration of 100 nM for the UTD probe and 100 μg/mL for the hMNs. This mixture was further incubated at room temperature for 20 min for subsequent experiments.

2.4. miR-21 Detection In Vitro

All fluorescence experiments were conducted in HEPES buffer solution containing 1.2 mM Mn2+ (10 mM HEPES, pH 7.2; 150 mM NaCl; 2.5 mM MgCl2). The concentrations of DNAzyme, blocking strand, and HP-S were all set at 100 nM. The DNAzyme and blocking strand were co-incubated at 37 °C for 1 h, followed by UV irradiation (365 nm, 2.5 mW cm−2, for 5 min). The excitation wavelength was set to 620 nm on the HP-SF-7000 fluorescence spectrophotometer, with emission detected between 650 and 800 nm. In the specificity experiment, the concentrations of mis-1, mis-2, mis-3, miR-21, miR-205, and miR-155 were all 100 nM. The fluorescence spectra were recorded on an F-7000 spectrometer (Hitachi (China) Co., Ltd., Beijing, China) at an excitation wavelength of 620 nm.
The interference (I) values for the detection of miR-21 from other coexisting miRNAs and mismatched oligoes were calculated based on the correlation equations listed below.
(1) F = 7.56 cmiR-21 + 65.31,
(2) cmiR-21 = (FmiR-21 − 65.31)/7.56,
(3) cmiRNA = (FmiRNA − 65.31)/7.56,
(4) I = cmiRNA/cmiR-21.

2.5. Cell Incubation

Human breast cancer cells (MCF-7) and human mammary epithelial cells (MCF-10A) were purchased from the Cell Bank of the Chinese Academy of Sciences Shanghai Institutes for Biological Sciences. MCF-7 cells were cultured in DMEM supplemented with 10% FBS and 1% penicillin/streptomycin. MCF-10A cells were cultured in MCF-10A complete medium. Both cell types were incubated in a humidified atmosphere containing 5% CO2 at 37 °C.

2.6. MTT Assay

MCF-7 cells were diluted to a concentration of 5 × 10⁴/mL using complete culture medium and seeded into a 96-well plate at 100 μL per well. The cells were then incubated overnight in a humidified atmosphere containing 5% CO2 at 37 °C. Afterward, the complete culture medium was removed, and 100 μL of hMNs prepared in culture medium was added to each well. The cells were further incubated for 24 h. Following this, the culture medium was removed, and 100 μL of culture medium containing 10% MTT was added to each well and incubated for another 4 h. Subsequently, the culture medium was removed, and 150 μL of DMSO was added to each well. The plate was then shaken on an orbital shaker for 15 min, and the absorbance at 560 nm was measured using a microplate reader.
To optimize the effect of UV irradiation, MCF-7 cells were diluted to a concentration of 5 × 10⁴/mL using complete culture medium and seeded into a 96-well plate at 100 μL per well. The cells were then incubated overnight in a humidified atmosphere containing 5% CO2 at 37 °C. Subsequently, different durations of UV irradiation were applied. After irradiation, the complete culture medium was removed, and 100 μL of culture medium containing 10% MTT was added to each well and incubated for another 4 h. Following this, the culture medium was aspirated, and 150 μL of DMSO was added to each well. The plate was then shaken on an orbital shaker for 15 min, and the absorbance at 560 nm was measured using a microplate reader.

2.7. Stability of UTD@hMNs

To verify the resistance to hydrolysis of hMNs loaded with the HP-S probe, the HP-S probe (100 nM) modified with the fluorophore Cy5 and the quencher BHQ2 was loaded onto hMNs. Subsequently, 10 μL of DNase I (35 U/L) was added and incubated together at 37 °C for 2 h. The fluorescence intensity at different time points was measured using an F-7000 fluorescence spectrophotometer. As a control, the fluorescence intensity changes of the free HP-S probe under the same conditions were measured.

2.8. CLSM Imaging

To assess the feasibility of the method for imaging intracellular miR-21, MCF-7 cells were seeded into a 20 mm confocal culture dish (Wuxi NEST Biotechnology Co., Ltd., Wuxi, China) and incubated at 37 °C for 24 h. Once the cells adhered to the surface, the medium was replaced with fresh DMEM containing UTD@hMNs or the UTD probe, followed by incubation for 2 h. The cultures were then exposed to UV light (365 nm, 2.5 mW cm−2, 5 min). After an additional 2 h incubation, the cells were washed three times with PBS, and confocal fluorescence imaging was performed. The excitation wavelength was set to 620 nm, and the emission wavelength range was set from 650 to 800 nm. Additionally, 100 nM miR-21 mimics and 100 nM anti-miR-21 were transfected into MCF-7 cells using Lipo 3000 to simulate the states of upregulated and downregulated miR-21 levels, respectively. These cells were then incubated with UTD@hMNs for 4 h at 37 °C (with intermediate UV exposure), following the imaging protocol described above to verify the method’s responsiveness to changes in intracellular miR-21 levels. To validate the method’s ability to discriminate between different cell types based on miR-21 expression, UTD@hMNs were incubated with both MCF-7 and MCF-10A cells for 4 h (with intermediate UV exposure), and imaging was performed according to the same steps. The imaging figures were recorded at an excitation wavelength of 620 nm on a Zeiss LSM710 confocal microscope.

3. Results and Discussion

3.1. Principle of the UTD Nanodevices

In this work, we constructed UTD nanodevices to achieve photoactivatable spatiotemporal control of miRNA imaging in living cells (Figure 1). The nanodevices consist of a DNAzyme strand (D) and a blocking strand (B), with a hairpin probe HP-S serving as the substrate for the DNAzyme, and hMNs acting as the probe carrier. The Cy5 fluorophore and its corresponding quenching group BHQ2 are modified at the 5′ and 3′ ends of HP-S, respectively, rendering the initial fluorescence signal in a quenched state. Initially, the cleavage activity of the DNAzyme is inhibited by the blocking strand through complementary sequences. A PC-linker group, which is a photoactive group, is inserted into the DNAzyme strand. When the probes are delivered into the cell by hMNs, the UTD@hMNs can be specifically decomposed by the intracellular GSH [24], releasing the probes while simultaneously providing Mn2+ to assist the DNAzyme cleavage reaction. Under UV irradiation, the PC-linker bond breaks, shortening the DNAzyme strand and exposing a toehold end, allowing the target miRNA to hybridize with the toehold site of the blocking strand, thereby releasing the DNAzyme. The activated DNAzyme recognizes and catalyzes the cleavage of the substrate HP-S, causing the fluorophore and quenching group to separate, thus, restoring the fluorescence signal. Ultimately, the intensity of the restored fluorescence signal enables the precise and controlled imaging of miRNA within living cells.

3.2. Feasibility of the UTD Nanosystems

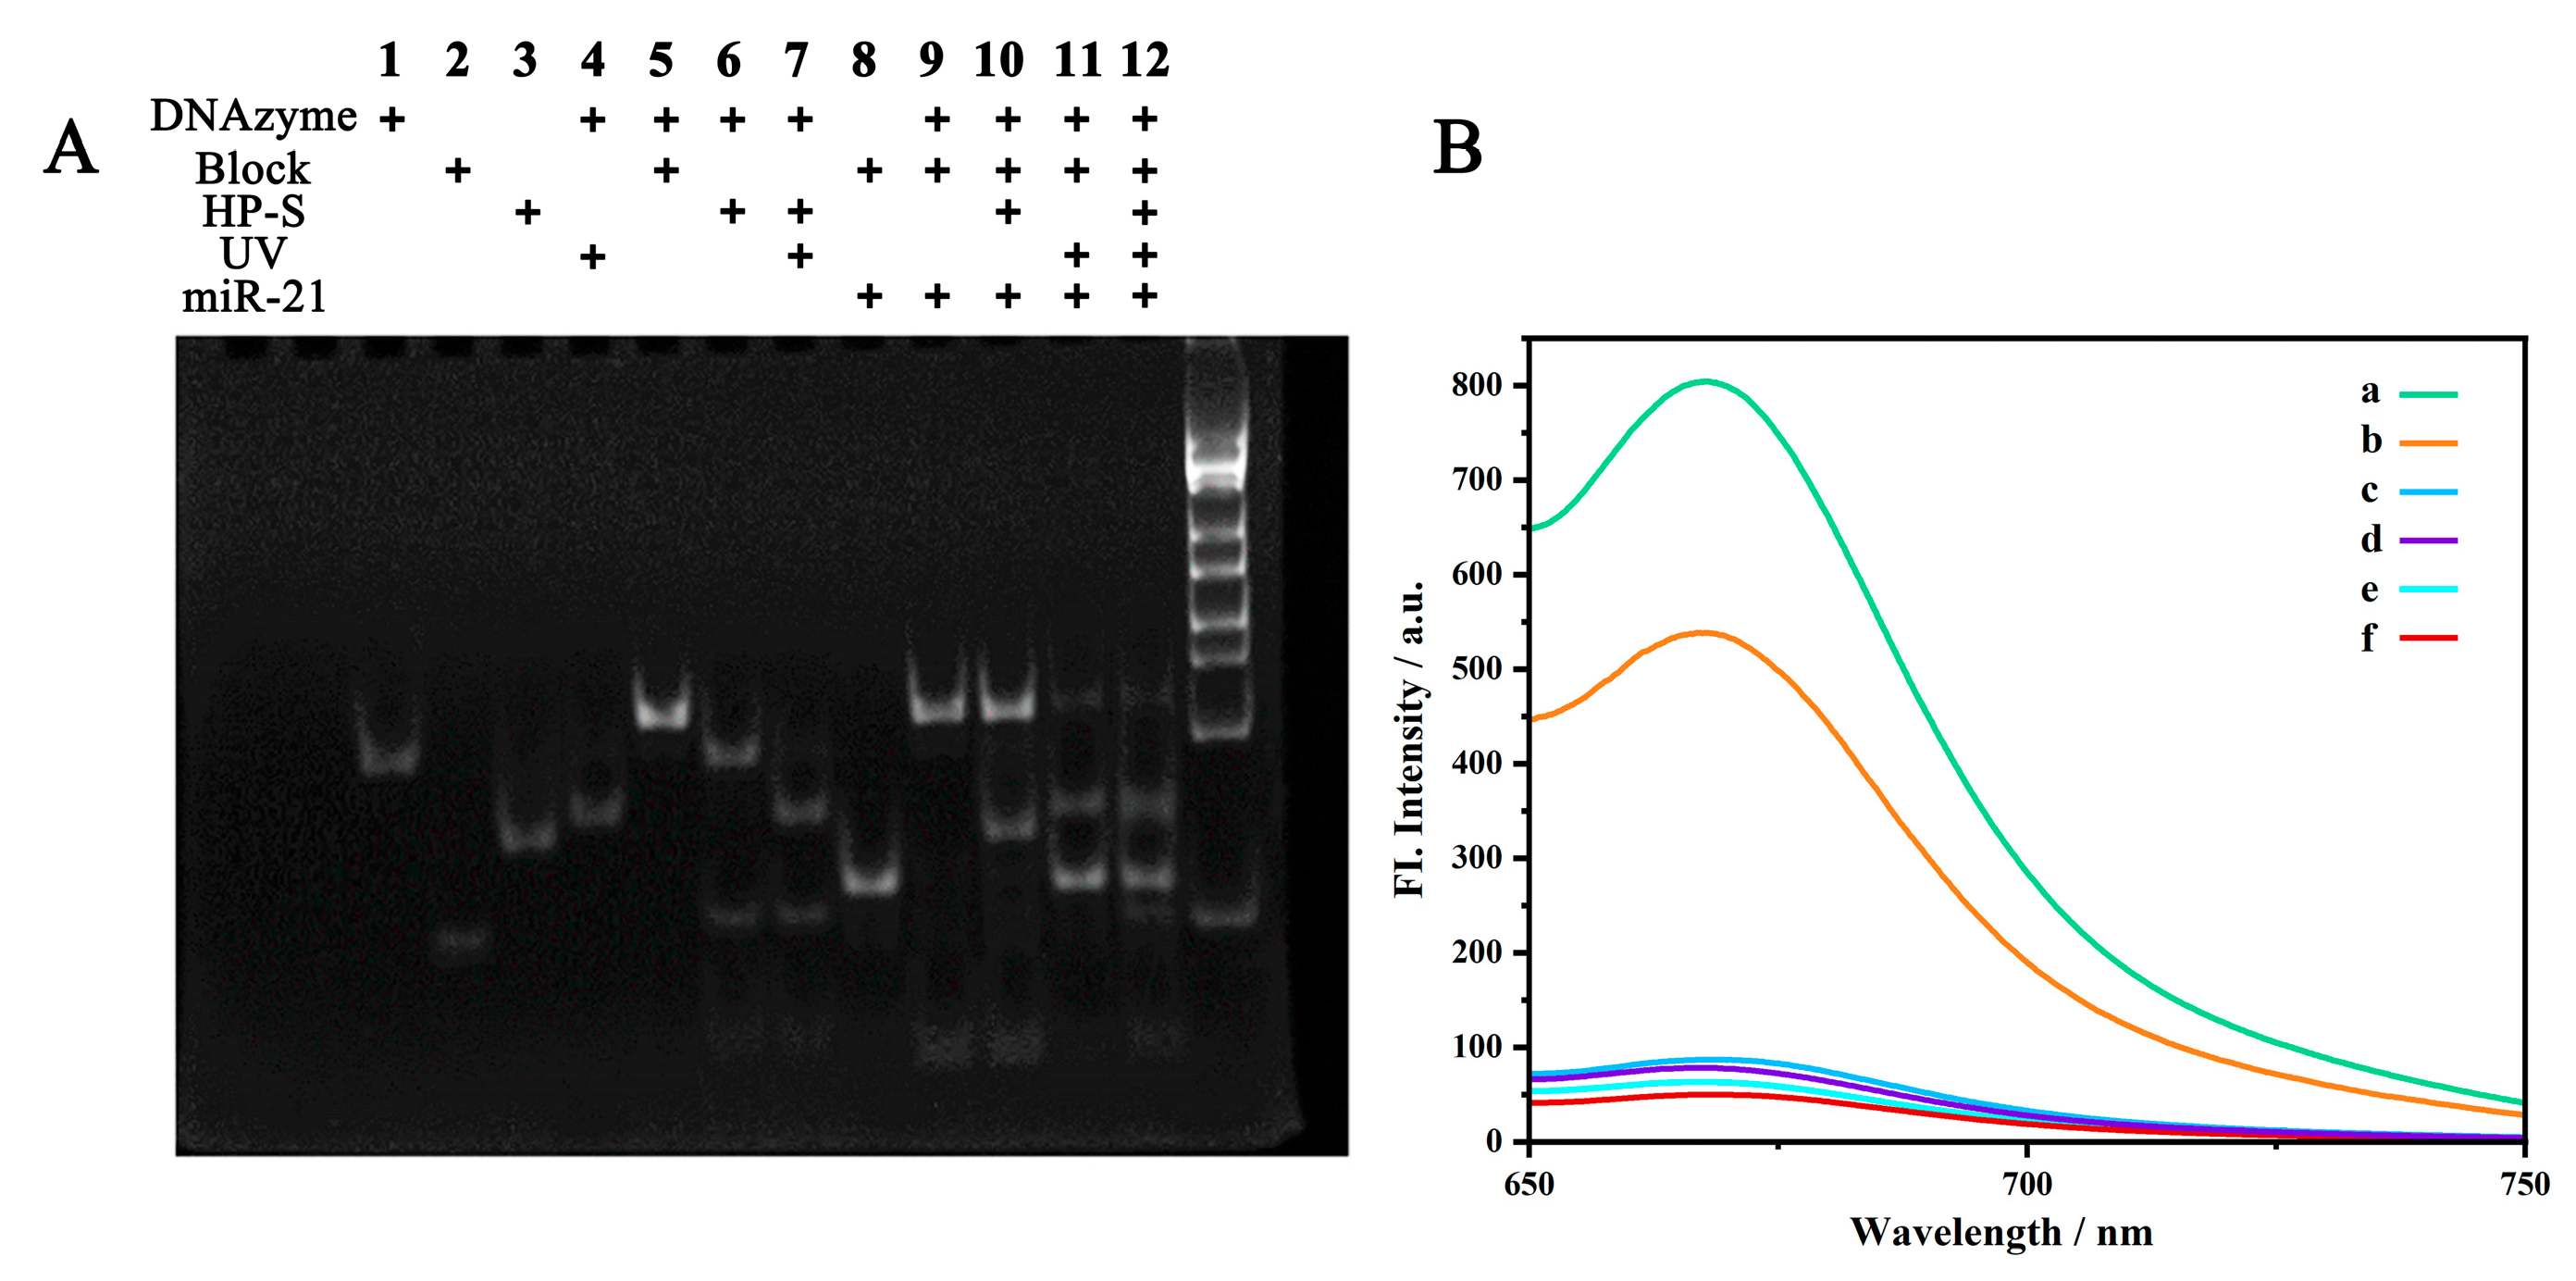
The assembly of nucleic acid probes and the reaction mechanism of UTD were verified through gel electrophoresis experiments (Figure 2A). A locked DNAzyme was formed by hybridizing the DNAzyme chain with the blocking chain. A clear band appeared at a different position in lane 5 compared to lanes 1 and 2, indicating that the DNAzyme was blocked. The comparison between lane 11 and lanes 8 and 9 shows that after UV irradiation of the locked DNAzyme, the presence of target miRNA allows the blocking chain to hybridize with it and release the DNAzyme, as indicated by the results in lane 11. Lane 10 shows that introducing the target and substrate into the blocked DNAzyme without UV irradiation did not produce any additional bands, indicating that without UV irradiation, the blocking chain does not hybridize with the target. When UV irradiation is applied and both the target and substrate are present, the comparison between lane 12 and lanes 7 and 11 indicates that the DNAzyme is released, and the substrate is successfully cleaved. The reaction mechanism was further verified through fluorescence experiments. As shown in Figure 2B, when the DNAzyme-blocking chain, miR-21, and substrate chain were added, the fluorescence signal was weak, indicating that the DNAzyme was completely blocked; when the DNAzyme-blocking chain was exposed to UV irradiation and miR-21 and the substrate chain were added, the fluorescence signal (b) significantly increased 7.3 times the background signal (d), indicating successful cleavage of the PC-linker bond by UV irradiation, allowing the target miR-21 to hybridize with the blocking chain, release the DNAzyme, and cleave the substrate chain; with the assistance of Mn2+ (a), the fluorescence signal reached its highest value (10.6 times the background signal). However, the absent of miR-21 or UV irradiation keeps the DNAzyme blocked (c, e), resulting in a signal that approximates to background intensity. These results indicate that the UTD biocircuit can sensitively detect miR-21.

3.3. Characterization of hMNs and UTD@hMNs

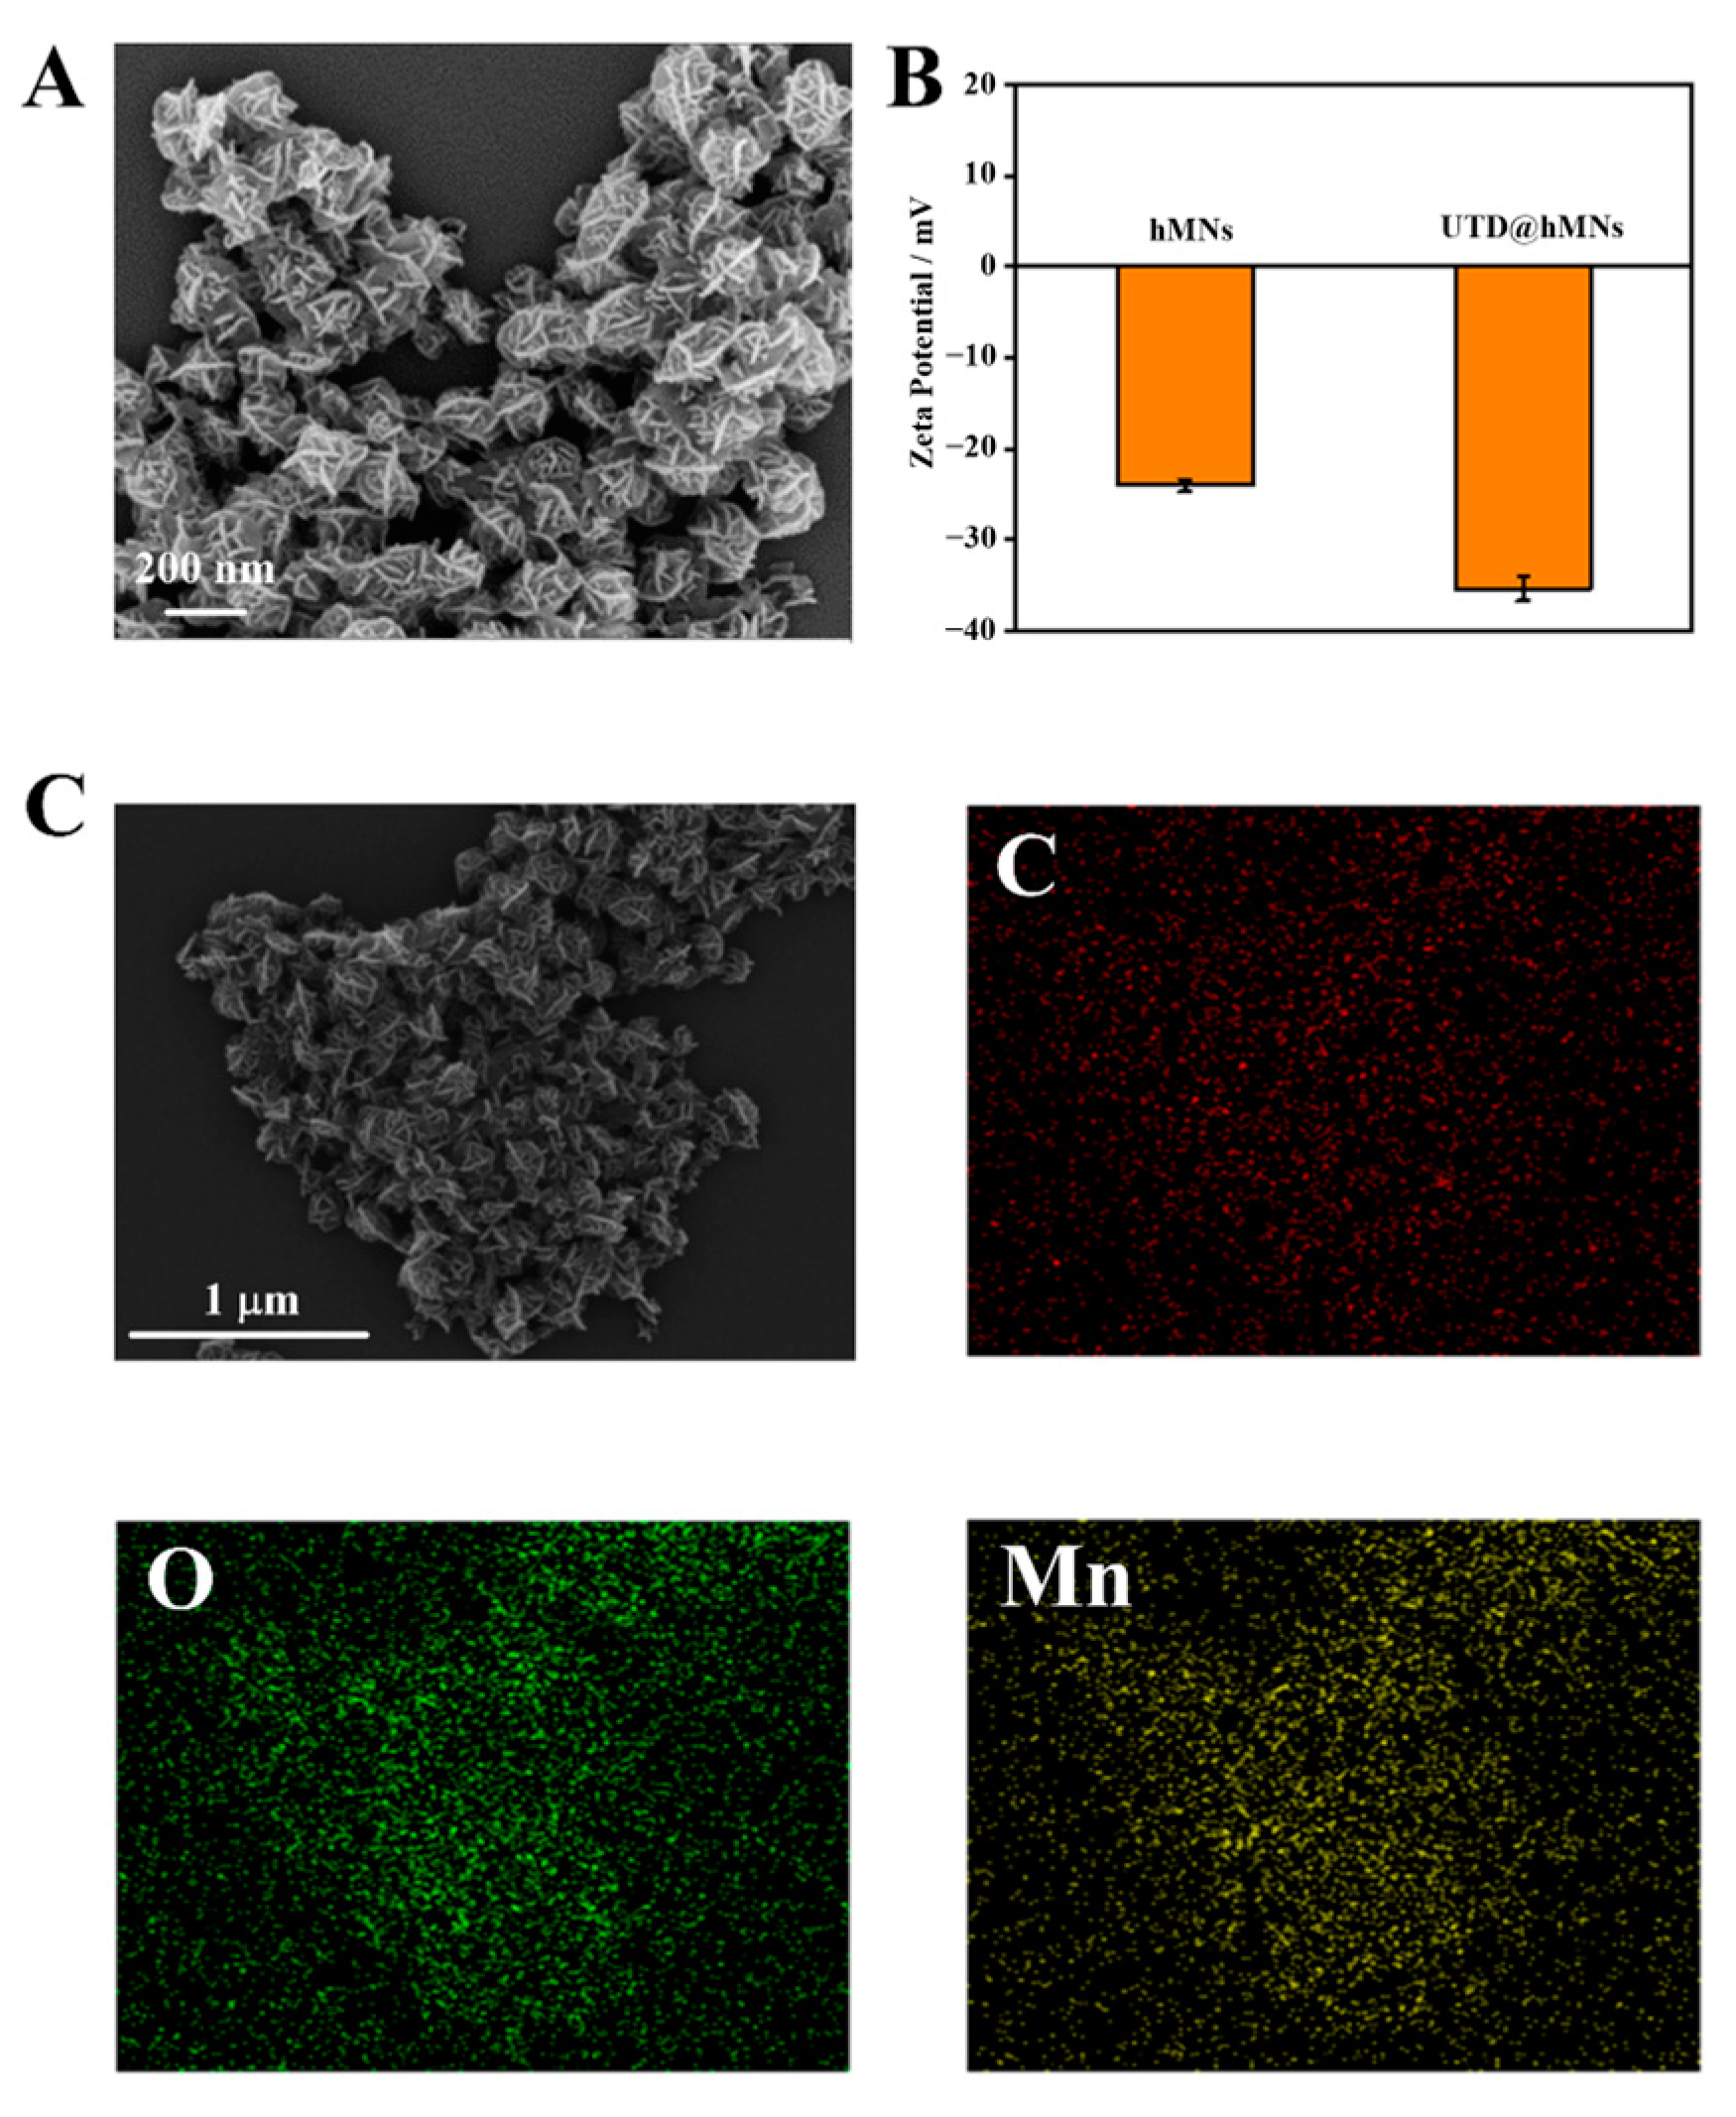
The hMNs were synthesized according to the method reported in the literature [25]. Firstly, SEM was used for morphological characterization, revealing uniformly distributed hMNs with a nanoflower morphology and an average diameter of approximately 150 nm (Figure 3A). The PXRD pattern of hMNs showed characteristic peaks at 2θ = 12.3, 24.8, 36.7, and 65.7, corresponding to the (001), (002), (100), and (110) crystal planes of manganese dioxide (JCPDS 42-1317) (Figure S1A) [26]. The XPS spectrum exhibited two characteristic spin–orbit peaks of tetravalent Mn(IV) 2p1/2 and Mn(IV) 2p3/2 at 654.2 and 642.5 eV, respectively, confirming the successful synthesis of hMNs (Figure S1B). DLS characterization indicated that the hydrodynamic diameter of hMNs is approximately 200 nm (Figure S1D). Subsequently, the construction of the UTD@hMN nanodevices was validated. Compared to hMNs (−24.0 mV), the reduced Zeta potential of UTD@hMNs (−35.4 mV) confirmed effective nucleic acid probes loading (Figure 3B). SEM imaging along with elemental mapping (Figure 3C) showed an overlapping region of distribution among C, O, and Mn, confirming that the nucleic acid probes that contain the C element were loaded on the hMNs. The resistance of the UTD@hMN nanodevices to nuclease attack was verified by incubation with DNase I, mimicking intracellular physiological conditions. In the presence of DNase I, the fluorescence of Cy5/BHQ2-labeled HP-S gradually increased over time. In contrast, when Cy5/BHQ2-labeled HP-S was loaded onto hMNs, no significant increase in fluorescence was observed, even after prolonged incubation (2 h), indicating that hMNs provide significant protection against nuclease degradation, playing an important role in delaying nuclease degradation (Figure S1C). The loading efficiency was determined using a Cy5-HP-S fluorescent chain. After incubation with hMNs, the Cy5-HP-S was centrifuged, and the fluorescence intensity of the supernatant was measured. The results showed that the fluorescence signal gradually decreased as the concentration of hMNs increased. Compare with the blank group, 77.5% of probes were loaded onto hMNs at a concentration of 100 μg/mL, indicating successful loading of the probe onto hMNs (Figure S2).

3.4. miRNA Detection In Vitro

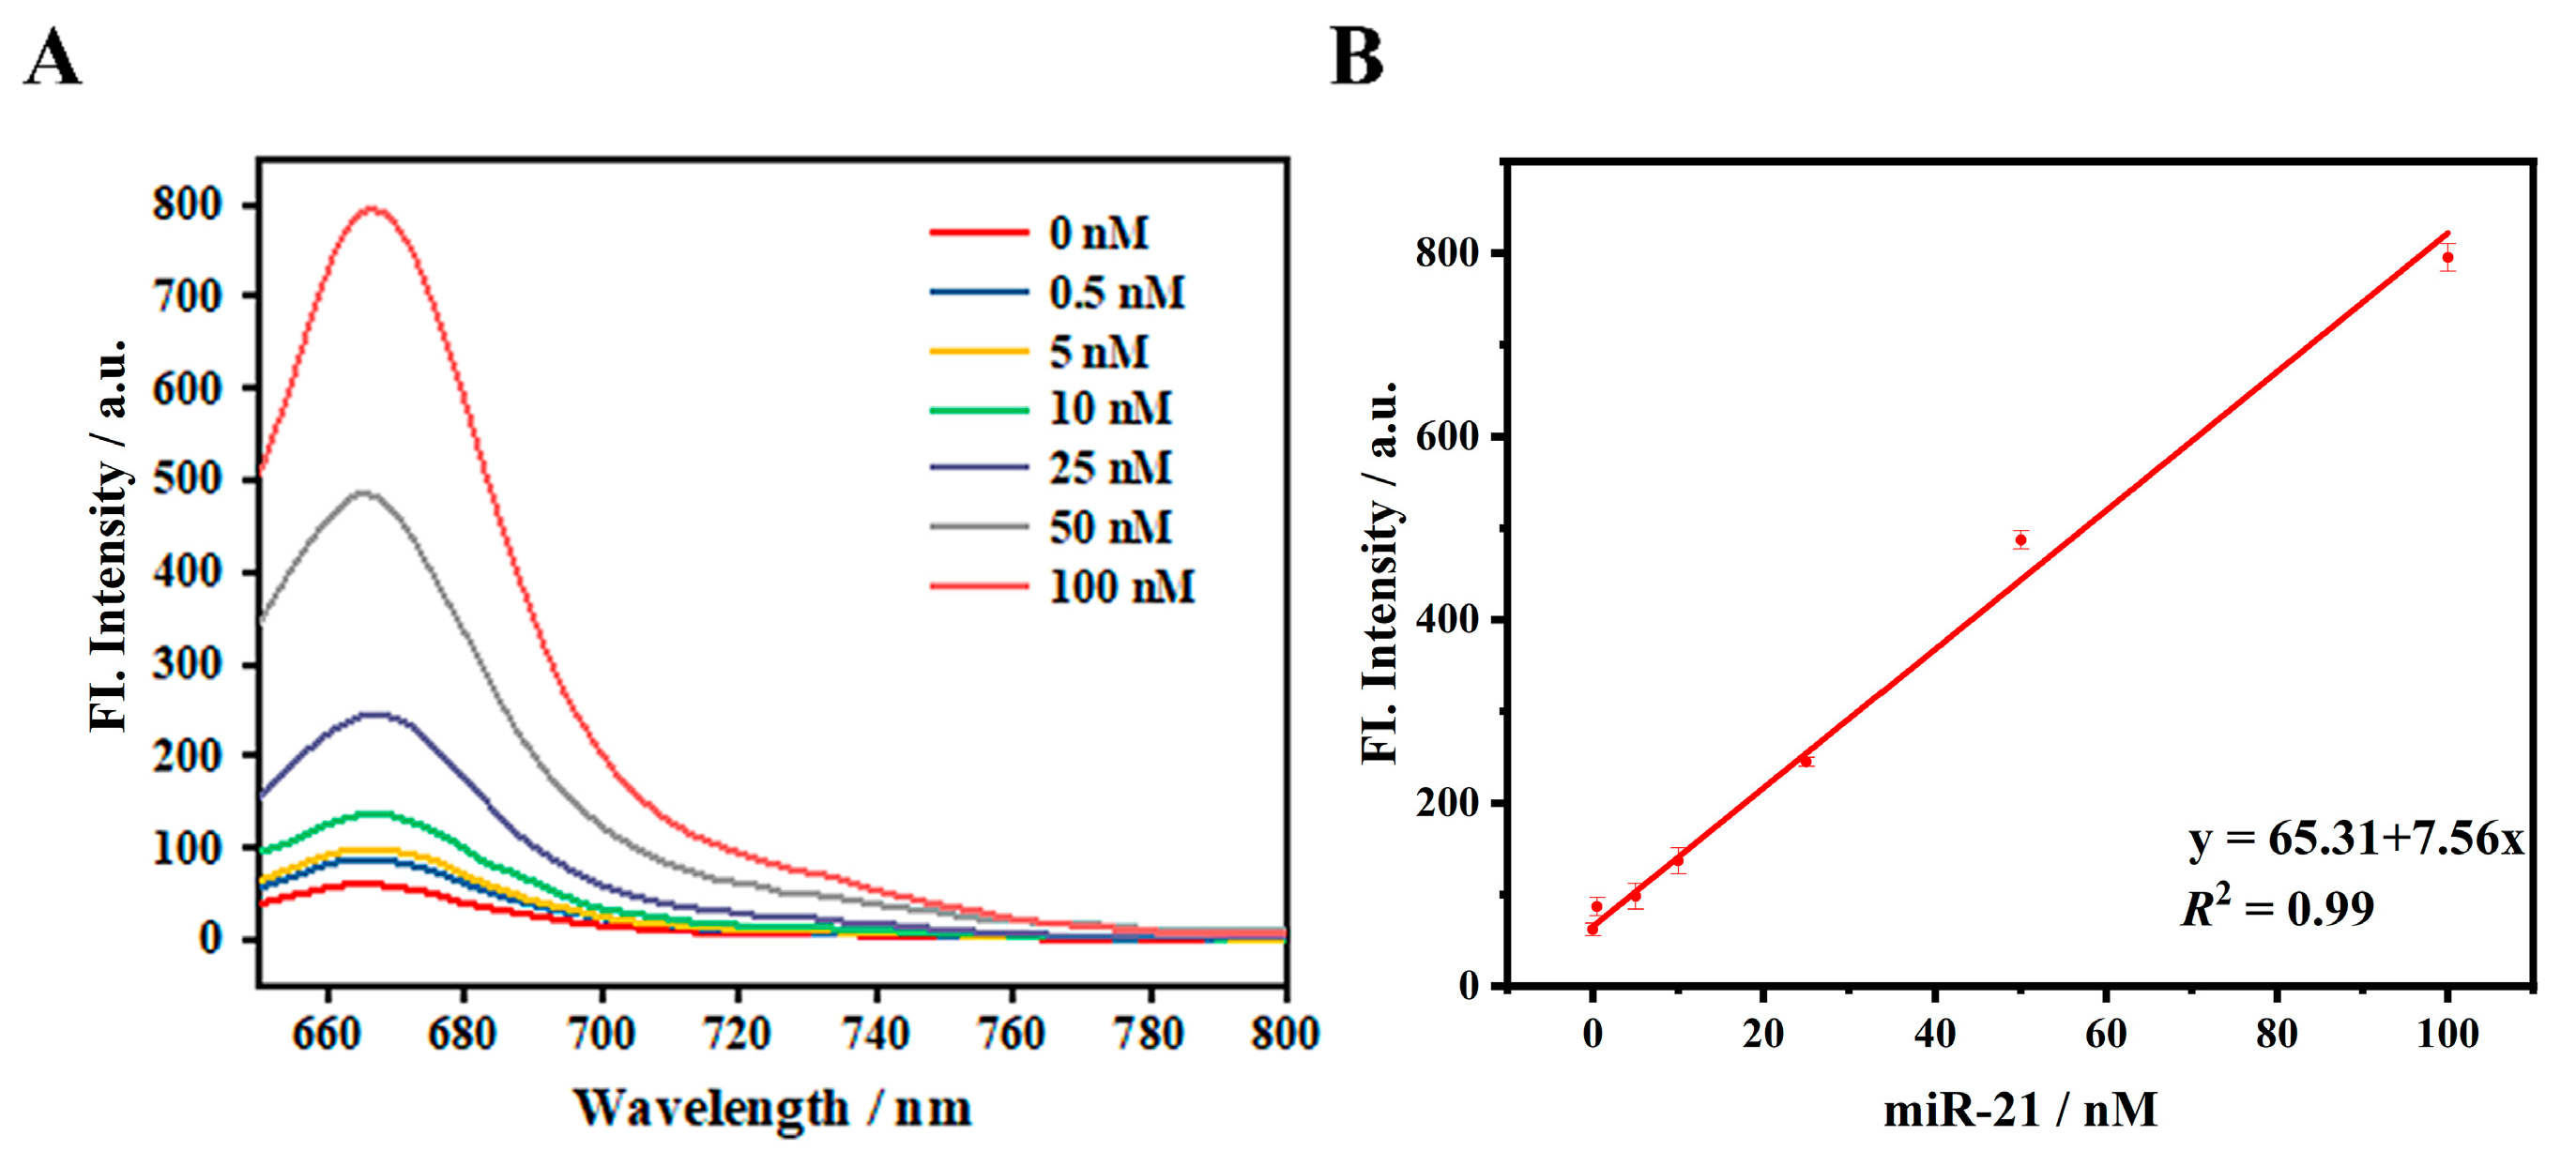
The analytical performance of the UTD@hMN nanodevices for detecting miR-21 in vitro was studied. As shown in Figure 4A, the fluorescence intensity increased with an increasing miR-21 concentration (0.5 nM to 100 nM). Within the range of 0.5 nM to 100 nM, there is a good linear relationship between fluorescence intensity and miR-21 concentration, with a linear regression equation of F = 7.56 c + 65.31 (R2 = 0.99), where F represents the fluorescence intensity, and c represents the miR-21 concentration (Figure 4B). The LOD value is 260 pM (S/N = 3).
Good specificity is also a necessary condition to ensure the analytical performance of the UTD@hMN nanodevices. To study the specificity of the UTD@hMN nanodevices for miR-21 detection, we used several tumor-associated miRNAs (miR-155 and miR-205) and mismatched miRNAs with single-base mismatch (mis-1), double-base mismatch (mis-2), and triple-base mismatch (mis-3) nucleotides for the investigation. As shown in Figure S3, only the experimental group involving miR-21 produced a significantly enhanced fluorescence signal, while the fluorescence signals of other individual interfering miRNAs were negligible and close to that of the blank. The interference values from miR-205, miR-155, mis-1, mis-2, and mis-3 for detecting miR-21 were calculated to be 0.16, 0.24, 0.40, 0.27, and 0.19, respectively. These results indicate that the UTD@hMN nanodevices has reliable specificity in distinguishing target miR-21 from other interfering miRNAs.

3.5. miRNA Imaging In Vivo

Prior to live-cell imaging, the cytotoxicity of hMNs at different concentrations was determined using the MTT assay. It was observed that even when the concentration of the nanomaterial reached 100 μg mL−1, the cell viability remained above 80% (Figure S4). Additionally, the potential damage caused by UV light exposure was verified. The results indicated that the UV light conditions used in this experiment had no negative impact on the cells throughout the detection process, and more than 95% of the cells maintained their viability even after 15 min of irradiation (Figure S5). These findings demonstrate that the nanocarrier hMNs used in this chapter and the UV light treatment do not significantly affect cell activity and exhibit good biocompatibility.
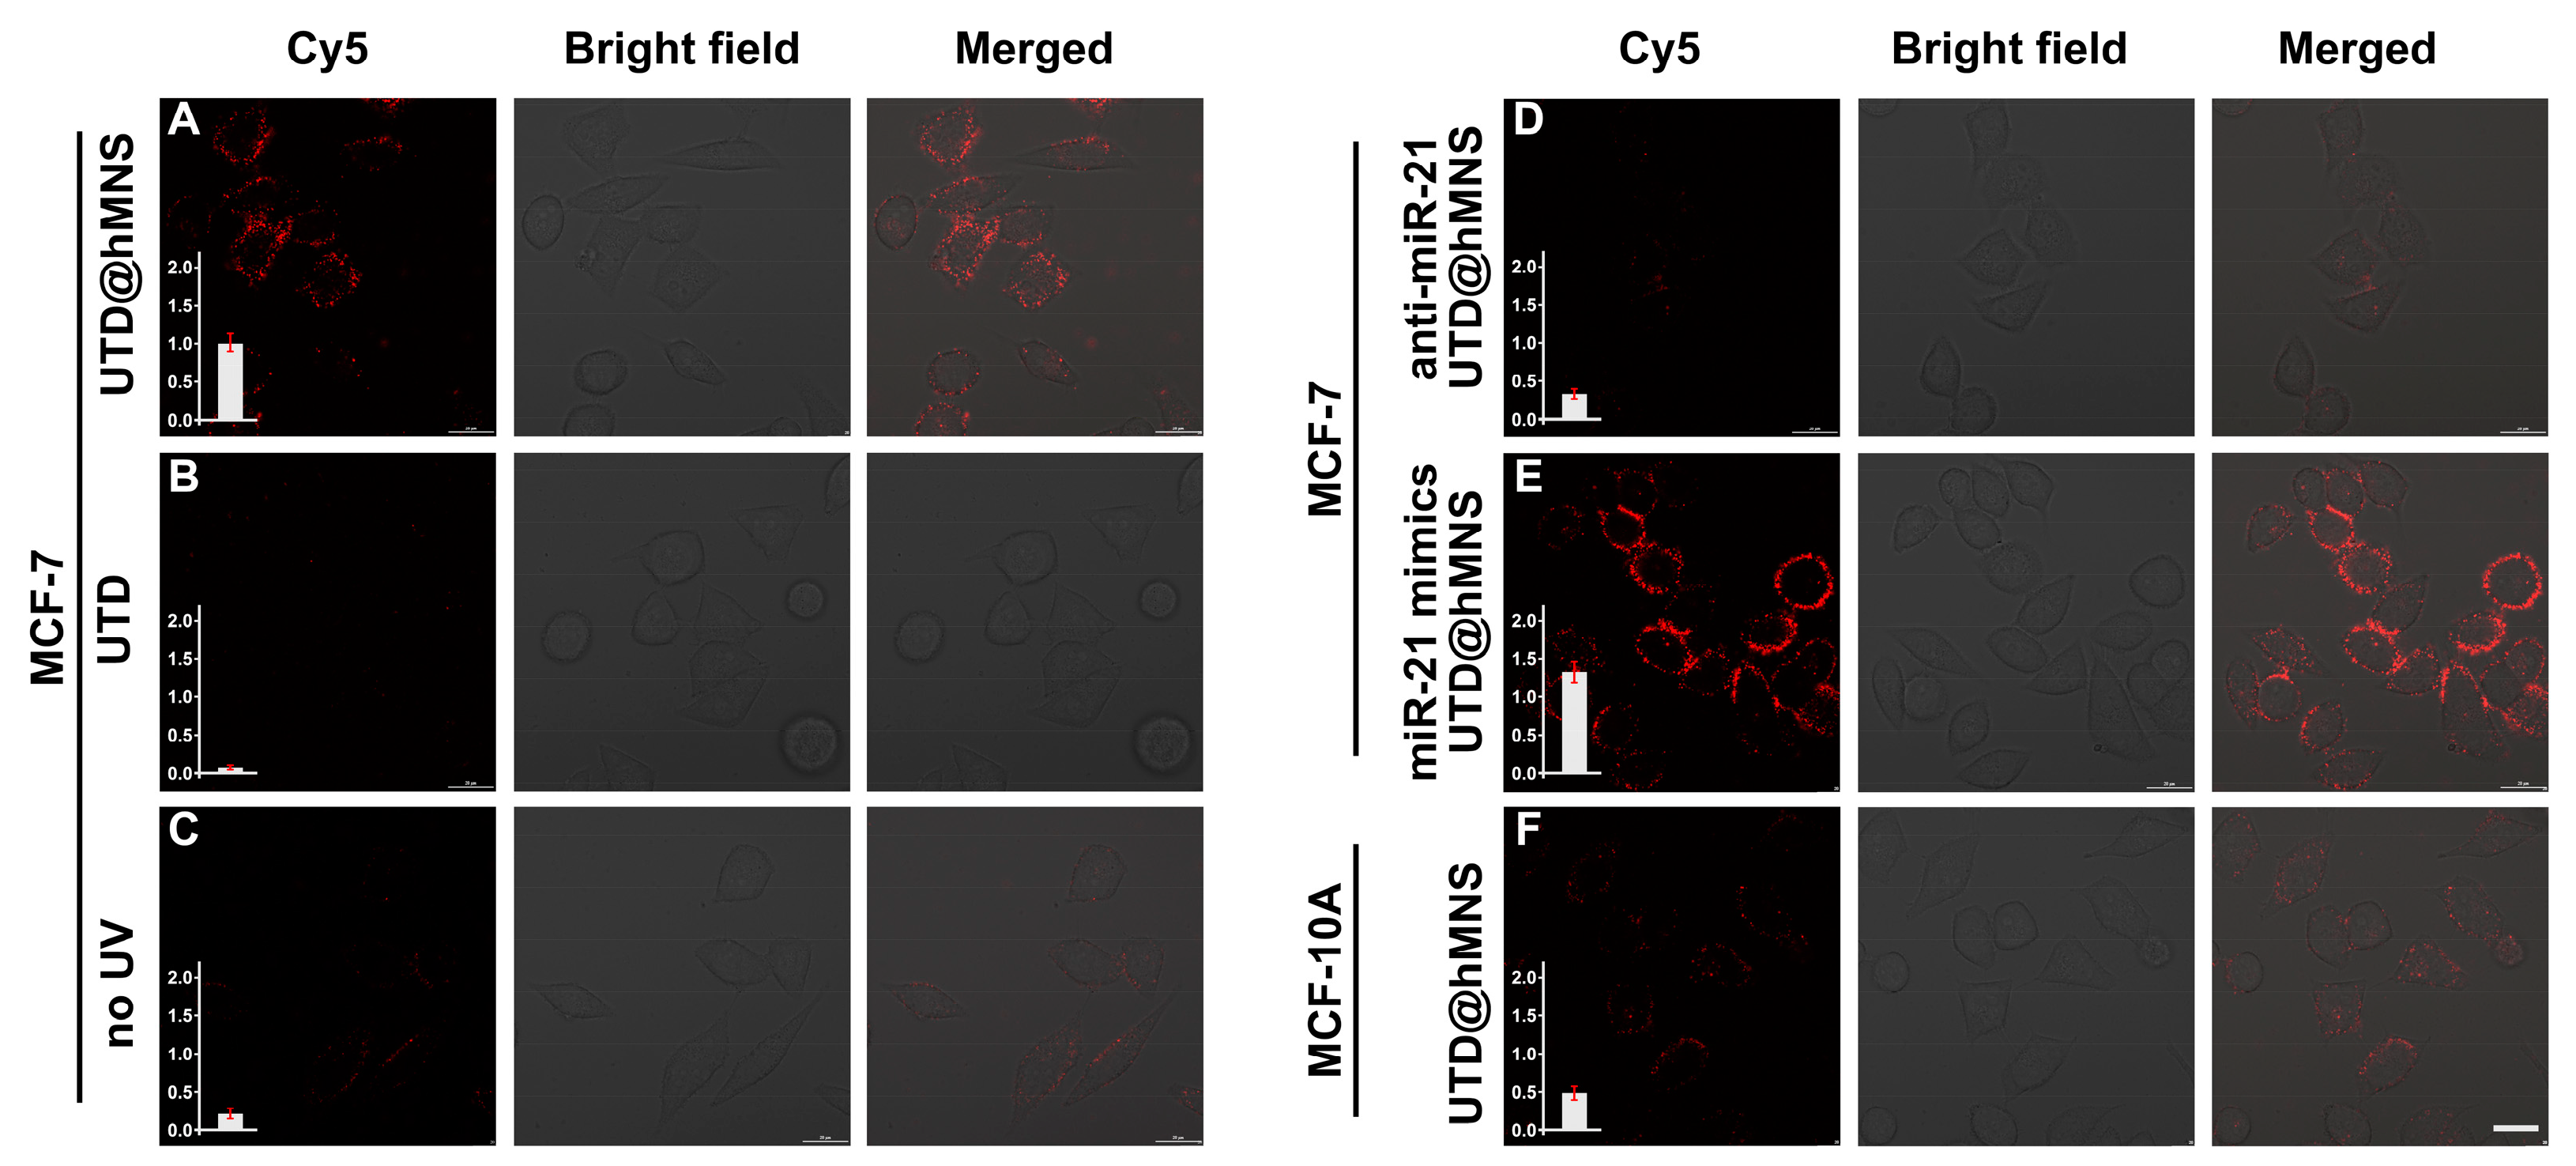
After demonstrating the good performance of the UTD@hMN nanodevices for the in vitro analysis of miR-21, we further verifies whether the system is effective for imaging target miRNAs in living cells, specifically using MCF-7 breast cancer cells (high expression of miR-21) and normal breast epithelial MCF-10A cells (low expression of miR-21) as validation models [27]. First, the UTD and UTD@hMN nanodevices were separately incubated with MCF-7 cells for 4 h (with intermediate UV irradiation). As shown in Figure 5A, the fluorescence signal generated by the incubation of the UTD@hMN nanodevices with cells was 10.1 times higher than that of the free UTD probe incubated cells (Figure 5B), indicating that hMNs effectively load UTD and deliver it into cells for target miRNA cell imaging. As UV irradiation is a crucial process that could release a toehold end from blocker strand, a control group without UV irradiation was conducted (Figure 5C). The fluorescence intensity of the withoutUV group is 0.2 times that of the UV group, suggesting a preferable block effect for spatiotemporal transfection. Next, the specificity of the fluorescence response of the UTD@hMN nanodevices to miR-21 in living cells was verified. miR-21 mimics and anti-miR-21 were transfected into MCF-7 cells using Lipo 3000 to simulate the states of upregulated and downregulated expression levels of miR-21 in MCF-7 cells, respectively, with untreated MCF-7 cells serving as controls. Compared to untreated MCF-7 cells, weaker fluorescence signals were observed in MCF-7 cells treated with anti-miR-21 (about 0.33 times of the untreated MCF-7 cells), while cells treated with miR-21 mimics produced the highest fluorescence signals (about 1.3 times that of the untreated MCF-7 cells). These results indicate that the fluorescence response of the UTD@hMN nanodevices in living cells is specific to miR-21. Furthermore, imaging the miR-21 by UTD@hMN nanodevices in MCF-10A cells was explored. As shown in Figure 5F, the fluorescence signal in MCF-10A cells was very weak, about 0.5 times of that in MCF-7 cells. The above results demonstrate that the UTD@hMN nanodevices can sensitively image miR-21 in tumor cells and effectively distinguish between tumor cells and normal cells.

4. Conclusions

To address the issues of false-positive signals and sensitivitymiRNA imaging in living cells, this work proposes a light-controlled switch strategy, combining nucleic acid probes with controllable photoactivation and catalytic cleavage protection, along with multifunctional nanocarriers to construct highly specific and sensitive miRNA imaging nanosensor. The UTD@hMN nanodevice has the following characteristics: (1) hMNs effectively transport the nucleic acid probe into cells, protecting it from degradation, promoting cellular uptake of the nucleic acid probe, and providing auxiliary factors for DNAzymes after intracellular degradation; (2) The design of both the nucleic acid probe and the nanocarrier effectively avoids false-positive signal issues. This strategy offers a new pathway for high-spatiotemporal-resolution imaging of miRNA within living cells.

Supplementary Materials

The following supporting information can be downloaded at: https://www.mdpi.com/article/10.3390/chemosensors13040123/s1, Figure S1: (A) PXRD pattern of hMNs; (B) XPS spectra of hMNs; (C) Fluorescence characterization of the stability of free HP-S and HP-S@ hMNs in DNase I; (D) Particle size distribution statistic of hMNs; Figure S2: Verification of the loading rate of hMNs (0–150 μg/mL) for Cy5- labeled HP-S probe; Figure S3: (A) Fluorescence signals of UTD under miR-21 and other interference miRNA (100 nM), data are represented as means ± SD (n = 3); Figure S4: Cell viability of MCF-7 cells incubated for 24 h with different concentrations of hMNs, data are represented as means ± SD (n = 3); Figure S5: Normalized Cell viability of MCF-7 cells after different times of UV irradiation, data are represented as means ± SD (n = 3); Figure S6: Paralleled confocal laser scanning microscopy (CLSM) images of MCF-7 cells and MCF-10A cells after incubation with UTD@hMNs.

Author Contributions

Conceptualization, Y.Z. (Yanfei Zhang); software, validation, and formal analysis, Y.Z. (Yiling Zhang); investigation and data curation, Y.Z. (Yanfei Zhang), Y.Z. (Yiling Zhang) and R.O.; writing—original draft preparation, Y.Z. (Yanfei Zhang); writing—review and editing, supervision, and funding acquisition, Z.D. and S.-Y.L.; All authors have read and agreed to the published version of the manuscript.

Funding

This research was funded by the National Natural Science Foundation of China (22274169 and 22474161), the Guangdong Basic and Applied Basic Research Foundation (2024A1515030160), the Science and Technology Program of Guangzhou City (2023B03J1380), the National Key Research and Development Program of China (2022YFE0201800), the Shenzhen Science and Technology Innovation Commission (GJHZ20210705142200001) the Guangdong Science and Technology Plan Project Grant (2020B1212060077), and the Fundamental Research Funds for the Central Universities, Sun Yat-sen University (24xkjc025).

Institutional Review Board Statement

Not applicable.

Informed Consent Statement

Not applicable.

Data Availability Statement

Data are contained within the article.

Conflicts of Interest

The authors declare no conflicts of interest.

Abbreviations

The following abbreviations are used in this manuscript:
UTDUV-triggered DNAzyme
hMNshoneycomb MnO2 nanoflowers
CLSMconfocal laser scanning microscopy

References

  1. You, X.; He, R.; Liu, S.-Y.; Dai, Z. Advances in fluorescence imaging of RNAs in living cells based on functional nucleic acid probes. Biomed. Anal. 2024, 1, 1–27. [Google Scholar]
  2. Armand-Labit, V.; Pradines, A. Circulating cell-free microRNAs as clinical cancer biomarkers. Biomol. Concepts 2017, 8, 61–81. [Google Scholar]
  3. Rupaimoole, R.; Calin, G.; Lopez-Berestein, G.; Sood, A. miRNA Deregulation in Cancer Cells and the Tumor Microenvironment. Cancer Discov. 2016, 6, 235–246. [Google Scholar]
  4. Hu, Z.; Zhang, J.; Li, Y.; Song, S.; Feng, C.; Wang, J.; Zhang, F.; Wang, J.; Liu, X. G-quadruplex-deficient precursor hairpin probes for ultra-low background dual-mode detection of miRNAs. Talanta 2023, 253, 123954. [Google Scholar]
  5. Yin, M.; Jiao, J.; Lu, L.; Hu, B.; Xue, L.; Dai, F.; Wang, X.; Wang, Z.; Wang, T.; Chen, Q. A simultaneous strategy with multiple-signal amplification and self-calibration for ultrasensitive assay of miRNA-21 based on 3D MNPs-IL-rGO-AuNPs. Biosens. Bioelectron. 2024, 249, 116009. [Google Scholar] [CrossRef]
  6. Siddika, T.; Heinemann, I.U. Bringing MicroRNAs to Light: Methods for MicroRNA Quantification and Visualization in Live Cells. Front. Bioeng. Biotechnol. 2021, 8, 619583. [Google Scholar]
  7. Zhou, M.; Teng, X.; Li, Y.; Deng, R.; Li, J. Cascade Transcription Amplification of RNA Aptamer for Ultrasensitive MicroRNA Detection. Anal. Chem. 2019, 91, 5295–5302. [Google Scholar]
  8. Zhou, Q.; Peng, J.; Liu, S.; Huang, T.; Luo, J.; Bai, L.; Xie, B.; Chen, J.; Li, C.; Chen, J. A target-triggered mimic nucleic acid enzyme enables versatile and sequence-independent biosensing. Biomed. Anal. 2024, 1, 28–35. [Google Scholar]
  9. Nie, K.; Jiang, Y.; Wang, N.; Wang, Y.; Li, D.; Zhan, L.; Huang, C.; Li, C. Programmable, Universal DNAzyme Amplifier Supporting Pancreatic Cancer-Related miRNAs Detection. Chemosensors 2022, 10, 276. [Google Scholar] [CrossRef]
  10. Wang, M.; Liu, Z.; Liu, C.; He, W.; Qin, D.; You, M. DNAzyme-based ultrasensitive immunoassay: Recent advances and emerging trends. Biosens. Bioelectron. 2024, 251, 116122. [Google Scholar]
  11. Shi, C.; Yang, D.; Ma, X.; Pan, L.; Shao, Y.; Arya, G.; Ke, Y.; Zhang, C.; Wang, F.; Zuo, X.; et al. A Programmable DNAzyme for the Sensitive Detection of Nucleic Acids. Angew. Chem. Int. Ed. 2024, 63, e202320179. [Google Scholar]
  12. Zhou, W.; Liang, W.; Li, D.; Yuan, R.; Xiang, Y. Dual-color encoded DNAzyme nanostructures for multiplexed detection of intracellular metal ions in living cells. Biosens. Bioelectron. 2016, 85, 573–579. [Google Scholar] [PubMed]
  13. Zhou, Y.; Ma, W.; Sun, R.; Liu, B.; Zhang, X.; Yang, H. Upconverting nanoparticles based nanodevice for DNAzymes amplified miRNAs detection and artificially controlled chemo-gene therapy. Biosens. Bioelectron. 2022, 214, 114549. [Google Scholar]
  14. Chen, L.; Liu, Y.; Guo, W.; Liu, Z. Light responsive nucleic acid for biomedical application. Exploration 2022, 2, 20210099. [Google Scholar]
  15. Huang, S.; Zhu, J.-J. Linkage Pathways of DNA–Nanoparticle Conjugates and Biological Applications. Chemosensors 2023, 11, 444. [Google Scholar]
  16. Zhou, H.; Jiang, Y.; Zhao, W.; Zhang, S. Light-Activated Nanodevice for On-Demand Imaging of miRNA in Living Cells via Logic Assembly. ACS Appl. Mater. Interfaces 2022, 14, 13070–13078. [Google Scholar]
  17. Qiu, L.; Wu, C.; You, M.; Han, D.; Chen, T.; Zhu, G.; Jiang, J.; Yu, R.; Tan, W. A Targeted, Self-Delivered, and Photocontrolled Molecular Beacon for mRNA Detection in Living Cells. J. Am. Chem. Soc. 2013, 135, 12952–12955. [Google Scholar]
  18. Zhao, J.; Gao, J.; Xue, W.; Di, Z.; Xing, H.; Lu, Y.; Li, L. Upconversion Luminescence-Activated DNA Nanodevice for ATP Sensing in Living Cells. J. Am. Chem. Soc. 2018, 140, 578–581. [Google Scholar]
  19. Wang, W.; Satyavolu, N.S.R.; Wu, Z.; Zhang, J.-R.; Zhu, J.-J.; Lu, Y. Near-Infrared Photothermally Activated DNAzyme-Gold Nanoshells for Imaging Metal Ions in Living Cells. Angew. Chem. Int. Ed. 2017, 56, 6798–6802. [Google Scholar]
  20. Stafford, M.; Willoughby, C.; Walsh, C.; McKenna, D. Prognostic value of miR-21 for prostate cancer: A systematic review and meta-analysis. Biosci. Rep. 2022, 42, SR20211972. [Google Scholar]
  21. Hu, M.; Qiu, Z.; Bi, Z.; Tian, T.; Jiang, Y.; Zhou, X. Photocontrolled crRNA activation enables robust CRISPR-Cas12a diagnostics. Proc. Natl. Acad. Sci. USA 2022, 119, e2202034119. [Google Scholar] [PubMed]
  22. Zhao, J.; Di, Z.; Li, L. Spatiotemporally Selective Molecular Imaging via Upconversion Luminescence-Controlled, DNA-Based Biosensor Technology. Angew. Chem. (Int. Ed. Engl.) 2022, 61, e202204277. [Google Scholar] [PubMed]
  23. Chen, H.; He, J.; Zhang, C.; He, H. Self-Assembly of Novel Mesoporous Manganese Oxide Nanostructures and Their Application in Oxidative Decomposition of Formaldehyde. J. Phys. Chem. C 2007, 111, 18033–18038. [Google Scholar]
  24. Xue, H.; Yu, M.; He, K.; Liu, Y.; Cao, Y.; Shui, Y.; Li, J.; Farooq, M.; Wang, L. A novel colorimetric and fluorometric probe for biothiols based on MnO2 NFs-Rhodamine B system. Anal. Chim. Acta 2020, 1127, 39–48. [Google Scholar]
  25. Wei, J.; Wang, H.; Wu, Q.; Gong, X.; Ma, K.; Liu, X.; Wang, F. A Smart, Autocatalytic, DNAzyme Biocircuit for In Vivo, Amplified, MicroRNA Imaging. Angew. Chem. Int. Ed. 2020, 59, 5965–5971. [Google Scholar] [CrossRef]
  26. Fan, Z.; Yan, J.; Wei, T.; Zhi, L.; Ning, G.; Li, T.; Wei, F. Asymmetric Supercapacitors Based on Graphene/MnO2 and Activated Carbon Nanofiber Electrodes with High Power and Energy Density. Adv. Funct. Mater. 2011, 21, 2366–2375. [Google Scholar]
  27. Rama, A.R.; Lara, P.; Mesas, C.; Quiñonero, F.; Vélez, C.; Melguizo, C.; Prados, J. Circular Sponge against miR-21 Enhances the Antitumor Activity of Doxorubicin against Breast Cancer Cells. Int. J. Mol. Sci. 2022, 23, 14803. [Google Scholar] [CrossRef]
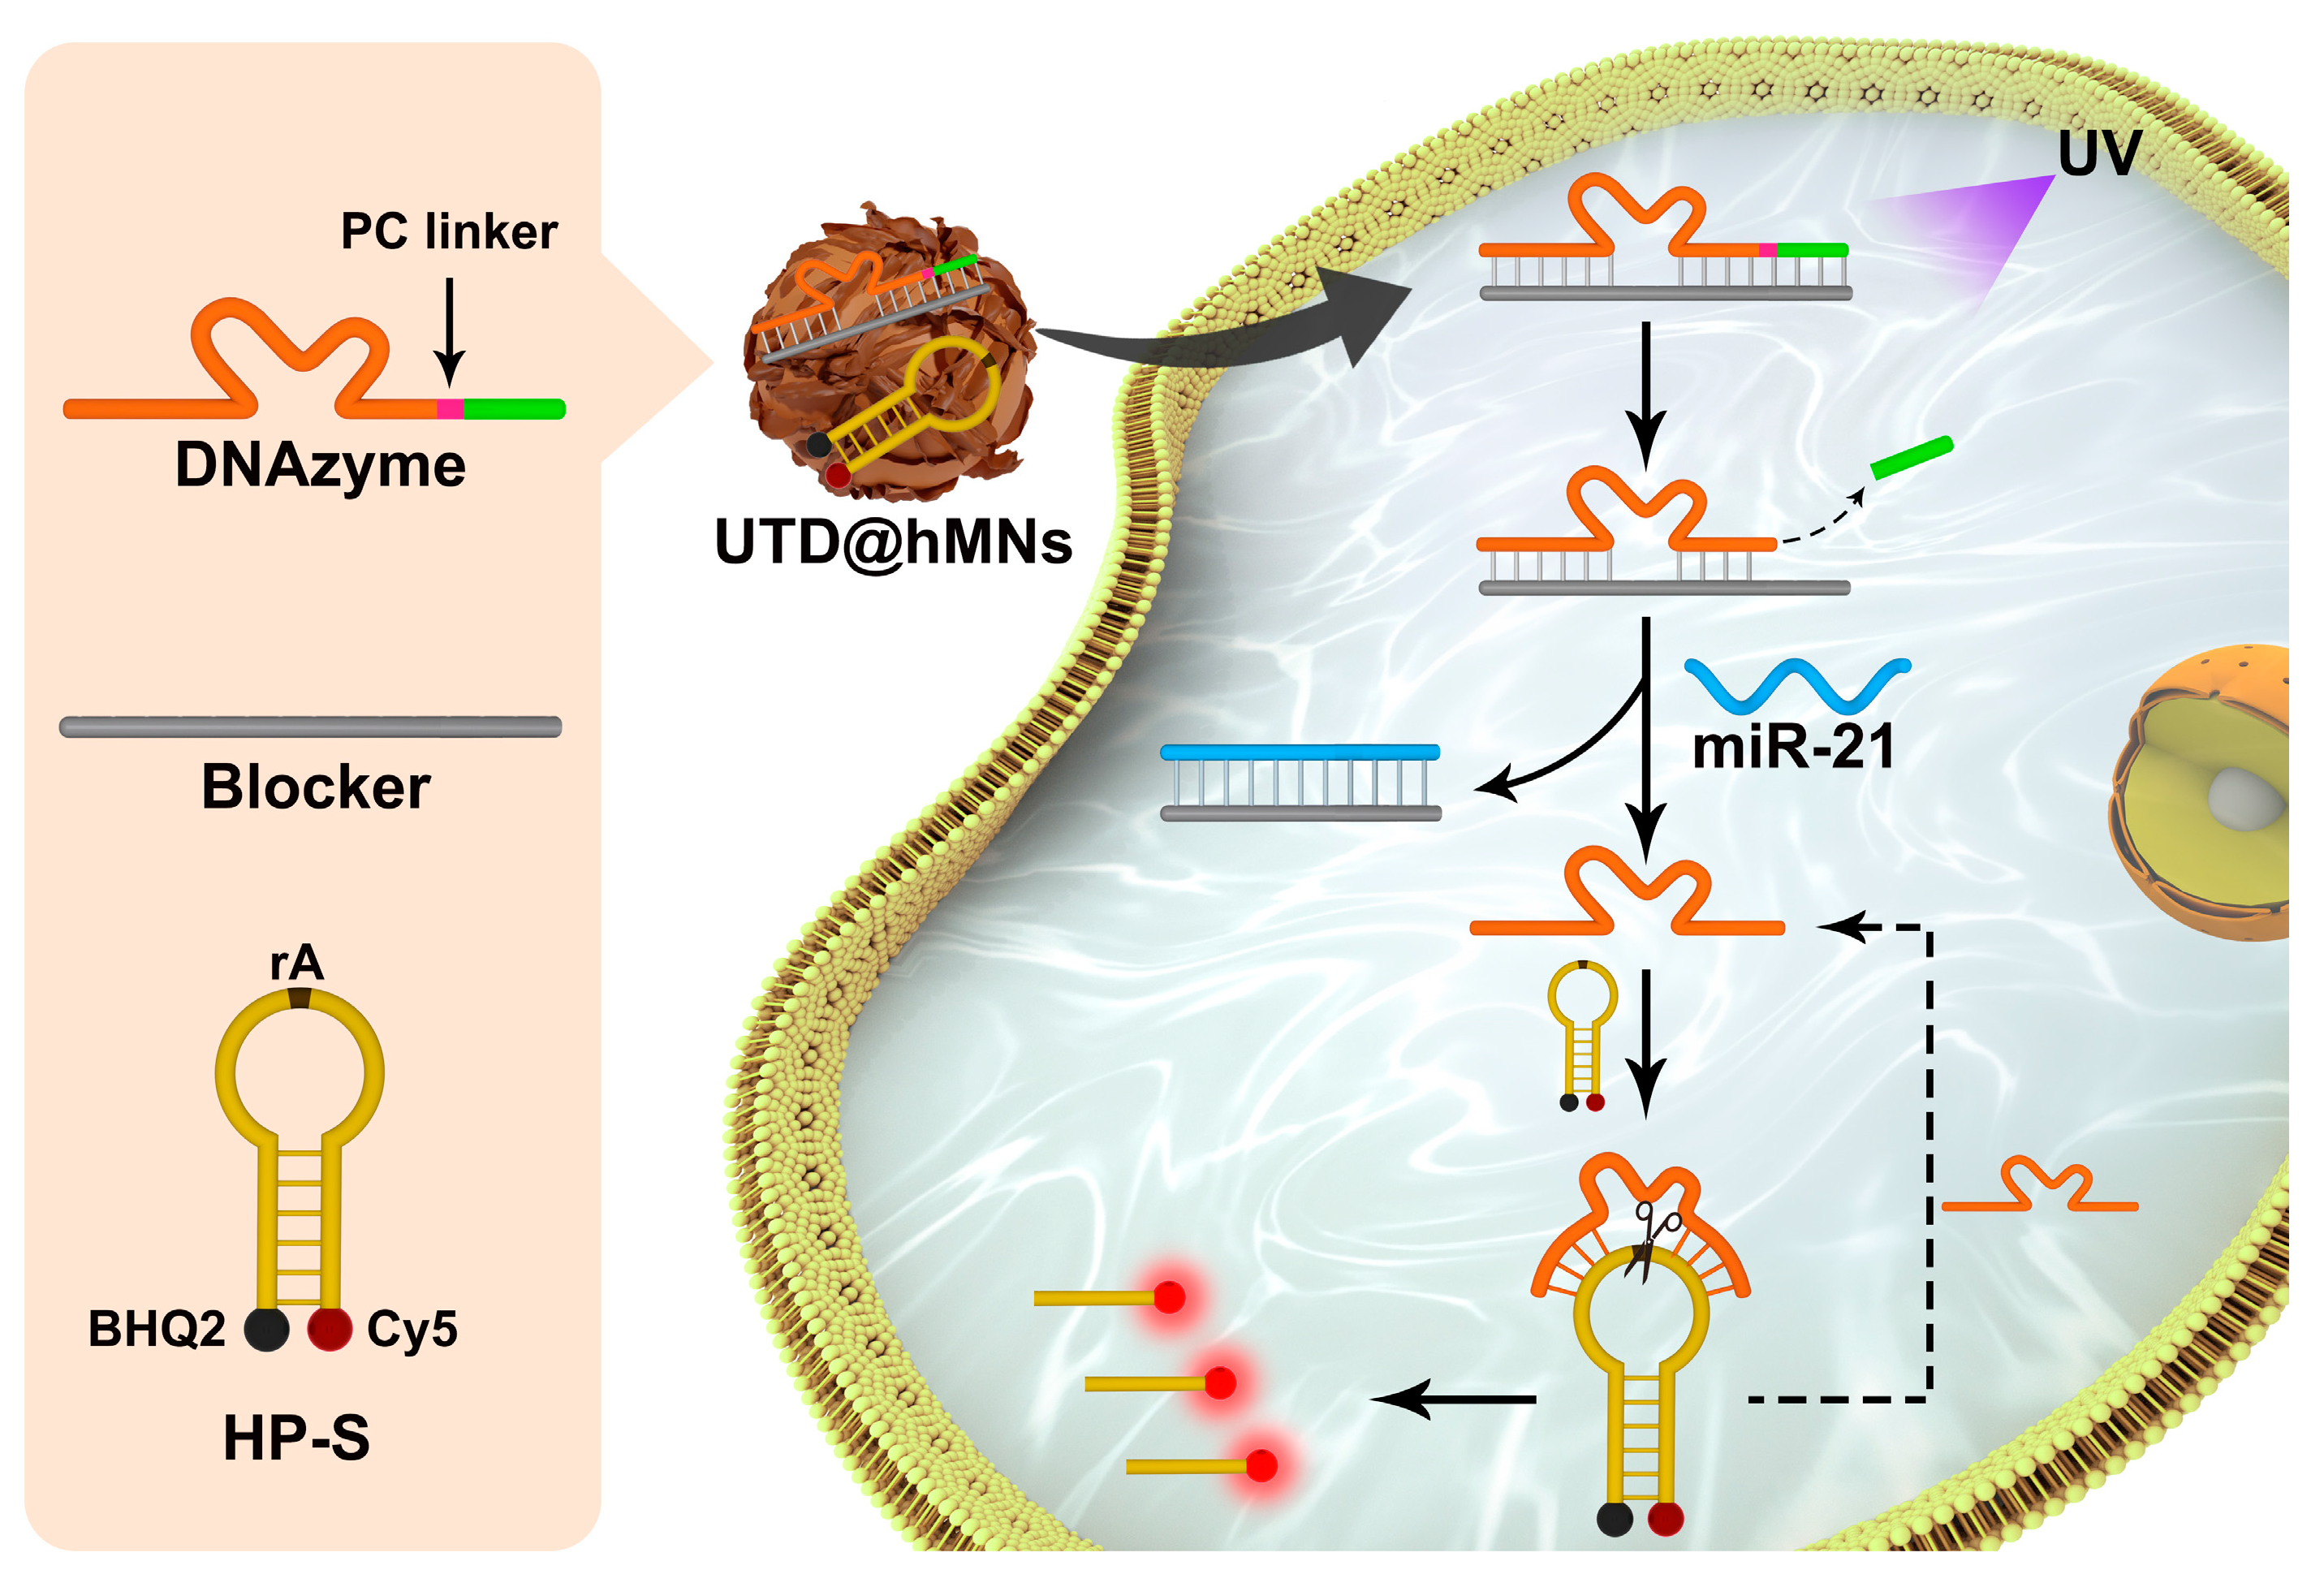
Figure 1. Principle of UV-triggered DNAzyme nanodevices.
Chemosensors 13 00123 g001
Figure 2. Gel electrophoresis results. (A) Lane 1: DNAzyme; lane 2: blocker; lane 3: HP-S; lane 4: DNAzyme + UV; lane 5: DNAzyme + blocker; lane 6: DNAzyme + HP-S; lane 7: DNAzyme + UV + HP-S; lane 8: miR-21 + blocker ; lane 9: DNAzyme + blocker + miR-21; lane 10: DNAzyme + blocker + miR-21 + HP-S; lane 11: DNAzyme + blocker + UV + miR-21; lane 12: DNAzyme + blocker + UV + miR-21 + HP-S. (B) Fluorescence response of UTD under different conditions: (a) DNAzyme + blocker + UV + miR-21 + HP-S + Mn2+; (b) DNAzyme + blocker + UV + miR-21 + HP-S; (c) DNAzyme + blocker + miR-21 + HP-S; (d) DNAzyme + blocker + UV + HP-S + Mn2+; (e) DNAzyme + blocker + UV + HP-S; (f) DNAzyme + blocker + HP-S (probe concentrations were 100 nM in all cases).
Chemosensors 13 00123 g002
Figure 3. (A) SEM image of hMNs; (B) Zeta potential of hMN nanocarriers and UTD@hMNs, with the data represented as means ± SDs (n = 3); (C) SEM images and the corresponding EDS elemental maps (C, O, and Mn elements) of hMNs.
Chemosensors 13 00123 g003
Figure 4. (A) Fluorescence spectra of UTD under different concentrations of miR-21. (B) Linear fitting curve of fluorescence intensity versus miR-21 concentration; data are represented as means ± SDs (n = 3).
Chemosensors 13 00123 g004
Figure 5. Confocal laser scanning microscopy (CLSM) images of MCF-7 cells after incubation with (A) UTD@hMNs, (B) UTD, (C) no UV irradiation, (D) anti-miR-21/UTD@hMNs, and (E) miR-21 mimics/UTD@hMNs. (F) CLSM image of MCF-10A cells after incubation with UTD@hMNs. Insets: normalized Cy5 intensity from Cy5 channels. Scale bar: 20 μm.
Chemosensors 13 00123 g005
Table 1. Sequences of nucleic acid probes used in UTD circuit construction.
StrandSequence (5′-3′)
DNAzyme (D)CTTATCAGAC/iPCLink/TGATGTTGATCTTCTCTTCTCCGAGCCGGTCGAAATAGTAGCTTA
blocker (B)AAGAGAAGATCAACATCAGTCTGATAAGCTA
HP-SBHQ2-ACGTAAAGCAAAGAAGCTACTAT/rA/GGAAGAGAAGACTAGCTTACCATGCTTTACGT-Cy5
Cy5-HP-SACGTAAAGCAAAGAAGCTACTAT/rA/GGAAGAGAAGACTAGCTTACCATGCTTTACGT-Cy5
mismatch-1 (mis-1)TAACTTATCAGACTGATGTTGA
mismatch-2 (mis-2)TAGCTTATCAGACTGATAATGA
mismatch-3 (mis-3)TAGCTTATCAGACTGATAAAGA
miR-205TCCTTCATTCCACCGGAGTCTG
miR-155TTAATGCTAATCGTGATAGGGG
anti-miR-21TCAACATCAGTCTGATAAGCTA
miR-21UAGCUUAUCAGACUGAUGUUGA
Disclaimer/Publisher’s Note: The statements, opinions and data contained in all publications are solely those of the individual author(s) and contributor(s) and not of MDPI and/or the editor(s). MDPI and/or the editor(s) disclaim responsibility for any injury to people or property resulting from any ideas, methods, instructions or products referred to in the content.