Article

Volatile Organic Components and MS-e-nose Profiles of Indonesian and Malaysian Palm Sugars from Different Plant Origins

by
Aldia Katherinatama
1,
Yonathan Asikin
1,2,*,
Ryo Amano
1,
Siti Hajar-Azhari
3,
David Yudianto
4,
Dhina Aprilia Nurani Widyahapsari
4,
I Wayan Rai Widarta
5,
Kensaku Takara
1,2 and
Koji Wada
1,2
1
Department of Bioscience and Biotechnology, Faculty of Agriculture, University of the Ryukyus, Okinawa 903-0213, Japan
2
United Graduate School of Agricultural Sciences, Kagoshima University, Kagoshima 890-0065, Japan
3
Department of Food Science, Faculty of Food Science and Technology, Universiti Putra Malaysia, Serdang 43400, Selangor, Malaysia
4
Department of Food Industry Quality Assurance, Politeknik AKA Bogor, Kota Bogor 16154, West Java, Indonesia
5
Study Program of Food Technology, Faculty of Agricultural Technology, Udayana University, Kabupaten Badung 80361, Bali, Indonesia
*
Author to whom correspondence should be addressed.
Chemosensors 2025, 13(5), 155; https://doi.org/10.3390/chemosensors13050155
Submission received: 31 March 2025 / Revised: 18 April 2025 / Accepted: 21 April 2025 / Published: 22 April 2025

Abstract

:
The volatile profiles of palm sugar, a traditional sweetener used in Southeast Asia, vary according to its geographic and botanical origin. This study investigated the volatile organic components (VOCs) of Indonesian and Malaysian palm sugars derived from Arenga pinnata, Nypa fruticans, and Cocos nucifera using solid-phase microextraction-GC-MS and MS-e-nose analyses. A total of 42 compounds were detected, including 12 Maillard reaction products, 10 esters, 8 alcohols, 5 ketones, 3 carboxylic acids, 3 phenols, and 1 aldehyde. The Indonesian palm (West Java) and nipa (Central Java) sugars contained VOCs of 39.45 and 38.49 µg/100 g palm sugar, respectively, whereas the Balinese palm and Malaysian coconut sugars contained significantly lower volatiles (18.56 and 11.41 µg/100 g, respectively). Hierarchical clustering and principal component analysis (PCA) revealed diverse composition profiles, with palm-derived sugars rich in pyrazines, nipa sugars dominated by carboxylic acids, and coconut sugars characterized by alcohols such as [R,R]-2,3-butanediol. PCA of the MS-e-nose analysis confirmed these variations, with PAR scaling enhancing their differentiation and providing valuable loading plots, including ion masses m/z 43 and 45 (hydrocarbons or carboxylic acids), m/z 60 (acetic acid), and m/z 108 (dimethyl-pyrazines). These findings highlight the influence of geography and plant origin on palm sugar VOCs, which may affect their sensory attributes.

1. Introduction

Palm sugar is a natural sweetener derived from the sap of various palm species, holding significant cultural, economic, and nutritional value in Southeast Asia [1]. Among the major producers, Indonesia and Malaysia are particularly notable for their diverse production practices and use of different palm species such as palm (Arenga pinnata), nipa (Nypa fruticans), coconut (Cocos nucifera), and siwalan (Borassus flabellifer) [2,3]. The distinctive plant origins, traditional processing methods, and climatic conditions in these countries contribute to the diverse chemical compositions and flavor characteristics of their palm sugars, making them an intriguing subject for scientific exploration. Palm sugar is produced by collecting sap from the inflorescence of palm trees and boiling it to concentrate the sugars [4,5]. This process leads to the formation of various palm sugar products, including liquid syrups, solid pastes, and powders, each with unique textural and sensory attributes [6]. Unlike refined sugars, palm sugar is classified as an unrefined non-centrifugal sugar, meaning that it undergoes minimal processing with no centrifugation to separate molasses from the condensed sugars [7]. Consequently, it retains high levels of minerals, polyphenols, and other bioactive compounds, contributing to its nutritional and functional properties [7,8].
Understanding the volatile organic compounds (VOCs) in non-centrifugal sugars, including palm sugar, is of vital importance because these compounds largely define the aroma and flavor qualities, which are the key attributes that influence consumer preferences and marketability [9]. Nevertheless, while some studies have focused on the physicochemical properties of palm sugar, only limited research has been conducted on its VOC profile, particularly regarding its botanical and geographical origin [10,11]. Additionally, with the growing interest in advanced analytical techniques, the integration of technologies such as gas chromatography–mass spectrometry (GC-MS) and mass spectrometry-based electronic nose (MS-e-nose) offers a comprehensive approach to comparing the VOC profiles of various foods [12,13]. Volatile profiles analyzed by GC-MS enable the precise identification and quantification of aromatic compounds [12]. MS-e-nose, a rapid and non-destructive technique, mimics human olfactory responses and can effectively characterize the overall aroma pattern in various food products [13]. This MS-e-nose approach allows for non-targeted volatile profiling without chromatographic separation and generates digital fingerprints from the mass spectra. Unlike the conventional GC-MS analysis, which generally uses long capillary columns for peak separation, the MS-e-nose employs a shorter capillary column and temperature program [14]. Therefore, MS-e-nose analysis offers faster analysis times, providing pattern recognition of acquired MS intensity data instead of compound identification. Combining these methodologies not only deepens our understanding of the sensory attributes of palm sugar but also supports the development of quality standards that are essential for protecting local products in the global market.
To capture and interpret the variation in volatile profiles, multivariate analyses such as principal component analysis (PCA) can be applied using two different scaling methods, namely unit variance scaling (UV) and Pareto scaling (PAR) [15,16]. Because the MS-e-nose generates complex mass spectral data with varying signal intensities, the use of these two scaling methods allows for different approaches to data interpretation [17,18]. UV scaling standardizes all variables, ensuring equal weights across compounds, which can help detect subtle differences [18]. Meanwhile, PAR scaling retains some variance weighting, allowing stronger signals to make greater contributions while reducing dominance and providing a balanced approach for visualizing key VOCs in data presentation [15,18].
Previous studies have examined the physicochemical and nutritional properties of palm sugar; however, investigations into its volatile profile remain limited [19,20]. In particular, the comparative analyses of VOC composition and MS-e-nose profiles across Indonesian and Malaysian palm sugars from different plant origins are lacking. To address this gap, the present study analyzed six palm sugar samples derived from palm, nipa, and coconut using both the SPME-GC-MS and MS-e-nose techniques. The resulting ion mass data from the MS-e-nose were visualized using PCA plots with UV and PAR scaling to evaluate differences in aroma patterns. This is the first study to comprehensively characterize the volatile profiles of Indonesian and Malaysian palm sugars across both botanical and geographical origins, while also comparing the effectiveness of different data scaling methods for volatile profiling.

2. Materials and Methods

2.1. Palm Sugar Samples

Six palm sugars representing various regional variances and plant origins were obtained from Indonesia (West Java, Central Java, and Bali) and Malaysia (Negeri Sembilan, Sarawak, and Terengganu). The samples included three palm-derived sugars from Bogor, West Java (the assigned code is ID-WJ-Palm: Indonesia-West Java-Palm), Karangasem, Bali (ID-BA-Palm), and Jempol, Negeri Sembilan (MY-NS-Palm); two nipa-derived sugars from Cilacap, Central Java (ID-CJ-Nipa), and Pusa, Sarawak (MY-SR-Nipa); and one coconut-derived sugar from Kuala Terengganu, Terengganu (MY-TR-Coconut). They were selected based on their popularity and availability according to the information provided by local retailers. Palm sugars were obtained from local producers in 2020–2021 (in general, the palm sugars were solidified from different plant saps within 2 days of sap collection) and transported to the laboratory within two weeks of production. The palm sugars were stored at −30 °C in sealed containers to prevent moisture absorption and preserve the VOC composition. The samples were analyzed within one year of receipt.

2.2. Volatile Composition Analysis

VOCs in palm sugars from Indonesia and Malaysia were analyzed using solid-phase microextraction (SPME)-GC-MS [21]. Briefly, palm sugar (3 g) and 1,2-dichlorobenzene-D4 (20 µL, 2.5 g/mL in methanol; Sigma-Aldrich, St. Louis, MO, USA) as the internal standard were added to a 20 mL vial and heated at 60 °C for 5 min. To extract the VOCs, a preconditioned SPME fiber coated with divinylbenzene/carboxene/polydimethylsiloxane (Supelco, Bellefonte, PA, USA) was used for 15 min at the same temperature. The fiber was selected because of its efficiency in capturing a wide range of VOCs, including both low-molecular-weight and polar compounds. GC-MS analysis was conducted using a Shimadzu GC2010-QP2010 PLUS system, equipped with a Shimadzu AOC-5000 Plus CTC PAL GC Autosampler and a DB-WAX column (30 m × 0.25 mm × 0.25 µm; Agilent Technologies, Santa Clara, CA, USA). Helium was used as the carrier gas at a flow rate of 35 cm/s, and the injector temperature was set at 250 °C with a 1:2 split ratio. The oven temperature started at 55 °C, was increased to 220 °C at a rate of 6 °C/min, and then maintained isothermally for 2.5 min at 220 °C. Mass spectrometric detection utilized electron impact ionization at 0.7 kV, with the ion source and interface temperatures set to 230 and 200 °C, respectively. The mass spectra were obtained over a range of m/z 33–450 amu with a scan rate of 1.77 scans/s. The chromatographic peaks were aligned using a GCalignR package. Compounds were identified by comparing the obtained spectra with those in the FFNSC and NIST08 libraries, along with linear retention indices (RIs) from a homologous series of n-alkanes (C7–C30). The VOCs were quantified by normalizing the peak area of each compound to the MS response of the internal standard, and the results were reported as micrograms per 100 g. The relative concentration was calculated by dividing the peak area of each compound by the internal standard and sample weight. All analyses were performed in triplicate.

2.3. MS-e-nose Analysis

The MS-e-nose profiles of the palm sugars were analyzed using an Agilent 7890A-GC-5975C MS (Agilent Technologies) equipped with a G1888 Headspace Autosampler and GERSTEL ChemSensor (GERSTEL, Mülheim, Germany) [14]. Briefly, palm sugar (3 g) was placed in a 20 mL vial, and headspace extraction was performed at 80 °C for 10 min. The volatiles were then pressurized into the GC injection port at 11 psi for 0.3 min. The injection temperature was set to 250 °C with a 1:10 split ratio. The sample and transfer line temperatures were set at 170 and 210 °C, respectively. For the GC, an HP5-MS column (15 m × 0.25 mm × 0.25 µm, Agilent Technologies) was used, with helium as the carrier gas. The oven temperature was programmed to start at 40 °C for 0.5 min, and then ramp to 200 °C at a rate of 60 °C/min, followed by holding at 200 °C for 1.5 min, for the total analysis time of 4.67 min. The MS ion source and interface temperatures were set to 250 °C, and electron ionization occurred at 70 eV. The volatiles were scanned within an m/z range of 30–149, and the total spectral intensities were processed into chemometric datasets for further analysis. All assays were performed in triplicate.

2.4. Statistical Analysis

The Tukey–Kramer significant difference test (JMP Version 18; SAS Institute, Cary, NC, USA) was used to assess the differences between samples. A heatmap plot was generated using OriginPro 2025 Version 10.2 (OriginLab, Northampton, MA, USA). Principal component analysis (PCA) was performed using SIMCA Version 17 (Sartorius, Göttingen, Germany).

3. Results

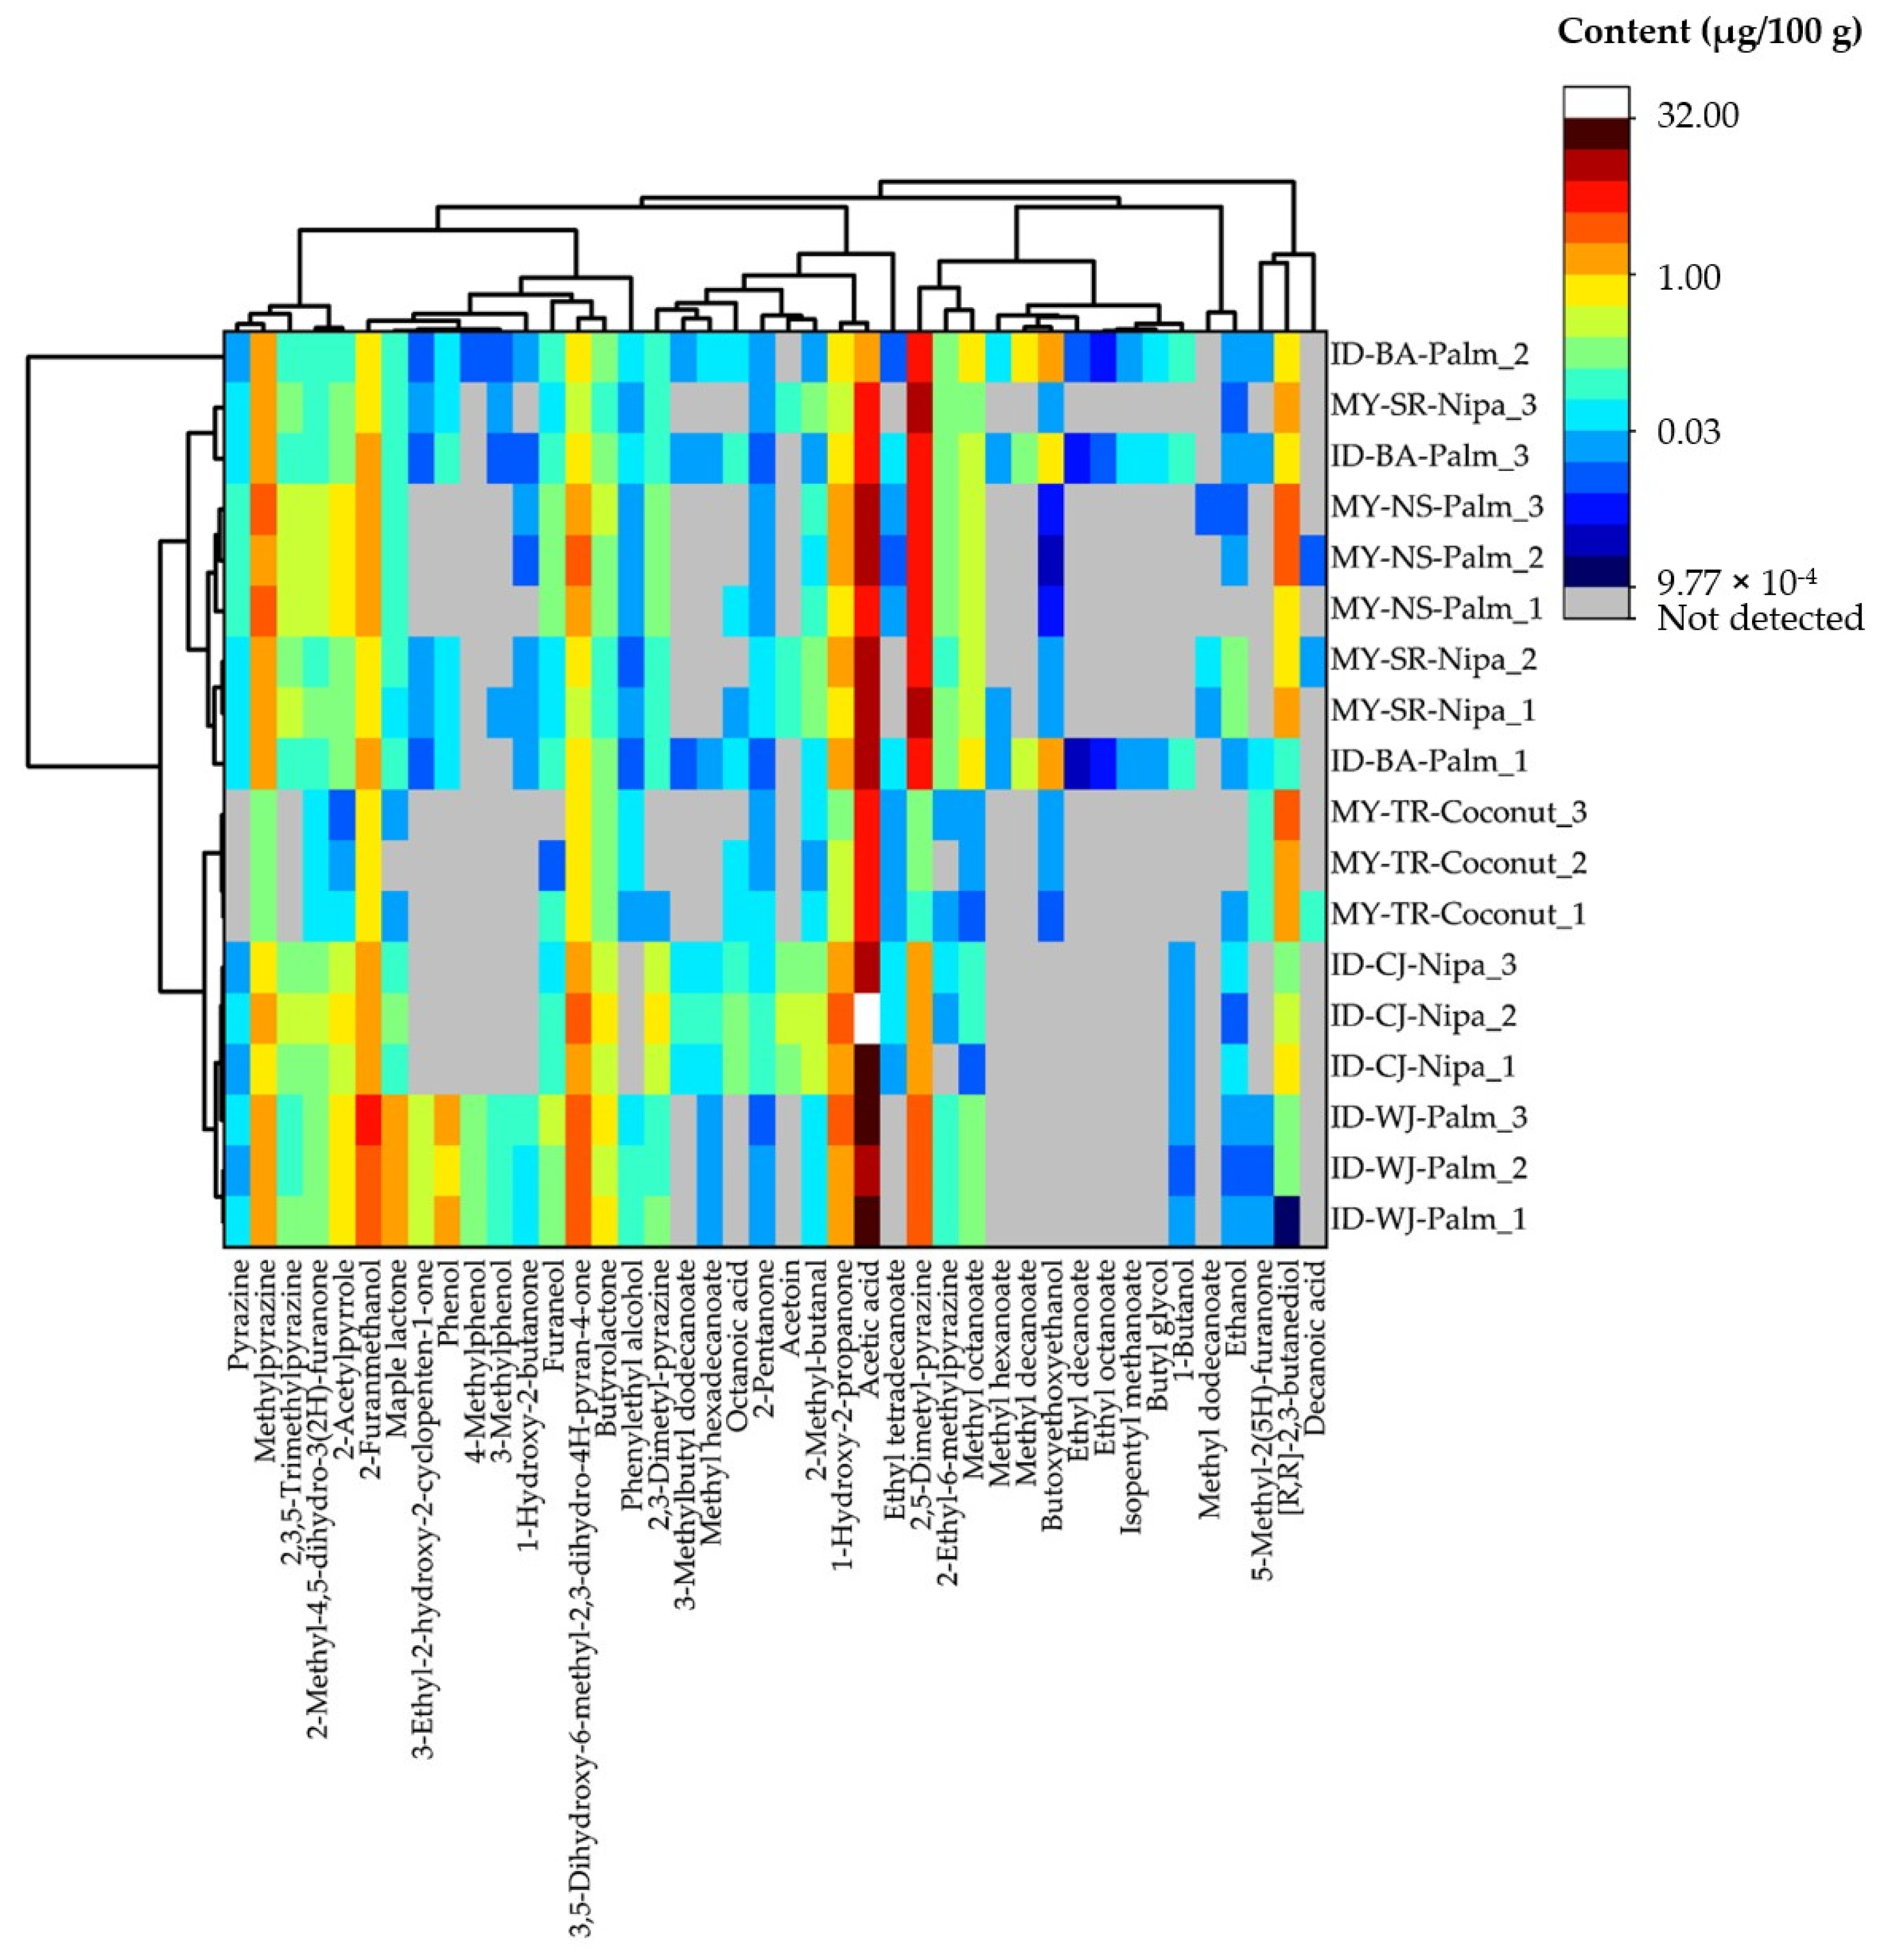
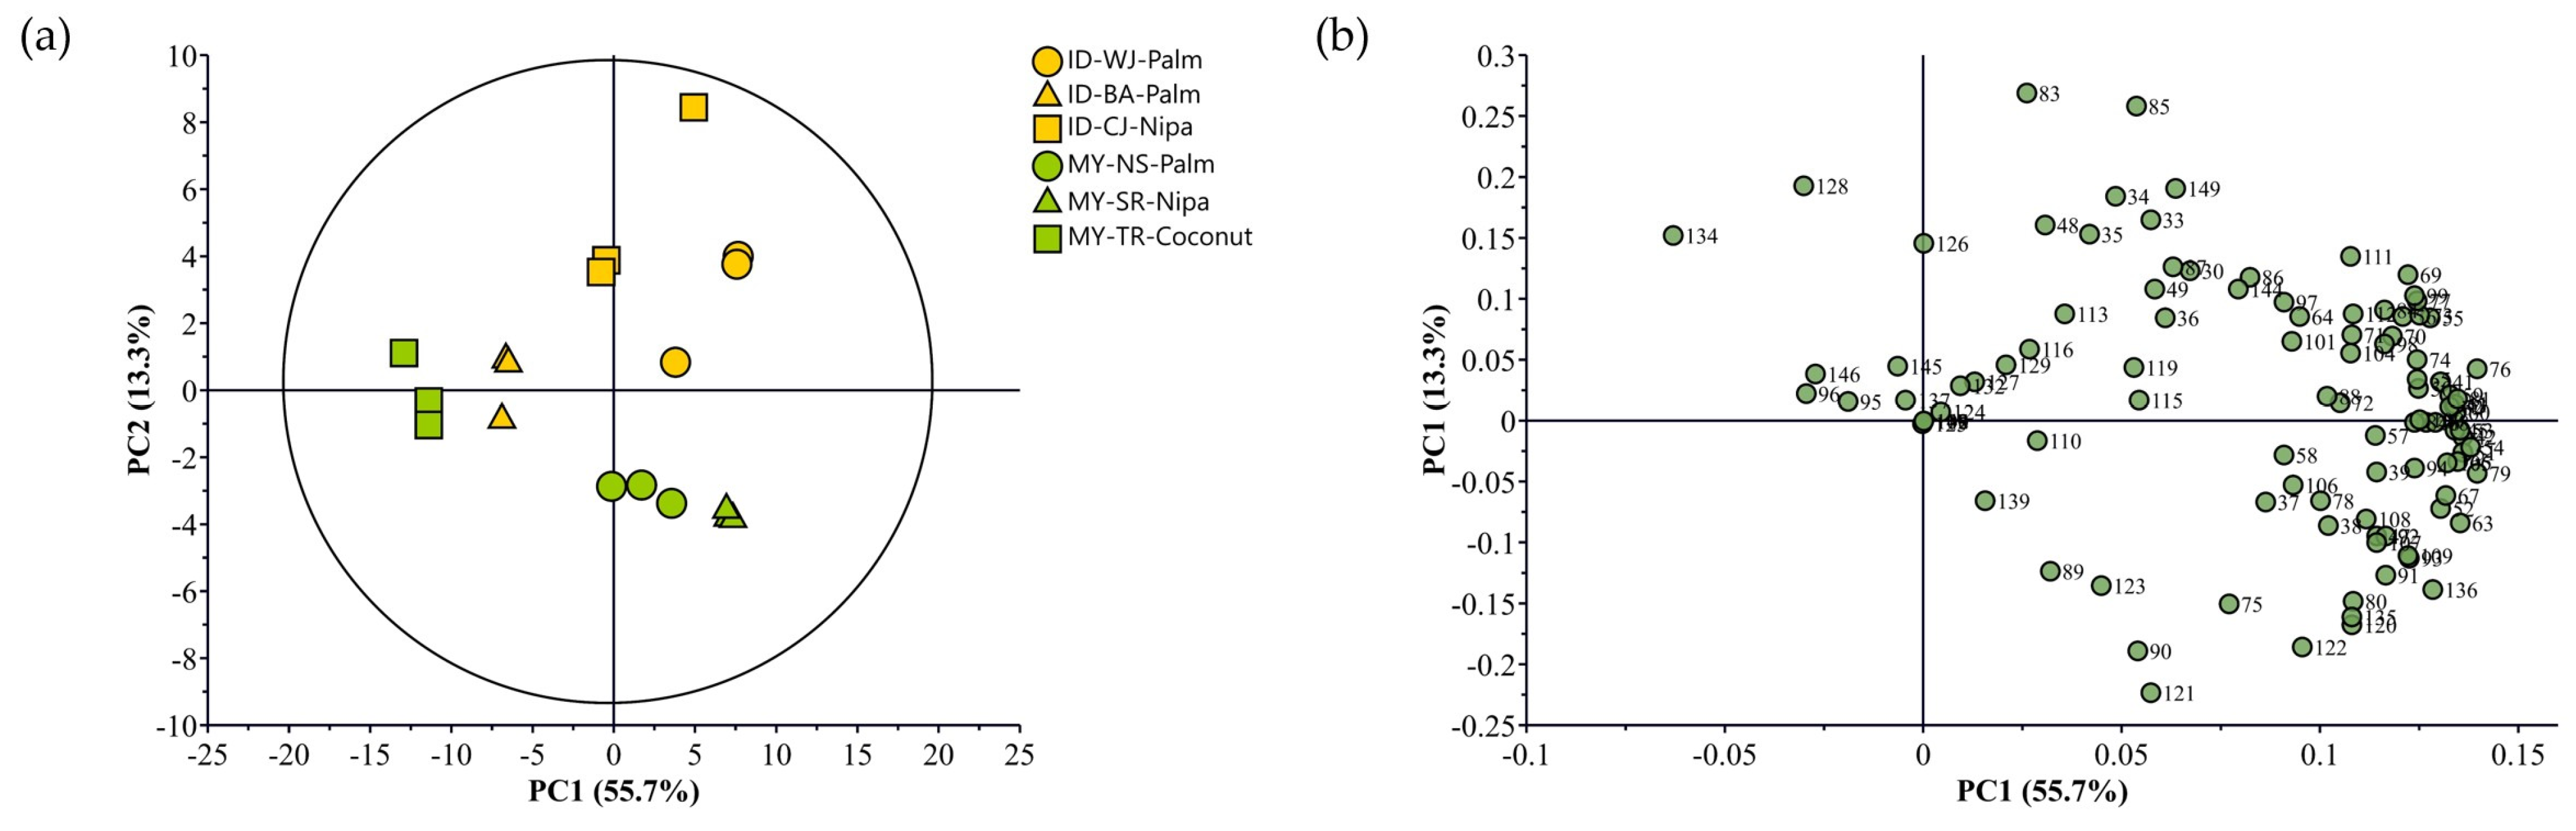
3.1. Volatile Compositions of Indonesian and Malaysian Palm Sugars

There were notable variations in the total VOC content among the Indonesian and Malaysian palm sugars (Figure 1a; Supplementary Figure S1). The sugar products from West Java (ID-WJ-Palm) and Central Java (ID-CJ-Nipa), derived from palm and nipa saps, respectively, exhibited the highest total volatile content (39.45 and 38.49 µg/100 g, respectively) (p < 0.05). By contrast, the sugars from Bali (ID-BA-Palm) and Terengganu (MY-TR-Coconut) contained significantly lower total VOCs (18.56 and 11.41 µg/100 g, respectively). Beyond the total VOC content, distinct compositional differences were observed, even among sugars of the same plant origin. The volatiles included 42 compounds, comprising 12 Maillard reaction products (MRPs), 10 esters, 8 alcohols, 5 ketones, 3 carboxylic acids, 3 phenols, and 1 aldehyde (Supplementary Table S1). Despite being derived from palm sap, ID-WJ-Palm exhibited a higher proportion of ketones and phenols, whereas ID-BA-Palm contained a greater proportion of esters (Figure 1b). Similarly, among the nipa-derived sugars, ID-CJ-Nipa contained a noticeably higher concentration of carboxylic acids, whereas MY-SR-Nipa contained a relatively higher proportion of MRPs. Overall, carboxylic acids were the predominant compound class across all samples, ranging from 24% to 52%, followed by MRPs (13–41%), alcohols (4–14%), and ketones (1–4%).
A hierarchical clustering heatmap was constructed using group average and Pearson correlation distance calculations to visualize the distribution of volatile profiles among the palm sugars. The heatmap plot reveals distinct VOCs profiles among the Indonesian and Malaysian palm sugars of different plant origins (Figure 2). The heatmap clustering pattern indicates that the composition of these sugar products is strongly influenced by their botanical sources, with clear separation between palm, nipa, and coconut sugars. In particular, the palm sugars were clustered based on their replicates, except for ID-BA-Palm, which was plotted in scattered positions between the two Malaysian sugars (MY-NS-Palm and MY-SR-Nipa), which were clustered separately from the other three sugars, namely MY-TR-coconut, ID-CJ-Nipa, and ID-WJ-Palm. The separation was primarily caused by 2,5-dimethyl pyrazine, methylpyrazine, and methyl octanoate. Pyrazines, such as methylpyrazine, were consistently detected in higher concentrations in palm-based sugars (ID-BA-Palm, ID-WJ-Palm, MY-NS-Palm), with concentrations ranging from 1.24 to 2.20 µg/100 g. Carboxylic acids, such as acetic and octanoic acids, were more prevalent in nipa-based sugars (ID-CJ-Nipa, MY-SR-Nipa), with concentrations ranging from 11.05 to 27.10 µg/100 g and from 0.01 to 0.13 µg/100 g, respectively, while alcohols were the most common compounds in coconut-based sugars, with [R,R]-2,3-butanediol detected at a concentration of 1.95 µg/100 g.
The volatile compositions of the Indonesian and Malaysian sugars were further visualized using PCA with the UV scaling method, revealing distinct regional groupings based on geographical and botanical origins (Figure 3). The PCA was conducted using the relative concentrations of all identified volatile compounds as input features. The first two principal components (PC1 and PC2) accounted for 49.5% of the total variance, thereby capturing the primary variations in the identified volatiles (Figure 3a). Interestingly, two Indonesian sugars, ID-BA-Palm and ID-WJ-Palm, showed greater variability in the different quadrants in the negative direction of PC1. The distinct separation of these two palm sugars was enhanced by higher concentrations of phenols (e.g., 3-methylphenol, 4-methylphenol, and phenol), followed by pyrazine, methyl pyrazine, and 2,5-dimethyl pyrazine (Figure 3b). By contrast, the Central Java sugar made from nipa (ID-CJ-Nipa) was an outlier, with the most positive value of PC2 due to the presence of 2-pentanone (0.06 µg/100 g), 2-methyl-butanal (0.30 µg/100 g), 2,3-dimethyl pyrazine (0.53 µg/100 g), octanoic acid (0.13 µg/100 g), 3-methylbutyl decanoate (0.06 µg/100 g) (Supplementary Table S1). In contrast to Indonesian sugars, Malaysian sugars formed closer clusters, indicating a relatively lower variability in their volatile compositions. Interestingly, Negeri Sembilan palm sugar (MY-NS-Palm) was positioned near the center of the PCA plot, suggesting a balanced volatile profile without any extreme dominance of specific compound classes. In addition, Terengganu coconut sugar (MY-TR-Coconut) and Sarawak nipa sugar (MY-SR-Nipa) exhibited some similarities, clustering closely together due to their distinct volatile composition, enriched in alcohols such as [R,R]-2,3-butanediol, which account for 1.63 and 1.95 µg/100 g, respectively (Figure 3b, Supplementary Table S1).

3.2. MS-e-nose Profiles of Indonesian and Malaysian Palm Sugars

There were variations in the intensity of ion masses from the overall volatiles of Indonesian and Malaysian palm sugars, as generated by MS-e-nose analysis (Supplementary Table S2; Supplementary Figure S2). The PCA was performed using the ion mass intensity data obtained from the MS-e-nose as input features. The data were scaled using two different scaling methods—the unit variance (UV) and Pareto (PAR) scaling methods—for exploring group separations based on plant origin and geography (Figure 4 and Figure 5, respectively). The UV-scaled PCA plot showed that PC1 and PC2 explained 55.7% and 13.3% of the total variance, respectively, thus capturing a reasonable proportion of the variability in the dataset (Figure 4). The PCA score plot (Figure 4a) revealed a diverse distribution of Indonesian and Malaysian sugars. Indonesian palm sugars from West Java and Bali (ID-WJ-Palm and ID-BA-Palm) were positioned in the positive direction of both PC1 and PC2, whereas most Malaysian sugars were located in the negative direction of PC2. The observed distribution was influenced by the captured ion masses of the volatiles released from the palm sugars, as depicted in the corresponding loading plot (Figure 4b). The UV scaling method, also known as autoscaling, provided a balanced representation of variables, making all the contributions equal. Notably, ion masses such as m/z 43, 45, 128, and 134, which represented predominant hydrocarbons, were positioned farther from the other ion masses, indicating their higher abundance in the Central Java sugars derived from Nipa (ID-CJ-Nipa).
However, the PAR-scaled PCA provided a more distinct separation while preserving the key differences in the dataset (Figure 5). The first two principal components explained 98.87% of the total variance, with PC1 accounting for 89.4% (Figure 5a). The PCA score plot (Figure 5a) demonstrated a clear separation between the different palm sugars. Along the positive side of PC2, four sugar products (MY-SR-Nipa, ID-CJ-Nipa, MY-NS-Palm, and ID-WJ-Palm) clustered together, whereas on the negative side, two sugar products (MY-TR-Coconut and ID-BA-Palm) were distinctly separated. Although PC2 explained only 4% of the variance, it effectively distinguished between the three sugar samples derived from the palm and the two samples derived from the nipa. Interestingly, the coconut-derived sugar (MY-TR-Coconut) was centered, indicating a more balanced volatile profile compared to other samples. The loading plot of the PAR-scaled PCA (Figure 5b) further highlights the key ion masses that influence the observed clustering. Ion masses at m/z 39, 41, 42, 43, 45, 57, 58, 60, 95, 96, and 108 were positioned farther from the center, indicating their strong roles in differentiating palm sugars.

4. Discussion

The volatile composition and MS-e-nose profiles of Indonesian and Malaysian palm sugars revealed distinct differences between the different samples depending on plant origin. Indonesian sugars tended to have a higher total sugar content than Malaysian sugars, which may be due to differences in their environmental and soil conditions. Although both countries are in Southeast Asia and have similar tropical climates, previous studies have inferred that microclimates and specific soil conditions can influence the metabolic processes of sugar palms, potentially affecting the synthesis of VOCs [22,23]. The lower volatile content in coconut sugar may be caused by lower levels of amino acids, phenolic compounds, and sucrose in the coconut sap [24,25,26]. These compounds serve as essential precursors for VOC formation in palm sugars via the Maillard reaction and caramelization [24,25]. Consequently, the limited precursor availability in coconut sap resulted in the reduced diversity and abundance of volatiles, leading to a simpler aroma profile characterized by fewer roasted, nutty, and caramel-like notes [1] (the aroma descriptions were retrieved from http://www.thegoodscentscompany.com/, accessed on 20 February 2025). This finding is consistent with the measured MRPs, which were the lowest in coconut sugar, but significantly higher in palm and nipa sugar.
The PCA plots of the VOCs demonstrated a separation in potent flavor qualities among the sugars, indicating a significant impact of botanical origin (palm, nipa, and coconut trees) and regional practices. In sugar products derived from palm sap, the PCA score plots were scattered in the bottom quadrants of PC1 and PC2, indicating that they may have similarities that can be influenced by the presence of abundant MRPs (e.g., pyrazine, methyl pyrazine, 2,5-dimethyl pyrazine, 2-furanmenthanol), alcohols such as 1-butanol, phenylethyl alcohol, and phenols (e.g., 3-methylphenol, 4-methylphenol, and phenol), as illustrated by their loading factors. This is consistent with the previous findings indicating that thermally processed palm sugar is rich in MRPs and phenolic volatiles, contributing to its characteristic caramelized aroma [27]. Sugar products derived from nipa sap were scattered in the upper quadrants of PC1 and PC2 and were affected by prominent VOCs, such as aldehydes, carboxylic acids, esters, alcohols, and MRPs. The prevalence of aldehydes and esters may be linked to lipid oxidation and fermentation processes, which have been reported in nipa sugars owing to their distinct sap composition and fermentation-prone nature [28]. Conversely, sugar products derived from coconut sap exhibited a unique volatile profile, distinct from those of palm and nipa sugars. This differentiation was likely due to the high concentration of specific alcohols, which have been associated with fruity, slightly fermented, and sweet notes and may influence the overall sensory perception of coconut sugar [29]. Elevated alcohol content suggests a greater influence of microbial activity during sap collection or processing, a factor previously noted in studies on naturally fermented coconut sap products [30].
Additionally, heatmap clustering revealed significant compounds in Indonesian and Malaysian palm sugars, including pyrazines (methylpyrazine and 2,5-dimethyl pyrazine), methyl octanoate, and carboxylic acids (acetic and octanoic acids), which contributed to the observed distinct volatile profiles. The differences in volatile profiles among the sugars derived from palm, nipa, and coconut can be attributed to variations in the raw sap composition, heat-induced reactions, fermentation, and plant physiology [31,32]. The typical processing of palm sugar using traditional sugar processing is similar among palm, nipa, and coconut, producing solidified brown sugar due to browning and the Maillard reaction [31]. Saps from palm and nipa contain high levels of amino acids, phenolic compounds, and complex sugars that serve as precursors for MRPs, caramelization, and microbial fermentation [31,32]. These reactions generate complex volatiles that contribute to the rich volatile profiles observed in these palm sugars. Hierarchical clustering analysis further supported these findings by categorizing the palm sugars based on their volatile compositions. Indonesian palm sugars from West Java and Central Java exhibited the highest volatile contents, whereas Balinese palm sugar and Terengganu coconut sugar had the lowest. Pyrazines, which have roasted and nutty aromas, are predominant in palm-based sugars [27]. By contrast, nipa-based sugars are rich in carboxylic acids (e.g., acetic and octanoic acids), giving them a distinct acidic note [27]. Coconut-derived sugars contain an abundance of alcohols, notably [R,R]-2,3-butanediol, which contributes to their mild and slightly creamy aroma [29]. Taken together, this study provides a detailed description of the volatile compositions of palm sugars derived from different plant origins, demonstrating clear distinctions in their aroma profiles. However, there are still several peaks that could not be identified, therefore comparing overall volatiles from the samples, such as through MS-e-nose analysis, is required to capture their comprehensive profiles.
The MS-e-nose profiles showed the captured ion masses of VOCs in Indonesian and Malaysian palm sugars of different plant origins. The e-nose generated a “fingerprint” of the VOCs, essentially providing an initial qualitative analysis of the volatile profiles. UV scaling reduced the influence of extreme values, making it useful for observing overall trends rather than small compositional differences [17]. Notably, ion masses such as m/z 43, 45, 128, and 134, which represent predominant hydrocarbons, were positioned farther from other ion masses, indicating their higher abundance in the Central Java sugars derived from Nipa. In contrast with UV scaling, PAR scaling balanced the variable contributions by normalizing each feature based on its mean, leading to a different sample distribution in the PCA plot [17]. The separation between different palm sugar groups was more pronounced and centered in the PAR-scaled PCA and emphasized the dominant ion masses such as m/z 39, 41, 42, 43, 45, 57, 58, 60, 95, 96, and 108, indicating that this method enhanced differentiation among the sugars.
PAR scaling ensures that moderately abundant volatiles are not overshadowed by the dominant ones thus improving the ability to detect subtle differences [33,34]. This method effectively highlighted the key VOCs that were most influential in differentiating between the sugars, revealing unique volatile signatures for each sugar type. The key difference between UV and PAR scaling is the manner in which each approach handles variable contributions. The PAR-scaled PCA plot highlighted stronger differentiation among the sugars, with palm sugars clustered separately from nipa and coconut sugars. Ion masses such as m/z 43, 45, and 60 indicated the presence of acetic acid and other small carboxylic acids, which contribute to the sour and vinegar-like notes in palm sugar [14]. Meanwhile, m/z 57, 58, and 108 were associated with dimethylpyrazines, which impart nutty, roasted, and caramel-like aromas. Additionally, m/z 95 and 96 suggested the presence of phenolic or furan compounds, contributing to smoky and caramelized characteristics [14]. The hydrocarbon and aldehyde fragments observed at m/z 39, 41, and 42 likely arose from lipid oxidation or sugar degradation, which influenced the overall volatile profile of the products [35]. In summary, although the UV scaling method provided a balanced representation of the dataset, all volatiles contributed equally, leading to a more even distribution of the samples. However, this method does not adequately emphasize the dominant VOCs. Meanwhile, the PAR scaling method provided a more centered distribution, highlighting the most significant VOCs and offering a better understanding of the distinct volatile profiles for each palm sugar. This approach enabled the clearer identification of compounds with strong discriminatory power, without amplifying background variation.
While this study provides valuable insights into the volatile profiles of palm sugars from different plant and geographical origins, the limitations should be acknowledged, including the absence of other plant origins such as the siwalan palm, as well as sensory evaluations that could limit the direct correlation between the chemical profiles and the perceived flavor characteristics. Taken together, this study describes in detail the volatile compositions of palm sugars derived from different plant origins, demonstrating clear distinctions in their aroma profiles. These findings reinforce the distinct aromatic profiles of palm sugars of different plant origins and provide insights into their unique sensory attributes. However, specific production techniques can vary between regions and producers, leading to differences in the final products. Local production practices play a crucial role in stabilizing product quality, ensuring consistent volatile composition, and maintaining desirable sensory characteristics. Standardizing key processing steps such as sap collection, heating conditions, and fermentation control is essential for improving product uniformity and enhancing the overall quality of palm sugar. Further investigations are required to optimize production methods and minimize variations, ultimately leading to better and more stable products in the future. Future studies should explore the relationship between these volatiles and consumer sensory perceptions to validate the observed chemical differences in a practical context.

5. Conclusions

Volatile component composition as determined by GC-MS analysis and MS-e-nose profiling demonstrated clear distinctions in the VOCs of Indonesian and Malaysian palm sugars, influenced by plant origin and geographical factors. Key VOCs such as pyrazines, carboxylic acids, and alcohols were predominant and contributed to the characteristic aroma of palm sugars. In addition, differences in the volatile compound composition were further influenced by plant source, where palm-derived sugars contained more pyrazines and acids, nipa-derived sugars exhibited higher contents of esters and ketones, and coconut-derived sugars had the lowest VOCs content, which may have been caused by limited Maillard reactions and caramelization. Multivariate analysis supported these findings, with PCA and heatmap clustering clearly separating Indonesian and Malaysian palm sugars based on their volatile composition. Additionally, the MS-e-nose analysis, enhanced by PAR scaling, effectively classified palm sugar types, improving the separation of palm sugar types by balancing the contributions from both dominant and minor VOCs. This study underscores the significant impact of plant origin on palm sugar aroma, which influences the sensory attributes and consumer perception. Understanding these variations can aid in the optimization of processing techniques to enhance desirable flavor characteristics. Future research integrating sensory evaluation and foodomics will further elucidate the link between the volatile composition and consumer preferences.

Supplementary Materials

The following supporting information can be downloaded at: https://www.mdpi.com/article/10.3390/chemosensors13050155/s1, Table S1: Volatile organic components in Indonesian and Malaysian palm sugars of different plant origins; Table S2: MS abundance of ion masses in Indonesian and Malaysian palm sugars of different plant origins, obtained by MS-e-nose analysis; Figure S1: Typical chromatograms of Indonesian and Malaysian palm sugars of different plant origins obtained by GC-MS analysis; Figure S2: Typical chromatograms of Indonesian and Malaysian palm sugars of different plant origins obtained by MS-e-nose analysis.

Author Contributions

Conceptualization, Y.A., S.H.-A.; D.Y., D.A.N.W. and I.W.R.W.; methodology, Y.A., S.H.-A.; D.Y., D.A.N.W., I.W.R.W., K.T. and K.W.; software, A.K. and Y.A.; validation, Y.A., K.T. and K.W.; formal analysis, A.K. and R.A.; resources, S.H.-A., D.A.N.W., D.Y. and I.W.R.W.; data curation, A.K., Y.A. and R.A.; writing—original draft preparation, A.K. and R.A.; writing—review and editing, Y.A., K.T. and K.W.; visualization, A.K.; supervision, Y.A., S.H.-A., D.Y., D.A.N.W., I.W.R.W., K.T. and K.W.; project administration, Y.A.; funding acquisition, Y.A. All authors have read and agreed to the published version of the manuscript.

Funding

This research was supported by JSPS KAKENHI Grant Number JP19K15784 and University of the Ryukyus Research Project Promotion Grant for Foreign Researchers (No. 23SP07101).

Institutional Review Board Statement

Not applicable.

Data Availability Statement

The original contributions presented in the study are included in the article, further inquiries can be directed to the corresponding author.

Acknowledgments

We thank Eriko Arakaki (University of the Ryukyus) for their technical assistance with the MS-e-nose analysis. GC-MS analysis was performed at the Center for Research Advancement and Collaboration, University of the Ryukyus.

Conflicts of Interest

The authors declare no conflicts of interest.

References

  1. Sarkar, T.; Mukherjee, M.; Roy, S.; Chakraborty, R. Palm sap sugar an unconventional source of sugar exploration for bioactive compounds and its role on functional food development. Heliyon 2023, 9, e14788. [Google Scholar] [CrossRef] [PubMed]
  2. Saputro, A.D.; Van de Walle, D.; Dewettinck, K. Palm sap sugar: A review. Sugar Tech 2019, 21, 862–867. [Google Scholar] [CrossRef]
  3. Asikin, M.N.; Mashrom, M.; Awal, A. Sugar palm (Arenga pinnata Wurmb Merr.): Its potential, limitation, and impact on socio-economic development of rural communities in Malaysia. J. Nat. Fibre Polym. Compos. 2023, 3, 5. [Google Scholar]
  4. Hebbar, K.B.; Pandiselvam, R.; Manikantan, M.R.; Arivalagan, M.; Beegum, S.; Chowdappa, P.J.S.T. Palm sap—Quality profiles, fermentation chemistry, and preservation methods. Sugar Tech 2018, 20, 621–634. [Google Scholar] [CrossRef]
  5. Asghar, M.T.; Yusof, Y.A.; Mokhtar, M.N.; Ya’acob, M.E.; Mohd Ghazali, H.; Chang, L.S.; Manaf, Y.N. Coconut (Cocos nucifera L.) sap as a potential source of sugar: Antioxidant and nutritional properties. Food Sci. Nutr. 2020, 8, 1777–1787. [Google Scholar] [CrossRef] [PubMed]
  6. Srikaeo, K.; Sangkhiaw, J.; Likittrakulwong, W. Productions and functional properties of palm sugars. Walailak J. Sci. Technol. 2019, 16, 897–907. [Google Scholar] [CrossRef]
  7. Verma, P.; Chavanpatil, V.; Shah, N.G.; Mahajani, S.M. Scientific understanding of the traditional practices followed in India for the production of non-centrifugal sugar. Sugar Tech 2021, 23, 1393–1412. [Google Scholar] [CrossRef]
  8. Zidan, D.; Azlan, A. Non-centrifugal sugar (NCS) and health: A review on functional components and health benefits. Appl. Sci. 2022, 12, 460. [Google Scholar] [CrossRef]
  9. Asikin, Y.; Nakaza, Y.; Oe, M.; Kaneda, H.; Maeda, G.; Takara, K.; Wada, K. Volatile component composition, retronasal aroma release profile, and sensory characteristics of non-centrifugal cane sugar obtained at different evaporation temperatures. Appl. Sci. 2024, 14, 11617. [Google Scholar] [CrossRef]
  10. Saputro, A.D.; Van de Walle, D.; Dewettinck, K. Physicochemical properties of coarse palm sap sugars as natural alternative sweetener. Food Biosci. 2020, 38, 100780. [Google Scholar] [CrossRef]
  11. Aeimsard, R.; Thumthanaruk, B.; Jumnongpon, R.; Lekhavat, S. Effect of drying on total phenolic compounds, antioxidant activities, and physical properties of palm sugar. J. Food Sci. Agric. Technol. 2015, 1, 126–130. [Google Scholar]
  12. Hou, X.; Jiang, J.; Luo, C.; Rehman, L.; Li, X.; Xie, X. Advances in detecting fruit aroma compounds by combining chromatography and spectrometry. J. Sci. Food Agric. 2023, 103, 4755–4766. [Google Scholar] [CrossRef] [PubMed]
  13. Nayak, S.L.; Arora, B.; Sethi, S.; Sharma, R.R. Electronic nose (E-nose) application in the food industry. In Sensor-Based Quality Assessment Systems for Fruits and Vegetables; Apple Academic Press: Point Pleasant, NJ, USA, 2020; pp. 143–167. [Google Scholar]
  14. Ayustaningwarno, F.; Asikin, Y.; Amano, R.; Vu, N.T.; Hajar-Azhari, S.; Anjani, G.; Wada, K. Composition of minerals and volatile organic components of non-centrifugal cane sugars from Japan and ASEAN Countries. Foods 2023, 12, 1406. [Google Scholar] [CrossRef]
  15. Worley, B.; Powers, R. Multivariate analysis in metabolomics. Curr. Metabolomics 2013, 1, 92–107. [Google Scholar] [PubMed]
  16. Zhang, X.H.; Liu, R.J.; Zheng, J.J.; Qing, X.D.; Yang, K.L.; Zhang, Y.Q.; Nie, J.F. Authentication of the production season of Xinyang Maojian green tea using two-dimensional fingerprints coupled with chemometric multivariate calibration and pattern recognition analysis. LWT 2023, 176, 114556. [Google Scholar] [CrossRef]
  17. Qu, D.; Xi, L.; Li, Y.; Yang, H.; Chen, X.; Jin, W.; Yan, F. Characterizing the composition of volatile compounds in different types of Chinese bacon using GC–MS, E-nose, and GC–IMS. J. Chromatogr. A 2024, 1730, 465056. [Google Scholar] [CrossRef]
  18. Liu, X.; Fang, Y.; Ma, H.; Zhang, N.; Li, C. Performance comparison of three scaling algorithms in NMR-based metabolomics analysis. Open Life Sci. 2023, 18, 20220556. [Google Scholar] [CrossRef]
  19. Asghar, M.T.; Yusof, Y.A.; Mokhtar, M.N.; Yaacob, M.E.; Ghazali, H.M.; Chang, L.S. A review of nutritional facts, production, availability, and future aspects of coconut palm sugar. J. Nutr. Food Sci. 2021, 11, 793. [Google Scholar]
  20. Phetrit, R.; Chaijan, M.; Sorapukdee, S.; Panpipat, W. Characterization of nipa palm (Nypa fruticans Wurmb.) sap and syrup as functional food ingredients. Sugar Tech 2020, 22, 191–201. [Google Scholar] [CrossRef]
  21. Ma, Q.L.; Hamid, N.; Bekhit, A.E.D.; Robertson, J.; Law, T.F. Optimization of headspace solid-phase microextraction (HS-SPME) for gas chromatography–mass spectrometry (GC–MS) analysis of aroma compounds in cooked beef using response surface methodology. Microchem. J. 2013, 111, 16–24. [Google Scholar] [CrossRef]
  22. Lu, J.; Jiang, Z.; Dang, J.; Li, D.; Yu, D.; Qu, C.; Wu, Q. GC–MS combined with fast GC E-Nose for the analysis of volatile components of chamomile (Matricaria chamomilla L.). Foods 2024, 13, 1865. [Google Scholar] [CrossRef] [PubMed]
  23. Loreto, F.; Dicke, M.; Schnitzler, J.P.; Turlings, T.C. Plant volatiles and the environment. Plant Cell Environ. 2014, 37, 1905–1908. [Google Scholar] [CrossRef]
  24. Ge, Y.; Li, K.; Xie, C.; Xu, Y.; Shi, C.; Hang, F.; Doherty, W.O. Formation of volatile and aroma compounds during the dehydration of membrane-clarified sugarcane juice to non-centrifugal sugar. Foods 2021, 10, 1561. [Google Scholar] [CrossRef] [PubMed]
  25. Phaeon, N.; Chapanya, P.; Mueangmontri, R.; Pattamasuwan, A.; Lipan, L.; Carbonell-Barrachina, Á.A.; Nitayapat, N. Acrylamide in non-centrifugal sugars and syrups. J. Sci. Food Agric. 2021, 101, 4561–4569. [Google Scholar] [CrossRef]
  26. Weerawatanakorn, M.; Asikin, Y.; Kamchonemenukool, S.; Tamaki, H.; Takara, K.; Wada, K. Physicochemical, antioxidant, volatile component, and mass spectrometry-based electronic nose analyses differentiated unrefined non-centrifugal cane, palm, and coconut sugars. J. Food Meas. Charact. 2021, 15, 1563–1577. [Google Scholar] [CrossRef]
  27. Wan Aida, W.M.; Ho, C.W.; Maskat, M.Y.; Osman, H. Relating descriptive sensory analysis to gas chromatography/mass spectrometry of palm sugars using partial least squares regression. ASEAN Food J. 2008, 15, 35–45. [Google Scholar]
  28. Wang, L.; Deng, W.; Wang, P.; Huang, W.; Wu, J.; Zheng, T.; Chen, J. Degradations of aroma characteristics and changes of aroma-related compounds, PPO activity, and antioxidant capacity in sugarcane juice during thermal process. J. Food Sci. 2020, 85, 1140–1150. [Google Scholar] [CrossRef] [PubMed]
  29. Wrage, J.; Burmester, S.; Kuballa, J.; Rohn, S. Coconut sugar (Cocos nucifera L.): Production process, chemical characterization, and sensory properties. LWT 2019, 112, 108227. [Google Scholar] [CrossRef]
  30. Jara’ee, J.; Awg-Adeni, D.S.; Bilung, L.M.; Azmin, P. Effects of selected preservation techniques on the shelf-life of nipa sap. Food Res. 2025, 9, 40–48. [Google Scholar] [CrossRef]
  31. Huynh Thi Le, D.; Lu, W.C.; Li, P.H. Sustainable processes and chemical characterization of natural food additives: Palmyra palm (Borassus flabellifer Linn.) granulated sugar. Sustainability 2020, 12, 2650. [Google Scholar] [CrossRef]
  32. Shetty, P.; D’Souza, A.; Poojari, S.; Narayana, J.; Rajeeva, P. Study of fermentation kinetics of palm sap from Cocos nucifera. Int. J. Appl. Sci. Biotechnol. 2017, 5, 375–381. [Google Scholar] [CrossRef]
  33. Arroyo-Manzanares, N.; Markiv, B.; Hernández, J.D.; López-García, I.; Guillén, I.; Vizcaíno, P.; Viñas, P. Headspace gas chromatography coupled to mass spectrometry for the assessment of the contamination of mayonnaise by yeasts. Food Chem. 2019, 289, 461–467. [Google Scholar] [CrossRef] [PubMed]
  34. Okada, T.; Mochamad Afendi, F.; Altaf-Ul-Amin, M.; Takahashi, H.; Nakamura, K.; Kanaya, S. Metabolomics of medicinal plants: The importance of multivariate analysis of analytical chemistry data. Curr. Comput.-Aided Drug Des. 2010, 6, 179–196. [Google Scholar] [CrossRef] [PubMed]
  35. Diez-Simon, C.; Mumm, R.; Hall, R.D. Mass spectrometry-based metabolomics of volatiles as a new tool for understanding aroma and flavor chemistry in processed food products. Metabolomics 2019, 15, 41. [Google Scholar] [CrossRef]
Figure 1. (a) Total content and (b) relative concentration of volatile organic components of Indonesian and Malaysian palm sugars. Each value is expressed as the mean ± standard deviation. Means followed by different letters are significantly different at p < 0.05; n = 3.
Chemosensors 13 00155 g001
Figure 2. Heatmap visualization of volatile organic components of Indonesian and Malaysian palm sugars.
Chemosensors 13 00155 g002
Figure 3. (a) PCA scores and (b) factor loadings of volatile organic components of Indonesian and Malaysian palm sugars.
Chemosensors 13 00155 g003
Figure 4. (a) PCA scores and (b) factor loadings of MS-e-nose profiles of Indonesian and Malaysian palm sugars obtained by UV scaling calculation.
Chemosensors 13 00155 g004
Figure 5. (a) PCA scores and (b) factor loadings of MS-e-nose profiles of Indonesian and Malaysian palm sugars obtained by PAR scaling calculation.
Chemosensors 13 00155 g005
Disclaimer/Publisher’s Note: The statements, opinions and data contained in all publications are solely those of the individual author(s) and contributor(s) and not of MDPI and/or the editor(s). MDPI and/or the editor(s) disclaim responsibility for any injury to people or property resulting from any ideas, methods, instructions or products referred to in the content.

