Abstract
Surface-enhanced Raman scattering (SERS) is extensively employed for detecting organics, where its sensitivity and selectivity are strongly influenced by the properties of the SERS substrates. In this work, a simple hydrothermal synthesis followed by a subsequent reduction was used to prepare Au-CeO2 composite nanocubes as a new SERS substrate, in which the side length of the CeO2 cubes was 20~30 nm and the diameter of the Au nanoparticles was 5~25 nm. Using methylene blue (MB) and crystal violet (CV) as probe molecules, the lowest detection limit (LDL) of methylene blue (MB) on the Au-CeO2 composite nanocubes substrate was 10−7 M, and the maximum SERS enhancement factor (EF) was 2.6 × 10⁵. As a result, the lowest detection limit (LDL) of crystal violet (CV) was 10−7 M, and the maximum enhancement factor (EF) was 3.7 × 10⁴. The above results proved that the Au-CeO2 composite nanocubes had a quite good Raman enhancement effect, which could be used as a SERS substrate. Finally, a Raman enhancement mechanism is proposed for the Au-CeO2 nanucubes.
1. Introduction
At present, organics are widely used across multiple sectors of modern society, such as in antibiotics, organic dyes, pesticides, etc., which promotes economic development and technological progress. However, with the excessive use of these organics, a series of problems, such as environmental pollution and health risks, have become increasingly serious [1,2,3,4]. Therefore, the analysis of these organics is very important to solve the pollution caused by these organics. Traditional methods for the detection of these organics include physical, chemical, and biological methods, such as gas chromatography (GC), high-performance liquid chromatography (HPLC) [5,6,7,8,9,10,11], spectroscopy (ultraviolet-visible spectroscopy, infrared spectroscopy) [12,13], and mass spectrometry (MS) [14,15,16,17]. However, these methods always come with disadvantages, such as high cost, high detection limit, etc. For example, the analysis of complex mixtures may be too complicated, and these often require complex sample preparations and expensive equipment.
Surface-enhanced Raman spectroscopy (SERS) is a technology that uses the Raman enhancement effect of noble metal nanomaterials to substantially enhance the intensity of Raman signals [18,19,20,21,22,23,24,25], owing to their high sensitivity and selectivity, nondestructiveness, capacity for rapid real-time detection, etc., which have become an important analytical method in biology, medicine, and other fields [26,27,28,29,30]. Due to the excellent performance of gold nanomaterials in Raman scattering signals but their high cost, as well as the high stability and good biocompatibility of semiconductor materials but the Raman enhancement effect not being ideal, the combination of the two achieves complementary advantages in the preparation of a composite SERS substrate with excellent enhancement performance, good uniformity, and high stability and has recently become a research focus [31,32,33,34].
Currently, research on Au-CeO2 composite nanomaterials primarily focuses on optimizing their performance in surface-enhanced Raman scattering (SERS) and sensing applications by precisely controlling the morphology, size, and composite ratio of Au to CeO2 [35,36,37,38,39,40]. Many studies have demonstrated that Au-CeO2 composites effectively combine the localized surface plasmon resonance (LSPR) effect of Au and the oxygen vacancy characteristics of CeO2, significantly enhancing SERS detection and sensing sensitivity. For instance, Nicholas A. Joy et al. [35] investigated Au-CeO2 nanocomposite films as potentially sensitive elements for the high-temperature plasmonic sensing of H2, CO, and NO2 in oxygen-containing environments, demonstrating the promising potential and stability of Au-CeO2 films as optical sensing components. Mohamed Ibrahim et al. [36] developed a sensitive and straightforward electrochemical sensor by integrating Au-CeO2 with multi-walled carbon nanotubes (MWCNTs-OH) and functionalized glassy carbon microspheres (FGCMs), achieving a detection limit of 1.56 × 10⁻⁹ M for the chemotherapeutic drug valrubicin (VLB). Wang et al. [37] fabricated a core-shell Au@CeO2 structure for the sensitive detection of heart-type fatty acid-binding protein (H-FABP), an early cardiac biomarker, with a detection limit of as low as 0.35 ngmL−1. However, challenges remain in further improving the stability, uniformity, and cost-effectiveness of these materials.
In this work, CeO2 nanocubes were synthesized using a simple hydrothermal synthesis method. The surface of CeO2 nanocubes was modified with Au nanoparticles through a simple reduction process, from which was obtained Au-CeO2 nanocubes (Au-CeO2 NC). Methylene blue and crystal violet were used as probe molecules to test the SERS properties of Au-CeO2 NCs. As expected, Au-CeO2 NCs as a SERS substrate showed high SERS activity for methylene blue and crystal violet.
2. Materials and Methods
2.1. Materials
Cerium nitrate hexahydrate (Ce(NO3)3·6H2O), polyvinylpyrrolidone (average molecular weight 58000), L-ascorbic acid, sodium hydroxide (NaOH), methylene blue (MB), and crystal violet (CV) were obtained from Macklin Chemical Co., Ltd. (Shanghai, China). Chloroauric acid was purchased from CIVI Chemical Co., Ltd. (Shanghai, China). Deionized water was used throughout the process in all the experiments. All chemicals were used directly as obtained, without additional purification.
2.2. Preparation of Au-CeO2 Nanocubes
CeO2 nanocubes were synthesized according to the reported hydrothermal method [41]. A solution was prepared by dissolving 9.60 g of NaOH in 40 mL of deionized water (DI water). Then, 0.868 g of Ce(NO3)3·6H2O was added, and the mixture was stirred vigorously for 30 min. The mixture was then transferred into a Teflon-lined stainless steel autoclave and heated at 180 °C for 24 h. After the reaction was complete, the sample was allowed to cool to room temperature, and the product was subsequently separated through centrifugation and cleaned with deionized water and ethanol. Finally, the pale yellow sample was dried and labeled as CeO2 nanocubes (CeO2 NC).
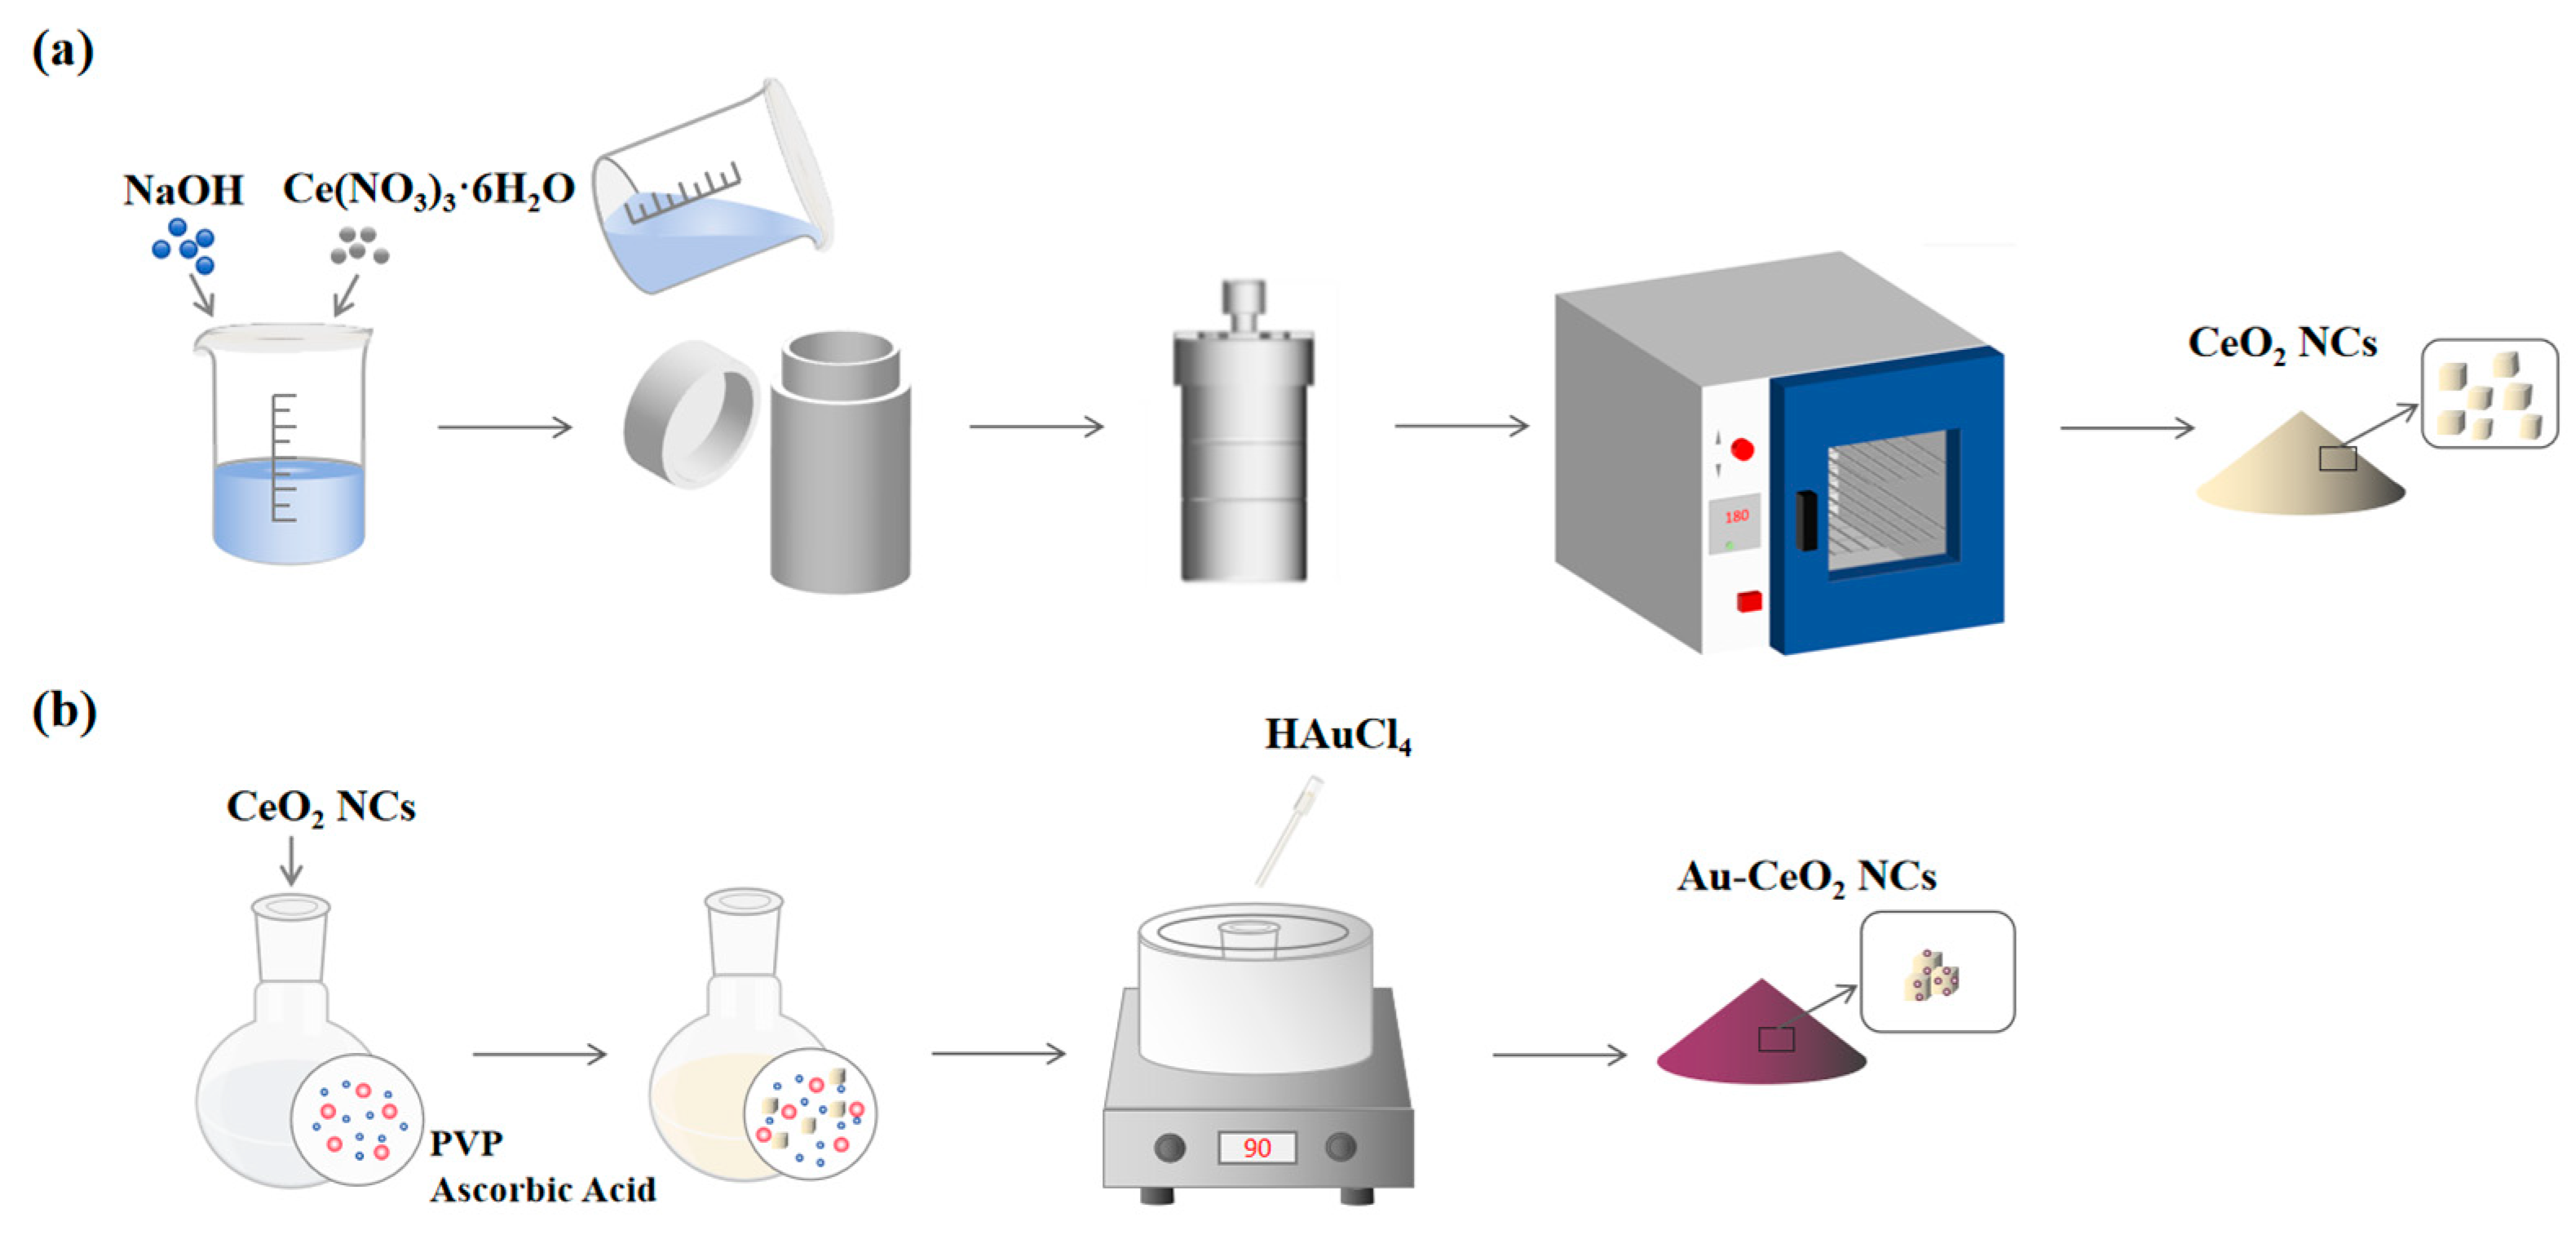
The synthesis of Au-CeO2 nanocubes (Au-CeO2 NC) was referred to in previous literature [42]. In 120 mL of deionized water, 0.70 g of PVP and 1.20 g of L-ascorbic acid were dissolved. Then, 0.10 g of CeO2 NCs was dispersed in the solution. This suspension was heated to 90 °C, and then 0.4 mL of the HAuCl4 solution (0.05 g/mL) was added. The solution was kept at 90 °C and stirred for 3 h. Finally, the sample was cooled to room temperature, followed by centrifugation, and it was then washed three times with deionized water and ethanol, respectively. Finally, the product was placed in an oven and dried at 60 °C for 6 h. The sample was labeled as Au-CeO2 NCs. The synthesis process of CeO2 NCs and Au-CeO2 NCs were shown in Figure 1.
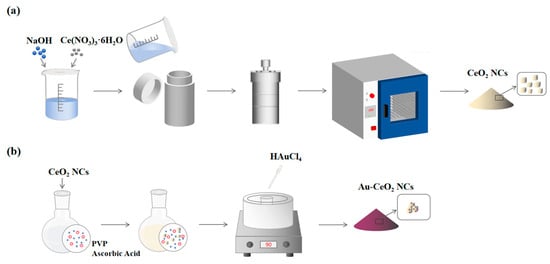
Figure 1.
The synthesis process of (a) CeO2 NCs and (b) Au-CeO2 NCs.
2.3. Experimental Characterization
In ultra-high-resolution transmission electron microscopy (UHRTEM) analysis, a small amount of sample that was dispersed in ethanol was placed on a non-fixed carbon-coated copper grid, and ultra-high-resolution transmission electrons were acquired using a JEM-2100F (JEOL Ltd, Tokyo, Japan) with an accelerating voltage of 200 kV.
Scanning electron microscope (SEM) images were captured using a S-4800 (Hitachi Ltd, Tokyo, Japan), and energy dispersive spectroscopy (EDS) spectra were equipped with an X-ray energy spectrum analyzer (EDS, Thermo Fisher Scientific Co., Waltham, MA, USA) for qualitative and quantitative analysis of sample elements. XRD patterns were obtained on a Rigaku Ultima IV in the 2θ range from 5 ° to 90 ° at a scanning speed of 5°/min to identify Au-CeO2 NCs under Cu−Kα radiation (λ = 0.154178 nm) of crystal structure. The elemental composition and oxidation state of the sample surface were analyzed using X-ray photoelectron spectroscopy (XPS, Thermo Scientific K-Alpha) with monochromatic Al Kα radiation. UV–vis spectra were obtained on a UV–Vis spectrometer (Shimadzu, UV-3600i Plus, Tokyo, Japan), with wavelengths of from 200 to 800 nm.
2.4. Raman Test
Surface-enhanced Raman scattering spectroscopy (SERS) of all samples was selected and recorded with a Raman microscope system (Horiba LabRAM HR, Tokyo, Japan). In each SERS experiment, a 633 nm laser excitation wavelength was used, with the lens magnification set to ×50 L. The test samples were prepared using standard solutions of molecular probes (MB and CV) with concentrations varying between 10−3 and 10−9 M. The preparation process for the surface-enhanced Raman test samples was as follows: 1 mg of Au-CeO2 NCs was added to the probe molecular solution after thoroughly mixing and it was then uniformly dropped onto a cleaned silicon wafer, and then dried in a vacuum oven for 2 h. The laser beam was aimed at the sample surface at a right angle, producing a spot with a diameter of 5 μm. The laser power was set to 0.5 mW, and the accumulation time was 10 s.
2.5. Calculation of the Enhancement Factor
The enhancement factor (EF) is an important index to measure the enhancement performance of SERS substrates, which can be calculated as follows [43]:
where ISERS and INRS represent the peak intensities of the SERS and NRS, respectively. NSERS and NNRS refer to the number of MB molecules in the SERS substrate and the normal Raman sample, respectively. To calculate the EF of Au-CeO2 nanocubes, Raman scattering peaks at 1620 cm−1 and 1622 cm−1 were selected to calculate the EF of MB and CV, respectively.
EF = (ISERS/NSERS)/(INRS/NNRS)
3. Results
3.1. Synthesis and Characterization of Au-CeO2 NC
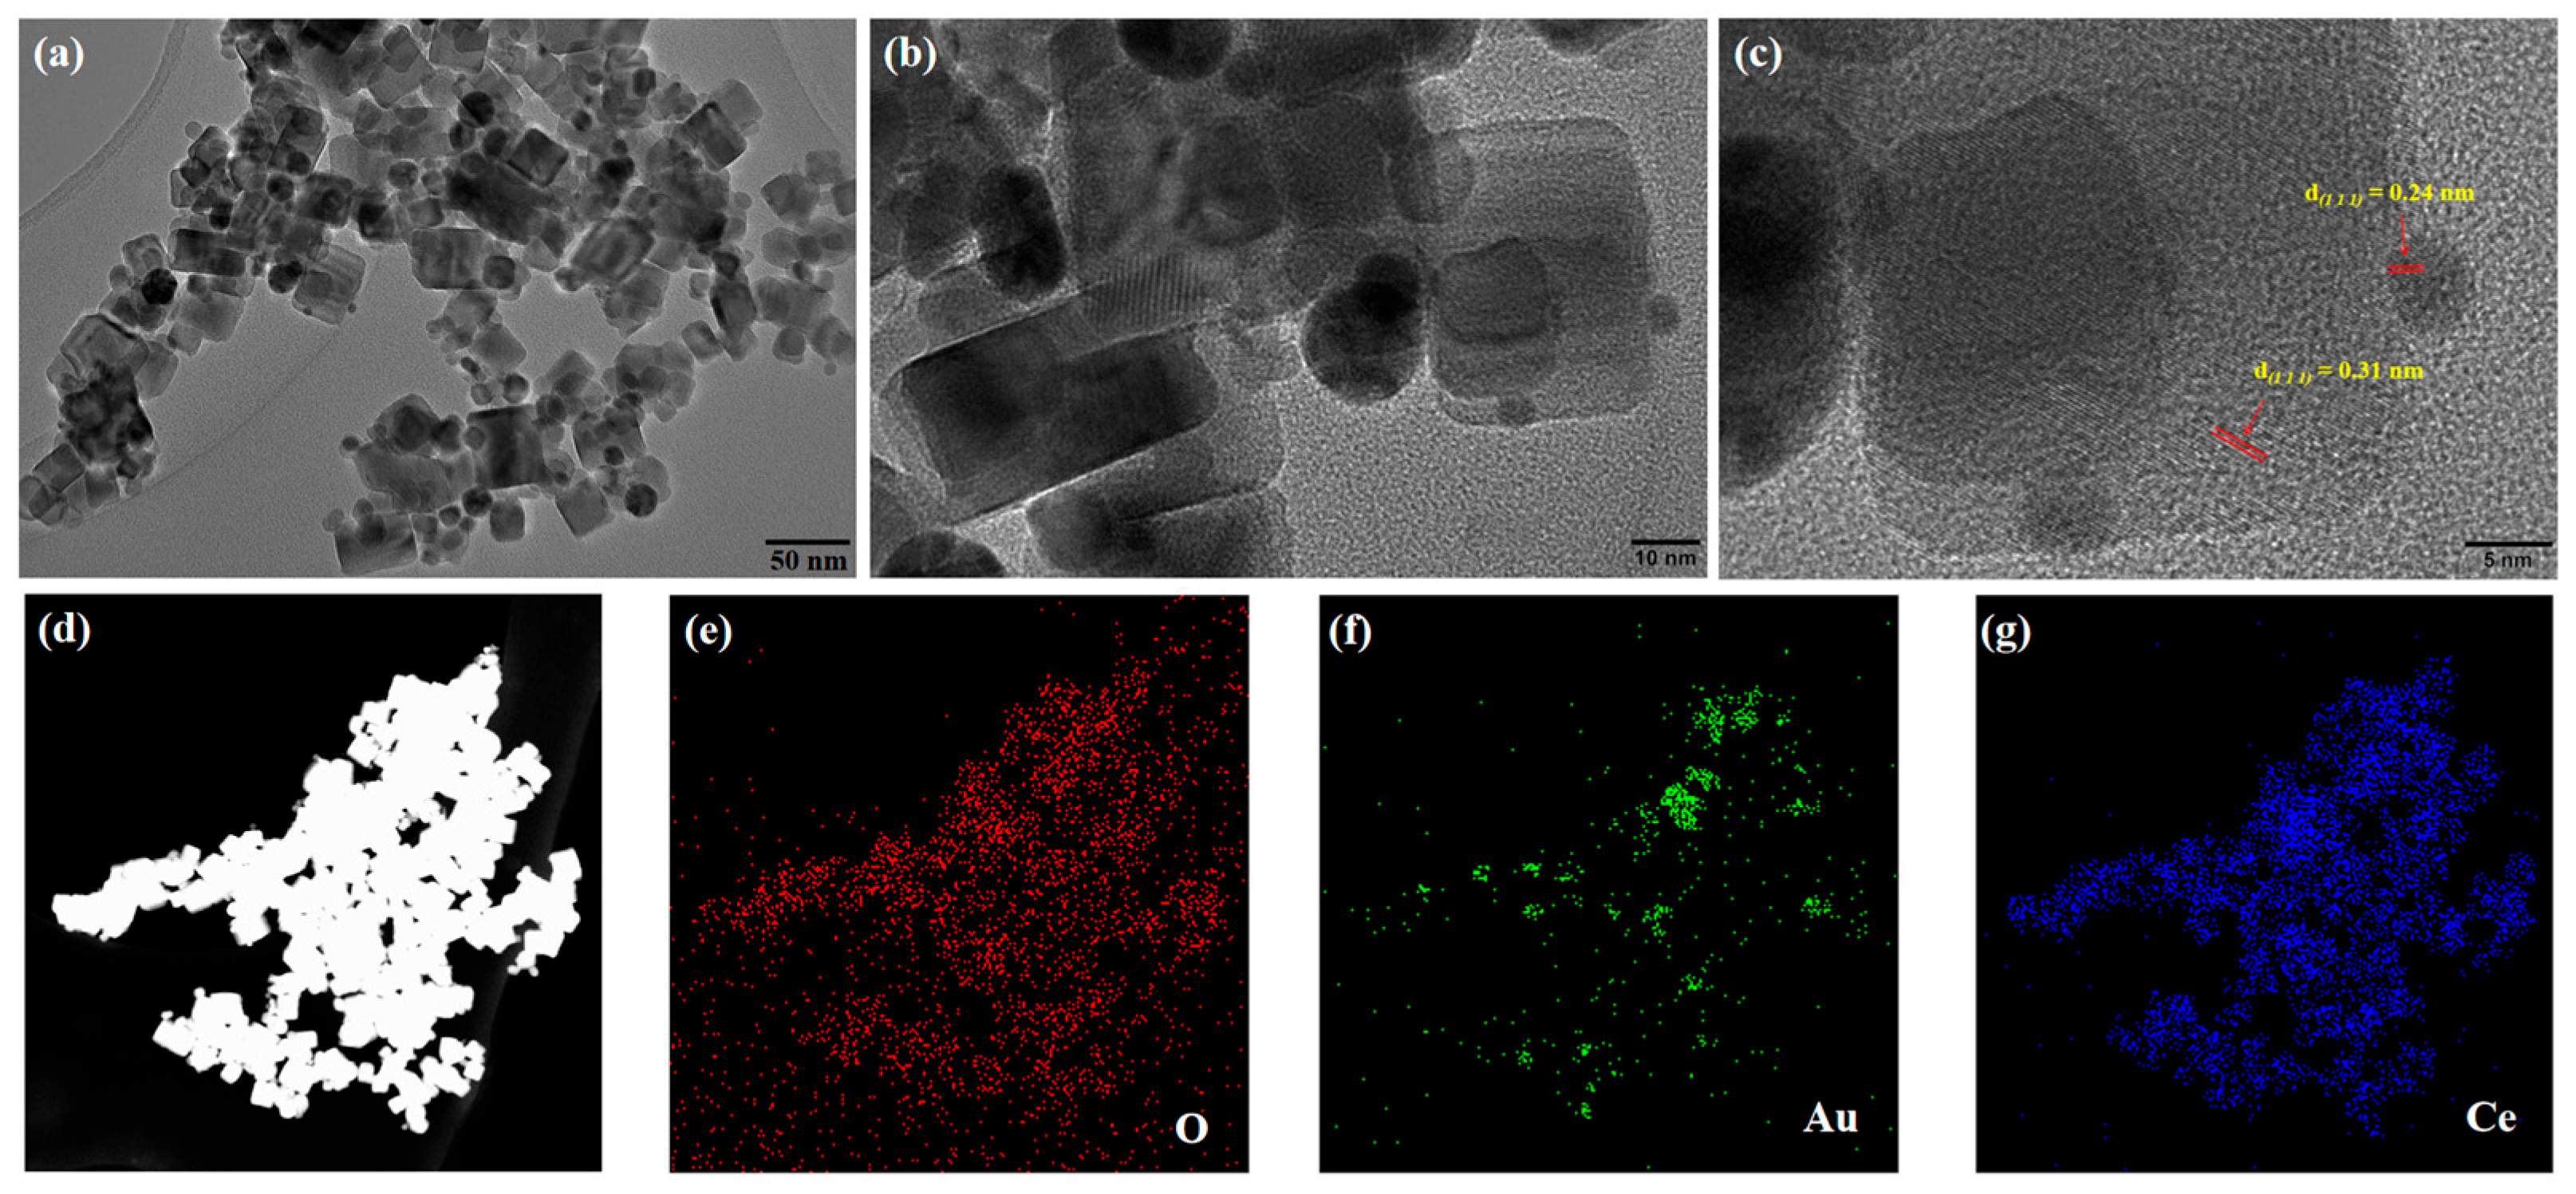
Ultra-high-resolution transmission electron microscopy (UHRTEM) was used to analyze the surface morphology of Au-CeO2 NCs, and the image is shown in Figure 2. The CeO2 has a regular shape, and the sample size ranges between 20 and 30 nm. It can be further observed that the surface of CeO2 nanocubes is loaded with plenty of Au nanoparticles with a particle size range of from 5 to 25 nm. UHRTEM images confirmed that the prepared CeO2 were nanocubes, and the surface of the CeO2 cubes was successfully loaded with many Au nanoparticles. The lattice spacing of CeO2 and Au is shown in Figure 2c. The lattice spacing of CeO2 is 0.31 nm, corresponding to the (1 1 1) crystal plane of CeO2. The lattice spacing of Au is 0.24 nm, corresponding to the (1 1 1) crystal plane of Au.
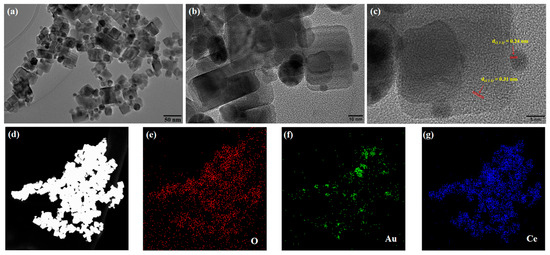
Figure 2.
(a–c) UHRTEM and (d–g) EDS of Au-CeO2 NC.
The element composition of Au-CeO2 NC was characterized by an energy-dispersive spectrum (EDS). Figure 2d–g shows the element spectra of the Au-CeO2 NCs in the mapping mode. Figure 2d shows the morphology of Au-CeO2 NCs under dark-field scanning. Figure 2e–g corresponds to O, Au, and Ce elements, respectively. Figure 2e,g shows that the O and Ce elements are uniformly distributed, which proves that the nanocube is CeO2. It can be seen in Figure 2f that Au elements are distributed in nanocubes and aggregate in some regions forming circular regions, which shows that Au nanoparticles are loaded in CeO2 nanocubes with particle shapes. The results of EDS show that the sample is composed of the three elements, O, Ce, and Au, which is consistent with the UHRTEM results. Therefore, the sample was Au-CeO2 NCs. In addition, the atomic percentage of the Au element is 5.44%, the atomic percentage of the O element is 59.64%, and the Ce element is 34.92%. The atomic ratio of Ce and O is close to 1:2, which is in agreement with the theoretical atomic ratio of CeO2.
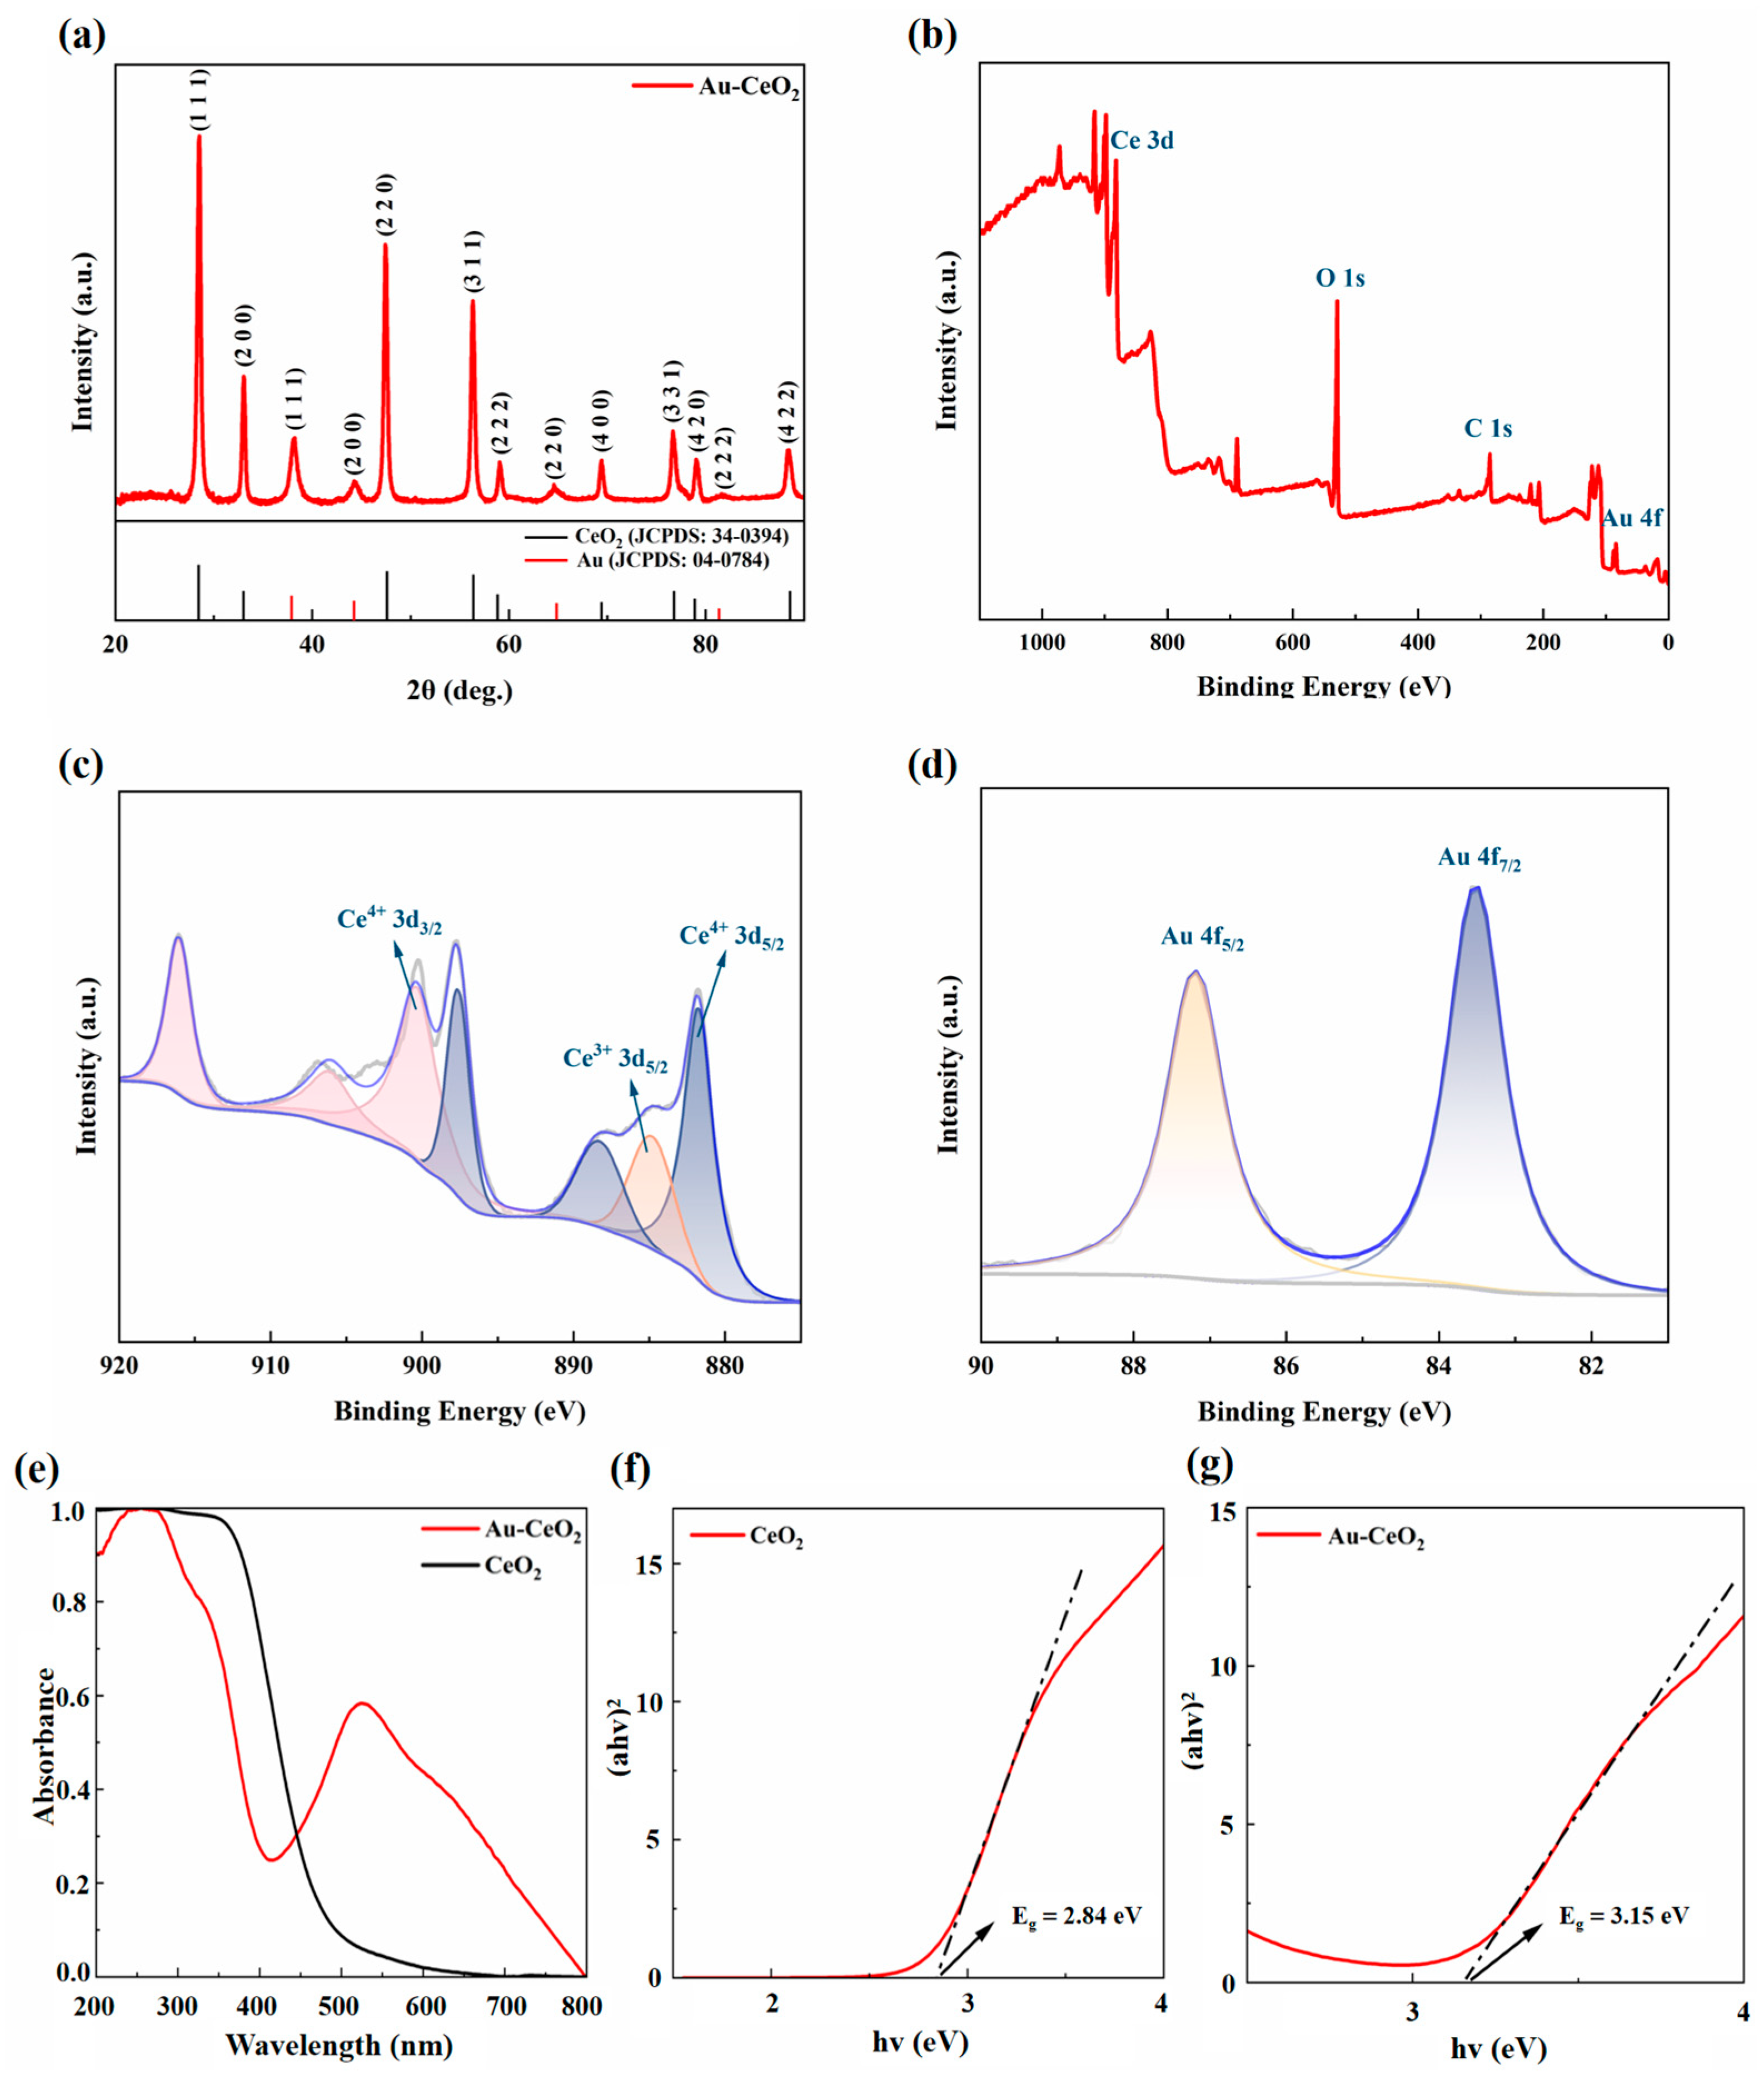
Powder XRD (XRD) was used to detect the crystal phase of the nanostructure of the CeO2 and Au composite (Figure 3a). The XRD diagram for the Au-CeO2 shows that the XRD pattern precisely matches the monoclinic phase of both CeO2 and Au, respectively. The bottom of Figure 3a is marked with the corresponding peaks of the CeO2 and Au standard cards, where the black lines correspond to the CeO2 standard card (JCPDS:34-0394) and the red lines correspond to the Au standard card (JCPDS:04-0784). It can be seen that some of peaks are matched with CeO2 standard cards; the peaks at 2θ = 28.4°, 34.0°, 47.3°, 56.1°, 58.9°, 69.2°, 76.5°, 78.8°, and 88.0° corresponding to crystal faces (111), (200), (220) (311), (222), (400), (331), (420), and (422) of CeO2, respectively. Other peaks are matched with the Au standard cards; the peaks at 2θ = 38.1°, 44.4°, 64.7°, and 69.1° corresponded to the crystal faces of (111), (200), (220), and (311). The Au peaks are weaker than those of CeO2, indicating that the size of Au nanoparticles was smaller than that of CeO2. These high-intensity diffraction peaks indicate that the sample has high crystallinity, and there are no diffraction peaks of other related crystals, indicating that the sample is pure Au-CeO2 NCs. The crystalline size of CeO2 NCs and Au NPs were calculated using the Debye—Scherrer formula, as follows [44]:
where K is 0.89 taken as a shape factor, λ is the wavelength of the X-ray used (Cu Kα = 0.1541 nm), β is full width at half-maximum (FWHM) of CeO2 NCs or Au NPs, and θ is the diffraction angle. We calculated the crystalline sizes of the (111), (200), (220), (311), (222), (400), (331), (420), and (422) planes of CeO2 NCs to be 20.8 nm, 22.8 nm, 22.6 nm, 23.0 nm, 24.8 nm, 28.3 nm, 19.7 nm, 28.3 nm, and 21.1 nm, respectively. So, the average crystalline size of CeO2 NCs is 23.5 nm, which is consistent with the TEM results. The crystalline sizes of the planes (111), (200), (220), and (222) of Au NPs are 9.8 nm, 8.9 nm, 9.0 nm, and 9.9 nm, which indicates that the average crystalline size of Au NPs is 9.4 nm and is also consistent with the TEM results.
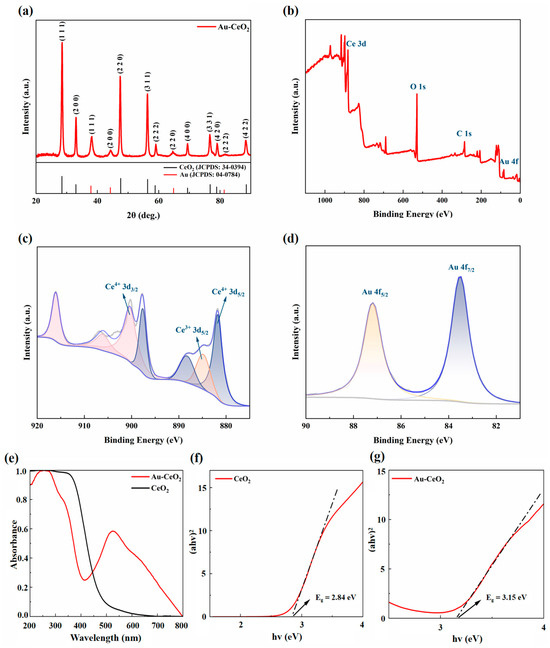
Figure 3.
(a) XRD patterns of Au-CeO2 NCs, XPS (b) full spectrum (c) Ce 3d and (d) Au 4f of Au-CeO2 NCs, (e) UV–vis spectra and (f,g) band gap map of CeO2 NCs and Au-CeO2 NCs.
The texture coefficient (TC) can be calculated by XRD results; the formula is as follows [45]:
where I(hkl) is the measured (hkl) peak intensity and I0(hkl) is the standard peak intensity. Three diffraction peaks were selected, corresponding to the 2θ values of (111), (200), and (220). The maximum diffraction peak of TC indicates the preferred orientation of the material. After the calculation, the TCs of crystal faces (111), (200), and (220) of CeO2 are 19.97%, 16.33%, and 63.69%, respectively. Thus, the preferred oriented crystal face of CeO2 is (220). The TCs of three crystal faces of Au are 36.64%, 24.59%, and 38.77%; the preferred oriented crystal face is (220).
X-ray photoelectron spectroscopy (XPS) is used to analyze the composition and oxidation state of the Ce and Au atoms in the Au-CeO2 NCs. Peak fittings were performed using Advantage software and charge calibration was performed by C 1s at 284.8 eV peaks. Figure 3b shows the full spectrum of the XPS of Au-CeO2 NCs, and the survey spectrum proves the presence of Ce, O, and Au elements. Figure 3c is the spectrum diagram of Ce 3d. There are two valence states for the Ce element by peak fitting Ce3+ and Ce4+. The purple peaks in Figure 3c are located at the lower binding energy (881.8 eV, 888.4 eV, 897.7 eV) attributed to the characteristic peak of Ce4+ 3d5/2, and the yellow peak (884.9 eV) attributed to Ce4+ 3d5/2. The pink peaks (900.4 eV, 906.3 eV, 916.2 eV) located at the higher binding energy are attributed to Ce4+ 3d3/2 [46]. The ratio of Ce3+/Ce4+ was 0.145; it is obvious that the predominant oxidation state of Ce on the surface was Ce4+, and Ce3+ is attributed to oxygen vacancies on the CeO2 surfaces [47]. Figure 3d displays the XPS spectra for Au 4f5/2 and Au 4f7/2. The main characteristic peaks located at a binding energy of 83.5 eV and 87.2 eV correspond to metallic Au (Au0) [48]. On the basis of these results, it can be confirmed that Au-CeO2 has been synthesized successfully. In addition, the XPS spectrum shows an Au/Ce atomic ratio of 1/10, as well as nanocubes having a Ce/O atomic ratio of 1/2.
UV–vis was used to analyze the optical properties of Au-CeO2 NCs. The wavelength ranges from 200 to 800 nm, as shown in Figure 3e. It shows that the absorption wavelength range of pure CeO2 NCs is from 200 to 450 nm, which could absorb all ultraviolet light and a small part of visible light with a wavelength of less than 500 nm. The UV–vis spectra of the Au-CeO2 NCs show a brand absorption peak at 525 nm and the absorption wavelength range is from 200 nm to 800 nm, which proves that the composite nanocubes can absorb all ultraviolet light and almost all of the visible light. It demonstrates that the Au NP loaded on CeO2 nanocubes significantly broadens and enhances the light absorption wavelength range of CeO2. The expansion of the light absorption wavelength range is related to the surface plasmon resonance effect of Au NPs on the surface of CeO2 NCs. Figure 3f,g shows the band gap map of CeO2 NCs and Au-CeO2 NCs calculated by the Tauc formula as follows [49,50]:
where α is the absorption coefficient, h is the Planck constant, ν is the radiation frequency, A is a constant, and Eg is the optical band gap. For direct semiconductors, n is 2.
The band gaps of Au-CeO2 nanocubes and CeO2 nanocubes are 3.15 eV and 2.84 eV [51,52], respectively, which are consistent with reports and indicate that the forbidden bandwidth of Au-CeO2 nanocubes became narrower than that of CeO2 nanocubes, and the narrower forbidden bandwidth made catalysts easier to be excited, resulting in a better photocatalytic effect.
3.2. SERS Properties of Au-CeO2 NCs
Methylene blue (MB) and crystal violet (CV) were used as probe molecules to evaluate the SERS properties of Au-CeO2 nanocubes as SERS substrates. Au-CeO2 NCs were used as the SERS substrate to fully adsorb MB solution with a 10−3~10−8 M concentration and CV solution with a 10−6~10−8 M concentration and were then dispersed uniformly on the silicon wafer. Raman experiments were performed at an excitation wavelength of 633 nm and a power of 0.5 mW. The results are shown in Figure 4.
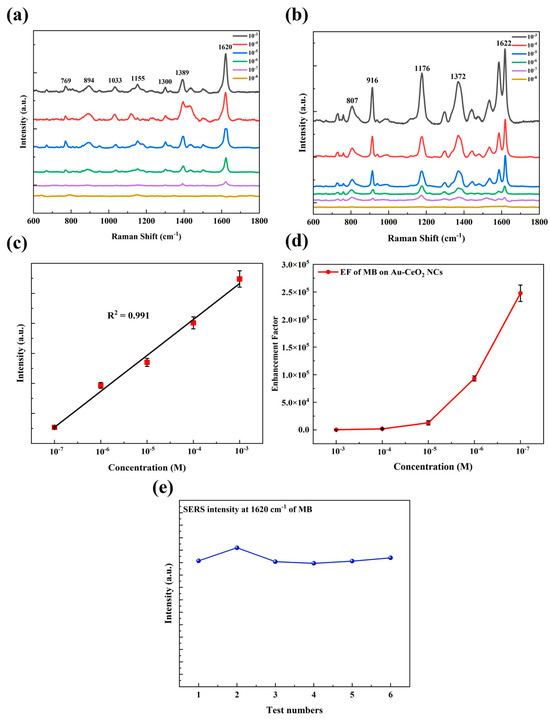
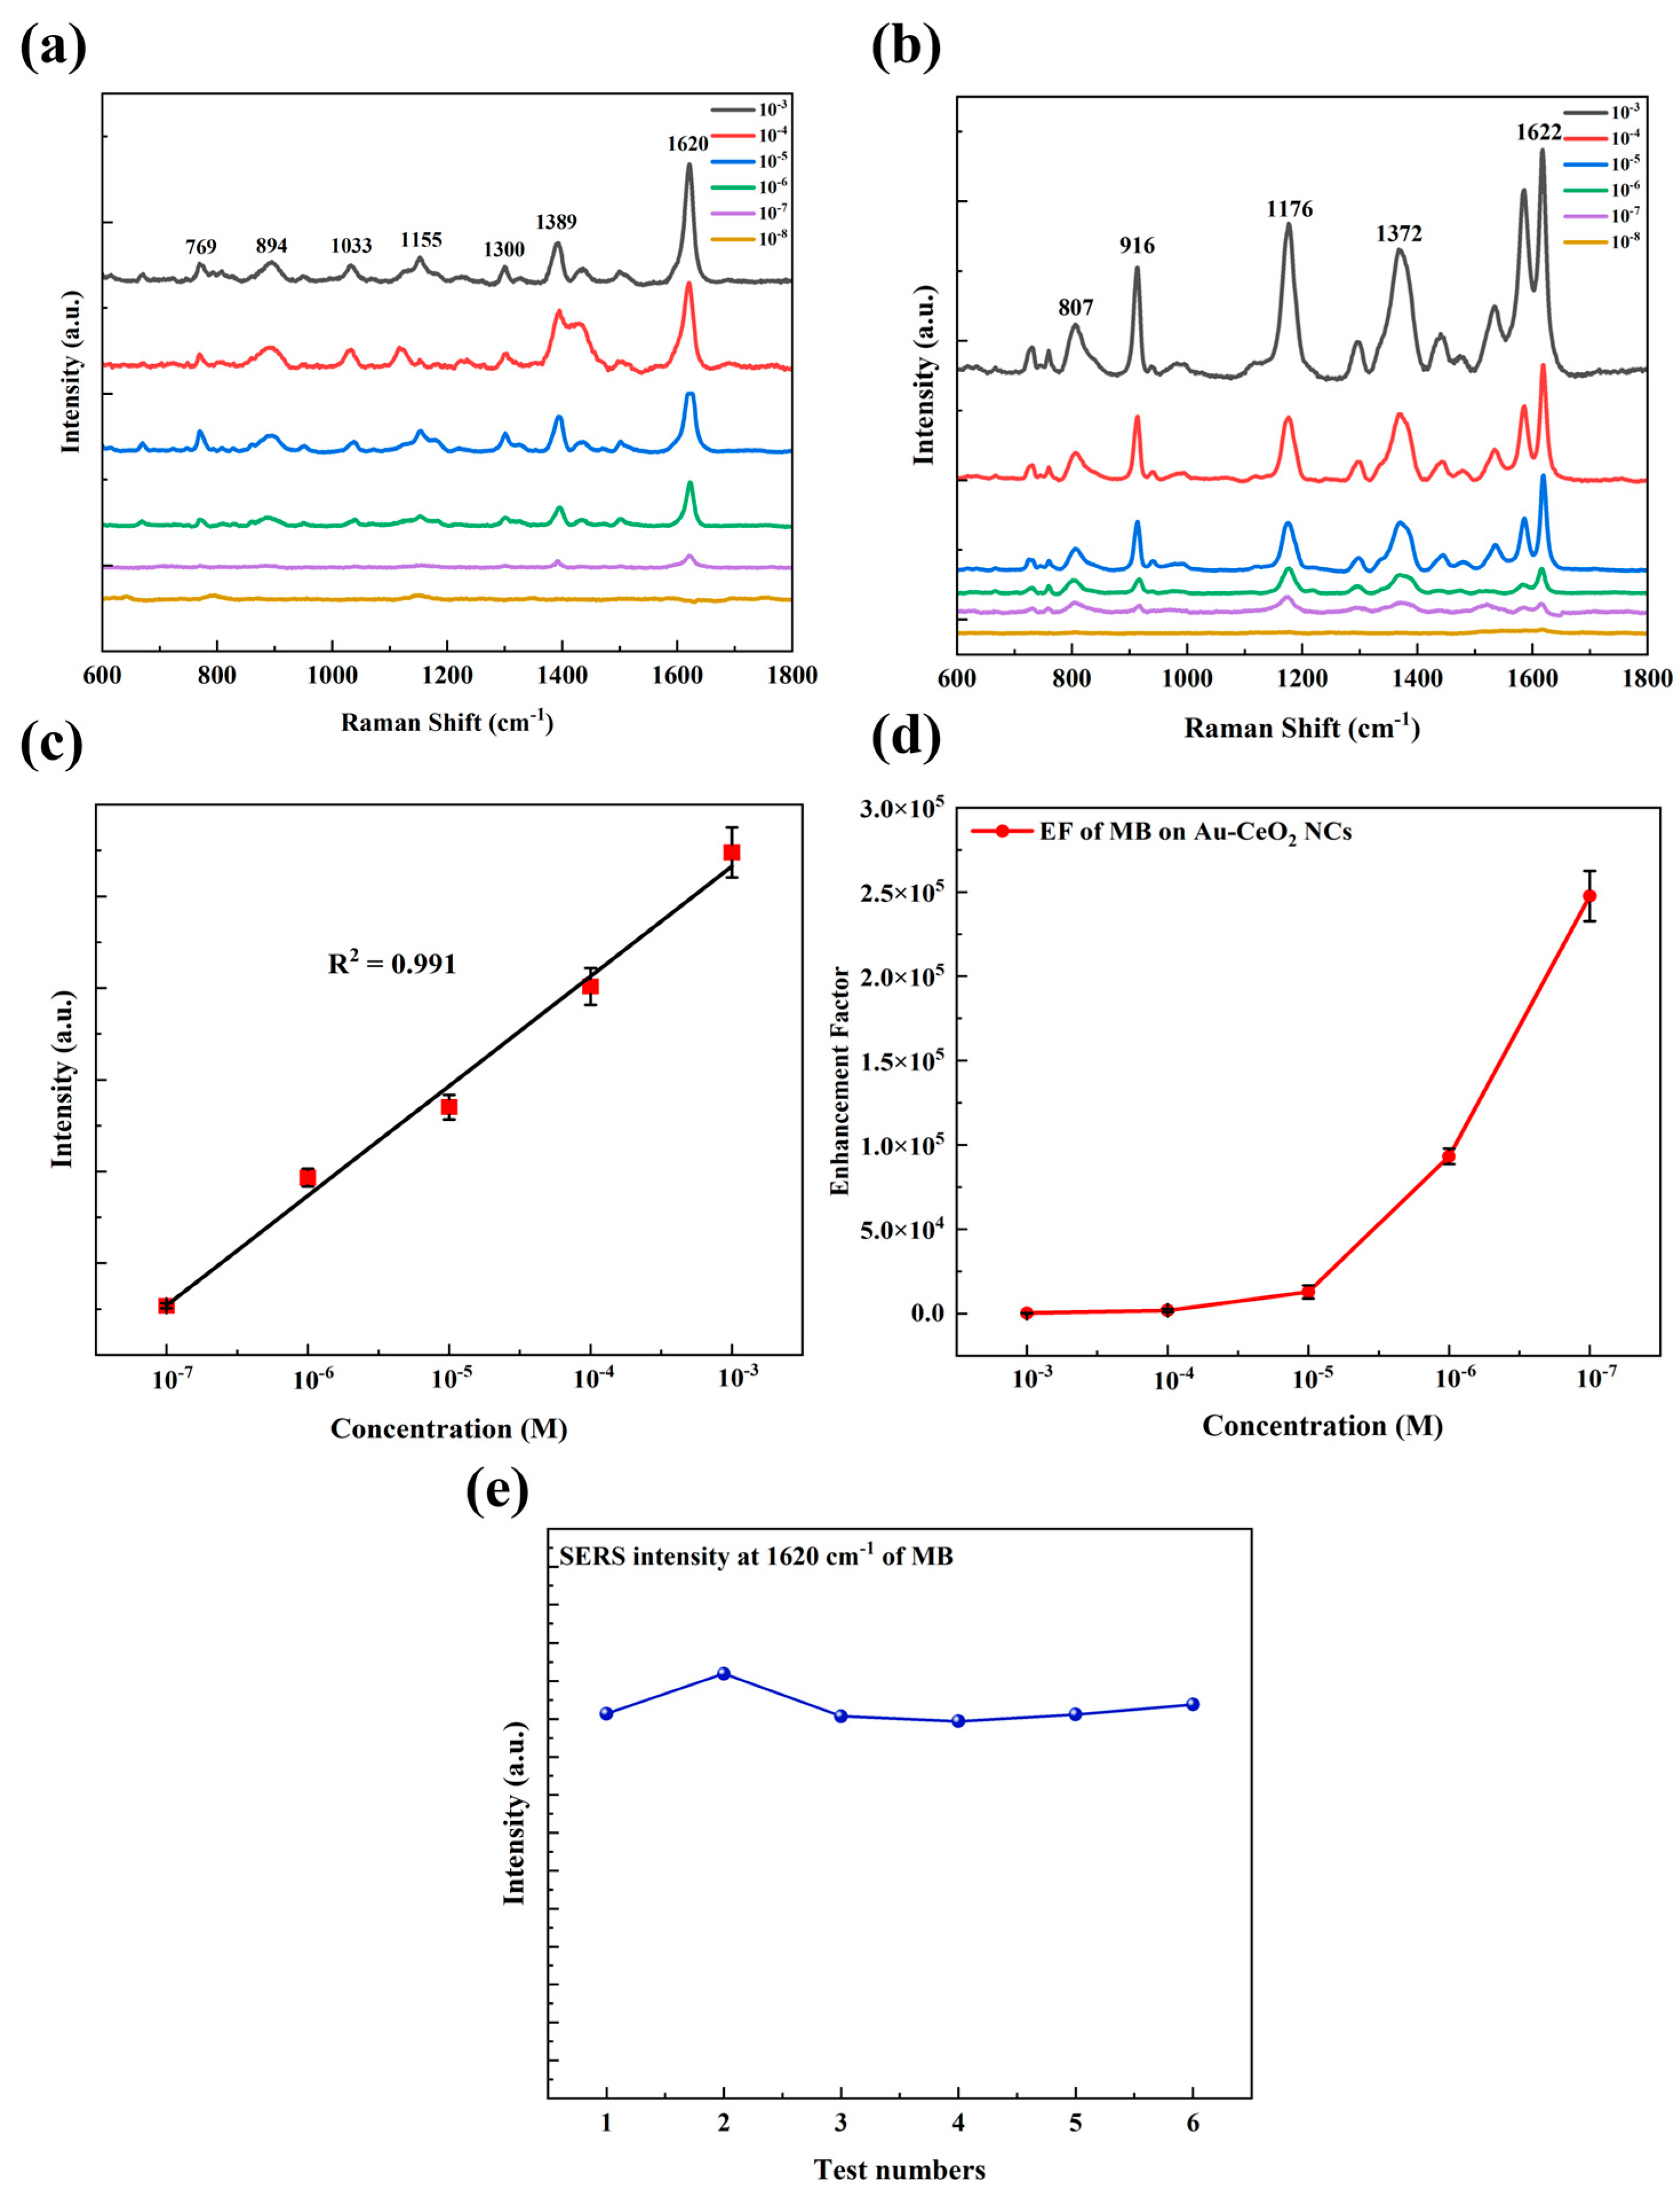
Figure 4.
SERS spectra of (a) MB (10−3–10−8 M) and (b) CV (10−3–10−8 M) absorbed in Au-CeO2 NCs; (c) the linear correlation of MB of Raman intensity at 1620 cm−1 with the concentration changing from 10−7 M to 10−3 M, (d) EF of MB with the concentration from 10−7 M to 10−3 M, (e) the SERS intensity corresponding to MB at 1620 cm−1 with the concentration of 10−6 M in six test.
As shown in Figure 4a,b, in the concentration range of 10−3~10−7 M, the Raman scattering peak of MB is clear and distinct, consistent with the standard Raman characteristic peak of MB (769, 894, 1033, 1155, 1300, 1389, 1620 cm−1) [53], and the minimum detection limit is 10−7 M. The typical peaks at 769 cm−1 and 894 cm−1 are attributed to out-of-plane ring C-H bending, the peaks at 1033 cm−1 and 1155 cm−1 are attributed to in-plane ring C-H bending, the peaks at 1300 cm−1 and 1389 cm−1 are attributed to C-N stretching vibration, and the peak at 1620 cm−1 is attributed to C=C stretching vibration. The Raman enhancement factor (EF) is the key factor in measuring the sensitivity of a SERS substrate. The enhancement factor (EF) with the concentration of MB from 10−7 M to 10−3 M is shown in Figure 3d, and the maximum enhancement factor (EF) is 2.6 × 10⁵. With the decrease in concentration, the EF of MB increased exponentially. As a result, the Raman peaks of CV (807, 916, 1176, 1372, 1622 cm−1) [54] were consistent with the standard characteristic peaks of CV within the concentration range of 10−6~10−8 M. The typical peak at 807 cm−1 is attributed to out-of-plane ring C-H bending, the peak at 916 cm−1 is attributed to ring skeletal vibration of radial orientation, 1176 cm−1 is attributed to in-plane ring C-H bending, and the peaks at 1372 cm−1 and 1622 cm−1 are attributed to ring C-C stretching. The minimum detection limit was found to be 10−7 M, with a maximum enhancement factor of 3.7 × 10⁴. The results showed quite good Raman enhancement effects on these organic molecules of Au-CeO2 nanocubes. As shown in Figure 4a, the peak at 1620 cm−1, which is the most prominent for MB, was chosen as the representative peak for the quantitative analysis of MB content. The relationship between the peak intensity at 1620 cm−1 and the concentration of MB can be calculated as y = 5897.1 x − 15271.5 with a determination coefficient of determination (R2) of 0.991. The high coefficient of determination indicates a significant linear correlation between the peak intensity and the concentration of MB. Figure 4e shows the SERS intensity corresponding to MB at 1620 cm−1 with a concentration of 10−6 M in six tests. It was shown that, after six tests, the SERS intensity was at a higher position, and the average SERS intensity of six tests was 10308, which demonstrates that Au-CeO2 nanocubes as SERS substrates have excellent stability and reproducibility.
3.3. SERS Enhancement Mechanism
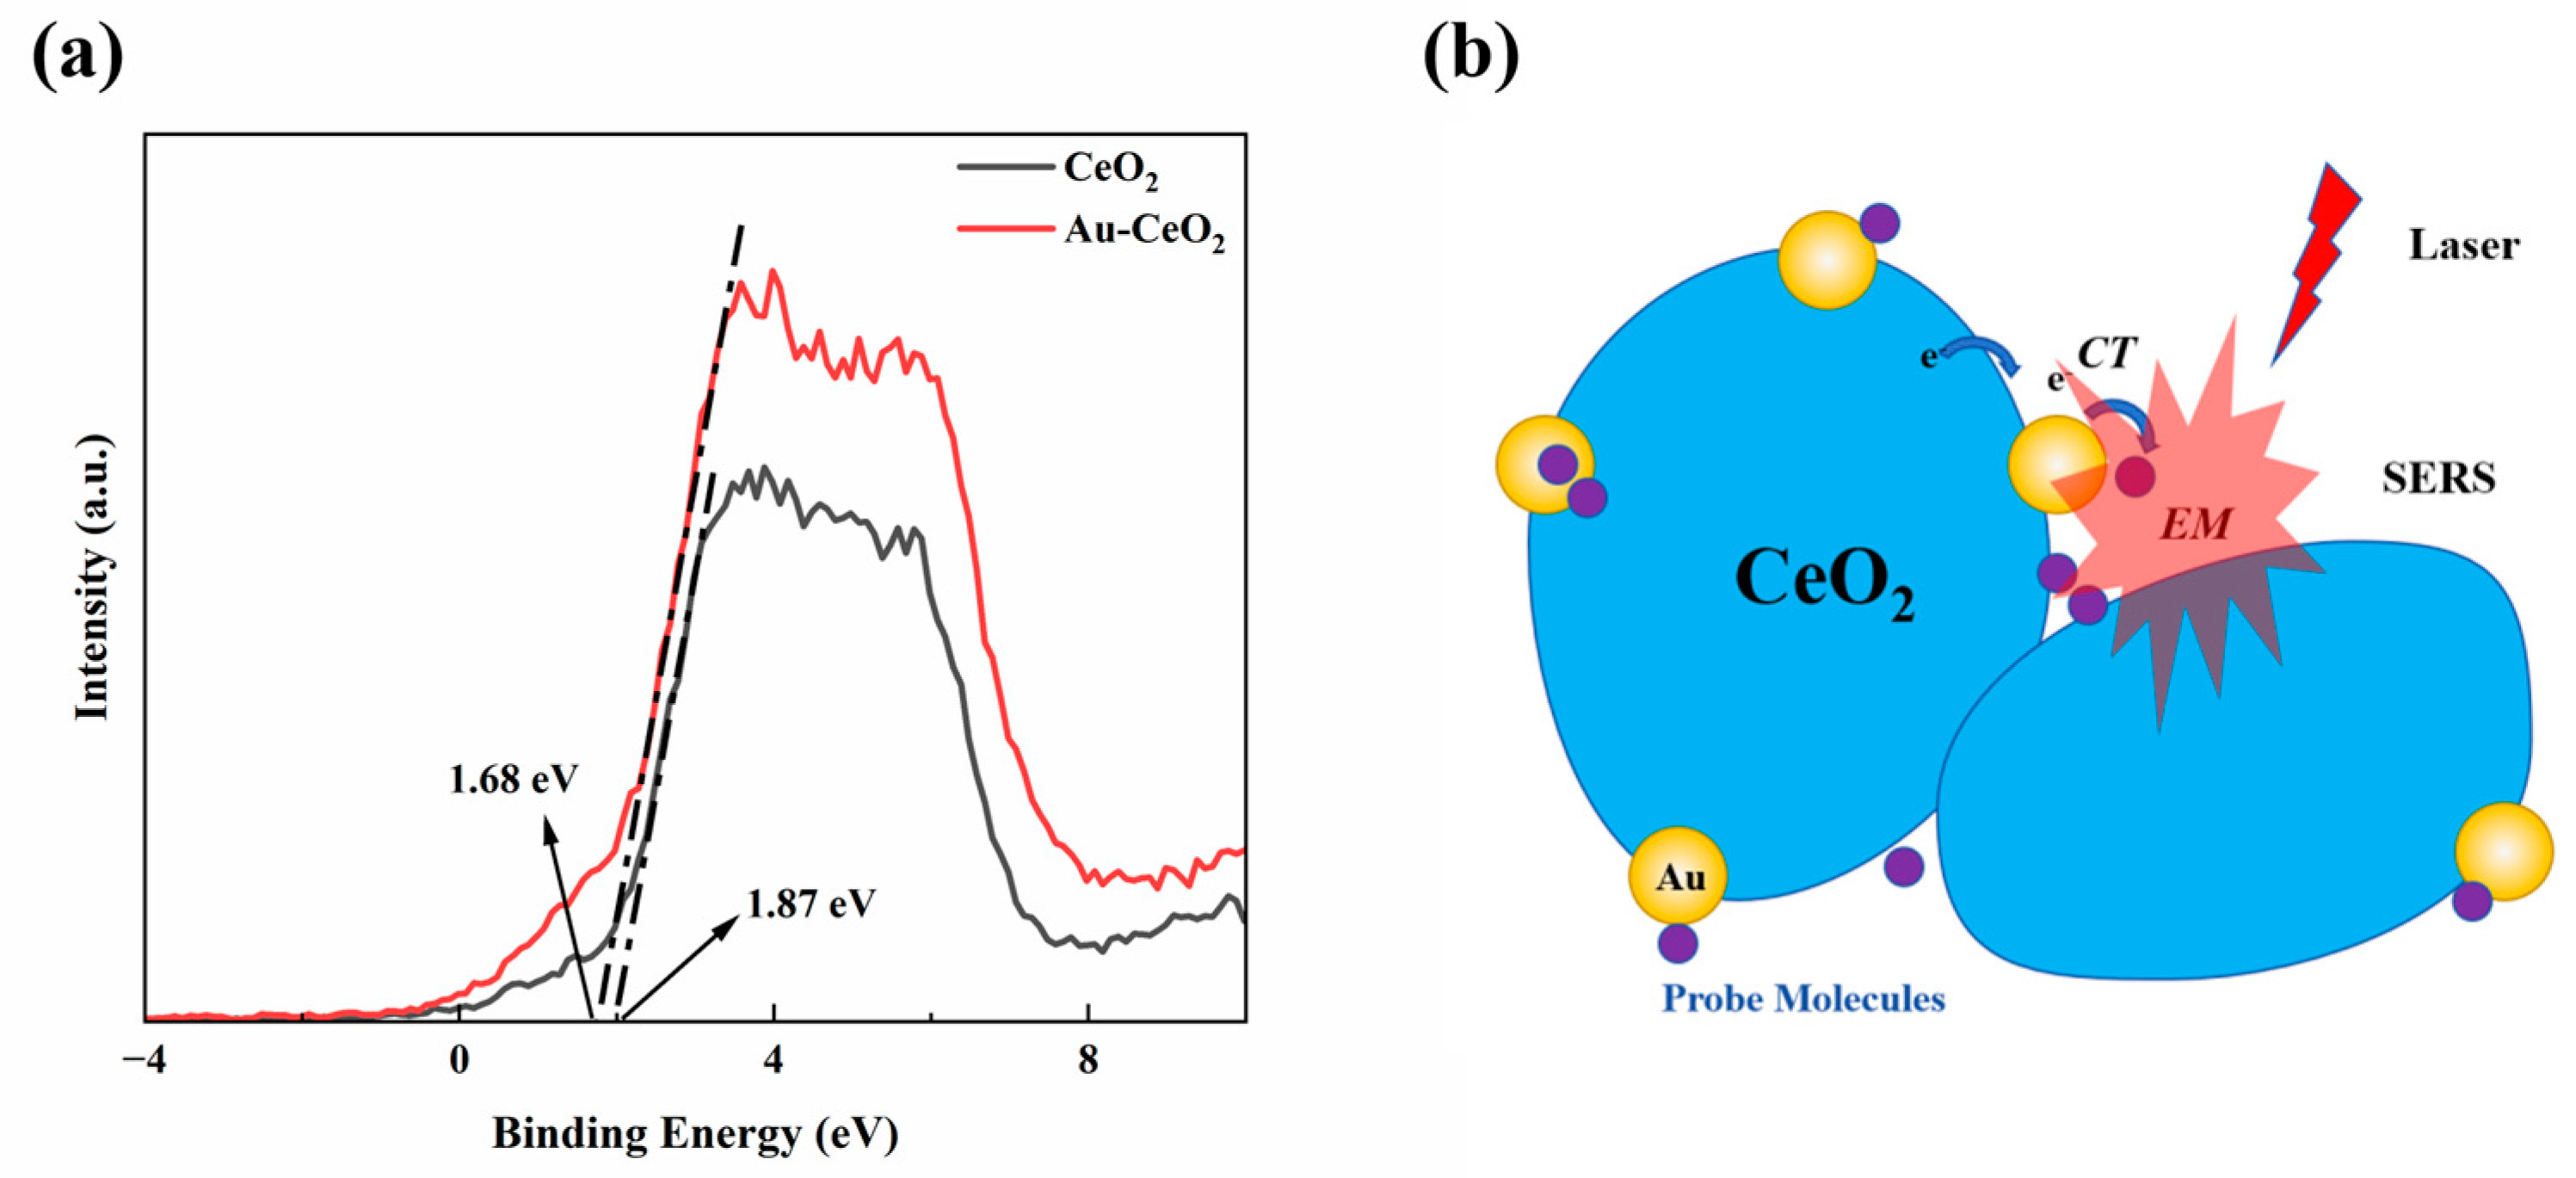
XPS analysis was conducted to obtain the valence band spectra, which were used to determine the positions of both conduction band (CB) and valence band (VB) positions, as shown in Figure 5a. The valence band of Au-CeO2 nanocubes was located at an energy level of 1.44 eV [55] (VB(Vs NHE)= Ф + 1.68 − 4.44 = 4.2 + 1.68 − 4.44 = 1.44 eV, indicating that the conduction band (CB) of CeO2 was positioned above the Fermi level of gold nanoparticles (0.75 V). Based on the above data and previous reports, a Raman enhancement mechanism for the Au-CeO2 nanocubes is proposed, as illustrated in Figure 5b. It is widely accepted that EM enhancement plays a dominant role in SERS enhancement. The EM enhancement is closely related to metal nanostructures, particularly hotspots such as nanospheres or nanorods. However, probe molecules that are bound to a single hotspot typically generate weak SERS signals. To enhance SERS activity, coupled nanostructures should be considered [48]. For example, Au nanoparticles with extremely small nanogaps have shown remarkable SERS performance. In this work, the prepared Au/CeO2 nanocubes demonstrated considerably improved SERS performance over pure Au nanoparticles, primarily attributed to the coupling effect between the CeO2 nanocubes. With these nanostructures, more junctions appeared between Au/CeO2 materials, which can act as hotspots because organic molecules may directly interact with the metallic excited-state wave function. In addition to the enhancements in EM and CT, the oxygen ions adsorbed on the surface are also believed to enhance the SERS effect due to the O–O vibrations.
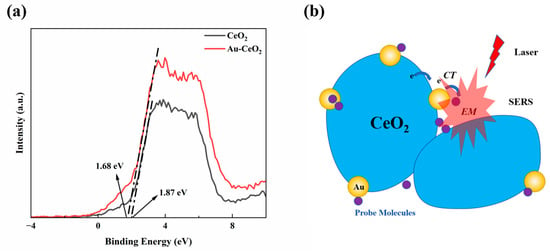
Figure 5.
(a) XPS valence band spectra (b) SERS mechanism of the Au-CeO2 NC.
4. Conclusions
In summary, we created a kind of novel Au-CeO2 nanocube composed of Au nanoparticles and CeO2 nanocubes, which could be used as a SERS substrate for organic molecules. CeO2 nanocubes were synthesized by simple hydrothermal synthesis, followed by a subsequent reduction to load Au nanoparticles onto the surface of CeO2 nanocubes. The nanocubes composed of CeO2 combined with gold nanoparticles demonstrate surface plasmon resonance (SPR) effects within the visible light range. Compared to CeO2 nanocubes without gold nanoparticles, the Au-CeO2 composite nanocubes could exhibit quite good surface-enhanced Raman scattering performance using methylene blue (MB) and crystal violet (CV) as probe molecules. The Au-CeO2 nanocubes show potential applications in Raman detection. In the future, we will explore the optoelectronic properties of Au-CeO2 nanocubes and their applications as chemical and biosensing materials.
Author Contributions
Synthesis and characterizations, Raman test and analysis, writing—original draft, X.T.; supervision, funding acquisition, Raman test and analysis, writing—original draft, writing—review and editing, L.R.; Raman analysis, writing—review and editing, J.H.; writing—review and editing. G.X.; characterizations analysis, F.C.; funding acquisition, writing—review and editing., G.W. All authors have read and agreed to the published version of the manuscript.
Funding
This research was funded by the Natural Science Foundation of Zhejiang Province (Grant No. LQ20B020011, No. LD24E010003), the National Natural Science Foundation of China (62474166), the Shaoxing Science and Technology Planning Project of Zhejiang Province (No. 2023B41015), the Fundamental Research Funds for the Provincial Universities of Zhejiang (No. 2022YW63 and No. 2022YW83), and China Jiliang University.
Institutional Review Board Statement
Not applicable.
Informed Consent Statement
Not applicable.
Data Availability Statement
The data that support the findings of this study are available from the corresponding author upon reasonable request.
Conflicts of Interest
The authors declare no conflicts of interest.
Abbreviations
The following abbreviations are used in this manuscript:
| SERS | Surface-enhanced Raman Scattering |
| MB | Methylene Blue |
| CV | Crystal Violet |
| LD | Linear dichroism |
References
- Waghchaure, R.H.; Adole, V.A.; Jagdale, B.S. Photocatalytic degradation of methylene blue, rhodamine B, methyl orange and eriochrome black T dyes by modified ZnO nanocatalysts: Aconcise review. Inorg. Chem. Commun. 2022, 143, 109764. [Google Scholar]
- Elamin, M.R.; Abdulkhair, B.Y.; Elzupir, A.O. Removal of ciprofloxacin and indigo carminefrom water by carbon nanotubes fabricated from a low-cost precursor: Solution parametersand recyclability. Ain Shams Eng. J. 2023, 14, 101844. [Google Scholar]
- Wang, C.C.; Li, J.R.; Lv, X.L.; Zhang, Y.Q.; Guo, G. Photocatalytic organic pollutants degradation inmetal–organic frameworks. Energ. Environ. Sci. 2014, 7, 2831–2867. [Google Scholar]
- Bolisetty, S.; Peydayesh, M.; Mezzenga, R. Sustainable technologies for water purification from heavy metals: Review and analysis. Chem. Soc. Rev. 2019, 48, 463–487. [Google Scholar]
- Cinquina, A.L.; Longo, F.; Anastasi, G.; Giannetti, L.; Cozzani, R. Validation of a high-performance liquid chromatography method for the determination of oxytetracycline, tetracycline, chlortetracycline and doxycycline in bovine milk and muscle. J. Chromatog. A 2003, 987, 227–233. [Google Scholar]
- Samanidou, V.F.; Nikolaidou, K.I.; Papadoyannis, I.N. Development and validation of an HPLC confirma-tory method for the determination of tetracycline antibiotics residues in bovine muscle according to the European Union regulation 2002/657/EC. J. Sep. Sci. 2005, 28, 2247–2258. [Google Scholar]
- Fritz, J.W.; Zuo, Y. Simultaneous determination of tetracycline, oxytetracycline, and 4-epitetracycline in milk by high-performance liquid chromatography. Food Chem. 2007, 105, 1297–1301. [Google Scholar]
- Van Ruth, S.; Boscaini, E.; Mayr, D.; Pugh, J.; Posthumus, M. Evaluation of three gas chromatography and two direct mass spectrometry techniques for aroma analysis of dried red bell peppers. Int. J. Mass Spectrom. 2003, 223, 55–65. [Google Scholar]
- Maurer, H.H. Position of chromatographic techniques in screening for detection of drugs or poisons in clinical and forensic toxicology and/or doping control. Clin. Chem. Lab. Med. 2004, 42, 1310–1324. [Google Scholar]
- Biscevic-Tokic, J.; Tokic, N.; Ibrahimpasic, E. Chromatography as method for analytical confirmation of paracetamol in postmortem material together with psychoactive substances. Acta Inform. 2015, 23, 322. [Google Scholar]
- Poole, C. Gas Chromatography; Elsevier: Amsterdam, The Netherlands, 2021. [Google Scholar]
- Du, J.K.; Shi, J.S.; Sun, X.J.; Wang, J.S.; Xu, Y.Z.; Wu, J.G.; Zhang, Y.F.; Weng, S.F. Fourier transform infrared spectroscopy of gallbladder carcinoma cell line. Hepatob. Pancreat. Dis. 2009, 8, 75–78. [Google Scholar]
- Guo, Y.; Liu, C.; Ye, R.; Duan, Q. Advances on water quality detection by uv-vis spectroscopy. Appl. Sci. 2020, 10, 6874. [Google Scholar] [CrossRef]
- Cui, J.J.; Wang, L.Y.; Tan, Z.R.; Zhou, H.H.; Zhan, X.; Yin, J.Y. Mass Spectrometry-Based Personalized Drug Therapy. Mass Spectrom. Rev. 2020, 39, 523–552. [Google Scholar] [CrossRef] [PubMed]
- Chu, Y.; Zhou, J.; Ge, D.; Lu, Y.; Zou, X.; Xia, L.; Huang, C.; Shen, C.; Chu, Y. Variable VOCs in plastic culture flasks and their potential impact on cell volatile biomarkers. Anal. Bioanal. Chem. 2020, 412, 5397–5408. [Google Scholar] [CrossRef]
- Borden, S.A.; Palaty, J.; Termopoli, V.; Famiglini, G.; Cappiello, A.; Gill, C.G.; Palma, P. Mass spectrometry analysis of drugs of abuse: Challenges and emerging strategies. Mass Spectrom. Rev. 2020, 39, 703–744. [Google Scholar] [CrossRef]
- Beneito-Cambra, M.; Moreno-González, D.; García-Reyes, J.F.; Bouza, M.; Gilbert-López, B.; Molina-Díaz, A. Direct analysis of olive oil and other vegetable oils by mass spectrometry: A review. TrAC-Trend. Anal. Chem. 2020, 132, 116046. [Google Scholar] [CrossRef]
- Ma, X.; Jiang, L.; Li, X.; Li, B.; Huang, J.; Sun, J.; Wang, Z.; Xu, Z.; Qu, L.; Lu, Y.; et al. Hybrid superhydrophilic–superhydrophobic micro/nanostructures fabricated by femtosecond laser-induced forward transfer for sub-femtomolar Raman detection. Microsyst. Nanoeng. 2019, 5, 48. [Google Scholar] [CrossRef]
- Yan, X.; Xu, Y.; Tian, B.; Lei, J.; Zhang, J.; Wang, L. Operando SERS self-monitoring photocatalytic oxidation of aminophenol on TiO2 semiconductor. Appl. Catal. B-Environ. 2018, 224, 305–309. [Google Scholar] [CrossRef]
- Doan, Q.K.; Nguyen, M.H.; Sai, C.D.; Pham, V.T.; Mai, H.H.; Pham, N.H.; Bach, T.C.; Nguyen, V.T.; Nguyen, T.T.; Ho, K.H.; et al. Enhanced optical properties of ZnO nanorods decorated with gold nanoparticles for self cleaning surface enhanced Raman applications. Appl. Surf. Sci. 2020, 505, 144593. [Google Scholar] [CrossRef]
- Ren, X.; Nam, W.; Ghassemi, P.; Strobl, J.S.; Kim, I.; Zhou, W.; Agah, M. Scalable nanolaminated SERS multiwell cell culture assay. Microsyst. Nanoeng. 2020, 6, 47. [Google Scholar] [CrossRef]
- Le-The, H.; Berenschot, E.; Tiggelaar, R.M.; Tas, N.R.; Van Den Berg, A.; Eijkel, J.C. Large-scale fabrication of highly ordered sub-20 nm noble metal nanoparticles on silica substrates without metallic adhesion layers. Microsyst. Nanoeng. 2018, 4, 4. [Google Scholar] [PubMed]
- Zhu, A.; Zhao, X.; Cheng, M.; Chen, L.; Wang, Y.; Zhang, X.; Zhang, Y.; Zhang, X. Nanohoneycomb surface-enhanced Raman spectroscopy-active chip for the determination of biomarkers of hepatocellular carcinoma. ACS Appl. Mater. Interfaces 2019, 11, 44617–44623. [Google Scholar] [PubMed]
- Gao, R.; Zhang, Y.; Zhang, F.; Guo, S.; Wang, Y.; Chen, L.; Yang, J. SERS polarization-dependent effects for an ordered 3D plasmonic tilted silver nanorod array. Nanoscale 2018, 10, 8106–8114. [Google Scholar] [PubMed]
- Sharma, B.; Frontiera, R.R.; Henry, A.I.; Ringe, E.; Van Duyne, R.P. SERS: Materials, applications, and the future. Mater. Today 2012, 15, 16–25. [Google Scholar]
- Chu, H.; Huang, Y.; Zhao, Y. Silver nanorod arrays as a surface-enhanced Raman scattering substrate for foodborne pathogenic bacteria detection. Appl. Spectrosc. 2008, 62, 922–931. [Google Scholar]
- He, L.; Liu, Y.; Lin, M.; Mustapha, A.; Wang, Y. Detecting single Bacillus spores by surface enhanced Raman spectroscopy. J. Food Meas. Charact. 2008, 2, 247–253. [Google Scholar] [CrossRef]
- Lee, K.M.; Herrman, T.J. Determination and prediction of fumonisin contamination in maize by surface–enhanced Raman spectroscopy (SERS). Food Bioprocess Tech. 2016, 9, 588–603. [Google Scholar]
- Janči, T.; Valinger, D.; Kljusurić, J.G.; Mikac, L.; Vidaček, S.; Ivanda, M. Determination of histamine in fish by Surface Enhanced Raman Spectroscopy using silver colloid SERS substrates. Food Chem. 2017, 224, 48–54. [Google Scholar]
- Jiang, N.; Zhuo, X.; Wang, J. Active plasmonics: Principles, structures, and applications. Chem. Rev. 2017, 118, 3054–3099. [Google Scholar]
- Karthick Kannan, P.; Shankar, P.; Blackman, C.; Chung, C.H. Recent advances in 2D inorganic nanomaterials for SERS sensing. Adv. Mater. 2019, 31, 1803432. [Google Scholar] [CrossRef]
- Hu, X.; Bian, X.Z.; Yu, S.; Dan, K. Magnetic Fe3O4@ SiO2@ Ag@ COOHNPs/Au film with hybrid localized surface plasmon/surface plasmon polariton modes for surface-enhanced Raman scattering detection of thiabendazole. J. Nanosci. Nanotech. 2020, 20, 2079–2086. [Google Scholar] [CrossRef]
- Han, D.; Li, B.; Chen, Y.; Wu, T.; Kou, Y.; Xue, X.; Chen, L.; Liu, Y.; Duan, Q. Facile synthesis of Fe3O4@ Au core–shell nanocomposite as a recyclable magnetic surface enhanced Raman scattering substrate for thiram detection. Nanotechnology 2019, 30, 465703. [Google Scholar] [CrossRef] [PubMed]
- Huang, C.; Lu, F.; Xu, K.; Ding, G.; You, L.; Wang, J.; Zhang, Q. Synthesis of magnetic polyphosphazene-Ag composite particles as surface enhanced Raman spectroscopy substrates for the detection of melamine. Chin. Chem. Lett. 2019, 12, 2009–2012. [Google Scholar]
- Joy, N.A.; Nandasiri, M.I.; Rogers, P.H.; Jiang, W.; Varga, T.; Kuchibhatla, S.V.; Thevuthasan, S.; Carpenter, M.A. Selective plasmonic gas sensing: H2, NO2, and CO spectral discrimination by a single Au-CeO2 nanocomposite film. Anal. Chem. 2012, 84, 5025–5034. [Google Scholar] [CrossRef] [PubMed]
- Ibrahim, M.; Ibrahim, H.; Almandil, N.B.; Sayed, M.A.; Kawde, A.N.; Aldaqdouq, Y. A novel platform based on Au− CeO2@ MWCNT functionalized glassy carbon microspheres for voltammetric sensing of val-rubicin as bladder anticancer drug and its interaction with DNA. Electroanalysis 2020, 32, 2146–2155. [Google Scholar] [CrossRef]
- Wang, H.; Jian, M.; Fan, J.; He, Y.; Wang, Z. Scalable synthesis of Au@ CeO2 nanozyme for development of colorimetric lateral flow immunochromatographic assay to sensitively detect heart-type fatty acid binding protein. Talanta 2024, 273, 125852. [Google Scholar] [CrossRef]
- Houlihan, N.M.; Karker, N.; Potyrailo, R.A.; Carpenter, M.A. High sensitivity plasmonic sensing of hydrogen over a broad dynamic range using catalytic Au-CeO2 thin film nanocomposites. ACS Sens. 2018, 3, 2684–2692. [Google Scholar] [CrossRef]
- Chen, P.; Peng, Y.; Lin, L.; Yuan, Y.; Chen, J.; Mo, J.; Miao, J.; He, H.; Jin, Y.; Zhang, L.; et al. Au/CeO2 NR restricted inside Cu-MOFs: A three-in-one artificial enzyme with synergistically enhanced peroxidase-like activity for dual-mode sensing of multiple biomarkers. ACS Sustain. Chem. Eng. 2023, 11, 8106–8119. [Google Scholar] [CrossRef]
- Langer, J.; Jimenez de Aberasturi, D.; Aizpurua, J.; Alvarez-Puebla, R.A.; Auguié, B.; Baumberg, J.J.; Bazan, G.C.; Bell, S.E.; Boisen, A.; Brolo, A.G.; et al. Present and future of surface-enhanced Raman scattering. ACS Nano 2020, 14, 28–117. [Google Scholar] [CrossRef]
- Mai, H.X.; Sun, L.D.; Zhang, Y.W.; Si, R.; Feng, W.; Zhang, H.P.; Liu, H.C.; Yan, C.H. Shape-selective synthesis and oxygen storage behavior of ceria nanopolyhedra, nanorods, and nanocubes. J. Phys. Chem. B 2005, 109, 24380–24385. [Google Scholar] [CrossRef]
- Leung, D.Y.C.; Fu, X.; Ye, D.; Huang, H. Effect of oxygen mobility in the lattice of Au/TiO2 on formaldehyde oxidation. Kinet. Catal. 2012, 53, 239–246. [Google Scholar] [CrossRef]
- Le Ru, E.; Etchegoin, P. Principles of Surface-Enhanced Raman Spectroscopy: And Related Plasmonic Effects; Elsevier: Amsterdam, The Netherlands, 2008. [Google Scholar]
- Zhang, Z.; Shao, C.; Zhang, L.; Li, X.; Liu, Y. Electrospun nanofibers of V-doped TiO2 with high photocatalytic activity. J. Colloid Interf. Sci. 2010, 351, 57–62. [Google Scholar]
- Zhou, J.; Zhu, J.; He, W.; Cao, Y.; Pang, J.; Ni, J.; Zhang, J. Selective preferred orientation for high-performance antimony selenide thin-film solar cells via substrate surface modulation. J. Alloys Compd. 2023, 938, 168593. [Google Scholar] [CrossRef]
- Bo, Q.; Meng, F.; Wang, L. Facile hydrothermal synthesis of CeO2 nano-octahedrons and their magnetic properties. Mater. Lett. 2014, 133, 216–219. [Google Scholar]
- Nishimura, S.; Yakita, Y.; Katayama, M.; Higashimine, K.; Ebitani, K. The role of negatively charged Au states in aerobic oxidation of alcohols over hydrotalcite supported AuPd nanoclusters. Catal. Sci. Technol. 2013, 3, 351–359. [Google Scholar]
- Zhang, J.; Yang, X.K.; Deng, H.; Qiao, K.; Farooq, U.; Ishaq, M.; Yi, F.; Liu, H.; Tang, J.; Song, H. Low-Dimensional Halide Perovskites and Their Advanced Optoelectronic Applications. Nano-Micro Lett. 2017, 9, 36. [Google Scholar]
- Yang, W.Y.; Ou, Q.H.; Yan, X.; Liu, L.; Liu, S.; Chen, H.; Liu, Y. High Sensing Performance Toward Acetone Vapor Using TiO2 Flower-Like Nanomaterials. Nanoscale Res. Lett. 2022, 17, 82. [Google Scholar]
- Prabaharan, D.M.D.M.; Sadaiyandi, K.; Mahendran, M.; Sagadevan, S. Structural, optical, morphological and dielectric properties of cerium oxide nanoparticles. Mater. Res. 2016, 19, 478–482. [Google Scholar]
- Cui, Z.; Wang, W.; Zhao, C.; Chen, C.; Han, M.; Wang, G.; Zhang, Y.; Zhang, H.; Zhao, H. Spontaneous redox approach to the self-assembly synthesis of Au/CeO2 plasmonic photocatalysts with rich oxygen vacancies for selective photocatalytic conversion of alcohols. ACS Appl. Mater. Interfaces 2018, 10, 31394–31403. [Google Scholar]
- Guo, X.; Guo, Z.; Jin, Y.; Liu, Z.; Zhang, W.; Huang, D. Silver–gold core-shell nanoparticles containing methylene blue as SERS labels for probing and imaging of live cells. Microchim. Acta 2012, 178, 229–236. [Google Scholar]
- Wei, W.; Huang, Q. Preparation of cellophane-based substrate and its SERS performance on the detection of CV and acetamiprid. Spectrochim. Acta A 2018, 193, 8–13. [Google Scholar]
- Feng, C.; Tang, L.; Deng, Y.; Wang, J.; Luo, J.; Liu, Y.; Ouyang, X.; Yang, H.; Yu, J.; Wang, J. Synthesis of Leaf-Vein-Like g-C3N4 with Tunable Band Structures and Charge Transfer Properties for Selective Photocatalytic H2O2 Evolution. Adv. Funct. Mater. 2020, 30, 2001922. [Google Scholar]
- Nguyen, D.; Kang, G.; Chiang, N.; Chen, X.; Seideman, T.; Hersam, M.C.; Schatz, G.C.; Van Duyne, R.P. Probing molecular-scale catalytic interactions between oxygen and cobalt phthalocyanine using tip-enhanced Raman spectroscopy. J. Am. Chem. Soc. 2018, 140, 5948. [Google Scholar] [PubMed]
Disclaimer/Publisher’s Note: The statements, opinions and data contained in all publications are solely those of the individual author(s) and contributor(s) and not of MDPI and/or the editor(s). MDPI and/or the editor(s) disclaim responsibility for any injury to people or property resulting from any ideas, methods, instructions or products referred to in the content. |
© 2025 by the authors. Licensee MDPI, Basel, Switzerland. This article is an open access article distributed under the terms and conditions of the Creative Commons Attribution (CC BY) license (https://creativecommons.org/licenses/by/4.0/).