Article

Small Acetone Sensor with a Porous Colorimetric Chip for Breath Acetone Detection Using the Flow–Stop Method

1
Graduate School of Engineering, Tohoku Institute of Technology, 35-1 Yagiyamakasumicho, Taihaku-ku, Sendai 982-8577, Miyagi, Japan
2
Faculty of Engineering, Tohoku Institute of Technology, 35-1 Yagiyamakasumicho, Taihaku-ku, Sendai 982-8577, Miyagi, Japan
*
Author to whom correspondence should be addressed.
Chemosensors 2025, 13(4), 136; https://doi.org/10.3390/chemosensors13040136
Submission received: 17 March 2025 / Revised: 3 April 2025 / Accepted: 5 April 2025 / Published: 8 April 2025

Abstract

:
Acetone is a well-known biogas involved in lipid metabolism and is considered a potential biomarker for diabetes. However, the conventional detection methods for acetone face the limitations of large size, complex usage, and cross-sensitivity. In this study, we developed a portable device comprising a porous colorimetric acetone analytical chip composed of 2-nitrophenyl hydrazine and porous glass. The analytical chip was highly sensitive and selective for acetone because it was based on the chemical reaction between acetone and hydrazine in a nanoporous material, which provides a large surface area. The device consisted of a 450 nm laser light source and a photodiode detector with a volume of less than 40 mL. Acetone gas was measured in the atmosphere for 10 min using the developed flow–stop method. The measurable acetone concentration ranged from 0 to 6.0 ppm with a detection limit of 0.22 ppm. We successfully conducted a feasibility study using human exhaled breath and analyzed the relationship between exercise and the acetone concentration in the breath. An upward trend in exhaled acetone levels was seen post-exercise for each individual.

1. Introduction

Recently, exhaled breath has attracted considerable attention for biogas production. Unlike invasive tests such as blood tests, which are commonly used for disease diagnosis and health checks, diagnosis and testing through exhaled breath can be performed non-invasively, substantially reducing the physical and psychological burden on patients. Exhaled breath contains over 200 volatile organic compounds (VOCs) [1,2], several of which are associated with specific diseases and have the potential to serve as biomarkers. For example, methyl mercaptan [3,4] is associated with periodontal disease and halitosis, nonanal [5,6] with cancer, and acetone [7,8,9,10] with diabetes and lipid metabolism. Among these VOCs, acetone in human exhaled breath tends to be present at higher concentrations than other VOCs. Therefore, measuring acetone requires sensitivity in the sub-ppm range and selectivity against other VOCs.
The prevalence of diabetes, for which acetone has potential as a biomarker, is increasing worldwide. According to the WHO, the number of diabetes patients, which was 200 million in 1990, reached 830 million in 2022, and 14% of adults aged 18 and over were affected by diabetes. The prevalence of diabetes has doubled from 7% in 1990 to 14% in 2022, and in 2021, well over 2 million people died from diabetes and its complications [11]. Therefore, it is crucial to develop a highly sensitive and simple technology to measure acetone concentration in exhaled breath for the early diagnosis of diabetes. In this regard, several studies on the correlation between blood glucose concentration and breath acetone levels have been reported [12,13,14]; non-invasive breath measurements can complement invasive blood glucose monitoring, which is daily adopted by some diabetic patients. To improve clinical translational value, simple, non-invasive breath measurement devices that can be used at home are required. In addition, regular breath monitoring and recording of changes in data, even if the patient does not have diabetes, may aid in diagnosis and early detection in hospitals.
Recently, mass spectrometry (MS) techniques [15,16,17,18,19,20,21,22], such as gas chromatography–MS [16,17,18] and proton transfer reaction (PTR)–MS [19,20,21], have been used to measure acetone in exhaled breath, enabling the detection of a wide range of substances with very high precision. Electric noses have also been employed for similar applications [23]. However, these devices are large, expensive, and require specialized operators, making them impractical for widespread use. Research has been conducted to address this issue by using non-invasive testing technologies such as electrochemical sensors [24], semiconductor sensors [25,26], and MEMS technology [27,28,29].
Jiang et al. [24] used a mixed potential acetone sensor based on stabilized zirconia combined with a Cd2SnO4 sensing electrode, which detected acetone concentrations in the range of 0.05 to 200 ppm at an optimal operating temperature of 600 °C. The sensor exhibited excellent reproducibility, selectivity, and long-term stability. Clinical tests of the sensor on the exhaled breath of healthy individuals and patients with diabetes were conducted, verifying a strong correlation between the response values, acetone concentration, and blood ketone levels. Orasugh et al. [25] synthesized a series of graphene oxide@cellulose nanocrystal (GO@CNC) nanoparticles (NPs) using a modified Hummers’ method and reported a detection limit of 5 ppm for an optimized sensor based on GO3@CNC3 NPs. Jahromi et al. [26] developed a solid acetone sensor using PbS nanosheets. This sensor exhibited high selectivity and detected acetone concentrations ranging from 1 to 20 ppm. The sensor also detected acetone at concentrations as low as 1 ppm at room temperature (25 °C). Rabih et al. [27] developed a MEMS sensor functionalized with a blend of chitosan/polyethylene glycol polymer, demonstrating good reproducibility, response, and reversibility for acetone concentrations ranging from 0.05 to 5 ppm. In addition, they measured the cross-sensitivity to 2-propanol and methanol, reporting that the responses to these substances were 24% and 33% lower, respectively, compared to the response to acetone at the same concentration. Zhang et al. [28] designed an FAIMS-MEMS gas sensor and reported that acetone concentrations were greater than 1.8 ppm. The structure of the FAIMS gas sensor consisted of ionization, migration, and collection zones, and the accelerated gas ions were detected after passing through the migration zone. Sachdeva et al. [29] developed a thin-film MEMS-based gas sensor incorporating a tin oxide (SnO2) thin film, achieving acetone detection at 1.5 ppm with an operating temperature of 360 °C. The response and recovery times were approximately 3 and 4 min, respectively. Electrochemical, semiconductor, and MEMS sensors offer rapid response times, and some of them exhibit sufficient sensitivity for breath analysis. However, mitigating cross-sensitivity remains a major challenge.
Previously, we developed a detection chip using 4-nitrophenylhydrazine (4-NPH) as the detection reagent in a porous glass [30]. This chip used a chemical reaction as the principle and was unaffected by alcohol interference. Acetone concentrations ranging from 0.5 to 5 ppm were detected by measuring the absorbance at 390 nm. However, the passive exposure method used in this approach requires several hours for detection. In this study, we used 2-nitrophenylhydrazine (2-NPH), a structural isomer of 4-NPH, which forms a reaction product with acetone that has a longer absorption wavelength than that of 4-NPH. In addition, we developed a portable device to enable rapid detection using the active exposure method. A measurement method (flow–stop method) for rapid detection using a small gas volume was also explored. In addition, we measured the exhaled breath of individuals engaged in physical activity using a device containing the 2-NPH analytical chip.

2. Materials and Methods

2.1. Analytical Chip

Porous glass (8 mm × 8 mm × 1 mm, with an average pore diameter of 4 nm and a specific surface area of 200 m2/g) (Porous glass-4nm, Akagawa Glass Co., Ltd., Osaka, Japan) was used as the substrate. A 50 mL solution of methanol (special grade, FUJIFILM Wako Pure Chemical Co., Osaka, Japan) containing 7.55 × 10⁻³ mol/L of 2-NPH (purity > 98.0%, Tokyo Chemical Ind., Tokyo, Japan) and 4.66 × 10⁻² mol/L of hydrochloric acid (reagent grade, FUJIFILM Wako Pure Chemical Co., Osaka, Japan) was prepared as an impregnation solution. The porous glass was immersed in the impregnation solution for 4 h and subsequently removed from the solution and dried under a dry nitrogen atmosphere for over 20 h to obtain an analytical chip. Upon immersing the porous glass in an impregnation solution, 2-NPH was transported into its pores, and the solution was then dried to fix the 2-NPH inside the pores.

2.2. Preparation of an Acetone Atmosphere

The acetone atmosphere used for exposure of the analytical chip was prepared with the concentration range from 0 to 6.0 ppm, with relative humidity (RH) ranging from 25 to 70% at 23 °C, as follows. A smart bag (AAK-30, GL Sciences Inc., Tokyo, Japan) with a 30 L volume was inflated with dry air and, subsequently, 40 μL of acetone aqueous solution with the desired concentration (0 to 0.205 mol/L) and a specific volume (115 to 393 mL) of deionized water (conductivity 0.06 S/m) were injected into the smart bag. The acetone solution and water were allowed to evaporate for more than 24 h in a controlled environment at 23 ± 3 °C. The acetone concentration in the prepared atmosphere was in the range from 0 to 6.0 ppm, and RH ranged from 25% to 70% at 23 °C. The acetone concentration in the prepared atmosphere was determined using a gas chromatograph equipped with a semiconductor detector (SGEA-P3-A; NISSHA FIS, Inc., Kyoto, Japan). In addition, 2 L of acetone gas was transferred from the prepared 30 L atmosphere into a 2 L smart bag (AAK-2, GL Sciences Inc., Tokyo, Japan), and the concentration was confirmed using a gas chromatograph (SGEA-P3-A).

2.3. Humidity Dependency Evaluation

For analytical chips using porous glass, the value of the molar absorption coefficient of the material in the porous glass can be highly dependent on humidity. This can cause large errors in the analytical results, which are calculated using the absorbance values. Therefore, the humidity dependence of the molar absorption coefficient of acetone-2-NPH (A-2-NPH), which is the reaction product between acetone and 2-NPH, was measured. Initially, two types of after-exposure analytical chips containing different amounts of A-2-NPH with different absorbances at 446 nm were prepared. Next, each analytical chip was stored at 80% RH condition for approximately 1 h. Subsequently, the analytical chip was moved in an atmosphere with 30–40% RH, and the UV–Vis–NIR spectrum was measured every 7 min using a spectrophotometer (U-4100, HITACHI High-Tech Co., Tokyo, Japan).

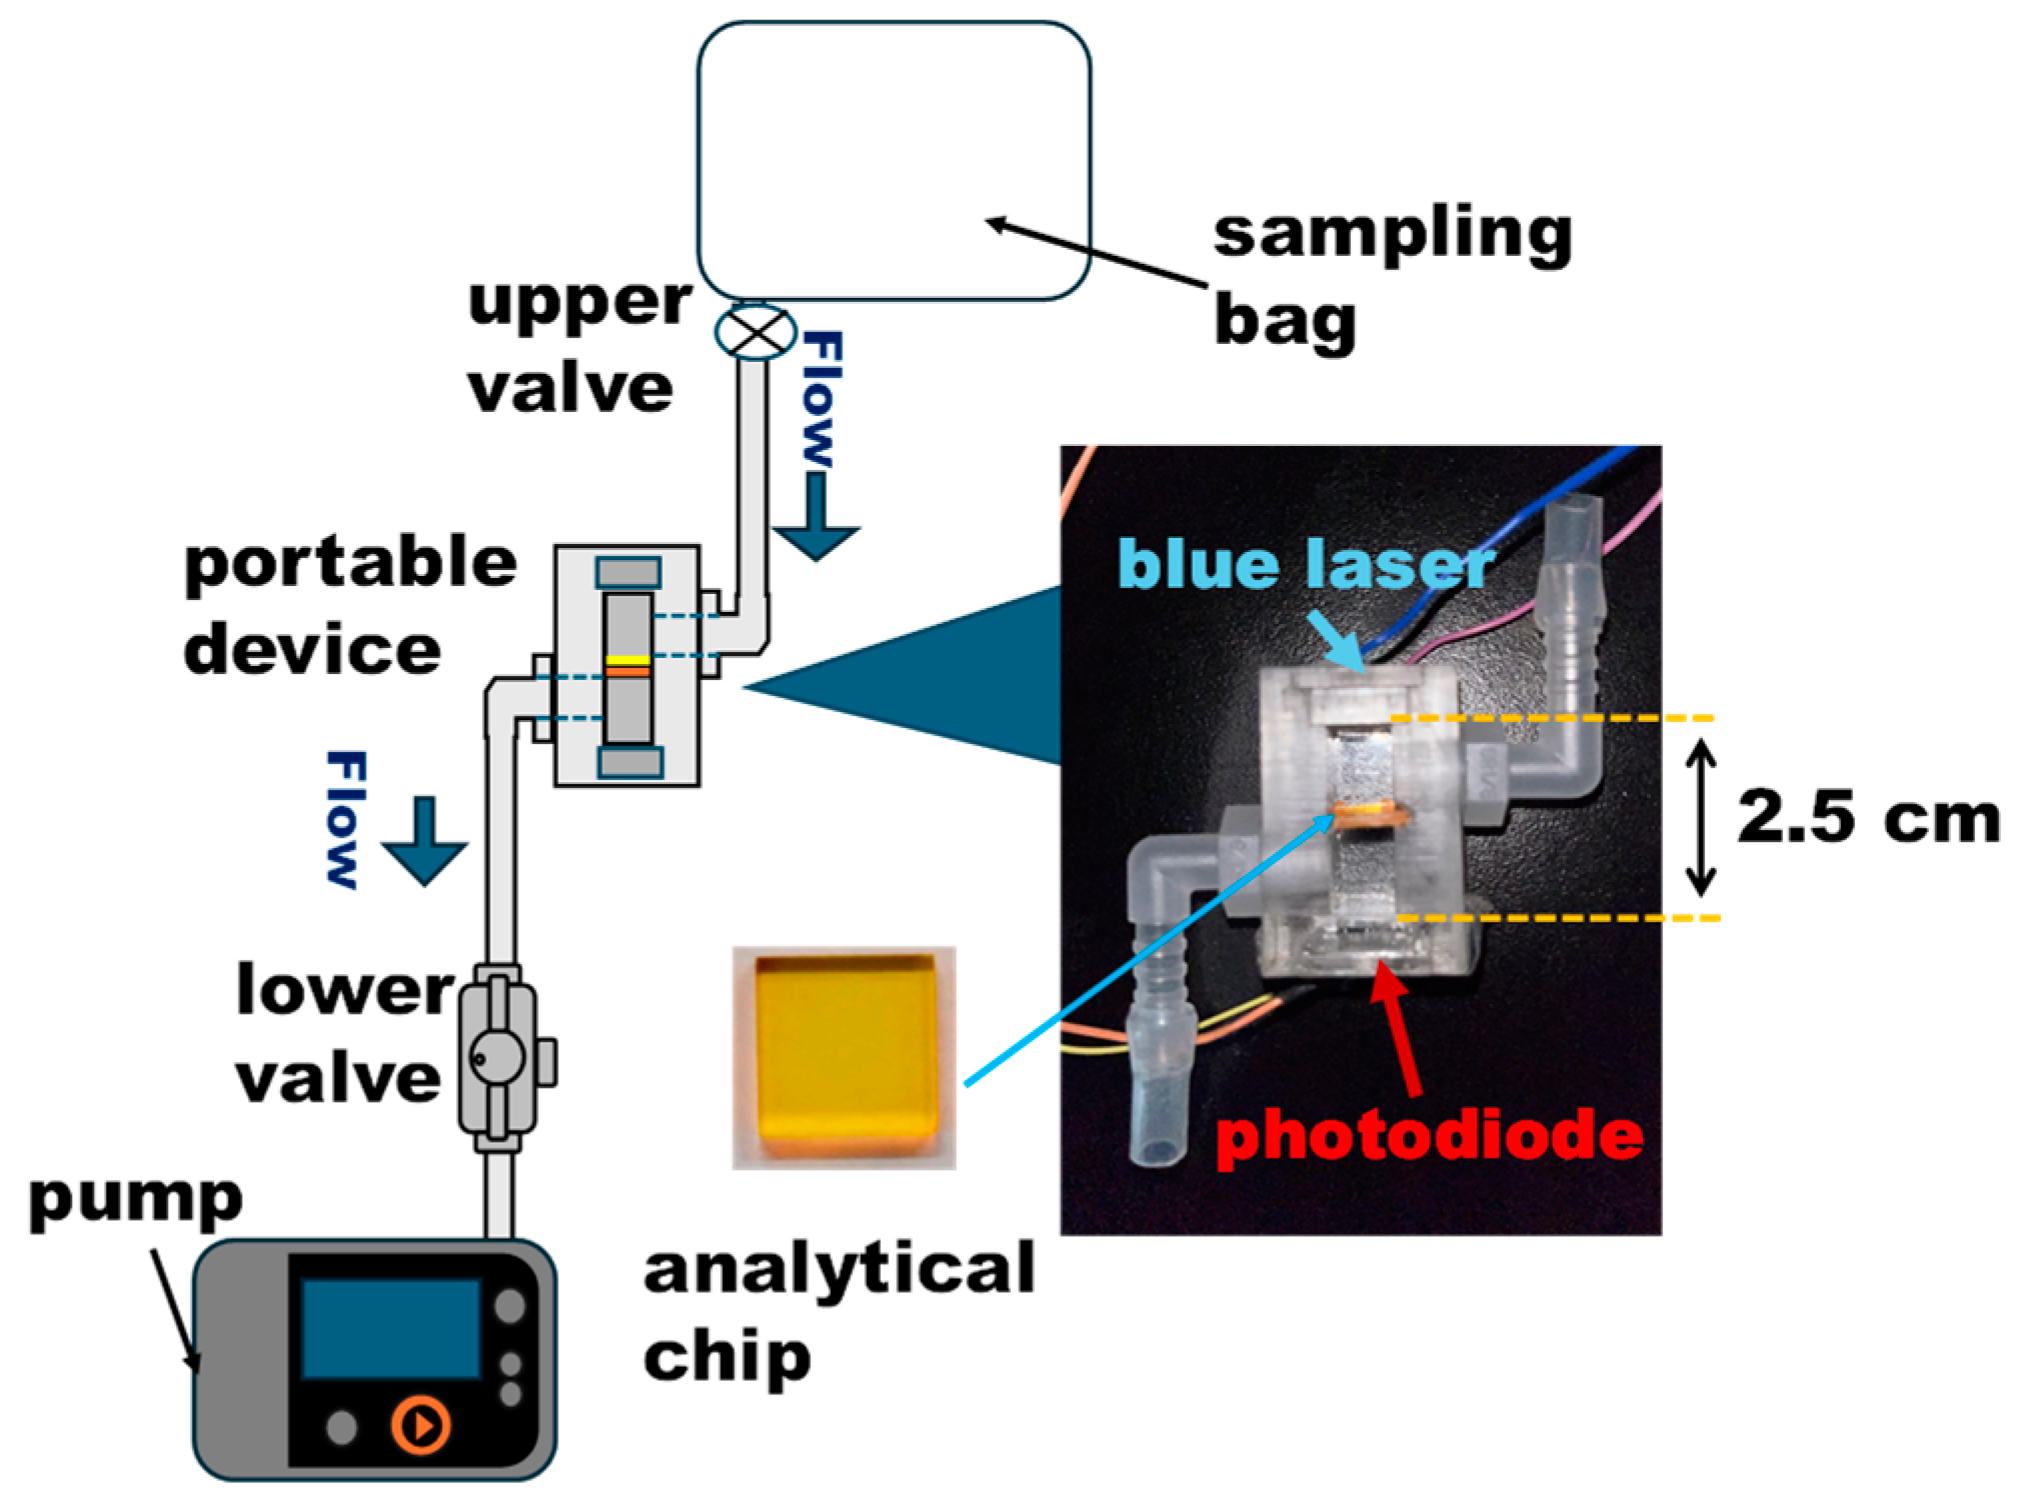
2.4. Portable Device and Measurement Method

2.4.1. Portable Device and Measurement Setup

The developed portable device and its setup are shown in Figure 1. The body of the device was fabricated using acrylic resin via a 3-D printer. As the maximum absorption wavelength of A-2-NPH was 446 nm, a blue laser light source (PL450B, ams-OSRAM, Steiermark, Austria) operating near 450 nm was used, and the detector was a photodiode (BPW21, ams-OSRAM, Steiermark, Austria). The dimensions of the device were 2.5 cm × 1.0 cm × 1.5 cm, with a total volume of 3.75 mL. Teflon tubes were connected to the top and bottom of the device, with volumes of 21.5 mL and 12.6 mL for the upper and lower valves, respectively, resulting in a total volume of 37.9 mL, including the device and tubes. Inside the device, a holder of the analytical chip was placed between the light source and detector. During measurements, the upper tube was connected to the exposed gas (prepared acetone atmosphere or exhaled air), and the lower tube was connected to a small pump (MP-Σ30N II or MP-Σ500N II, SHIBATA SCIENTIFIC TECHNOLOGY Ltd., Saitama, Japan) to regulate gas flow at an adjustable flow rate.

2.4.2. Constant Flow Measurement

Initially, the light intensity was measured without placing the analytical chip inside the device, and the measured value was used as a reference. The analytical chip was placed in an indoor atmosphere for approximately 1 h as a pretreatment. Next, the pre-treated analytical chip was placed inside the device, and the prepared acetone atmosphere (0.356–3.41 ppm) with 50% RH was connected to the upper tube and introduced into the device at a flow rate of 1.0–5.0 L/min for 10 min. The blue laser was turned on at 1 min intervals, and the light intensity transmitted through the analytical chip was measured using the photodiode.
For device performance evaluation, the upper valve was replaced with a three-way valve, enabling gas with and without acetone, which was connected to each of the three-way valves, to alternately flow every 10–12 min. The acetone concentration of the gas was gradually increased from 0.5 to 6.0 ppm. The blue laser was turned on at 0.5 min intervals, and the light intensity through the analytical chip was measured using a photodiode.

2.4.3. Flow–Stop Measurement

Initially, the light intensity was measured without placing the analytical chip inside the device, and the measured value was used as a reference. Next, a pretreated analytical chip was placed inside the device. The prepared acetone gas (0–5.84 ppm) with 50% RH was connected to the upper tube and introduced into the device at a flow rate of 1.0 L/min for 1 min, after which the pump was stopped. The upper and lower valves were closed for 9 min to seal the device. During this 9 min period, the light intensity through the analytical chip was measured every 30 s or 1 min.

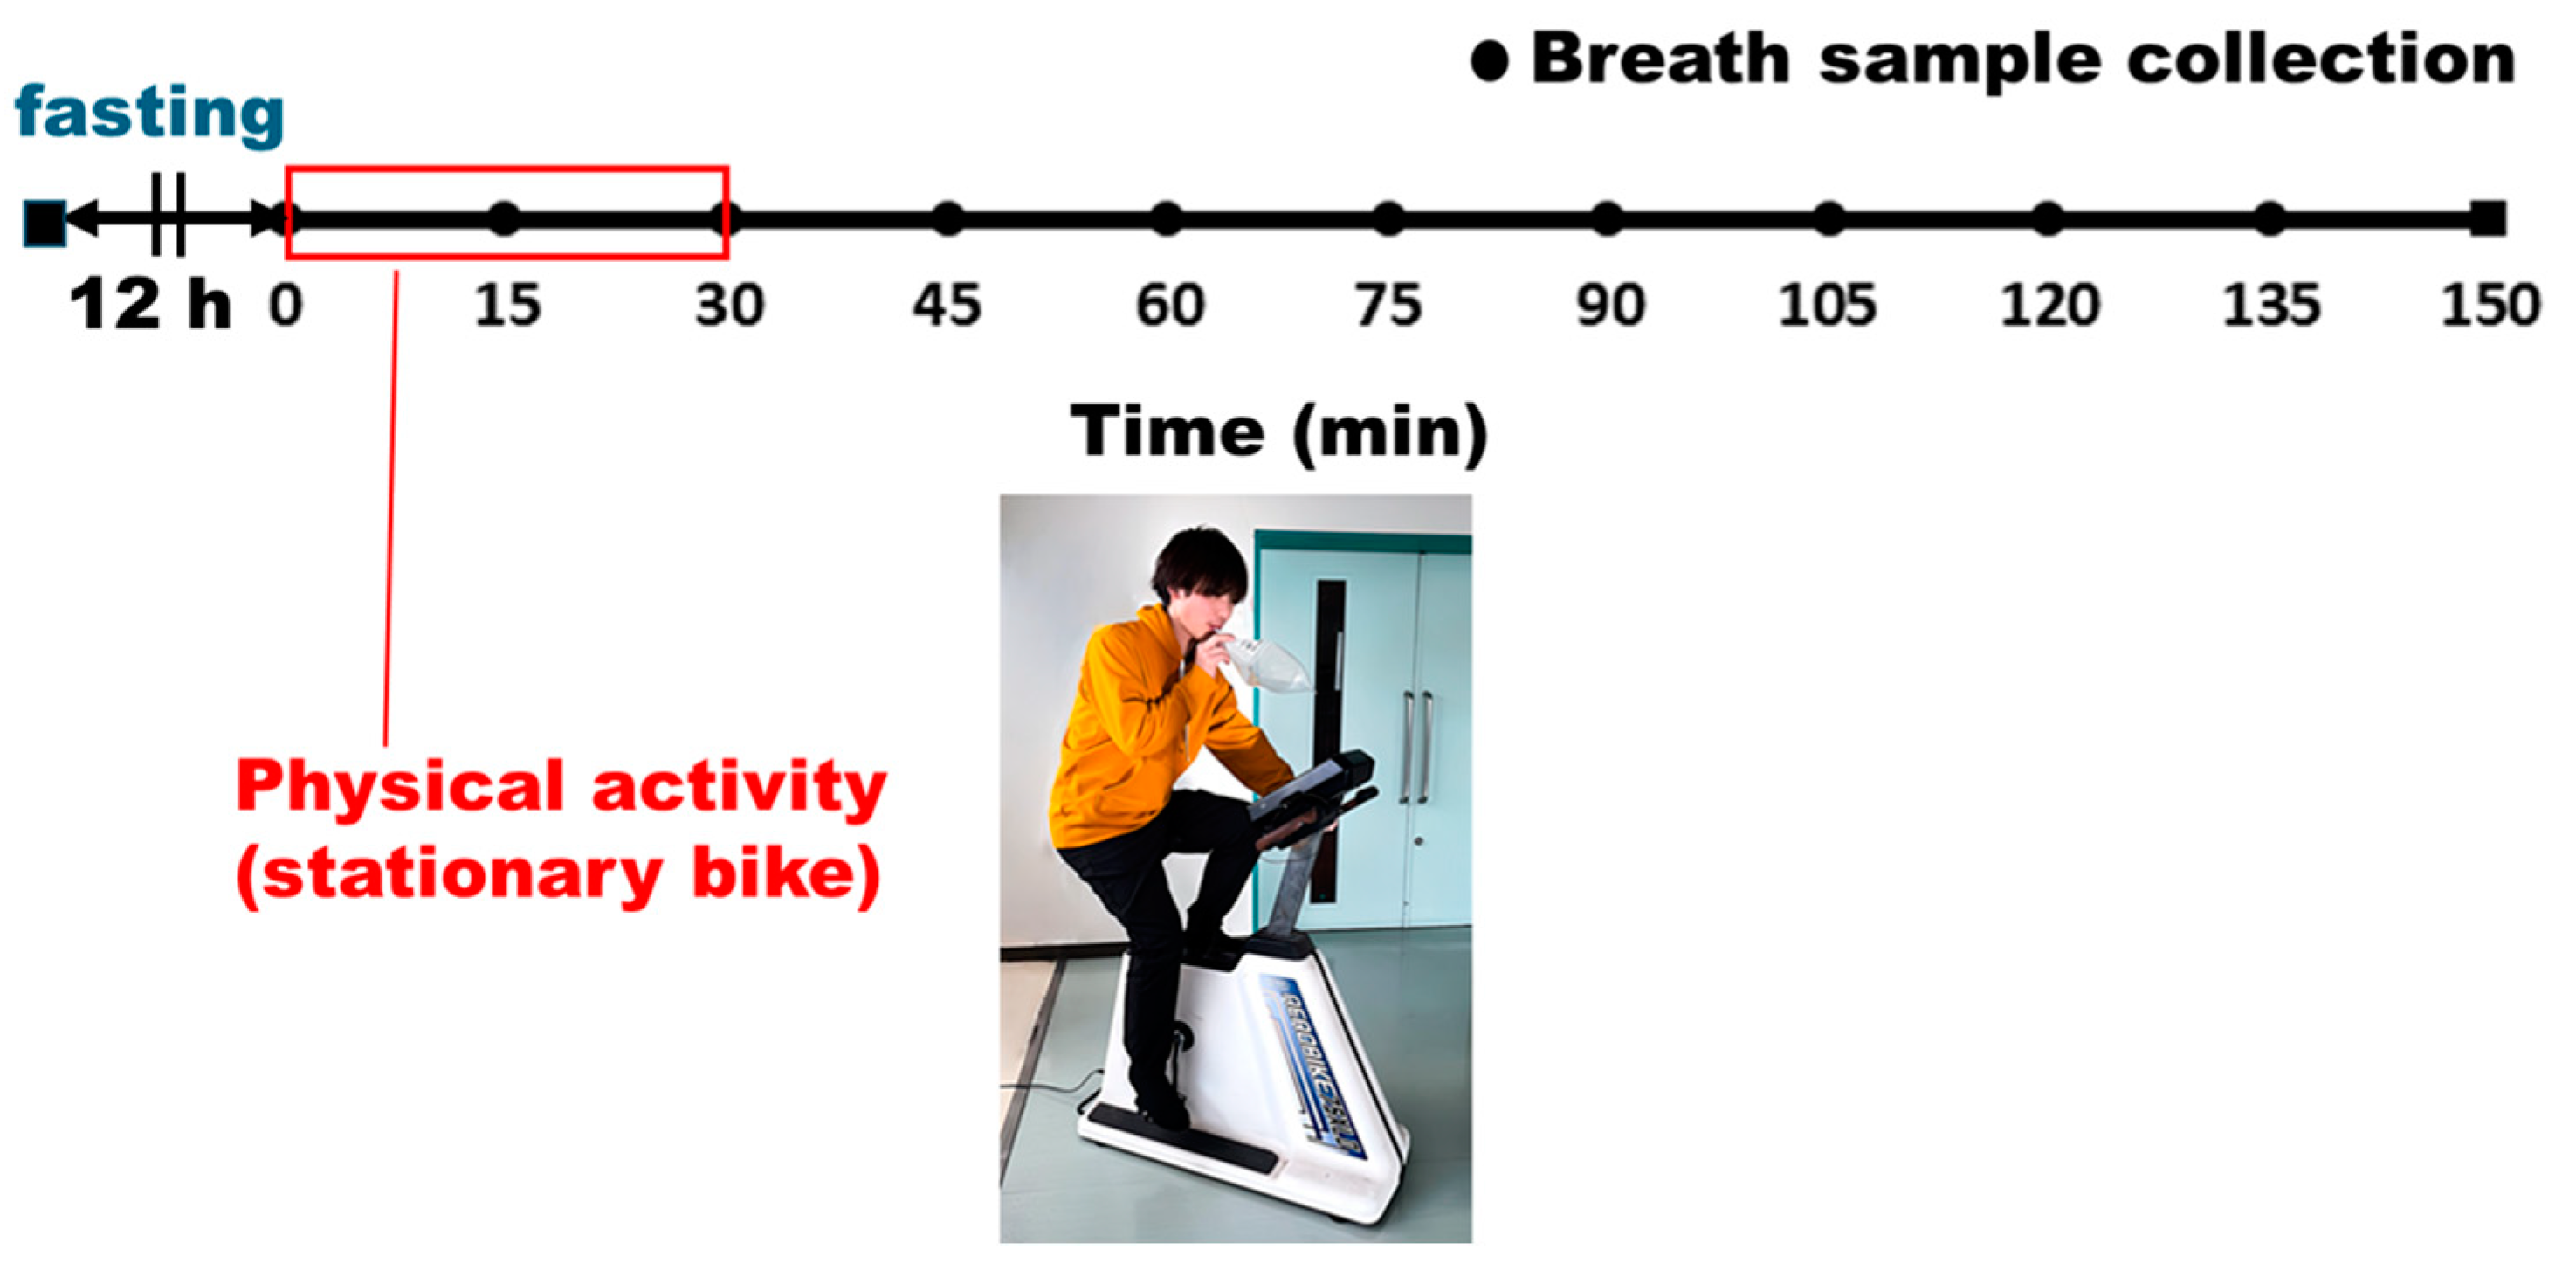
2.5. Exhaled Air Analysis

A study involving four males (aged 20–22 yrs) was conducted, which was approved by the university’s ethical committee. Exhaled air was collected during and after the exercise. The procedure for exhaled air collection is illustrated in Figure 2. Before exercise, the subjects fasted for more than 12 h, and the exercise consisted of 30 min of cycling on a stationary bike with a 50 W load. Exhaled air was collected at 0, 15, and 30 min after the start of the exercise and every 15 min thereafter. Three samples were collected during the exercise, and six or seven samples were collected after the exercise. The exhaled air collection method was as follows: Deeply inhale, exhale the first 2 s of breath, and then exhale approximately 1 L into a 2 L of sampling bag (AAK-2, GL Sciences Inc., Tokyo, Japan). The sampling bag containing the exhaled air was left to stand for 24 h in a controlled room at 23.0 ± 3.0 °C with 35 ± 15% RH to allow for humidity adjustment. The bag was then connected to the upper tube of the device and allowed to flow into the device at a rate of 1.0 L/min for 1 min, after which the pump was stopped. The upper and lower valves were closed for 9 min to seal the device. During this 9 min period, the light intensity through the analytical chip was measured every 30 s or 1 min. Simultaneously, the acetone concentration in the exhaled breath was measured using the gas chromatograph (SGEA-P3-A).

3. Results

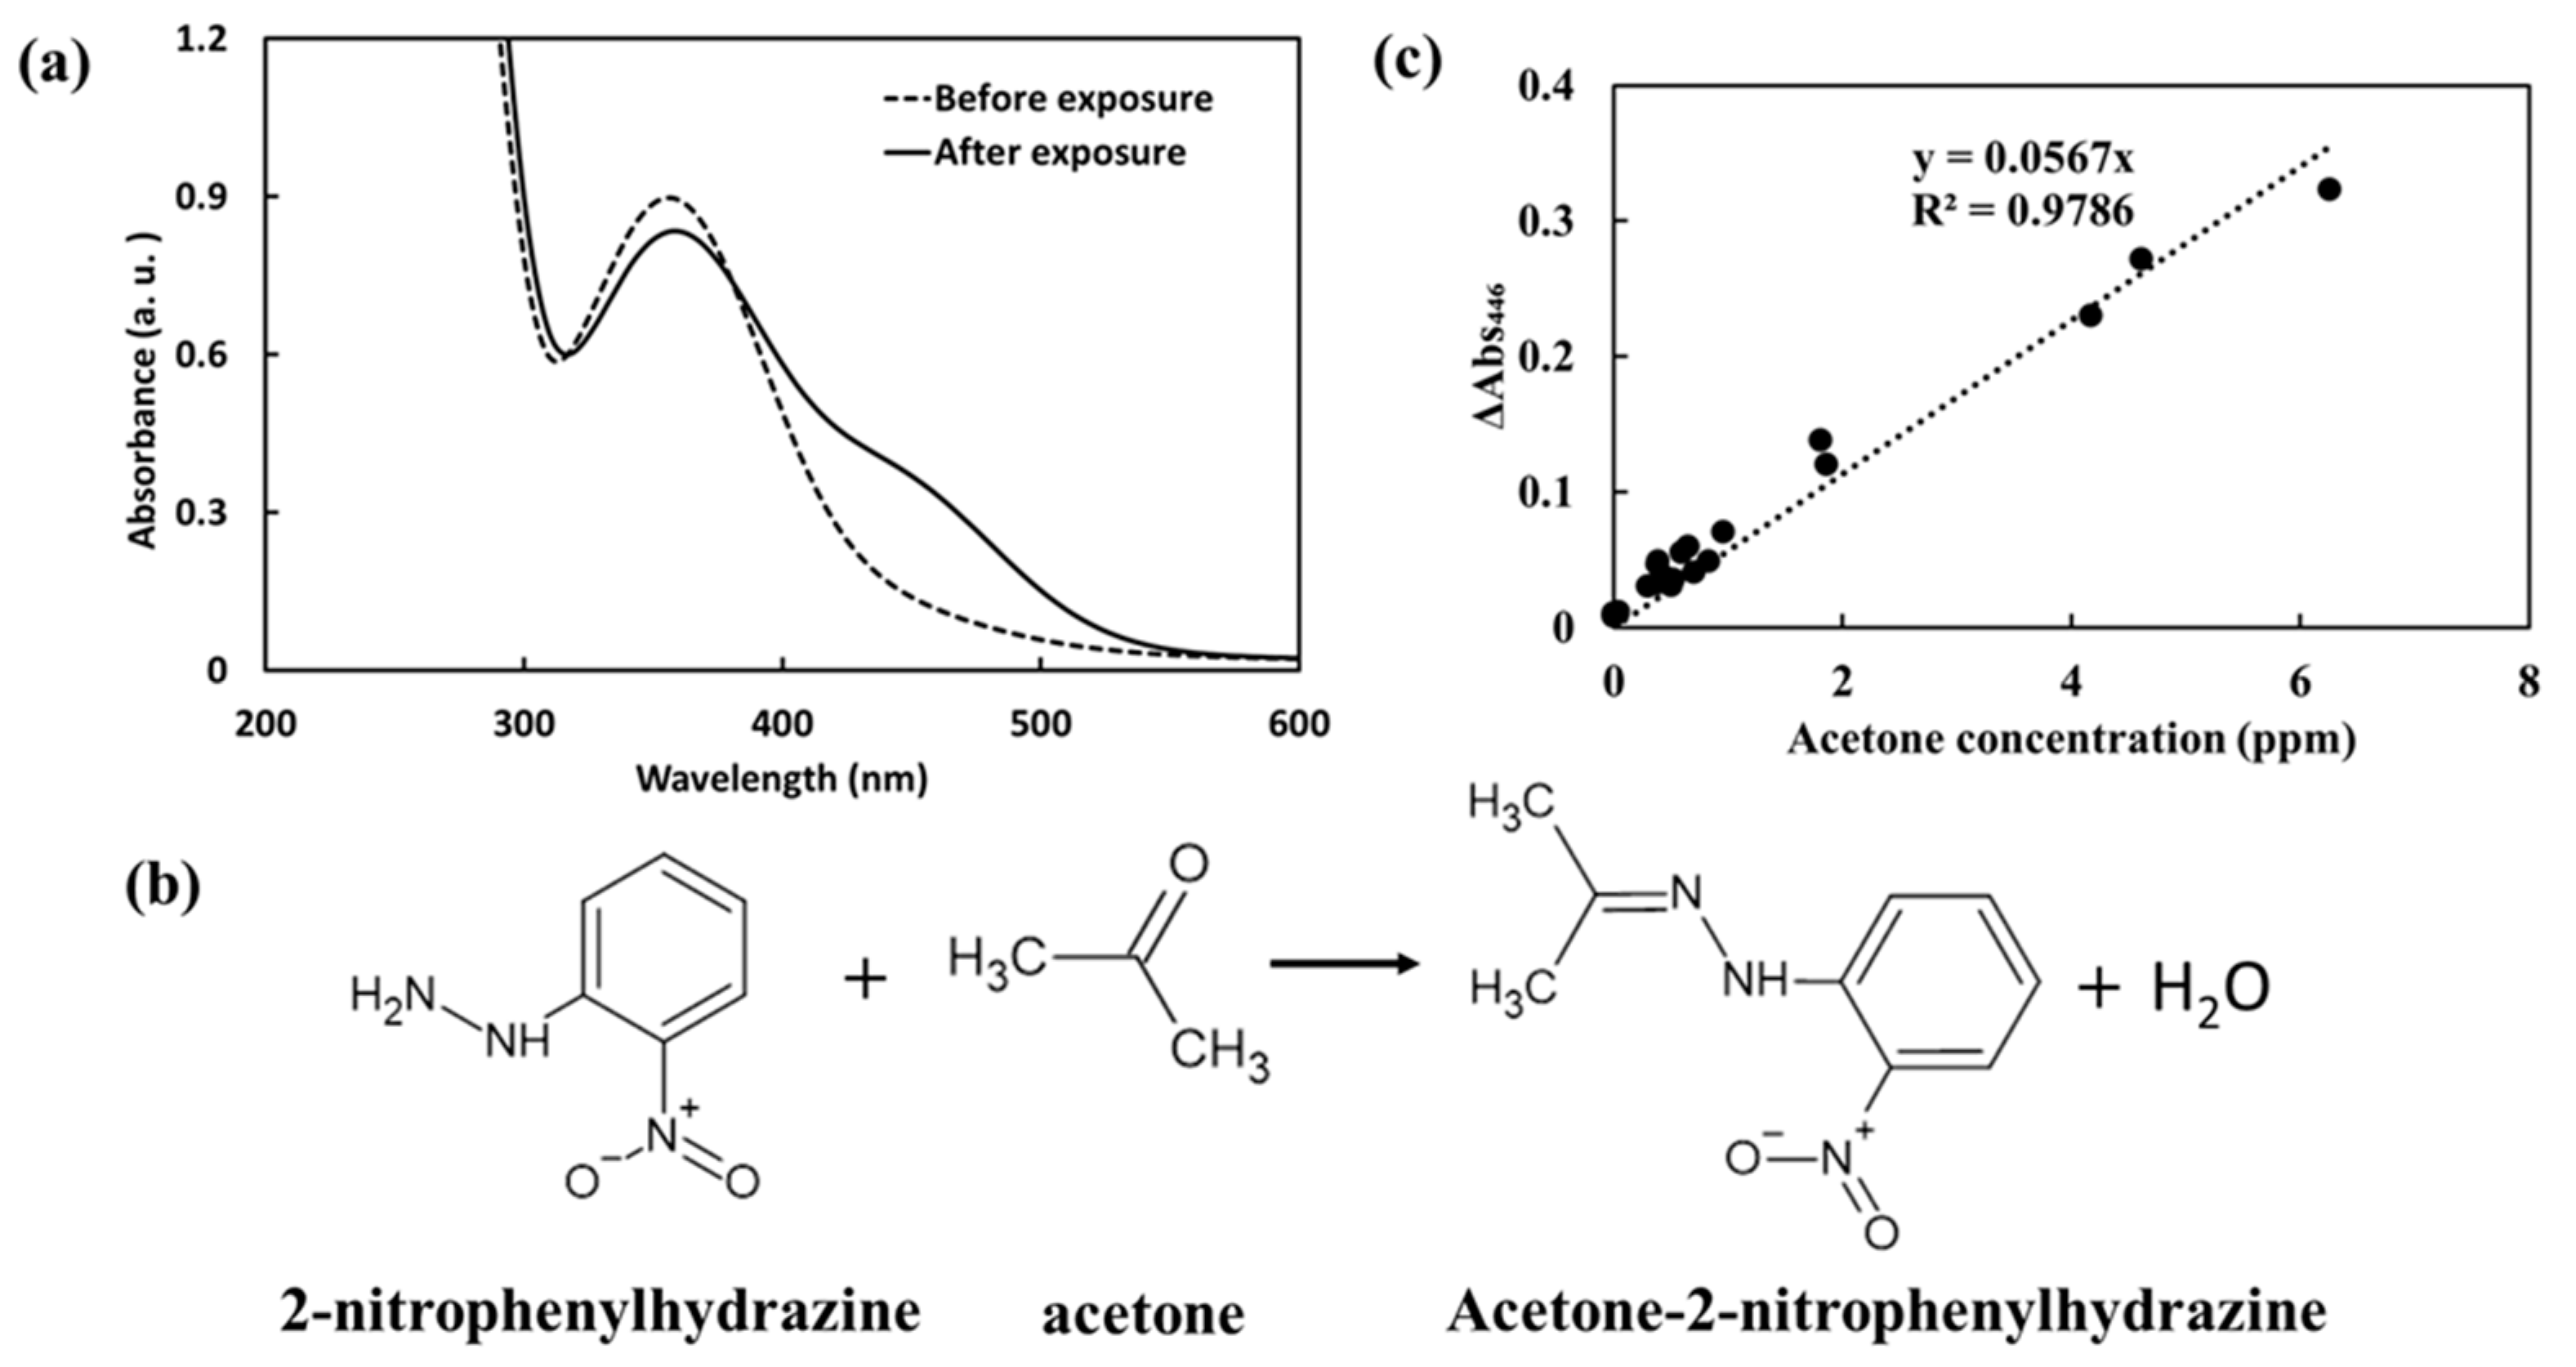
3.1. Characteristics of the Acetone Analysis Chip

The analysis chip made from porous glass was colorless and transparent, making it suitable for analysis using optical methods. Figure 3a shows the change in the absorbance spectra of the analytical chip measured using a UV–Vis–NIR spectrophotometer (U-4100) before and after exposure to an acetone atmosphere of 6.62 ppm for 3 h. The reaction between 2-NPH and acetone is illustrated in Figure 3b. Before exposure, the analytical chip exhibited an absorption peak at 354 nm, which was attributed to 2-NPH. After exposure to acetone, a new absorption peak appeared at 446 nm, which was attributed to the reaction product of acetone and 2-NPH, A-2-NPH, and the absorption at 354 nm decreased after exposure. The decrease at 354 nm and the increase at 446 nm changed with the isosbestic point, indicating that in the reaction between acetone and 2-NPH, only the reaction producing A-2-NPH occurred. We have already developed detection chips using 4-NPH as the reagent for acetone detection [20]. However, in this study, we decided to use 2-NPH instead of 4-NPH. The absorption peak of acetone-4-NPH was observed in the UV region, whereas that of 2-NPH was observed in the visible region. There are various inexpensive and small light sources in the visible range, which are advantageous for developing equipment. The calibration curve for the analytical chip using 2-NPH exposed to acetone gas and sealed in a Tedlar bag for 3 h is shown in Figure 3c. The calibration curve was linear from 0 to 6 ppm, confirming that the reaction product was stable and the reaction proceeds rapidly.

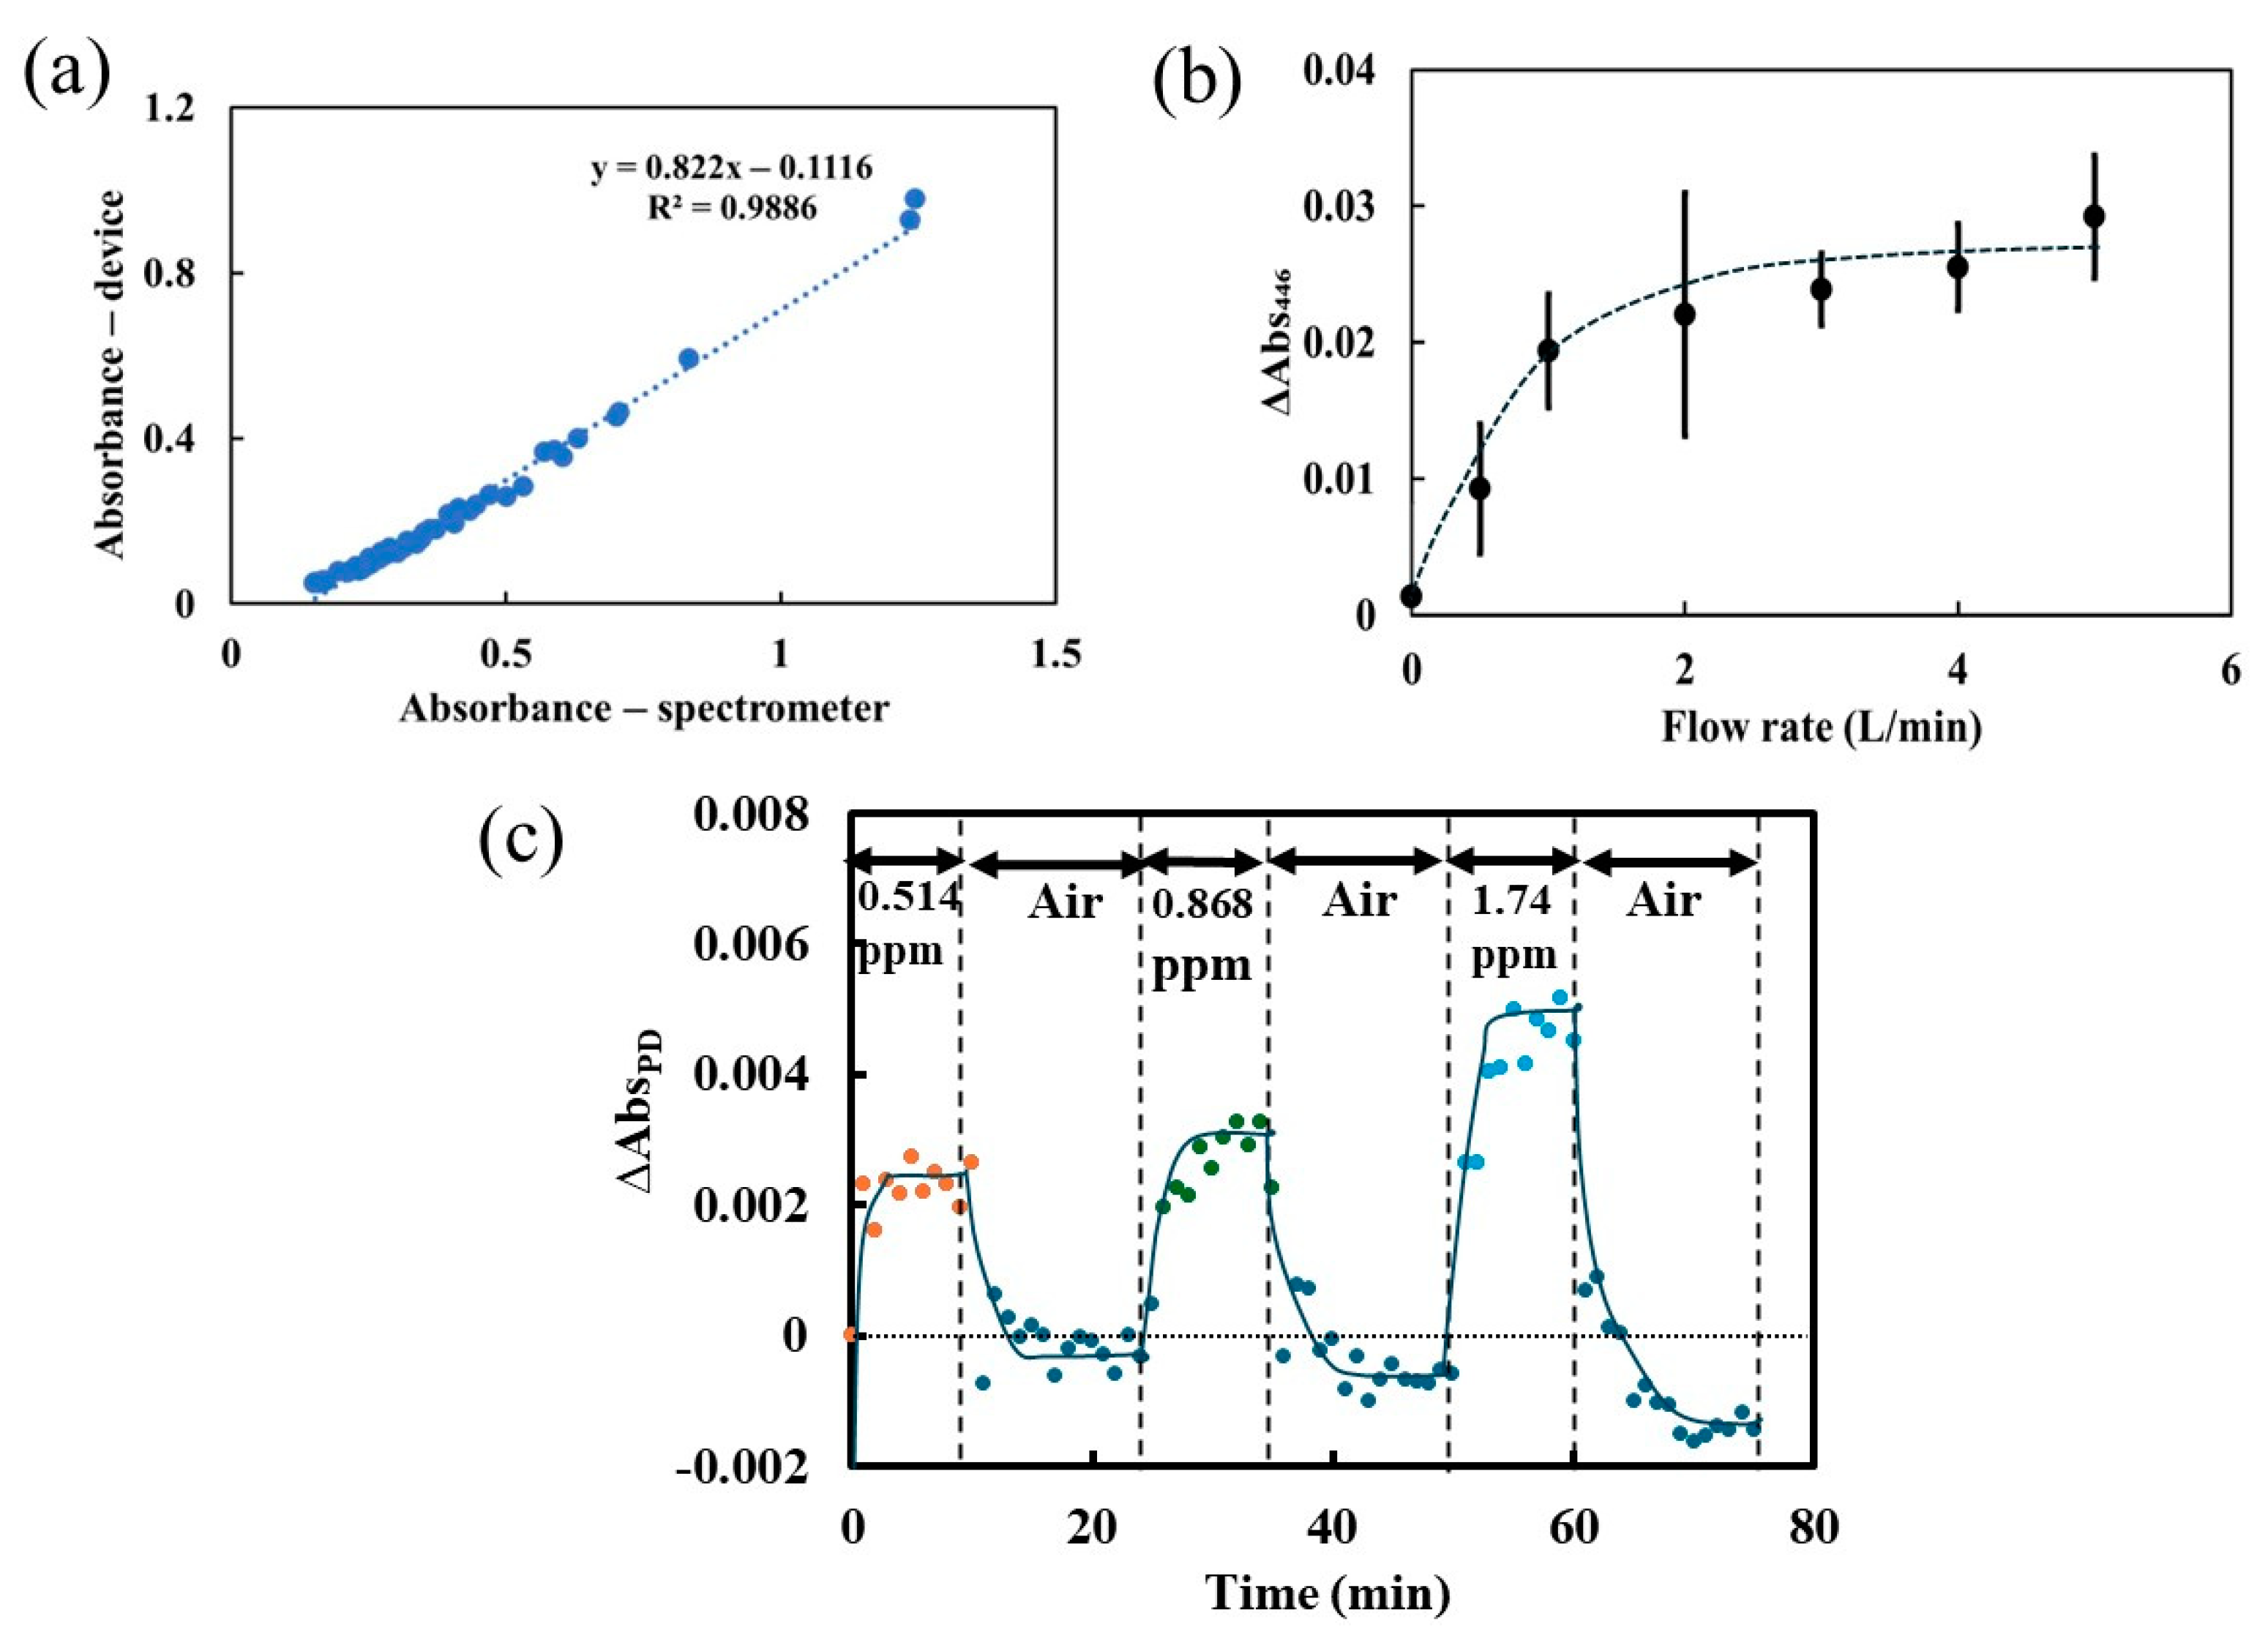
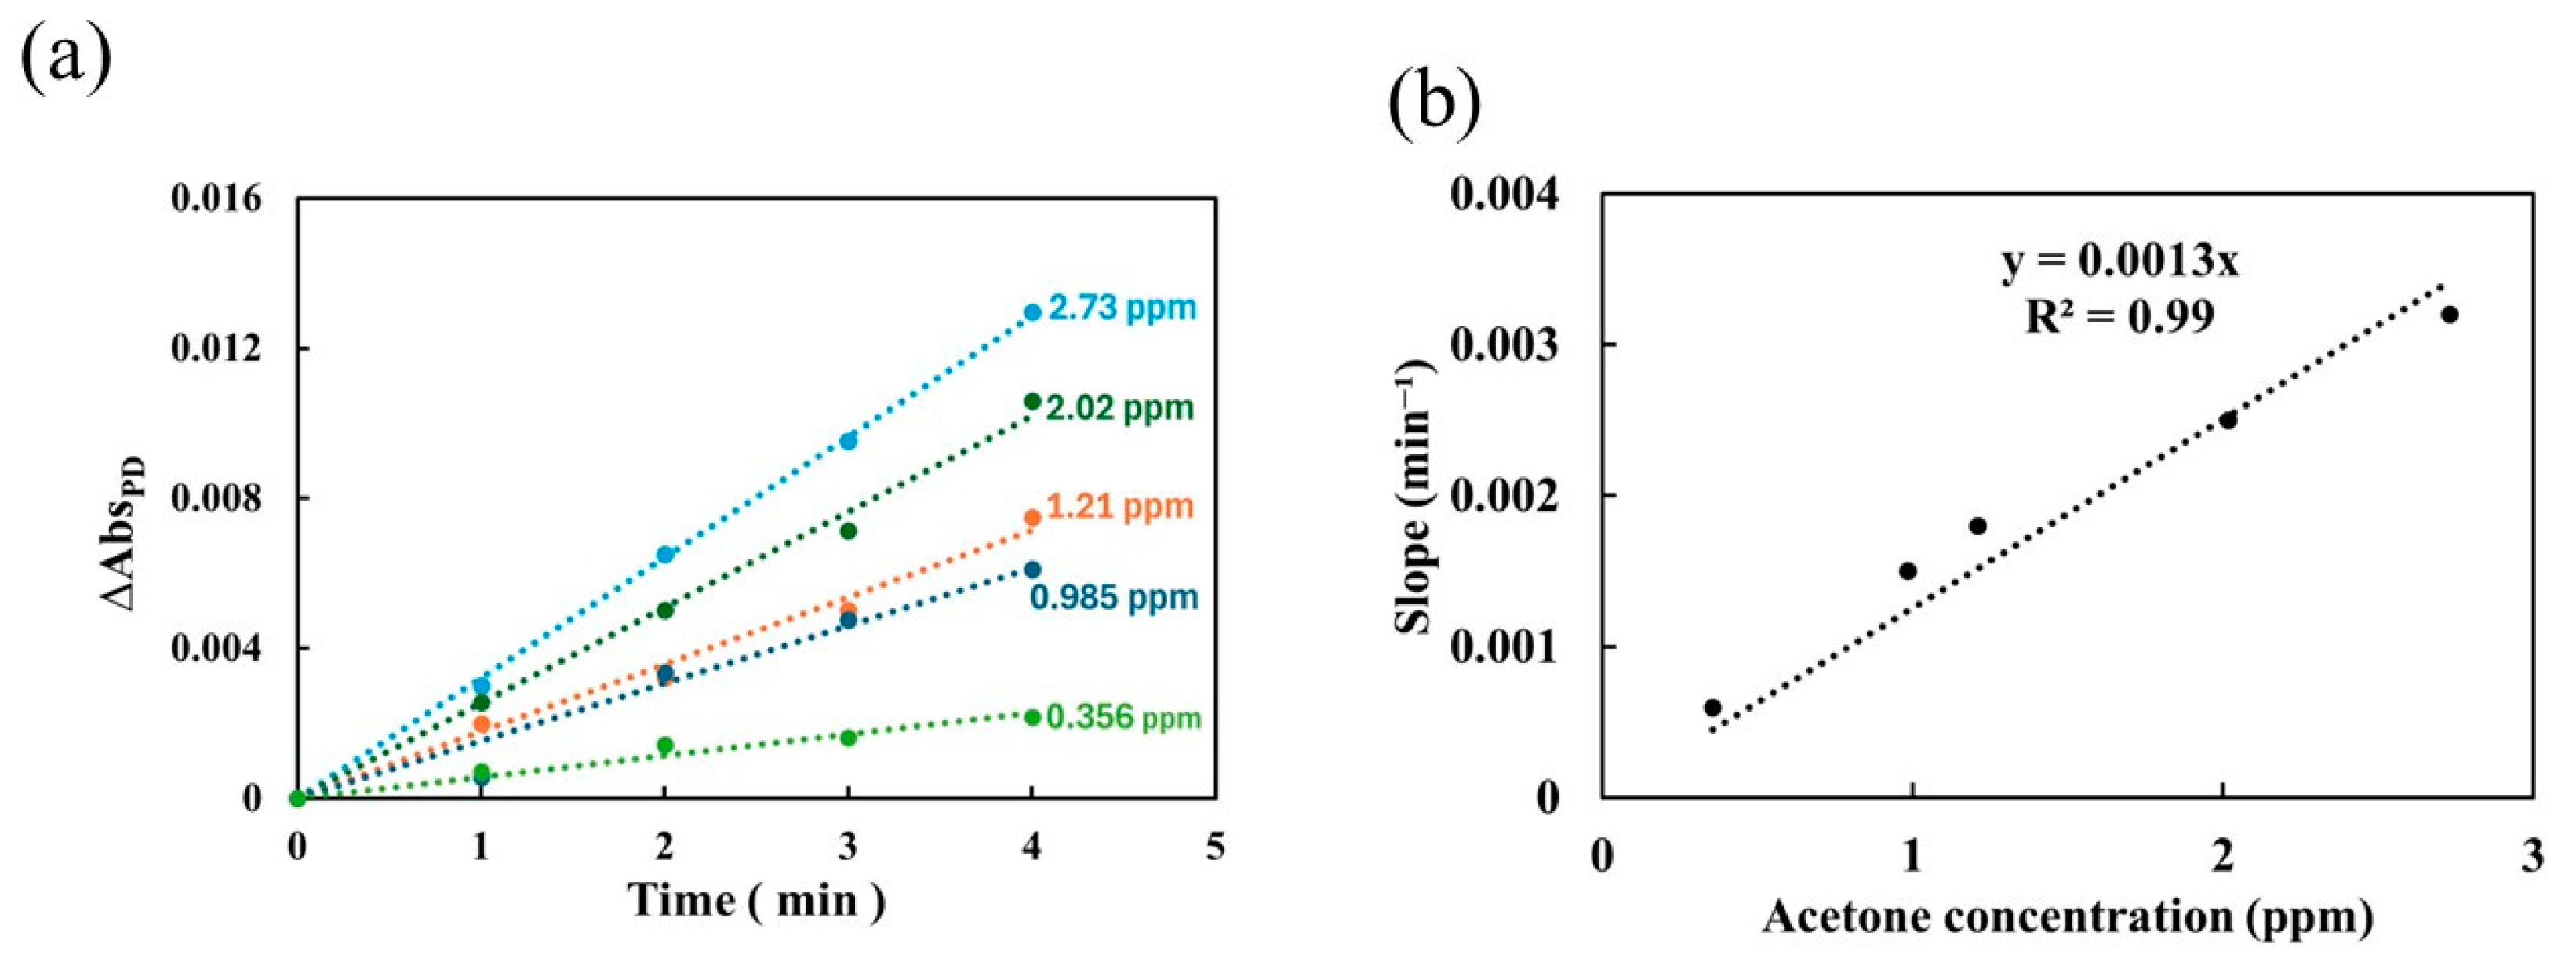
3.2. Performance of the Portable Device Using Constant Flow Method

The relationship between the absorbance calculated from the output of the portable device and that measured using the spectrophotometer is shown in Figure 4a. The absorbance of the device is calculated using Equation (1).
Abs PD = l o g V 1 V 0
where V0 is the voltage measured by the photodiode when the laser is irradiated without the chip, and V1 is the voltage measured by the photodiode when the laser is irradiated through the chip. In the absorbance range from 0.15 to 1.2, a linear relationship is obtained, and the relationship between the two is expressed by Equation (2).
Abs PD = 0.822 · Abs 446
where AbsPD is the absorbance of the portable device, and Abs446 is the absorbance of the spectrometer at 446 nm. In the absorbance range of 0–0.15, the relationship deviates from linearity. This deviation may be attributed to the output of the photodiode being non-linear, because the light source was too strong. The relationship between the difference in absorbance of the analytical chip inserted into the portable device and the flow rate when the chip is exposed to an acetone atmosphere at a concentration of 2.01 ppm for 1 min is shown in Figure 4b. The effect of the flow rate was small at flow rate above 1.0 L/min because the analysis chip was a porous material, and the acetone molecule diffusion in the porous material was the rate-limiting step for the detection reaction. In contrast, at a flow rate below 1.0 L/min, the effect of the flow rate was large because the supply of acetone molecules to the analytical chip was the rate-limiting step. Based on these results, the flow rate was set to 1.0 L/min for subsequent experiments.
The gas with and without acetone alternately flows every 10 and 14 min at a flow rate of 1.0 L/min, as shown in Figure 4c. The vertical axis represents the difference per 0.5 min. The concentration of acetone was gradually increased, and the RH of the gas was 50 ± 5% at 23 °C. After the introduction of acetone gas, 4 min was required to reach a steady absorbance difference and to recover the absorbance difference to zero. At a flow rate of 1.0 L/min, 4 L was required to obtain a constant response and recovery. The volume of 4 L was approximately 100 times that of the portable device. As such a larger volume is required, it was assumed that the adsorption and the desorption of acetone on the acrylic resin surface of the portable device occurred. In addition, after a 4 min flow, we can obtain constant values of the absorbance difference. Therefore, the adsorption and the desorption of acetone on the acrylic resin surface would be in reversible equilibrium. Acetone is adsorbed by physical adsorption, and desorption occurs when the air, which does not contain acetone, is passed through the device.
Because it was determined that a 4 min flow is required to achieve a steady absorbance difference, when considering the calibration curve of the constant flow method, the absorbance values after a 4 min flow were used, and the absorbance at 4 min was set to zero. Figure 5a shows the relationship between the exposure time and the absorbance, where exposure time of zero is the time after 4 min of flow. A linear relationship between the two was obtained for each concentration; the higher the acetone concentration, the higher the slope of the line. Figure 5b shows the relationship between the slope of the line and the acetone concentration. A linear relationship is obtained between the two and is expressed by Equation (3).
S l o p e = 0.0013 · C
where slope represents the change in absorbance over time (min) and C is the acetone concentration (ppm). When the amount of gas to be analyzed is 10 L or more, the acetone concentration can be calculated using Equation (3) by adopting the constant flow method. However, the constant flow method is considered unsuitable for breath measurements because the volume of exhaled breath is reportedly only 1–2 L.

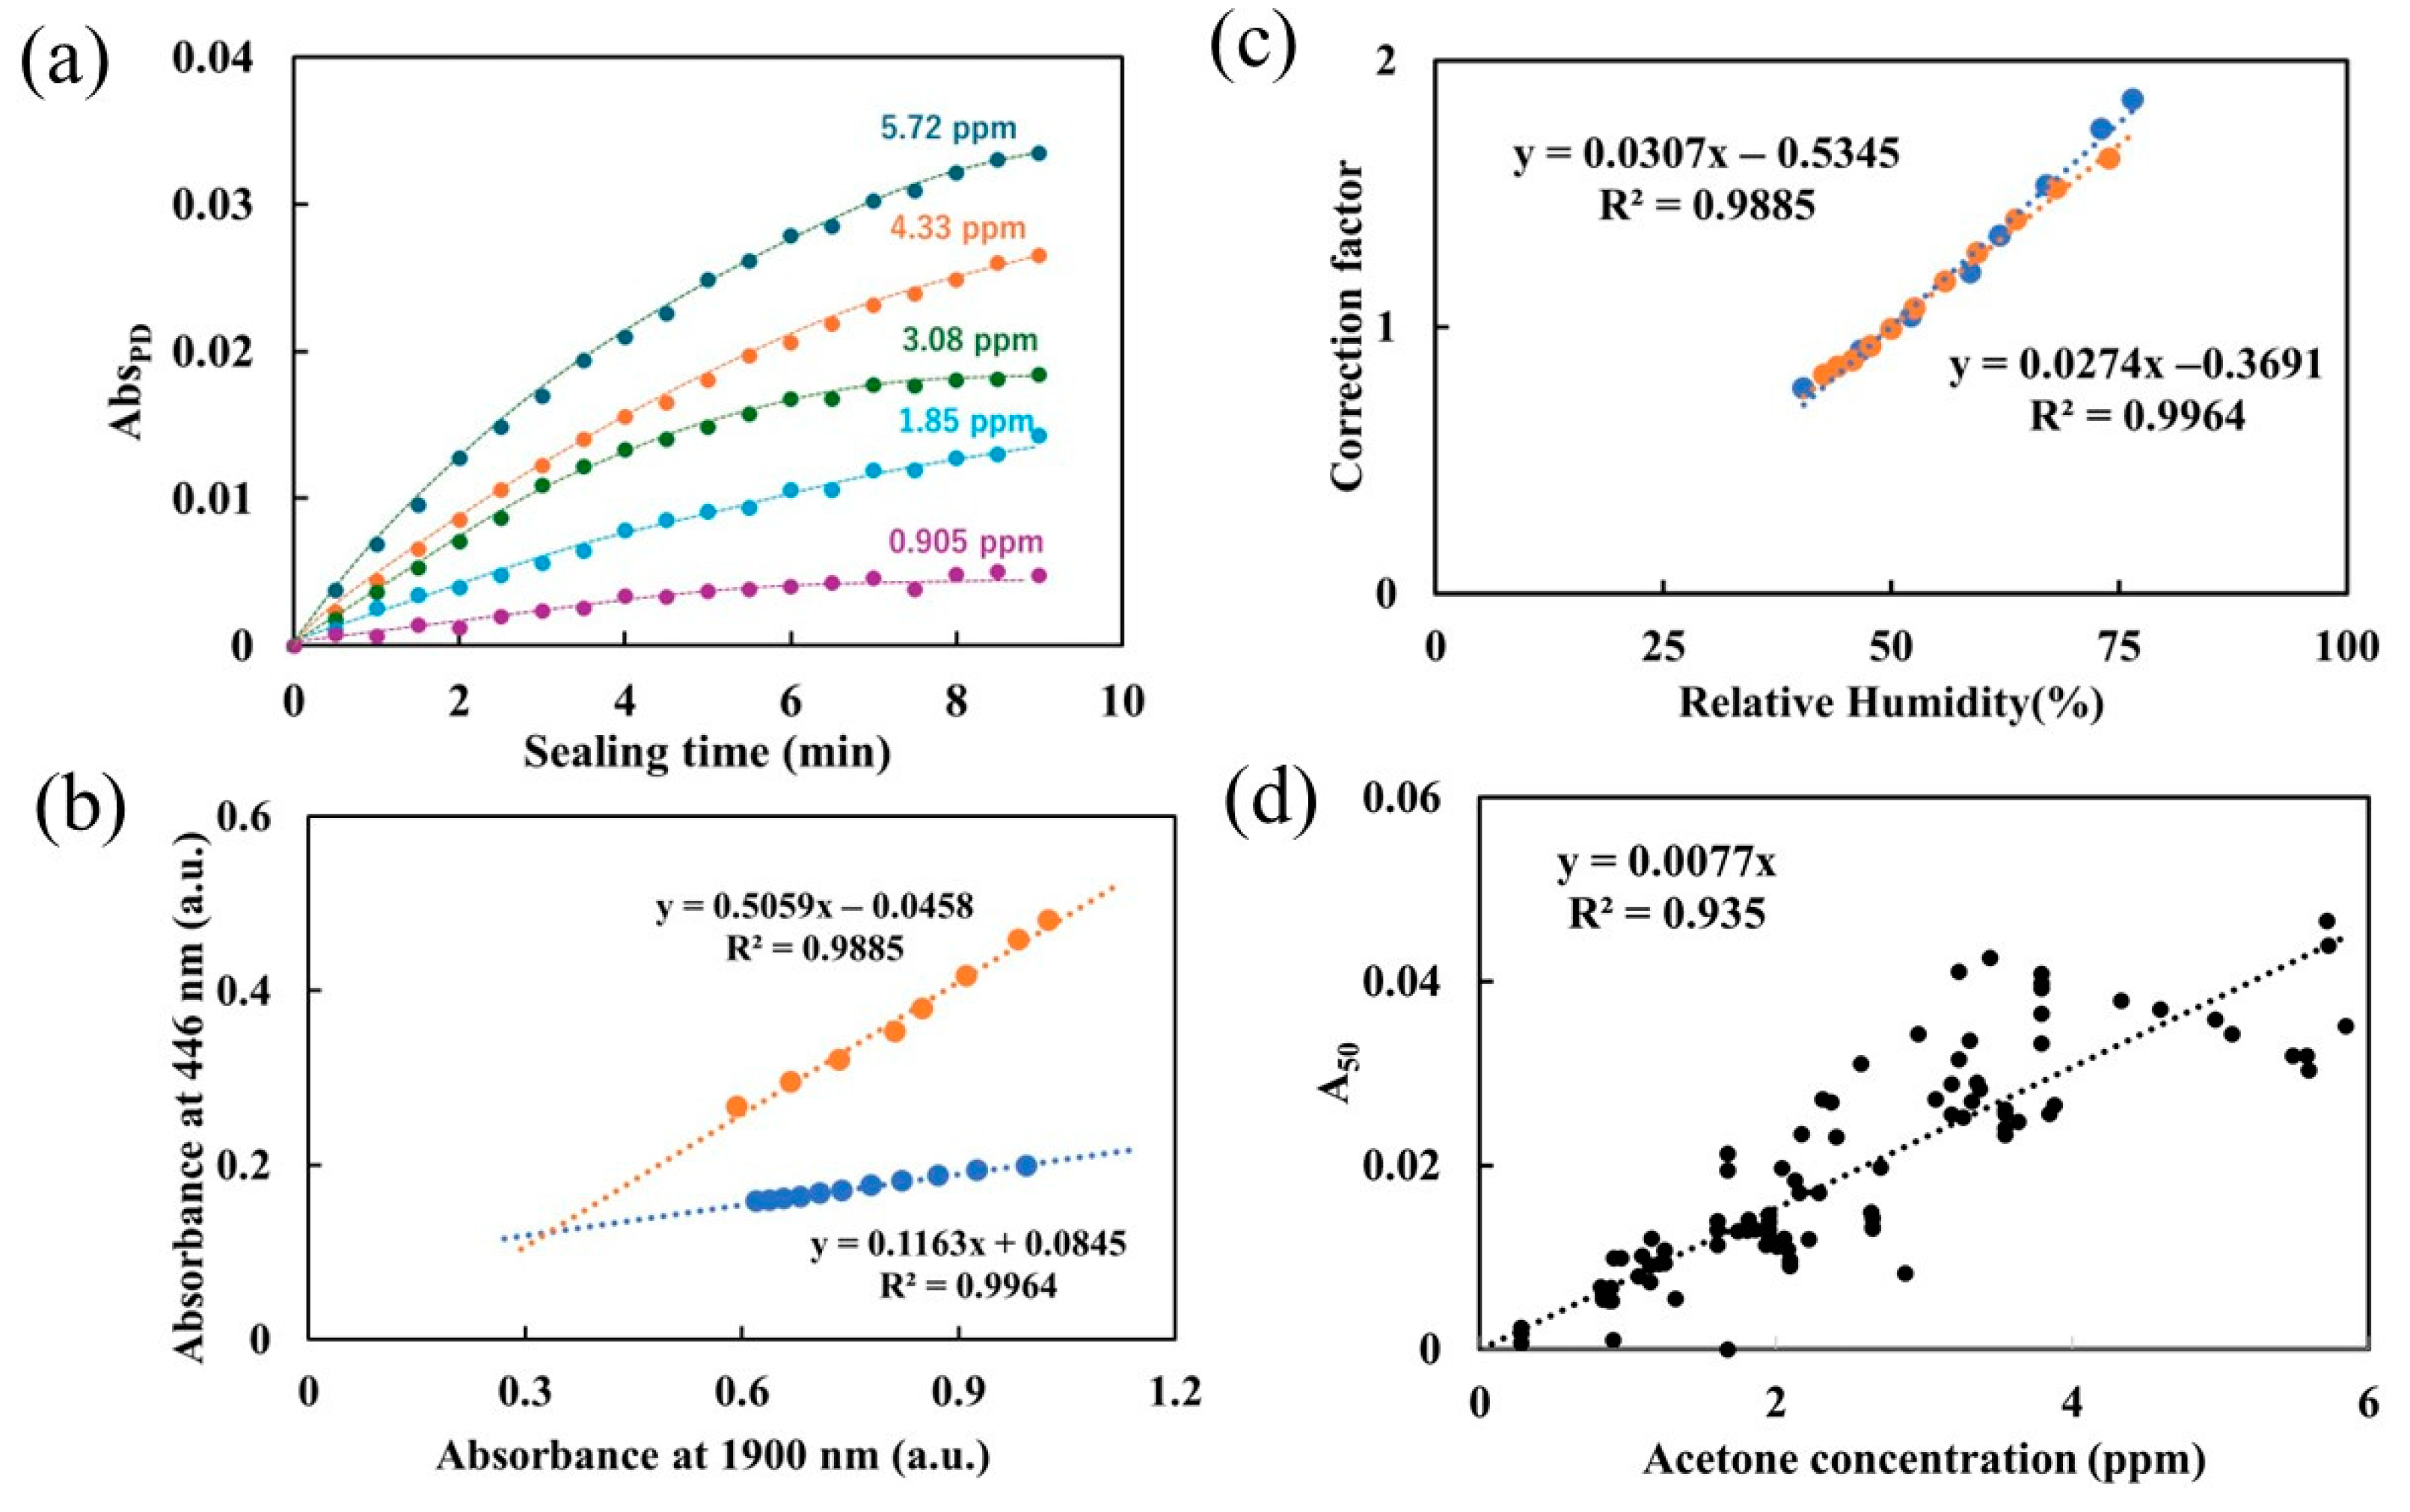
3.3. Performance of the Portable Device Using Flow–Stop Measurement

To measure acetone concentration in exhaled breath with a volume of 1–2 L, we developed a flow–stop method. In the flow–stop method, 1 L of acetone gas first flowed into the device; the gas was stopped, the upper and lower valves were closed to seal the portable device, and the absorbance of the analysis chip was measured every minute for 5–10 min. Figure 6a shows the relationship between the absorbance and time elapsed after the flow is stopped, using 1 L of exposed gas with acetone concentrations ranging from 0.905 to 5.72 ppm under conditions of 23.5 ± 1.5 °C and 45 ± 10% RH. The absorbance began to saturate as the closing time increased because the portable device had a closed space, and the number of acetone molecules in the closed space was limited. As the reaction progressed, the number of acetone molecules in the space decreased. As the number of acetone molecules decreased, the amount of A-2-NPH produced also decreased, and the absorbance tended to saturate. The concentration of A-2-NPH can be calculated by solving the reaction rate equation for 2-NPH and acetone in a closed space, and the absorbance is proportional to the amount of A-2-NPH. Therefore, the absorbance is expressed by Equation (4).
Abs t = A × 1 exp ( B × t )
Here, A is the saturation value of the absorbance at infinite time, which is the absorbance when all the acetone molecules in the closed space of the device have reacted. B is a constant that depends on the diffusion coefficient of acetone and the desorption rate of the acetone adsorbed on the device. The coefficients t and Abst represent the time (in minutes) elapsed from the flow–stop time and the absorbance at that time, respectively. The relationship shown in Figure 6a is fitted using Equation (4), and B has an average value of 0.199, with a standard deviation of 0.0885.
In addition, because exhaled breath was highly humid, it was necessary to determine the effect of humidity on the molar absorption coefficient of A-2-NPH and to apply a correction for accurate measurements. Figure 6b shows the relationship between the absorbance of the analytical chip at 446 nm and that at 1900 nm. The absorbance at 1900 nm of the analytical chip was proportional to the number of water molecules adsorbed on the porous glass’s surface of the chip, and this value was also proportional to RH at approximately 23 ± 2 °C. Figure 6b shows the results for the two analytical chips with different absorbance values at 446 nm. Because no reaction with acetone occurred, the change in absorbance was attributed to the change in the molar absorption coefficient. The molar absorption coefficient was linearly affected by the absorbance at 1900 nm. Based on these results, we corrected the absorbance values at 446 nm as a function of the humidity.
The background of absorbance at 446 nm, which is the absorbance of the analytical chip before exposure to acetone, where there is no A-2-NPH in the analytical chip, is 0.116, which is subtracted from the background value from each absorbance, as shown in Figure 6b. Next, the relationship between the ratio of absorbance and RH is calculated using 50% absorbance as the standard using the Equation (5), which shows the relationship between absorbance at 1900 nm and RH.
A b s 1900 0.106 = 0.709 0.106 × R H 50
where 0.106 and 0.709 are the absorbances at 1900 nm at 0% and 50% RH, respectively. The relationship obtained is shown in Figure 6c. This figure shows the relationship between the correction factor (k) based on 50% of the molar extinction coefficient and RH, which is expressed by Equation (6).
k = 0.0293 × R H 0.465
Therefore, if the correction value based on 50% of Abs446 is A50, A50 can be expressed by using Equation (7).
A 50 0.116 = A 0.116 k
where A is the calculated saturated absorbance at 446 nm using Equation (4). Using Equations (6) and (7) and the measured values of the absorbance at 446 nm and RH, we can calculate the absorbance at 446 nm corrected to 50%.
The relationship between the acetone concentration and the corrected A (A50) values calculated using Equations (4), (6), and (7) is shown in Figure 6d. A linear relationship is obtained between the two, and the relationship is expressed by Equation (8).
C = A 50 0.0077
where C is the acetone concentration (ppm) in the exposed atmosphere and A50 indicates the corrected A value based on 50%.
Therefore, we obtained the acetone concentration as follows.
(i)
The A value was calculated by using the results of the flow–stop measurements and Equation (4).
(ii)
The A value is corrected using Equations (6) and (7).
(iii)
Acetone concentration is calculated using Equation (8) and the corrected A value.
We also considered the effect of interference gases. The sensor operation relies on a chemical reaction between carbonyl groups and hydrazine compounds, without in-volving the interference of alcohols. Our experiments also confirm the non-interference of ethanol in the reaction. The carbonyl compound 2-butanone, which is contained in breath, is considered to cause interference effects. However, our experiments conducted with this substance yielded a B value of 0.22, and the corresponding sensitivity was 52% for the same concentration of acetone. Notably, the reported concentration of 2-butanone in exhaled air was 2.2 ppb [31], which is insufficient to cause interference. In addition, aldehydes, which are present in trace amounts in breath, do not cause interference.

3.4. Exhaled Breath Measurement

Exhaled breath (1 L) was collected after the exercise, and measurements were performed using the flow–stop method after 24 h of standing still in a Tedlar bag. Preliminary studies revealed that the humidity of the atmosphere collected in the sampling bag was the same as that of the indoor air after it was left to stand for 24 h. Therefore, the RH of the collected exhaled breath was equal to the that of the indoor air, and the acetone concentration was calculated using the flow–stop method. Figure 7a shows the relationship between the acetone concentration calculated using the developed device and the results measured by the gas chromatograph (SGEA-P3-A). The concentrations of the four subjects varied, with some showing low values and others showing high values. However, the measured concentrations exhibited good agreement with those obtained by the SGEA-P3-A, indicating a determination coefficient of 0.82. In addition, Figure 7b shows the time changes in the exhaled acetone concentrations after exercise for each individual. The acetone concentration in the exhaled breath after exercise exhibited an increasing trend for all subjects; however, the rate of increase varied between individuals. In the feasibility study, the number of samples in the feasibility study was four, which was insufficient to evaluate the performance of the device. Therefore, we intend to increase the number of samples in the evaluation in future research.

4. Conclusions

In this study, an analytical chip using porous glass and 2-NPH and a portable device equipped with a blue laser and a photodiode was developed to investigate a simple method for measuring acetone in exhaled breath. The reaction product of 2-NPH and acetone (A-2-NPH) exhibited an absorption peak at 446 nm in the visible-light region. The reaction progressed rapidly, and A-2-NPH was highly stable. Acetone measurements were performed using the constant flow and the flow–stop methods with a portable device. In the constant flow method, acetone concentrations of 0–3 ppm were measured at a flow rate of 1.0 L/min and a measurement time of 10 min. This method required a gas volume of 10 L. In the flow–stop method, acetone concentrations of 0–6 ppm with a detection limit of 0.22 ppm were measured with a measurement time of 10 min, and the required gas volume was only 1 L. In addition, humidity correction was possible, and the coefficient of determination between the acetone concentration of the developed device and analytical chip and that of the gas chromatograph was 0.93. Furthermore, exhaled breath measurements were performed on four healthy individuals using the flow–stop method. The coefficient of determination between the acetone concentration of the developed device and analytical chip and that of the gas chromatograph was 0.82, demonstrating good agreement. Moreover, an increasing trend in exhaled acetone concentration was observed after exercise for each of the subjects. In this breath measurement, a time interval of 24 h was maintained between breath collection and measurement to control humidity. In addition, the information on interfering gases was inadequate. Further, the number of participants who performed the breath measurement was only four, which was insufficient for evaluating the performance of the device. In the future, we plan to conduct real-time breath measurement, examine interfering gases, and increase the number of participants who undergo breath measurements to examine the feasibility of measuring the composition of real breath.

Author Contributions

Conceptualization, Y.Y.M.; methodology, Y.Y.M. and A.K.; validation, Y.M.; formal analysis, Y.M., Y.Y.M. and A.K.; investigation, Y.M.; data curation, Y.M.; investigation: humidity effect, S.W.; investigation: breath analysis, M.O.; investigation: interference, K.T.; writing—original draft preparation, Y.M. and Y.Y.M.; writing—review and editing, Y.M. and Y.Y.M.; visualization, Y.M., Y.Y.M. and A.K.; supervision, Y.Y.M. All authors have read and agreed to the published version of the manuscript.

Funding

This research received no external funding.

Institutional Review Board Statement

The study was conducted according to the guidelines of the Declaration of Helsinki and approved by the Ethics Committee of Tohoku Institute of Technology (protocol code No. 875, 7/17/2020).

Informed Consent Statement

Informed consent was obtained from all subjects involved in the study.

Data Availability Statement

Data are contained within this article.

Acknowledgments

We thank those who donated their breaths.

Conflicts of Interest

The authors declare that the research was conducted in the absence of any commercial or financial relationship that could be constructed as a potential conflict of interest.

Abbreviations

The following abbreviations are used in this manuscript:
VOCVolatile organic compound
MSMass spectrometry
GO@CNCGraphene oxide@cellulose nanocrystal
NPNanoparticle
4-NPH4-nitrophenylhydrazine
2-NPH2-nitrophenylhydrazine
A-2-NPHAcetone-2-NPH

References

  1. Buszewski, B.; Kęsy, M.; Ligor, T.; Amann, A. Human exhaled air analytics: Biomarkers of diseases. Biomed. Chromatogr. 2007, 21, 553–566. [Google Scholar] [PubMed]
  2. Bajo-Fernández, M.; Souza-Silva, É.A.; Barbas, C.; Rey-Stolle, M.F.; García, A. GC-MS-based metabolomics of volatile organic compounds in exhaled breath: Applications in health and disease. A review. Front. Mol. Biosci. 2024, 10, 1295955. [Google Scholar]
  3. Tsai, C.C.; Chou, H.H.; Wu, T.L.; Yang, Y.H.; Ho, K.Y.; Wu, Y.M.; Ho, Y.P. The levels of volatile sulfur compounds in mouth air from patients with chronic periodontitis. J. Periodontal Res. 2008, 43, 186–193. [Google Scholar]
  4. Alzoman, H.; Rashid Habib, S.; Alghamdi, S.; Al-Juhani, H.; Daabash, R.; Al-Khalid, W.; Al-Askar, M.; Al-Johany, S. Relationship between fixed dental crowns and volatile sulphur compounds. Int. J. Environ. Res. Public Health 2021, 18, 1283. [Google Scholar] [CrossRef]
  5. Fuchs, P.; Loeseken, C.; Schubert, J.K.; Miekisch, W. Breath gas aldehydes as biomarkers of lung cancer. Int. J. Cancer 2010, 126, 2663–2670. [Google Scholar] [PubMed]
  6. Mochalski, P.; Leja, M.; Slefarska-Wolak, D.; Mezmale, L.; Patsko, V.; Ager, C.; Królicka, A.; Mayhew, C.A.; Shani, G.; Haick, H. Identification of key volatile organic compounds released by gastric tissues as potential non-invasive biomarkers for gastric cancer. Diagnostics 2023, 13, 335. [Google Scholar] [CrossRef]
  7. Wang, Z.; Wang, C. Is breath acetone a biomarker of diabetes? A historical review on breath acetone measurements. J. Breath Res. 2013, 7, 037109. [Google Scholar]
  8. Samudrala, D.; Geurts, B.; Brown, P.A.; Szymańska, E.; Mandon, J.; Jansen, J.; Buydens, L.; Harren, F.J.M.; Cristescu, S.M. Changes in urine headspace composition as an effect of strenuous walking. Metabolomics 2015, 11, 1656–1666. [Google Scholar] [CrossRef]
  9. Saasa, V.; Malwela, T.; Beukes, M.; Mokgotho, M.; Liu, C.-P.; Mwakikunga, B. Sensing technologies for detection of acetone in human breath for diabetes diagnosis and monitoring. Diagnostics 2018, 8, 12. [Google Scholar] [CrossRef]
  10. Hancock, G.; Sharma, S.; Galpin, M.; Lunn, D.; Megson, C.; Peverall, R.; Richmond, G.; Ritchie, G.A.D.; Owen, K.R. The correlation between breath acetone and blood betahydroxybutyrate in individuals with type 1 diabetes. J. Breath Res. 2020, 15, 017101. [Google Scholar]
  11. World Health Organization (WHO). Diabetes. 2024. Available online: https://www.who.int/news-room/fact-sheets/detail/diabetes (accessed on 14 February 2025).
  12. Sun, M.; Wang, Z.; Yuan, Y.; Chen, Z.; Zhao, X.; Li, Y.; Wang, C. Continuous monitoring of breath acetone, blood glucose and blood ketone in 20 type 1 diabetic outpatients over 30 days. J. Anal. Bioanal. Tech. 2017, 8, 1000386. [Google Scholar]
  13. Liu, H.; Liu, W.; Sun, C.; Huang, W.; Cui, X. A review of non-invasive blood glucose monitoring through breath acetone and body surface. Sens. Actuat. A Phys. 2024, 374, 115500. [Google Scholar] [CrossRef]
  14. Beukes, V.; Beukes, M.; Lemmer, Y.; Mwakikunga, B. Blood ketone bodies and breath acetone analysis and their correlations in type 2 diabetes mellitus. Diagnostics 2019, 9, 224. [Google Scholar] [CrossRef]
  15. Malik, M.; Demetrowitsch, T.; Schwarz, K.; Kunze, T. New perspectives on ‘Breathomics’: Metabolomic profiling of non-volatile organic compounds in exhaled breath using DI-FT-ICR-MS. Commun. Biol. 2024, 7, 258. [Google Scholar]
  16. Filipiak, W.; Sponring, A.; Baur, M.M.; Ager, C.; Filipiak, A.; Wiesenhofer, H.; Nagl, M.; Troppmair, J.; Amann, A. Characterization of volatile metabolites taken up by or released from Streptococcus pneumoniae and Haemophilus influenzae by using GC-MS. Microbiology 2012, 158, 3044–3053. [Google Scholar]
  17. Wong, J.W.; Zhang, K.; Tech, K.; Hayward, D.G.; Krynitsky, A.J.; Cassias, I.; Schenck, F.J.; Banerjee, K.; Dasgupta, S.; Brown, D. Multiresidue pesticide analysis of ginseng powders using acetonitrile- or acetone-based extraction, solid-phase extraction cleanup, and gas chromatography-mass spectrometry/selective ion monitoring (GC-MS/SIM) or tandem mass spectrometry (GC-MS/MS). J. Agric. Food Chem. 2010, 58, 5884–5896. [Google Scholar]
  18. Mendel, J.; Frank, K.; Edlin, L.; Hall, K.; Webb, D.; Mills, J.; Holness, H.K.; Furton, K.G.; Mills, D. Preliminary accuracy of COVID-19 odor detection by canines and HS-SPME-GC-MS using exhaled breath samples. Forensic Sci. Int. Synergy 2021, 3, 100155. [Google Scholar]
  19. Schwarz, K.; Pizzini, A.; Arendacká, B.; Zerlauth, K.; Filipiak, W.; Schmid, A.; Dzien, A.; Neuner, S.; Lechleitner, M.; Scholl-Bürgi, S.; et al. Breath acetone-aspects of normal physiology related to age and gender as determined in a PTR-MS study. J. Breath Res. 2009, 3, 027003. [Google Scholar] [CrossRef]
  20. Henderson, B.; Slingers, G.; Pedrotti, M.; Pugliese, G.; Malásková, M.; Bryant, L.; Lomonaco, T.; Ghimenti, S.; Moreno, S.; Cordell, R.; et al. The peppermint breath test benchmark for PTR-MS and SIFT-MS. J. Breath Res. 2021, 15, 046005. [Google Scholar] [CrossRef]
  21. Roquencourt, C.; Grassin-Delyle, S.; Théevenot, E.A. ptairMS: Real-time processing and analysis of PTR-TOF-MS data for biomarker discovery in exhaled breath. Bioinformatics 2022, 38, 1930–1937. [Google Scholar]
  22. Španěl, P.; Dryahina, K.; Rejšková, A.; Chippendale, T.W.E.; Smith, D. Breath acetone concentration; biological variability and the influence of diet. Physiol. Meas. 2011, 32, N23–N31. [Google Scholar] [CrossRef]
  23. Durán Acevedo, C.M.; Carrillo Gómez, J.K.; Cuastumal Vasquez, C.A.; Ramos, J. Prostate cancer detection in Colombian patients through E-senses devices in exhaled breath and urine samples. Chemosensors 2024, 12, 11. [Google Scholar] [CrossRef]
  24. Jiang, L.; Lv, S.; Tang, W.; Zhao, L.; Wang, C.; Wang, J.; Wang, T.; Guo, X.; Liu, F.; Wang, C.; et al. YSZ-based acetone sensor using a Cd2SnO4 sensing electrode for exhaled breath detection in medical diagnosis. Sens. Actuators B 2021, 345, 130321. [Google Scholar]
  25. Orasugh, J.T.; Saasa, V.; Ray, S.S.; Mwakikunga, B. Supersensitive metal free in-situ synthesized graphene oxide@cellulose nanocrystals acetone sensitive bioderived sensors. Int. J. Biol. Macromol. 2023, 241, 124514. [Google Scholar]
  26. Jahromi, H.D.; Kazemi, M.; Sheikhi, M.H. Room temperature and highly sensitive acetone sensor based on lead sulfide nanosheets. Mater. Sci. Eng. B 2021, 267, 115082. [Google Scholar]
  27. Rabih, A.A.S.; Dennis, J.O.; Ahmed, A.Y.; Md Khir, M.H.; Ahmed, M.G.A.; Idris, A.; Mian, M.U. MEMS-Based acetone vapor sensor for non-invasive screening of diabetes. IEEE Sens. J. 2018, 18, 9740–9747. [Google Scholar]
  28. Zhang, J.; Lei, C.; Liang, T.; Liu, R.; Zhao, Z.; Qi, L.; Ghaffar, A.; Xiong, J. Acetone sensor based on FAIMS-MEMS. Micromachines 2021, 12, 1531. [Google Scholar] [CrossRef]
  29. Sachdeva, S.; Agarwal, R.; Agarwal, A. MEMS based tin oxide thin film gas sensor for diabetes mellitus applications. Microsyst. Technol. 2019, 25, 2571–2586. [Google Scholar]
  30. Ito, K.; Kawamura, N.; Suzuki, Y.; Maruo, Y.Y. Colorimetric detection of gaseous acetone based on a reaction between acetone and 4-nitrophenylhydrazine in porous glass. Microchem. J. 2020, 159, 105428. [Google Scholar]
  31. Mochalski, P.; Mochalski, J.; Mochalski, M.; Mochalski, K.; Hinterhuber, H.; Baumann, M.; Amann, A. Blood and breath levels of selected volatile organic compounds in healthy volunteers. Analyst 2013, 138, 2134–2145. [Google Scholar]
Figure 1. Portable device and setup for measurement.
Chemosensors 13 00136 g001
Figure 2. Process of breath sample collection.
Chemosensors 13 00136 g002
Figure 3. Characteristic of 2-NPH analytical chip; (a) absorption spectrum changes of the analytical chip before and after exposure to acetone atmosphere at 6.62 ppm for 3 h, (b) reaction formula between acetone and 2-NPH, and (c) calibration curve used passive exposure method; exposure time: 3 h.
Chemosensors 13 00136 g003
Figure 4. Device performance in the constant flow method; (a) relationship between absorbance measured by spectrometer and that measured by developed portable device, (b) dependence of absorbance difference/min on flow rate (acetone concentration: 2 ppm, exposure time: 1 min), and (c) changes in absorbance difference/0.5 min when exposed alternately to acetone and acetone-free atmosphere.
Chemosensors 13 00136 g004
Figure 5. Calibration of the constant flow method; (a) absorbance changes and exposure time, (b) relationship between the slope of absorbance–time curve and acetone concentration.
Chemosensors 13 00136 g005
Figure 6. Performance of the flow–stop method; (a) relationship between the sealing time and absorbance using 1 L of acetone atmosphere (acetone concentration: 0.905–5.72 ppm, Temp: 23.5 ± 1.5 °C, RH: 45 ± 5%), (b) relationship between the absorbance of the reaction products and the absorbance of 1900 nm in two chips with different product amounts, (c) the correction factor of molar absorption coefficient of A-2-NPH and RH, and (d) calibration curve of A50 vs. acetone concentration.
Chemosensors 13 00136 g006
Figure 7. Exhaled breath measurement; (a) relationship between acetone concentration in exhaled breath measured by portable device and by SGEA-P3-A during and after exercise, and (b) time-dependent change in acetone concentration in exhaled breath after exercise.
Chemosensors 13 00136 g007
Disclaimer/Publisher’s Note: The statements, opinions and data contained in all publications are solely those of the individual author(s) and contributor(s) and not of MDPI and/or the editor(s). MDPI and/or the editor(s) disclaim responsibility for any injury to people or property resulting from any ideas, methods, instructions or products referred to in the content.

