Article

Banana Flour Adulteration Key Marker Unravelled by Inductively Coupled Plasma Optical Emission Spectrometry Assisted by Chemometric Tools

by
Silvio Luiz Fernandes Júnior
1,
Paula Mothé Gonçalves
2,
Diego Barros Batista
2,
Aderval S. Luna
1,
Fernanda Nunes Ferreira
2,
Licarion Pinto
1,2 and
Jefferson Santos de Gois
1,2,*
1
Graduate Program in Chemical Engineering, Rio de Janeiro State University, Rua São Francisco Xavier 524, Rio de Janeiro 20550-013, Brazil
2
Department of Analytical Chemistry, Rio de Janeiro State University, Rua São Francisco Xavier 524, Rio de Janeiro 20550-013, Brazil
*
Author to whom correspondence should be addressed.
Chemosensors 2025, 13(4), 153; https://doi.org/10.3390/chemosensors13040153
Submission received: 26 February 2025 / Revised: 9 April 2025 / Accepted: 16 April 2025 / Published: 21 April 2025
(This article belongs to the Special Issue Chemometrics for Analytical Chemistry: Second Edition)

Abstract

:
Green banana flour has been gaining prominence as a functional food due to its high nutritional value and health benefits. However, its increasing commercialization has also raised concerns about adulteration, which can compromise both product quality and consumer confidence. In this study, we propose a simple method to detect adulteration in banana flour using ICP-OES combined with chemometric tools. A total of 73 samples, including authentic and adulterated flours, were analyzed for their mineral composition (B, Ca, Cu, Fe, Mn, P, K, Mg, and Na). The limit of detection was determined for all analytes, being 0.005 µg g−1 (Ca), 0.007 µg g−1 (K), 0.02 µg g−1 (Mg), 0.04 µg g−1 (Na), 0.001 µg g−1 (P), 3 µg g−1 (B), 1.4 µg g−1 (Cu), 0.4 µg g−1 (Fe), and 3 µg g−1 (Mn). Applying chemometric techniques, such as Principal Component Analysis, Linear Discriminant Analysis, and Partial Least Squares Discriminant Analysis, allowed us to distinguish the authentic samples from the adulterated ones clearly. With the help of chemometric tools, it was found that K is a key marker to identify adulteration. The applied techniques demonstrated high precision in detecting adulterations and providing a confidence limit to identify banana flour fraud, proving to be a promising tool for ensuring the authenticity of green banana flour.

1. Introduction

Green banana flour is a new, high-value food product that has recently been identified as being prone to accidental and intentional adulteration [1]. The practice of intentional adulteration is motivated by profit, as well as by the ease of access to cheaper adulterants [2]. This practice harms the functional qualities of food products and the health of consumers. In addition, it has a negative impact on the global economy [3].
There is no doubt that the growth in green banana flour processing has intensified competition between producing countries; emerging food products based solely on basic components such as protein and moisture content are no longer sufficient, and consumers need clear and relevant information about the specific benefits of the foods they consume to make informed choices [4].
Regulatory agencies in various countries are responsible for establishing their own regulations to ensure food safety. For the same product, additive, or adulterant, the tolerable limits may vary between countries, but there are many similarities in some cases. The maximum permitted levels of foreign matter in food are based on health risks, considering the consumer profile, processing, preparation conditions, dietary patterns, and mode of consumption [5].
In Brazil, the National Health Surveillance Agency has established regulations specifying maximum allowable sand levels in certain food products, including 1.5% in spices, condiments, and dehydrated vegetables, 2% in fennel and ginger, 3.5% in marjoram, and 3% in oregano [6]. Similarly, European guidelines set limits for mineral contamination, such as soil or sand, in plant materials used for herbal infusions, ranging from 1% for mate leaves and honey brush to 5% for lemongrass, with intermediate values like 2.5% for chamomile and fennel [6]. International pharmacopeial standards commonly set a maximum limit of 2% for foreign matter, including sand, in herbal ingredients across several countries, such as China, Mexico, and the United States [5].
Therefore, the mineral composition of foods plays a crucial role in terms of safety and nutritional value. Essential elements such as Ca, Fe, Zn, and Se are vital for maintaining a balanced diet. At the same time, deficiencies or excessive levels of certain minerals can lead to metabolic disorders or toxicity, which highlights the importance of monitoring and regulating the mineral content of foods [7,8].
Another critical aspect is the impact of adulteration on consumer health. The presence of toxic elements, such as Pb and Cd, can have harmful long-term effects [9]. At the same time, adulteration may undermine the nutritional benefits of green banana flour, reducing its probiotic and antioxidant efficacy. Moreover, the lack of proper control over essential minerals can lead to severe nutritional deficiencies, as highlighted by global health organizations [10].
In view of this, studies emphasize the importance of accurate analytical methods to detect such adulterations. Advanced analytical techniques are widely used to identify the presence of undesirable substances and contaminants, such as chemical additives or trace metals. In addition, methods such as atomic absorption spectrometry (AAS) and inductively coupled plasma optical emission spectrometry (ICP-OES) are also essential tools in the mineral analysis of foods. These techniques allow for the determination of minerals at the micro and macronutrient levels, helping to ensure the authenticity and safety of products [7,11].
In addition to the analytical techniques employed for detecting food adulteration, chemometrics has also been used to perform quality analysis on various food samples, such as meat, milk, vegetables, vinegar, cereals, and wines, because due to the complexity of analyzing these samples, autonomous instrumental analysis cannot always detect food adulteration and fraud. Therefore, the application of chemometrics in quality control, data processing, and analysis has proven to be an effective approach to address the most challenging food-related cases [12].
Among chemometric algorithms, the most used algorithms have been Principal Component Analysis (PCA), Soft Independent Modelling of Class Analogies (SIMCA), Linear Discriminant Analysis (LDA), and Partial Least Squares Discriminant Analysis and (PLS-DA) since these techniques are simple to use and to understand and easily enable the interpretation of the most significant variable for the classification model [13]. Regarding instrumental methods, inductively coupled plasma mass spectrometry (ICP-MS) has been the preferred technique for elemental analyses, followed by ICP-OES. This choice is justified by the wide range of elements that can be determined and the low LOD and LOQ achieved. However, other instrumental techniques, such as Laser-Induced Breakdown Spectroscopy (LIBS), which allows for direct sample analysis and the acquisition of spectral data, and Microwave-Induced Plasma Optical Emission Spectrometry (MIP-OES) and ICP-OES are expected to be more widely adopted. Combined with chemometric approaches, these methods offer a comprehensive strategy for tackling food analysis challenges [14].
In view of the above, this study seeks to perform microwave-assisted digestion followed by determining B, Ca, Cu, Fe, Mn, P, K, Mg, and Na using ICP-OES, combined with chemometric techniques, to identify distinct patterns of authentic and adulterated green banana flours.

2. Materials and Methods

2.1. Instruments

All analyses were carried out using ICP-OES (model iCAP 6000, Thermo Scientific, Waltham, MA, USA). The wavelengths monitored were Ca (422.673 nm), K (766.490 nm), Mg (280.270 nm), Na (589.592 nm), P (214.914 nm), B (249.678 nm), Cu (327.396 nm), Fe (238.204 nm), and Mn (259.373 nm). The instrument was equipped with a V-Groove nebulizer and a cyclonic spray chamber. Operational parameters included radial view for B, Cu, Fe, and Mn and axial view for the remaining elements. Other settings were a pump rate of 60 rpm, plasma gas flow at 15 L min−1, radio frequency power set to 1300 W, auxiliary gas flow rate of 1.0 L min−1, and nebulizer gas flow rate of 0.39 L min−1. All measurements were conducted in triplicate. Argon (99.95% minimum, Air Liquide, Rio de Janeiro, RJ, Brazil) was used as the plasma, auxiliary, and nebulizer gas.
Microwave-assisted digestion was conducted using a “Microwave Reaction System, Multiwave PRO” (Anton Paar, Graz, Austria), with sealed digestion vessels. The system operated at a maximum microwave power of 1500 W, an internal temperature of 200 °C, and a maximum pressure of 20 bar.

2.2. Reagents and Standards

All reagents used were of analytical grade or higher. Ultrapure water, with a resistivity of 18.2 MΩ, was obtained from an ultra-purifier system (MS3000, Master System, Gehaka, São Paulo, SP, Brazil) and utilized to prepare sample and reagent dilutions. The reagents used in sample preparation included HNO3 ≈ 14 mol L−1 (Quimis, São Paulo, SP, Brazil) and H2O2 ≈ 30% (m/v) (ISOFAR, Duque de Caxias, RJ, Brazil). Nitric acid was purified using a polytetrafluoroethylene (PTFE) sub-boiling system (model Distill acid BSB-939-IR, Berghof, Germany).
For the analytical calibration curves and recovery tests, individual standard solutions containing 1000 mg L−1 of the analytes B, Ca, Cu, Mn, and P (Specsol®, Jacareí, São Paulo, Brazil), K (MERCK, Darmstadt, Germany), Fe and Mg (SCP Science, Quebec, Canada), and Na (VETEC, Duque de Caxias, RJ, Brazil) were used.

2.3. Samples

Green banana flour was prepared in the laboratory to ensure the authenticity of the samples. Fifteen batches of two banana species Musa sapientum and Musa acuminata Cavendish, which will be here respectively referred to as silver and water banana, were peeled, longitudinally sliced, and dried at 65 °C for 24 h. Afterward, the dried fruits were ground using a Hamilton Beach grinder (Sterling, VA, USA), and contamination from the grinder system was monitored using control samples (proving no contamination occurred). Oat, wheat, and corn flours were used to simulate common adulterations found in higher-cost flours. Before mixing, all four powdered materials were sifted through a 20 Tyler Mesh sieve to control particle size and improve sample homogeneity. From these batches, silver and water banana flour samples were collected to ensure variability in the sampling process, totaling thirty authentic (non-adulterated) examples. For the adulterated set, silver and water banana flours were separately mixed with the adulterant flours in the mass proportions of 10%, 20%, 40%, 60%, 80%, and 100% adulterant. A total of 73 samples were analyzed in triplicate, resulting in 219 instances.

2.4. Microwave-Assisted Digestion

Approximately 0.5000 g of each sample was used in the microwave-assisted digestion procedure. The samples underwent microwave-assisted digestion, adding 3.0 mL of bidistilled HNO3 (14 mol L−1) and 2.0 mL of H2O2 ≈ 30% (w/v). Blank samples were prepared similarly but without adding the samples to the vessels. The vessels were sealed, placed in the oven, and subjected to the heating program, which involved a temperature ramp from 30 °C to 180 °C in 20 min, followed by a 10 min hold at this temperature. Afterward, the samples were allowed to cool to 70 °C over 19 min. Finally, all samples were diluted to a final volume of 50.0 mL prior to analysis.

2.5. Chemometric Models with ICP-OES Data

Previously to each model adjustment, the sample set was autoscaled to ensure that all variables contributed equally to the modeling process. This procedure will help to identify key markers of adulteration. Initially, all the samples were submitted to descriptive analysis, followed by a heatmap evaluation, a hierarchical cluster analysis, and an exploratory analysis with PCA. All these calculations were performed using the chemometrics web app graphical user interface) in a free and open-source environment [15,16].
Classification models were developed to identify the three adulterations investigated in this study. For this purpose, all the samples were split into two sets. One was used to build the PLS-DA and LDA models using 70% of all samples and called the training set. The other 30% of all samples were external samples that were used as a test set to evaluate the model performance. The sample partitions were performed using the Kennard–Stone algorithm, which was performed for each individual class on the previously highlighted split ratio [17,18]. All the calculations for the development of supervised models used to predict adulteration were performed on the MatLab 2010b environment using the classification toolbox [19].

3. Results and Discussion

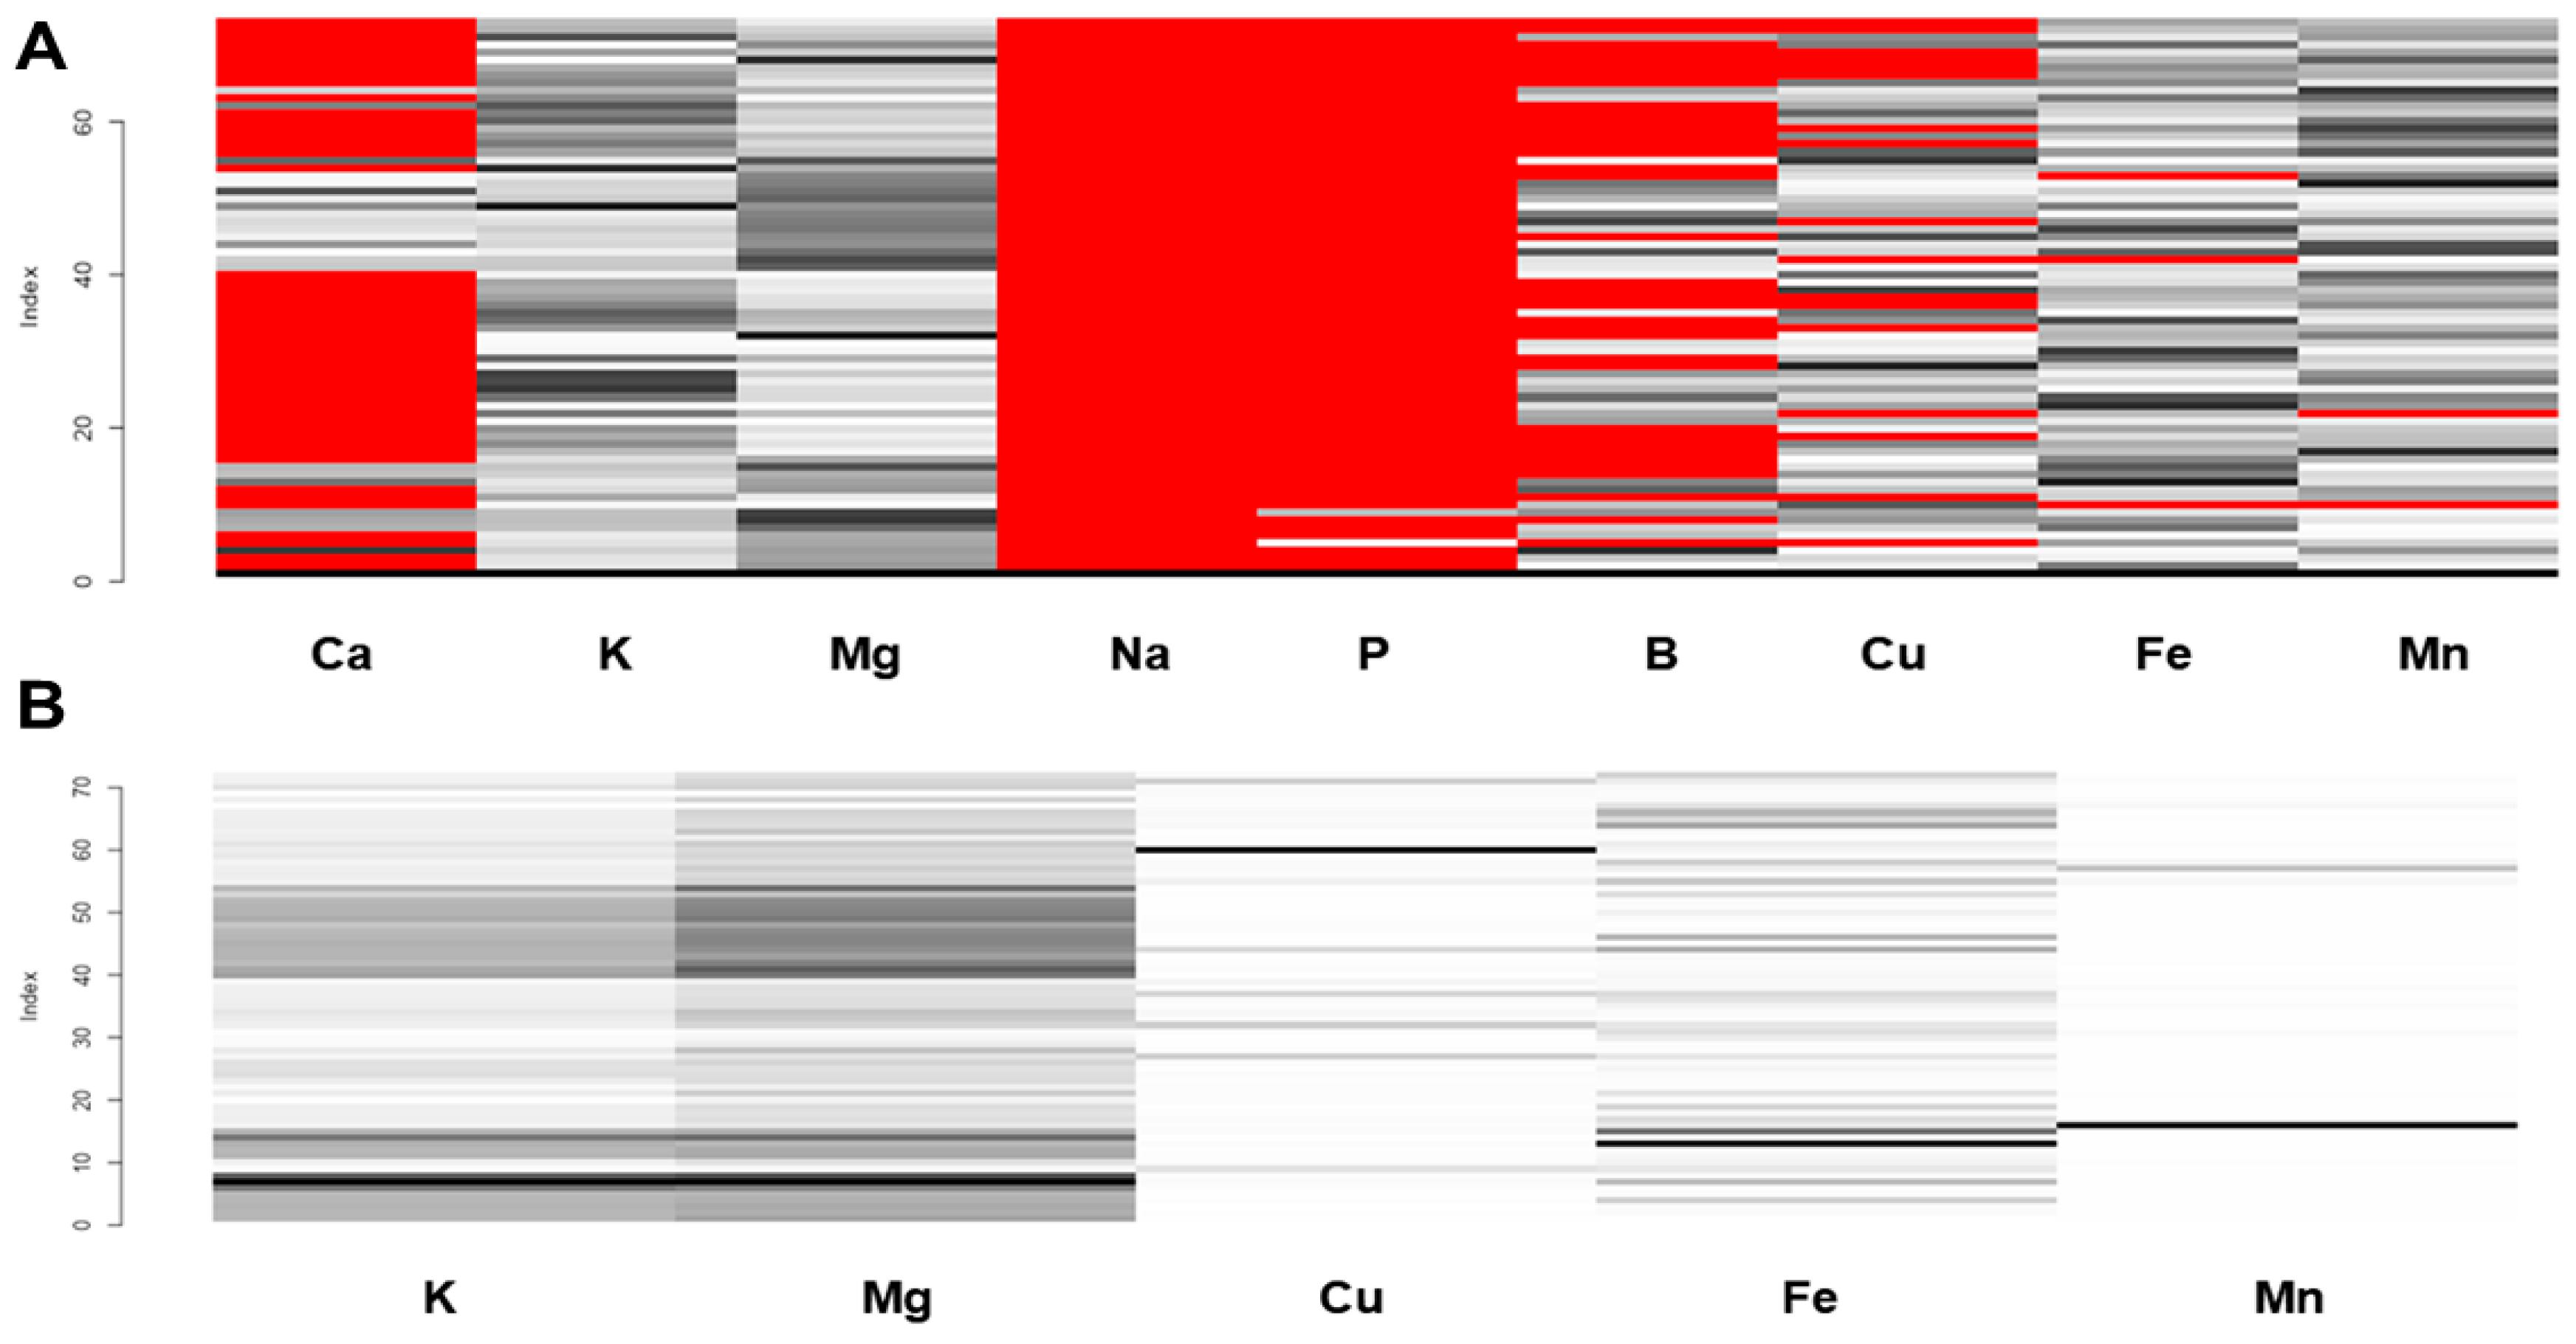
3.1. Missing Data Imputation

Ten analytical blank solutions were measured by ICP-OES to calculate the limit of detection (LOD) and limit of quantification (LOQ). For the LOD calculation, 3.29 was multiplied by the standard deviation of the blank measurements and divided by the slope of the analytical curve, which was performed along with the blank samples (sample mass and dilutions were taken into account for the calculation). The LOD and LOQ values obtained for the present method are described in Table 1. The accuracy of the method was accessed by recovery tests, where all values were within the acceptable range of 80–120%.
Out of the 72 instances analyzed, 49 (67.12%) were below the limit of detection (LOD) for Ca, while all samples were below the LOD for Na. Regarding P, 71 samples (97.26%) had undetectable values, as did 38 samples (52.05%) for B, 21 (28.77%) for Cu, and 3 (4.11%) for both Fe and Mn (Figure 1A).
Given this, only the elements K, Mg, Cu, Fe, and Mn were used for data imputation, considering a missing data rate below 50%, as illustrated in Figure 1B. Several imputation strategies were evaluated, but the KNN (K = 3) presented better results when evaluating the Kolmogorov–Smirnov test and the variation of the box plot of the original and imputed data. These results indicate that no artifact was introduced as new variability on the dataset after imputation.

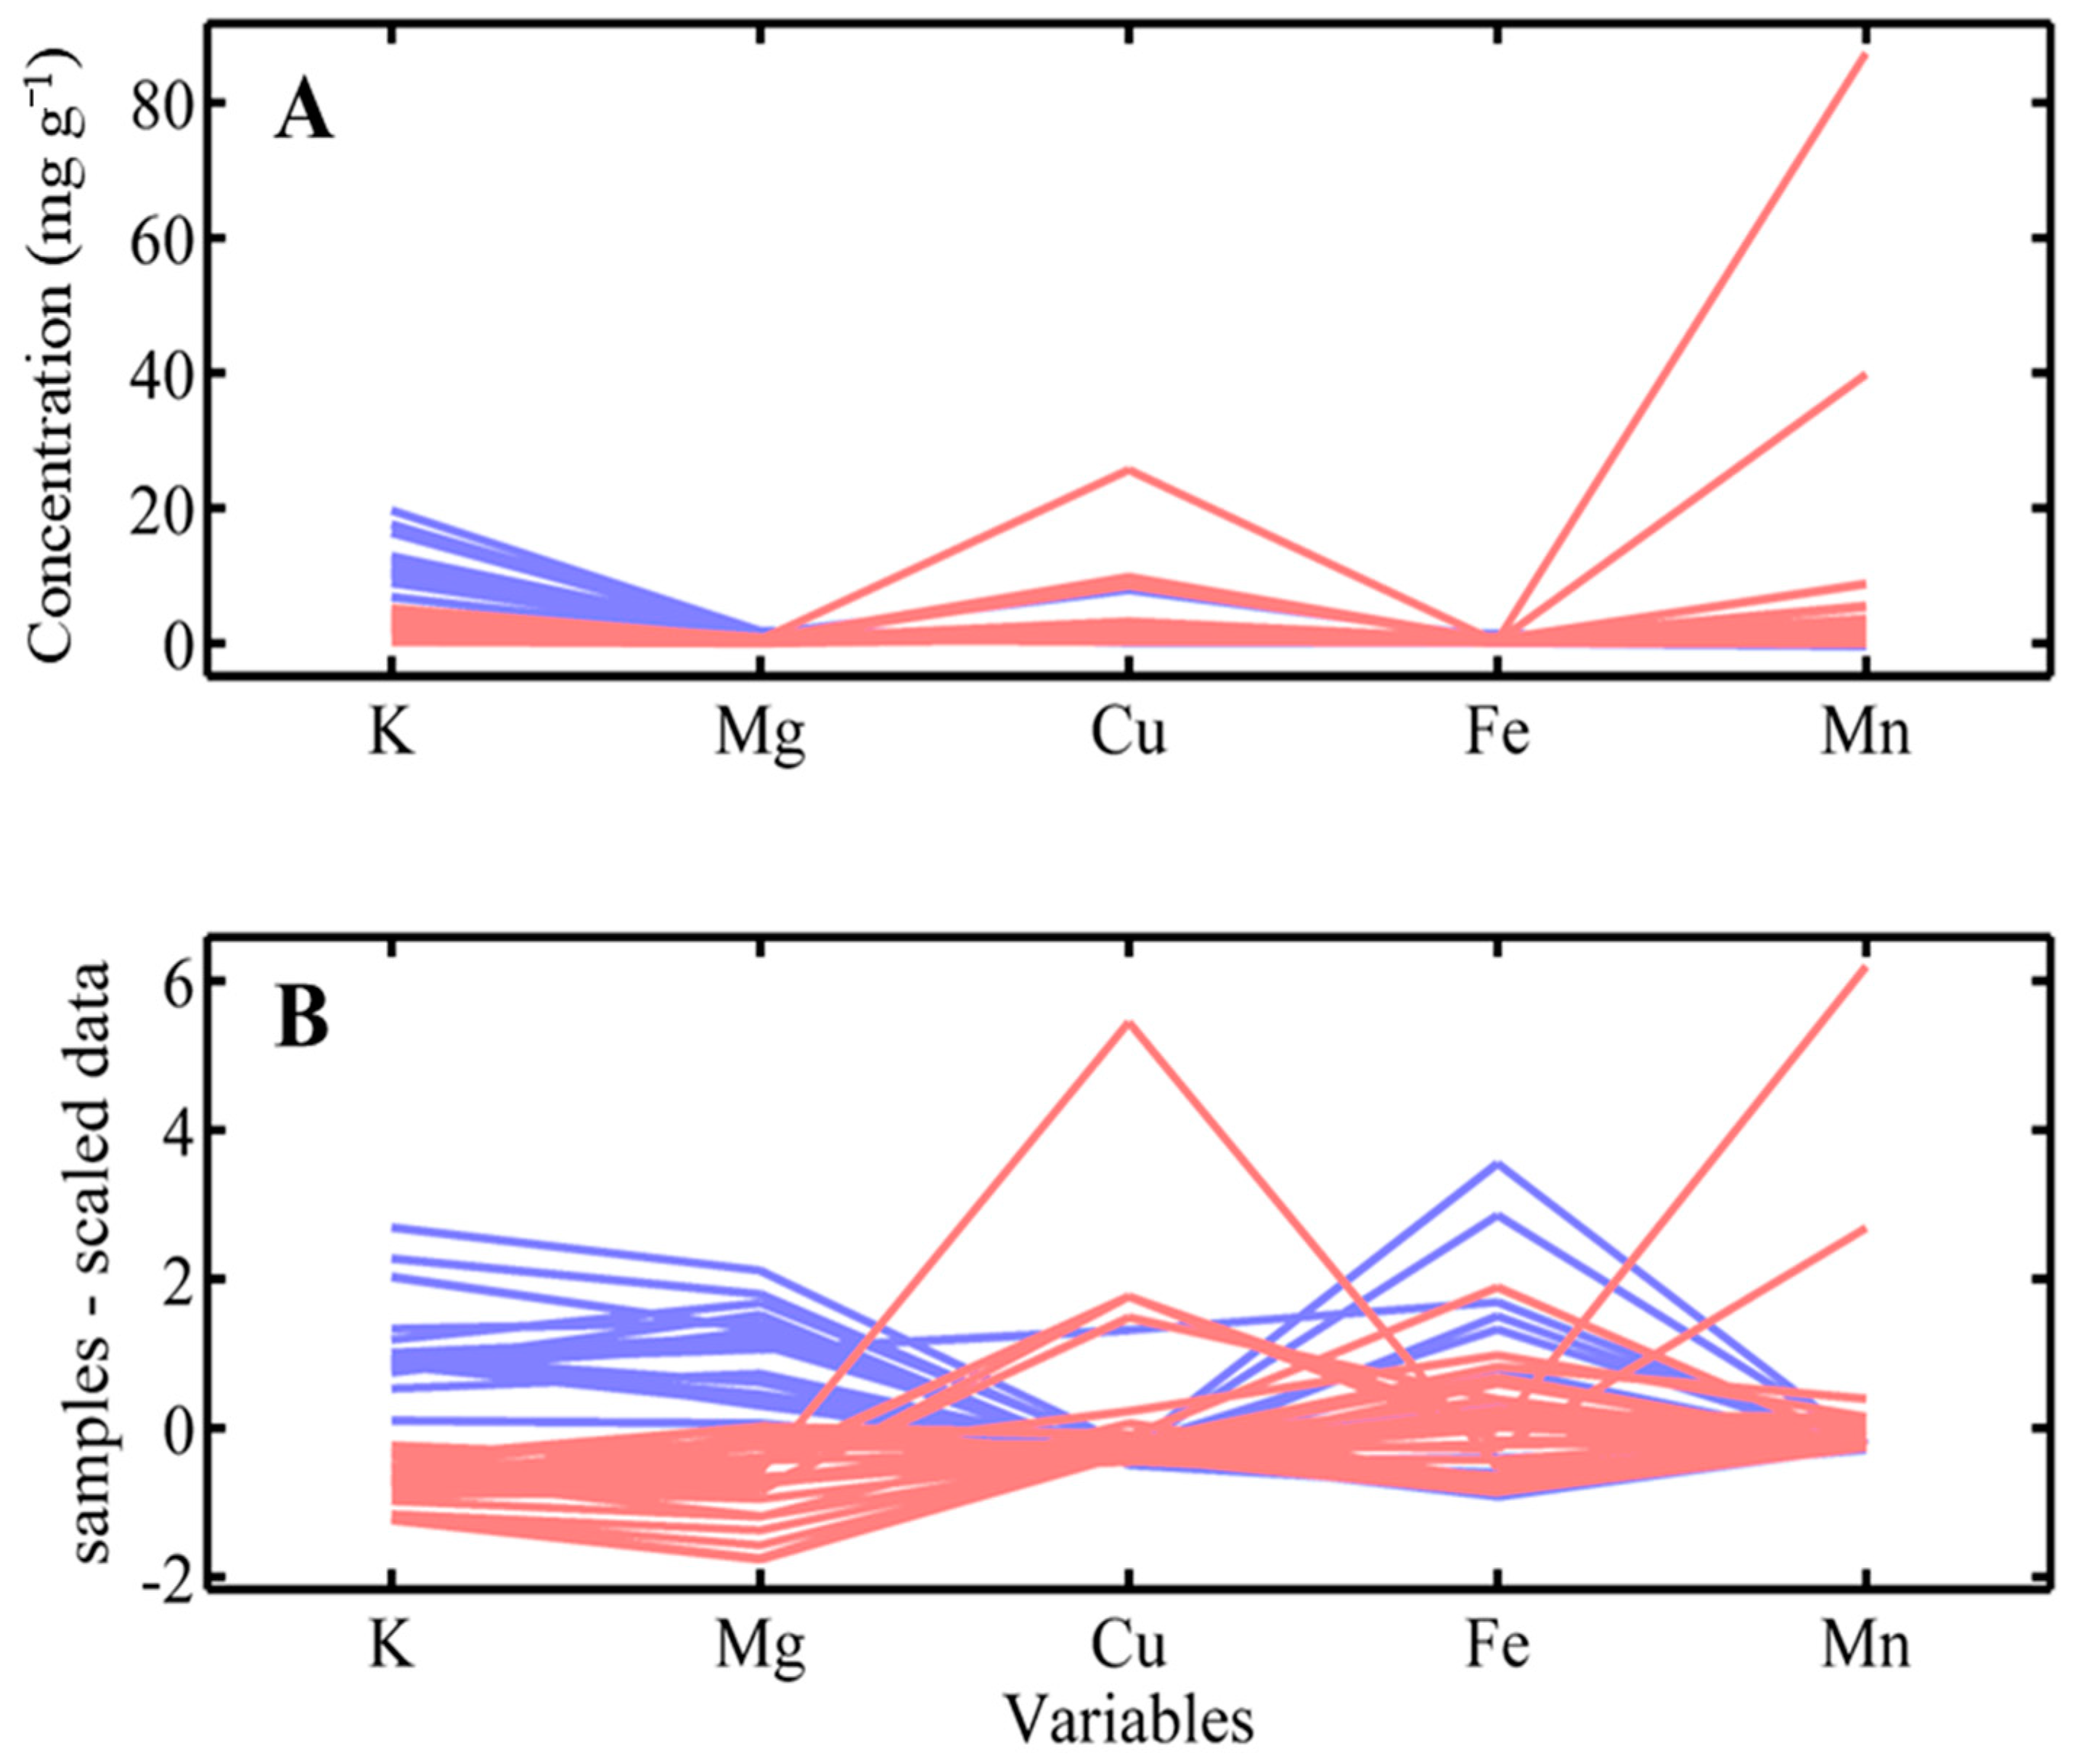
3.2. Data Preprocessing
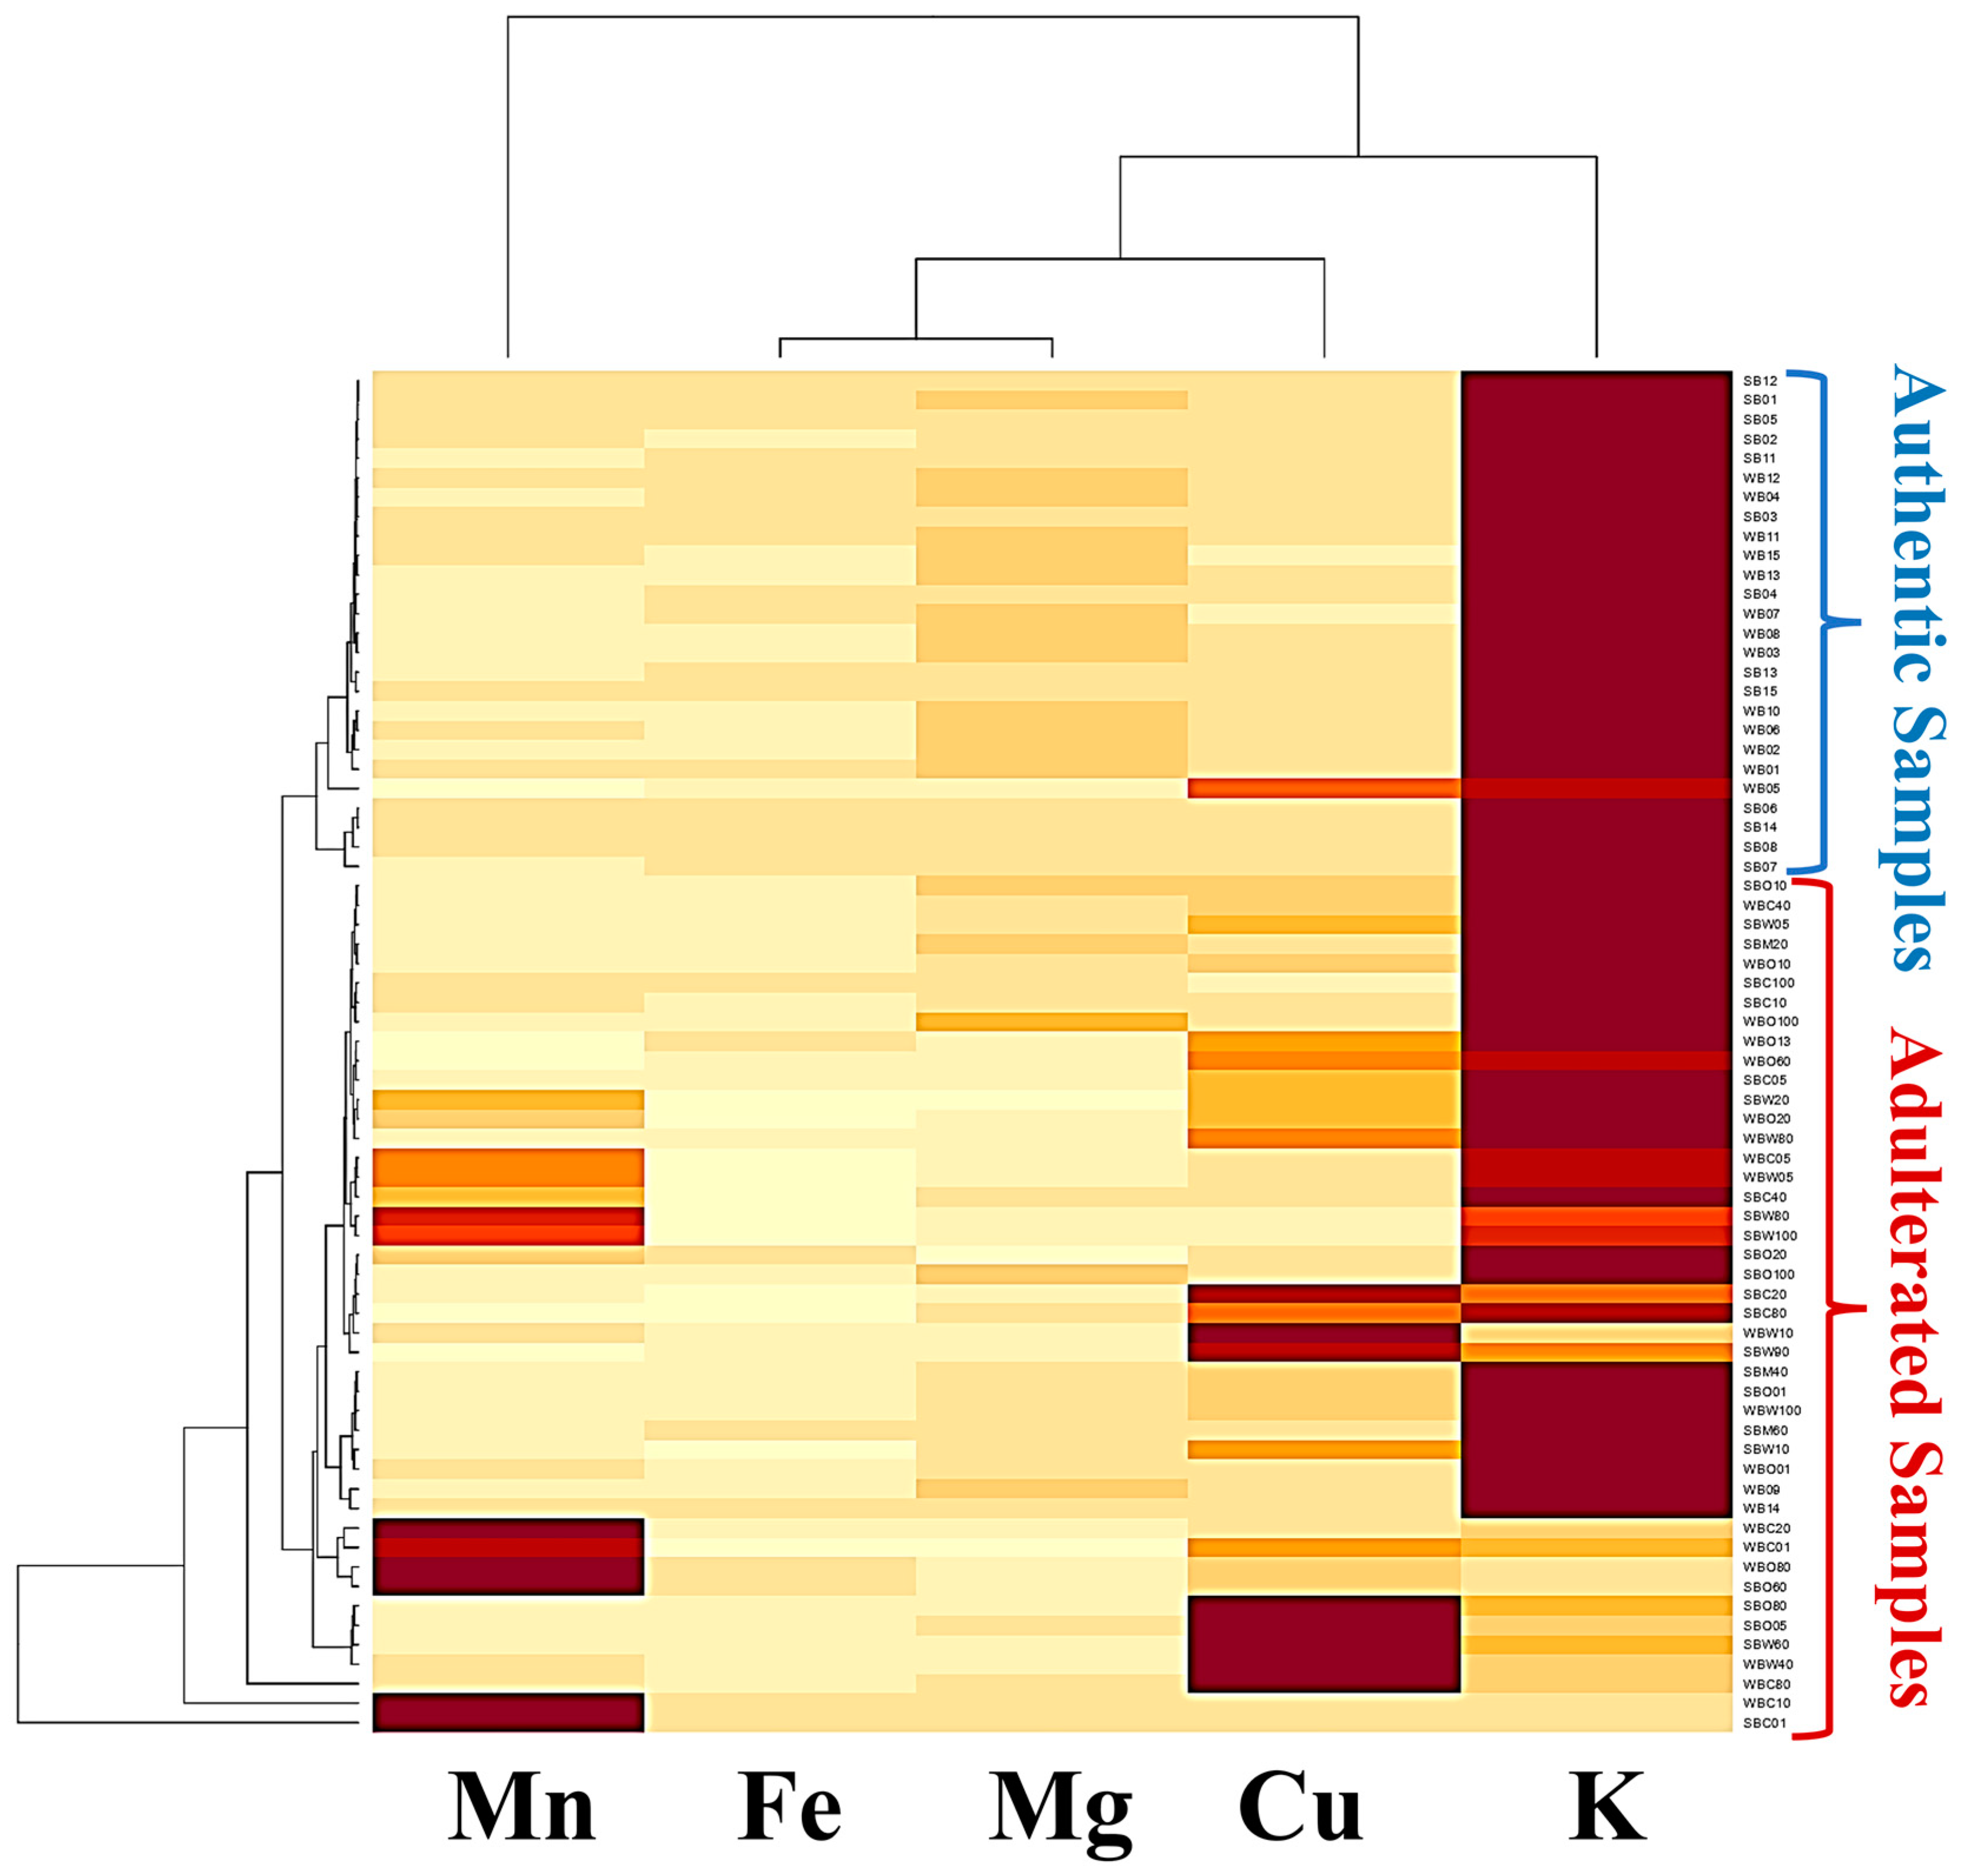
After the imputation of missing data, the need for data preprocessing was evaluated. The data are plotted and presented in Figure 2A,B for both datasets before and after scaling, respectively.
As observed in Figure 2A, the data exhibit distinct orders of magnitude. This characteristic can influence future models by favoring variables with higher magnitudes while reducing the relevance of variables with lower variance, potentially compromising the analysis. To mitigate this bias, appropriate preprocessing is essential. Since the dataset consists of discrete variables with continuous values, autoscaling was considered the most suitable approach.
After applying autoscaling, as illustrated in Figure 2B, the data were adjusted to the same order of magnitude, eliminating the tendency to overemphasize variables with higher variance when pattern recognition algorithms such as PCA are used. Therefore, all subsequent analyses will be conducted using the autoscaled data.

3.3. Heatmap

A heatmap was generated to highlight similarities and differences between the samples and the analyzed elements, facilitating the identification of potential adulterations. Lighter shades (light yellow) indicate low element concentrations, while darker shades (dark red) represent higher concentrations.
The analysis of Figure 3 reveals that the element K exhibits a darker shade in authentic samples and a lighter shade in adulterated samples. For the remaining elements, lighter tones predominantly appear in both groups.

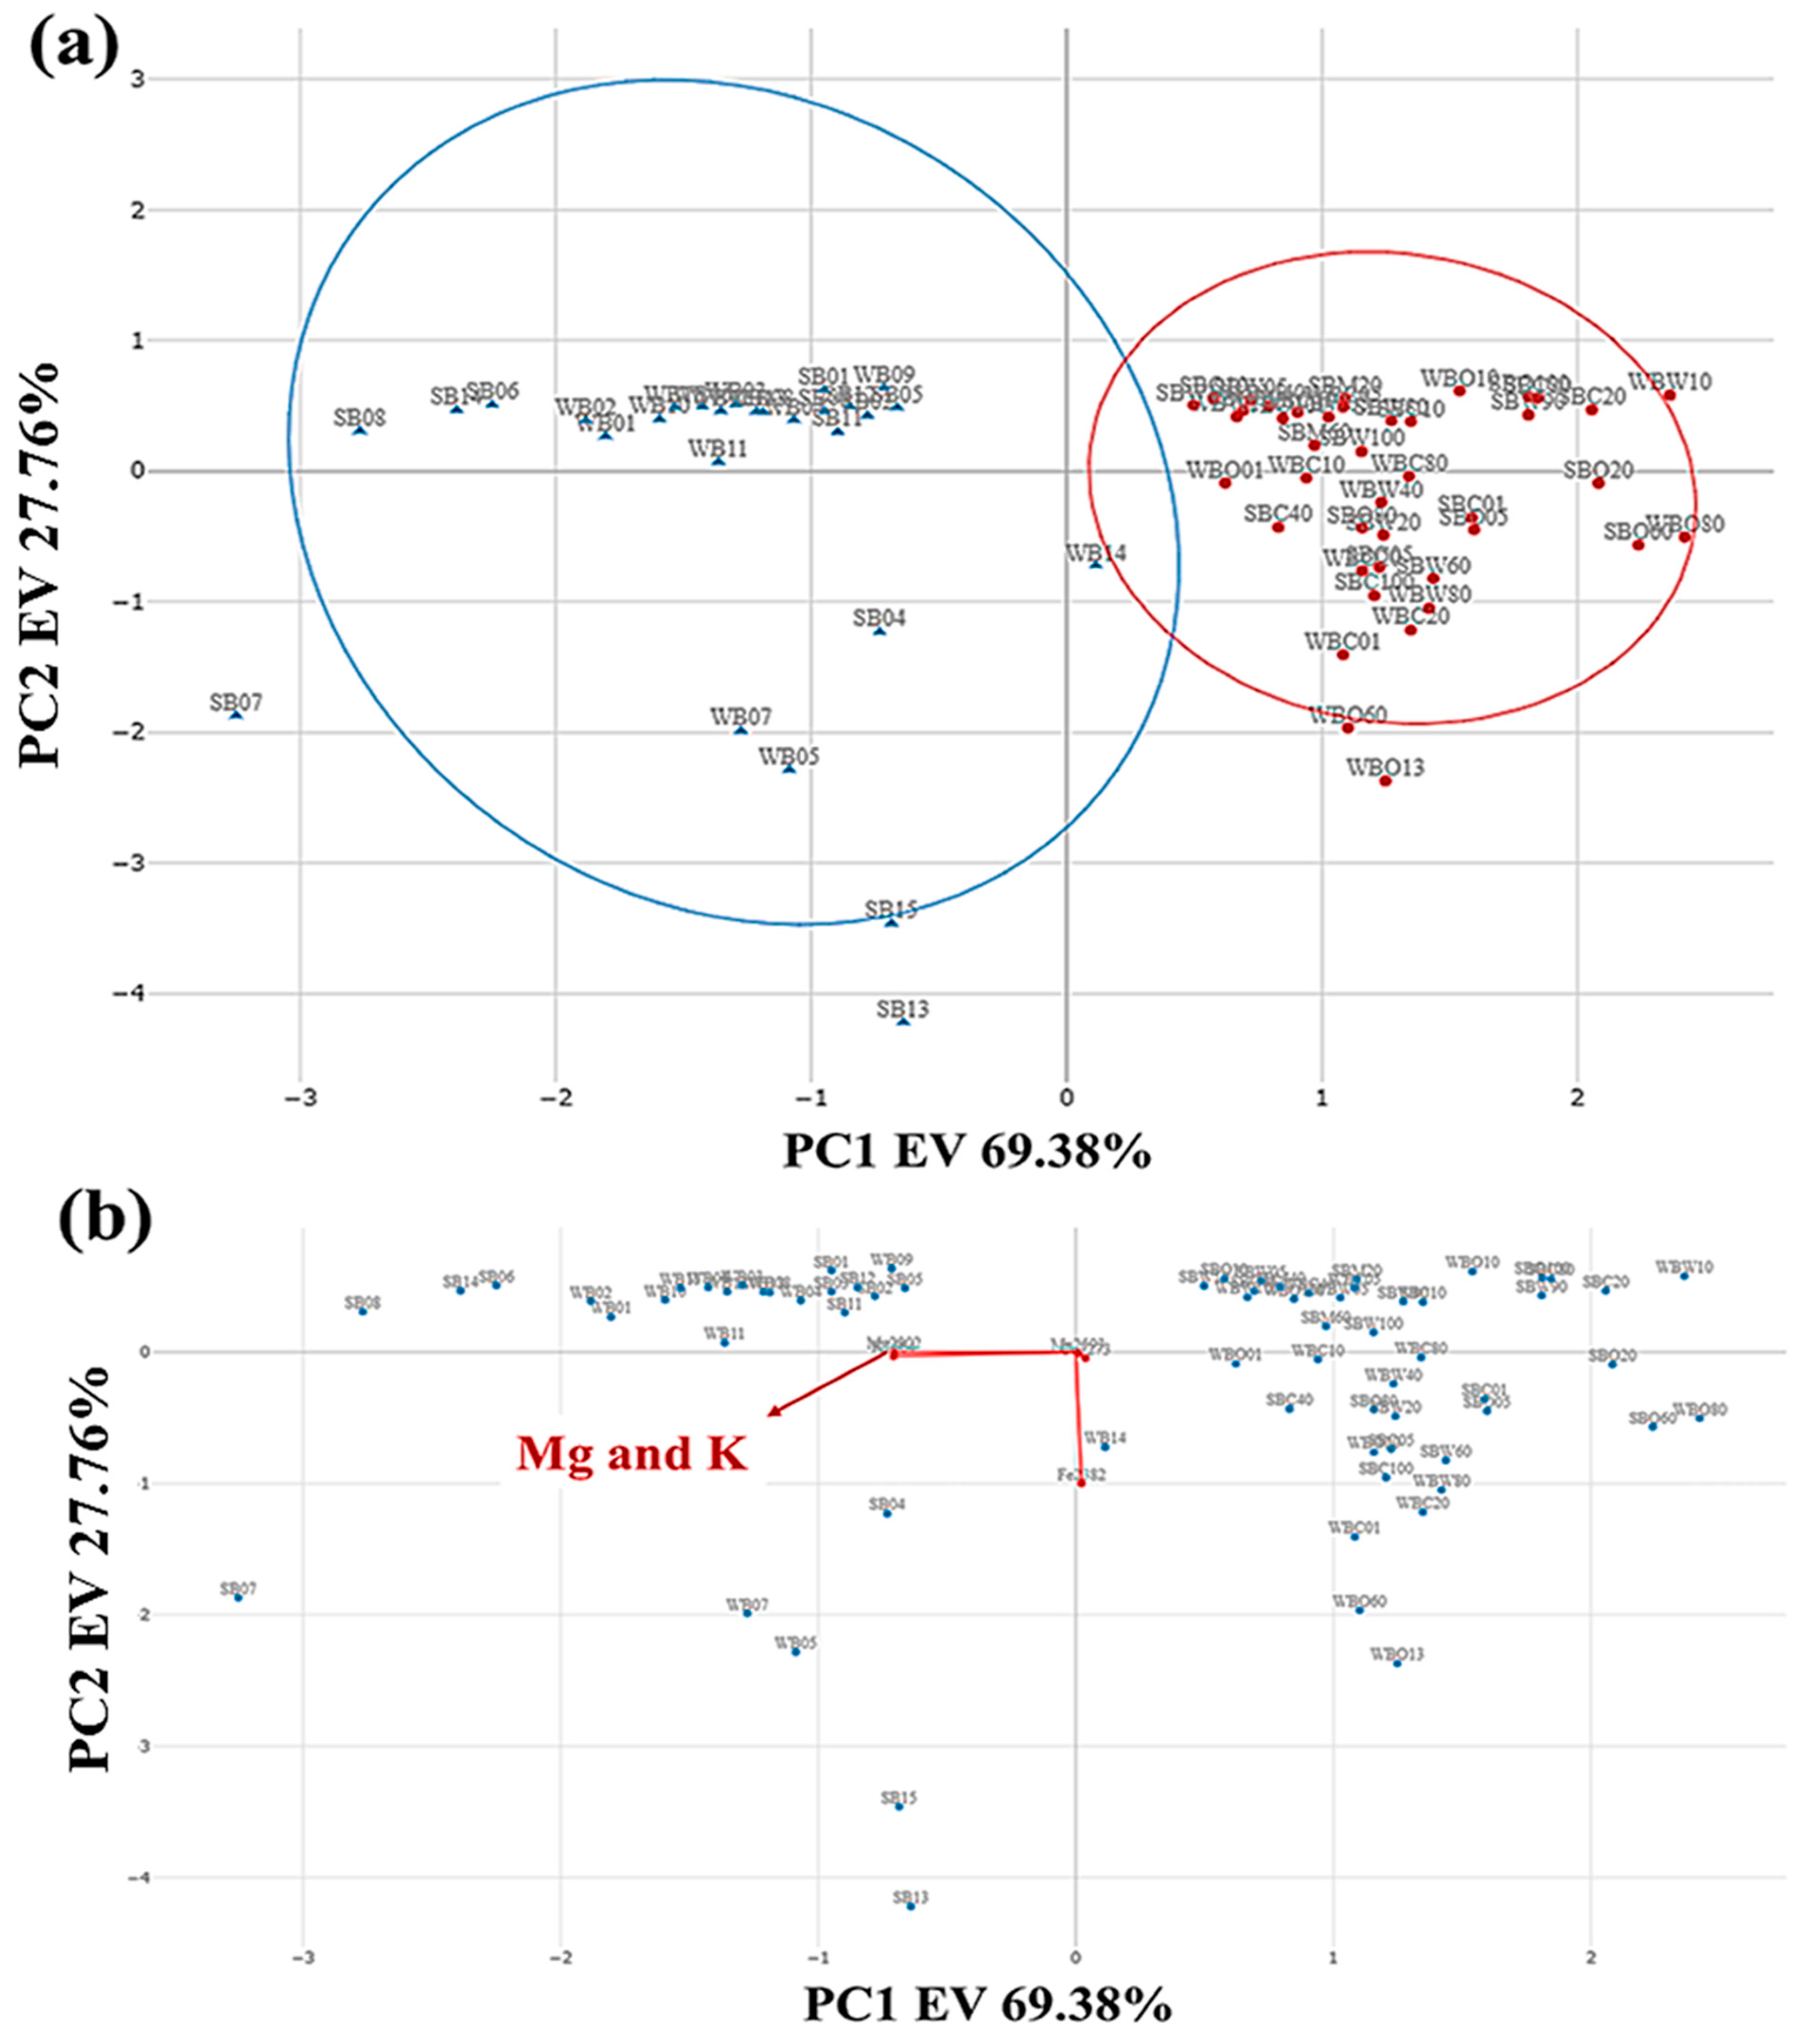
3.4. Detection of Anomalous Samples and Exploratory Analysis

The Classical PCA algorithm was used to identify anomalous samples. Figure 4 shows a plot showing the distribution of the samples based on the first two principal components (PC1 and PC2). The way the data are dispersed in the plot shows the orthogonal distance, i.e., the separation between different sample groups.
A clear separation between authentic samples (in blue) and adulterated samples (in red) can be observed. Classical PCA successfully identified a distinction between authentic and adulterated samples using only 2 PCs which present 97.14% of explained variance. The ellipses represent the confidence interval or variability of the groups based on a multivariate t-test with 95% confidence (Hotelling’s t-test). The blue and red ellipses do not significantly overlap, reinforcing the separation between the categories.
On the biplot (Figure 4b), the arrows for Mg and K are significantly long and aligned with the axes, indicating that these variables have a strong correlation with the principal components.
On the other hand, variables with shorter arrows or less alignment with the PC1 axes, such as Fe, contribute less to discrimination. Therefore, Mg and K, which are highlighted in Figure 4b, present a more significant impact on the principal components.

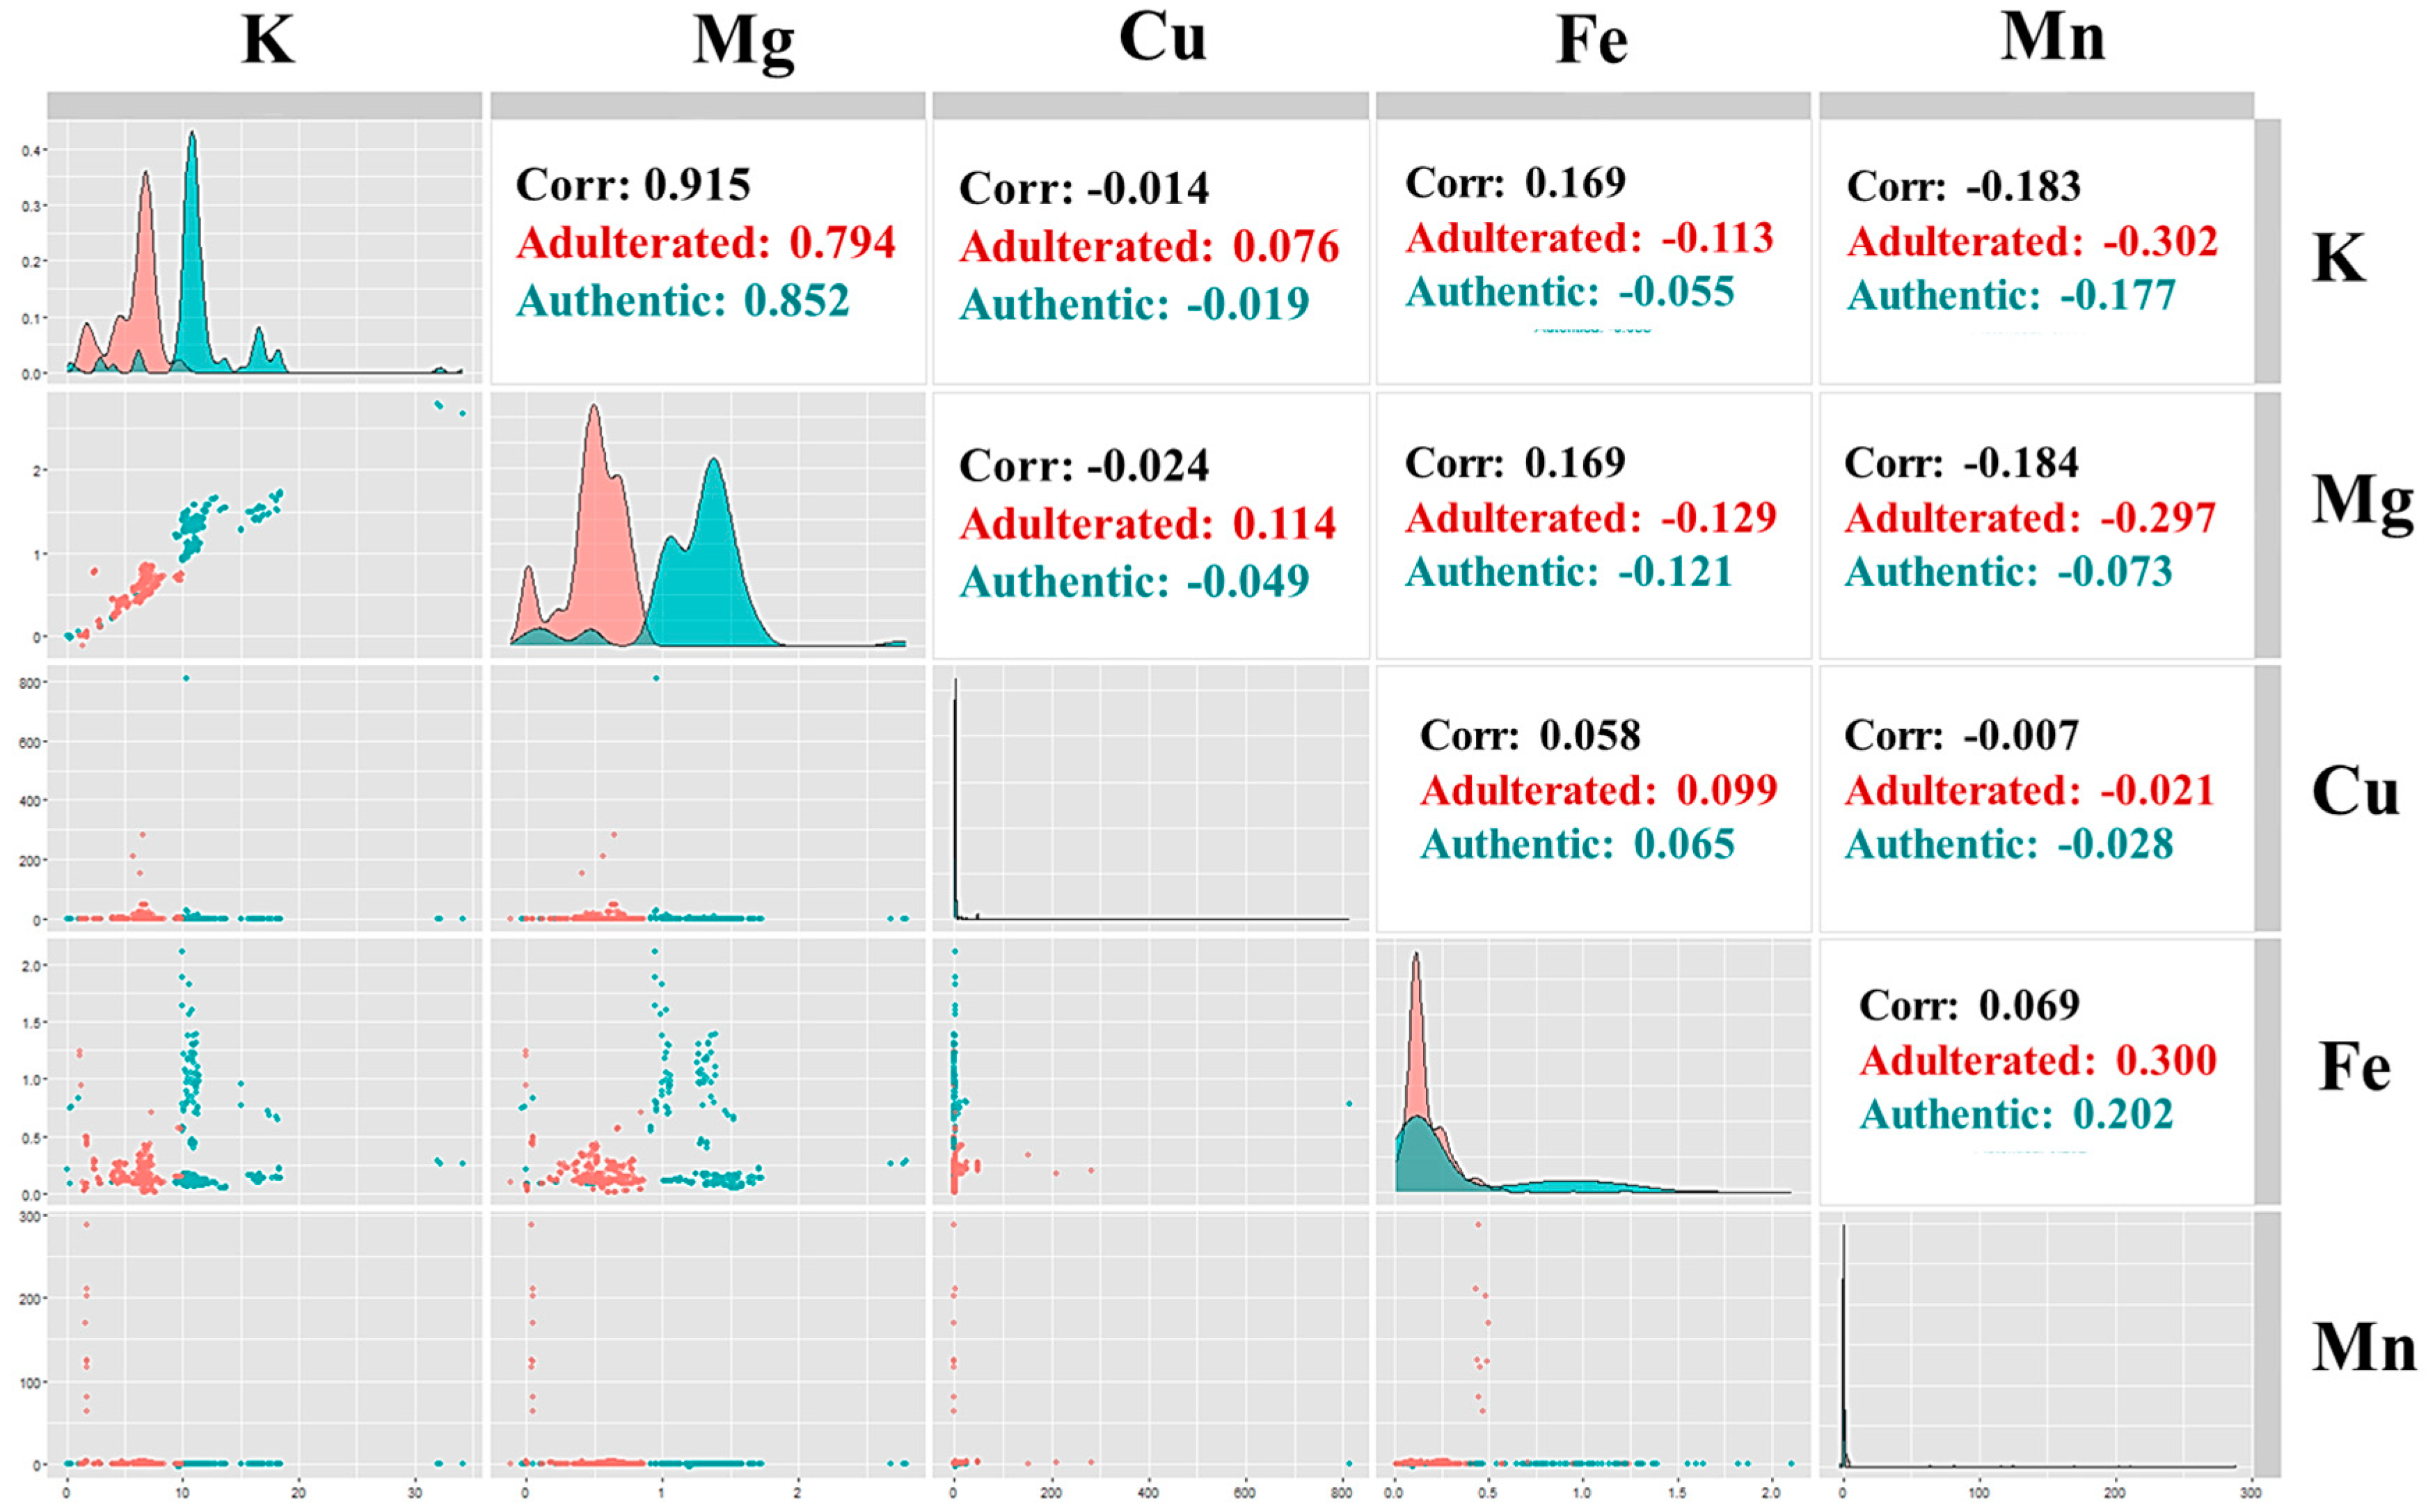
3.5. Correlation Map

Figure 5 presents the correlation map exploring the relationships between the elements K, Mg, Cu, Fe, and Mn. The numerical values represent Pearson’s correlation, indicating the strength and direction of the linear relationship between the elements. Values close to 1 or −1 indicate a strong positive or negative correlation, respectively, while values close to 0 suggest little or no correlation.
A very strong positive linear relationship was identified between K and Mg, with a correlation coefficient of 0.91 (Figure 5A). This result suggests that the concentrations of K and Mg are strongly associated in the samples, possibly due to factors related to banana cultivation, such as soil characteristics or natural processes leading to the co-occurrence of these minerals. Studies indicate that the interaction between K and Mg in the soil is crucial for banana plant growth, and excessive potassium applications may lead to nutritional imbalances, affecting magnesium absorption and impacting plant development [20,21]. It is not necessary to use both results on the modeling once they are correlated. The remaining element combinations showed low correlation coefficients, indicating weak or non-existent linear relationships. Therefore, it is possible to present relevant information for the model, which will be evaluated with the model loading values. Figure 5, called the pairs graphic, displays all the correlations between each combination of variables for all samples in black, for the adulterated samples in red, and for the authentic samples in cyan. Figure 5 also shows the normal distribution for each class, which is important to evaluate if the data present a normal distribution (here confirmed with a Shapiro–Wilks test with 5% of significance) and the difference between each class comparing the distribution for each class. In Figure 5, it is possible to identify that K and Mg present the best visual discrimination efficiency that will be confirmed with the supervised models.

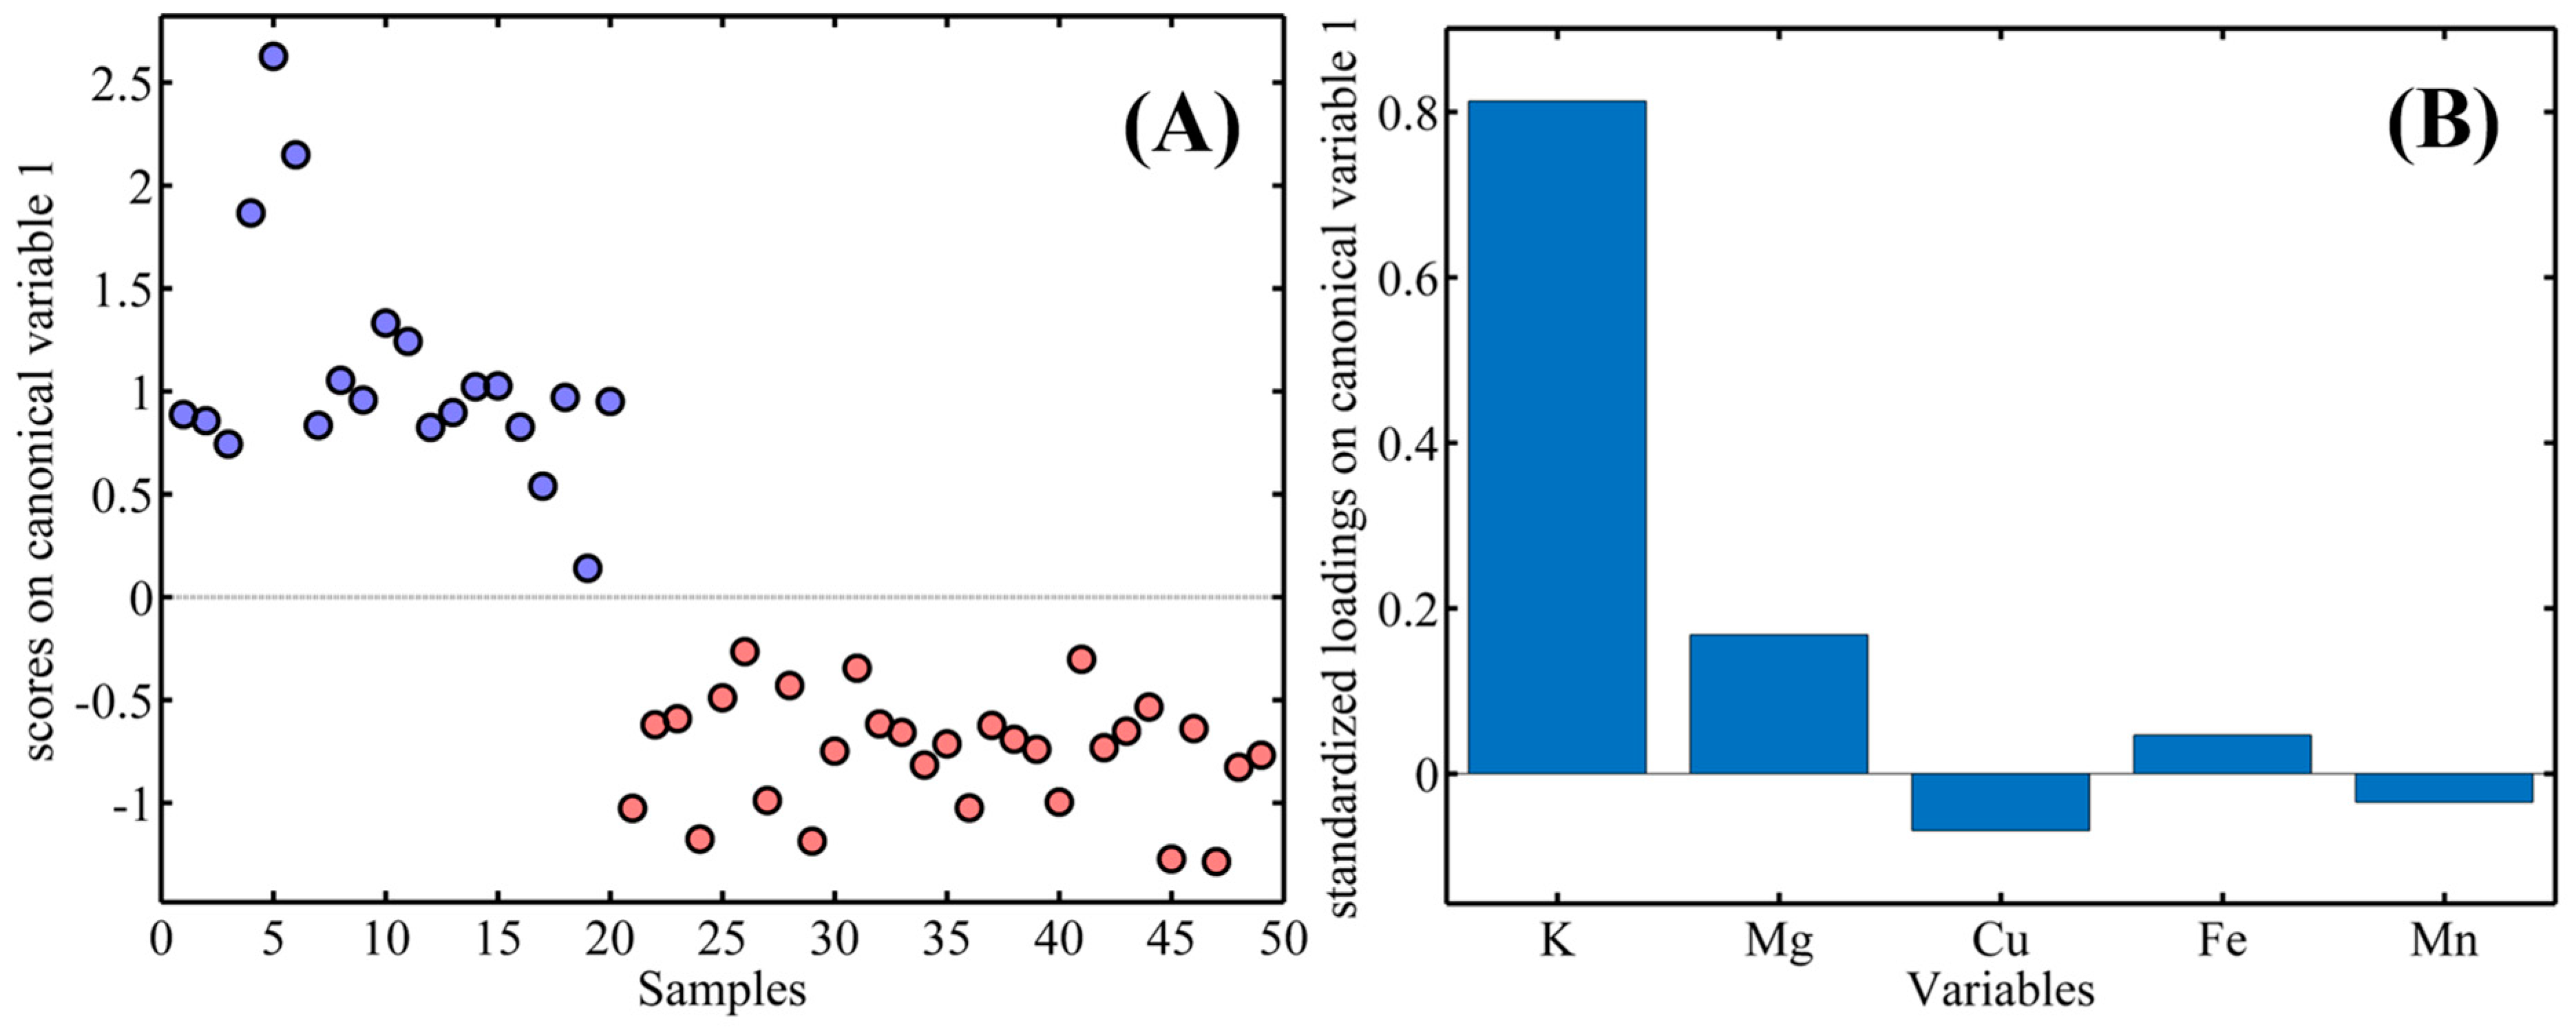
3.6. Data Analysis by LDA and PLS-DA

Two classification models were developed for the adulteration detection stage, where the results are displayed in Table 2 and Table 3. The first model uses LDA, which finds a linear projection capable of maximizing the separation between different classes, defining decision boundaries based on linear combinations of the analyzed variables [11]. The second model is the classical PLS-DA, which performs discriminant analysis considering all modeled adulterants on a transformed variables dimension, classifying the samples directly into one of the predefined classes [19].
The LDA model proved to be an effective tool for distinguishing between authentic and adulterated banana flours, with K as the main chemical marker for this separation. Figure 6A illustrates the clear segregation of the samples based on LDA canonical variable 1, which represents the primary discriminant calculated by the model. It is noted that a simple model requiring only one canonical variable enables perfect discrimination between authentic and adulterated samples displayed in Figure 6A, respectively, in blue and red points. This distinction reinforces the efficiency of the LDA model in discriminating between the two groups.
Figure 6B highlights the relative contribution of each chemical variable (K, Mg, Cu, Fe, Mn) to the construction of canonical variable 1. K has the highest contribution to the model, followed by Mg, while Cu, Fe, and Mn practically do not contribute to the discrimination. These results indicate that K is the most relevant chemical element in differentiating authentic and adulterated flours, corroborating the results previously presented in the pairs graphic in Figure 5. In addition to the high correlation between K and Mg, it is possible that using only the K variable as a fraud marker could be possible to identify the adulteration.
The results obtained using PLS-DA indicate that the developed model has high accuracy and perfect performance in distinguishing between authentic and adulterated green banana flours similar to the LDA model as previously presented in Table 3. The most important variable indicated by the PLS-DA model were the K and Mg, similar to the LDA model. The findings indicate that K may enable a univariate quality control monitoring regarding green banana flour adulteration. A univariate chemometric model is proposed using the element K exclusively based on the results obtained. It was observed that when employing only the concentration of K predicted by ICP-OES analysis, the data exhibit a clearer separation between the samples, which indicates that K is a key marker to find this adulteration.
Figure 7 illustrates the model based only on K, highlighting a clear separation between authentic samples (in blue) and adulterated samples (in red). Here, the training sets used on both LDA and PLS-DA models are displayed as a circle and the test set as a cross. Additionally, the discrimination limit calculated for K consists of the mean distance of the mean concentration between the sample classes calculated only for the training set, which was calculated as approximately 6 mg g−1 and presented in Figure 7 as a red line.

4. Conclusions

The present study highlights the efficacy of combining ICP-OES with chemometric tools as a robust approach for detecting adulteration in green banana flour. By analyzing the mineral composition (B, Ca, Cu, Fe, Mn, P, K, Mg, and Na) of 73 samples, including both authentic and adulterated flours, the study successfully identified potassium (K) as a key marker for distinguishing between authentic and adulterated products. The application of chemometric techniques, such as PCA, LDA, and PLS-DA, demonstrated exceptional accuracy, sensitivity, and specificity in classifying samples, achieving 100% accuracy in distinguishing authentic from adulterated green banana flours. The chemometric analysis enables the use of a single key marker to identify adulteration on green banana flours, reducing the number of elements monitored and reaching simpler protocols. The findings underscore the importance of monitoring food authenticity, particularly as the green banana flour market continues to expand globally. Ensuring the integrity of this high-value product is critical not only for consumer safety but also for maintaining trust in the industry. The proposed method, which combines advanced analytical techniques with chemometric analysis, offers a practical and efficient solution for detecting adulteration, thereby contributing to the enforcement of food safety standards and the protection of public health.

Author Contributions

Conceptualization, J.S.d.G. and L.P.; methodology, J.S.d.G., L.P. and S.L.F.J.; validation, J.S.d.G., L.P. and S.L.F.J.; formal analysis, L.P. and S.L.F.J.; investigation, J.S.d.G., L.P. and S.L.F.J.; resources, J.S.d.G. and L.P; data curation, J.S.d.G., L.P., A.S.L. and S.L.F.J.; writing—original draft preparation, J.S.d.G., L.P. and S.L.F.J.; writing—review and editing, J.S.d.G., L.P. and S.L.F.J.; visualization, J.S.d.G., A.S.L. and L.P.; supervision, J.S.d.G.; project administration, J.S.d.G.; Sample analysis: P.M.G., D.B.B. and F.N.F. All authors have read and agreed to the published version of the manuscript.

Funding

This research was funded by Conselho Nacional de Desenvolvimento Científico e Tecnológico (CNPq, for the research fellowship 404077/2023-4, 304581/2022-4 and 306787/2022-9), Coordenação de Aperfeiçoamento de Pessoal de Nível Superior—Brasil (CAPES)—Finance Code 001. Fundação Carlos Chagas de Amparo à Pesquisa do Estado do Rio de Janeiro—FAPERJ [E-26/202.755/2019; E-26/200.201/2023; E-26/010.002212/2019; SEI-260003/001750/2023; E-26/200.204/2023, E-26/204.174/2024], and Universidade do Estado do Rio de Janeiro (Programa Pró-Ciencia and InovUERJ) for their financial support. JSG and ASL have a research grant from CNPq and UERJ (Pro-grama Pró-Ciência). JSG, ASL and LP have a research grant from UERJ (Pro-grama Pró-Ciência).

Institutional Review Board Statement

Not applicable.

Informed Consent Statement

Not applicable.

Data Availability Statement

Dataset available on request from the authors.

Conflicts of Interest

The authors declare no conflict of interest.

References

  1. Ndlovu, P.F.; Magwaza, L.S.; Tesfay, S.Z.; Mphahlele, R.R. Vis-NIR Spectroscopic and Chemometric Models for Detecting Contamination of Premium Green Banana Flour with Wheat by Quantifying Resistant Starch Content. J. Food Compos. Anal. 2021, 102, 104035. [Google Scholar] [CrossRef]
  2. Arendse, E.; Nieuwoudt, H.; Magwaza, L.S.; Nturambirwe, J.F.I.; Fawole, O.A.; Opara, U.L. Recent Advancements on Vibrational Spectroscopic Techniques for the Detection of Authenticity and Adulteration in Horticultural Products with a Specific Focus on Oils, Juices and Powders. Food Bioprocess Technol. 2021, 14, 1–22. [Google Scholar] [CrossRef]
  3. Gebremariam, T.; Brhane, G. Determination Of Quality And Adulteration Effects Of Honey From Adigrat And Its Surrounding Areas. Int. J. Technol. Enhanc. Emerg. Eng. Res. 2014, 2, 71. [Google Scholar]
  4. Başlar, M.; Ertugay, M.F. Determination of Protein and Gluten Quality-Related Parameters of Wheat Flour Using near-Infrared Reflectance Spectroscopy (NIRS). Turk. J. Agric. For. 2011, 35, 139–144. [Google Scholar] [CrossRef]
  5. Steidle Neto, A.J.; Lopes, D.d.C. Chemometrics Coupled with near Infrared Spectroscopy for Detecting Adulteration Levels in Herbal Teas. J. Food Compos. Anal. 2024, 135, 106637. [Google Scholar] [CrossRef]
  6. Bannor, R.K.; Arthur, K.K.; Oppong, D.; Oppong-Kyeremeh, H.A. Comprehensive systematic review and bibliometric analysis of food fraud from a global perspective. J. Agr. Food Res. 2023, 14, 100686. [Google Scholar]
  7. Schmitt, S.; Garrigues, S.; de la Guardia, M. Determination of the Mineral Composition of Foods by Infrared Spectroscopy: A Review of a Green Alternative. Crit. Rev. Anal. Chem. 2014, 44, 186–197. [Google Scholar] [CrossRef] [PubMed]
  8. Lo Turco, V.; Nava, V.; Potortì, A.G.; Sgrò, B.; Arrigo, M.A.; Di Bella, G. Total Polyphenol Contents and Mineral Profiles in Commercial Wellness Herbal Infusions: Evaluation of the Differences between Two Preparation Methods. Foods 2024, 13, 2145. [Google Scholar] [CrossRef] [PubMed]
  9. Panebianco, F.; Nava, V.; Giarratana, F.; Gervasi, T.; Cicero, N. Assessment of Heavy- and Semi-Metals Contamination in Edible Seaweed and Dried Fish Sold in Ethnic Food Stores on the Italian Market. J. Food Compos. Anal. 2021, 104, 104150. [Google Scholar] [CrossRef]
  10. Baek, G.H.; Kim, Y.-J.; Lee, Y.; Jung, S.-C.; Seo, H.W.; Kim, J.-S. Prebiotic Potential of Green Banana Flour: Impact on Gut Microbiota Modulation and Microbial Metabolic Activity in a Murine Model. Front. Nutr. 2023, 10, 1249358. [Google Scholar] [CrossRef] [PubMed]
  11. Patel, A.M.; Author, C.; Bhatt, H.G. Application of Mass Spectrometry in Detection of Food Adulteration: A Review. Pharma Innov. J. 2021, SP-10, 1188–1194. [Google Scholar]
  12. Azcarate, S.M.; Martinez, L.D.; Savio, M.; Camiña, J.M.; Gil, R.A. Classification of Monovarietal Argentinean White Wines by Their Elemental Profile. Food Control 2015, 57, 268–274. [Google Scholar] [CrossRef]
  13. Cocchi, M.; Biancolillo, A.; Marini, F. Chemometric Methods for Classification and Feature Selection. Compr. Anal. Chem. 2018, 82, 265–299. [Google Scholar]
  14. Zaldarriaga Heredia, J.; Wagner, M.; Jofré, F.C.; Savio, M.; Azcarate, S.M.; Camiña, J.M. An Overview on Multi-Elemental Profile Integrated with Chemometrics for Food Quality Assessment: Toward New Challenges. Crit. Rev. Food Sci. Nutr. 2023, 63, 8173–8193. [Google Scholar] [CrossRef] [PubMed]
  15. Darzé, B.C.; Lima, I.C.A.; Pinto, L.; Luna, A.S. Chemometrics Web App Part 1: Data Handling. Chemom. Intell. Lab. Syst. 2022, 231, 104696. [Google Scholar] [CrossRef]
  16. Darzé, B.C.; Lima, I.C.A.; Luna, A.S.; Pinto, L. Chemometrics Web App’s Part 2: Dimensionality Reduction and Exploratory Analysis. Chemom. Intell. Lab. Syst. 2023, 237, 104810. [Google Scholar] [CrossRef]
  17. Kennard, R.W.; Stone, L.A. Computer Aided Design of Experiments. Technometrics 1969, 11, 137–148. [Google Scholar] [CrossRef]
  18. Galvao, R.; Araujo, M.; Jose, G.; Pontes, M.; Silva, E.; Saldanha, T. A Method for Calibration and Validation Subset Partitioning. Talanta 2005, 67, 736–740. [Google Scholar] [CrossRef] [PubMed]
  19. Ballabio, D.; Consonni, V. Classification Tools in Chemistry. Part 1: Linear Models. PLS-DA. Anal. Methods 2013, 5, 3790. [Google Scholar] [CrossRef]
  20. Guimarães, G.G.F.; de Deus, J.A.L. Diagnosis of Soil Fertility and Banana Crop Nutrition in the State of Santa Catarina. Rev. Bras. Frutic. 2021, 43, e124. [Google Scholar] [CrossRef]
  21. Olivares Campos, B.O. Evaluation of the Incidence of Banana Wilt and Its Relationship with Soil Properties. In Banana Production in Venezuela; Springer Nature: Cham, Switzerland, 2023; pp. 95–117. [Google Scholar] [CrossRef]
Figure 1. Data matrix representing the concentrations of chemical elements in green banana flour samples. (A) ICP-OES obtained concentration data for the elements Ca, K, Mg, Na, P, B, Cu, Fe, and Mn. Missing data are highlighted in red. (B) Data matrix after KNN (K = 3) imputation, considering only elements whose concentrations exceeded the limit of detection (LOD) in more than 50% of the samples.
Chemosensors 13 00153 g001
Figure 2. Concentration data for the elements K, Mg, Cu, Fe, and Mn in banana flowers. (A) Unscaled data and (B) data after autoscaling. Blue line represents authentic samples while red lines represent adulterated samples.
Chemosensors 13 00153 g002
Figure 3. Heatmap displaying the results of a hierarchical cluster analysis (HCA) conducted independently on both samples and variables for the banana flour samples.
Chemosensors 13 00153 g003
Figure 4. Principal Component Analysis (a) and the biplot (b) of the green banana flour samples.
Chemosensors 13 00153 g004
Figure 5. Pairs graphic between inorganic elements of the banana flour samples.
Chemosensors 13 00153 g005
Figure 6. Linear Discriminant Analysis (LDA) of green banana flour samples based on chemical elements. (A) Sample scores on the first canonical variable highlight the separation between the two analyzed groups. (B) The first canonical variable emphasizes that K influences group discrimination the most.
Chemosensors 13 00153 g006
Figure 7. Univariate chemometric model based on K for differentiating authentic (blue) and adulterated (red) green banana flour.
Chemosensors 13 00153 g007
Table 1. Limit of detection and limit of quantification for the determination of Na, P, K, Mg, Ca, B, Cu, Fe, and Mn in banana flowers by inductively coupled plasma optical emission spectrometry after microwave-assisted digestion.
AnalyteR2LOD (µg g−1)LOQ (µg g−1)
Ca0.99650.0050.015
K0.98990.0070.021
Mg0.99140.020.06
Na0.99640.040.12
P0.99610.0010.003
B0.999939
Cu0.99991.44.2
Fe0.99990.41.2
Mn0.999939
Table 2. LDA performance in the classification of green banana flour.
Training—LDA
Real/Predicted ClassClass 1Class 2Not Assigned
Class 11900
Class 20290
ClassSensitivitySpecificityPrecision
Class 11.001.001.00
Class 21.001.001.00
LDA Test Result
Real/Predicted ClassClass 1Class 2Not Assigned
Class 1800
Class 20130
ClassSensitivitySpecificityPrecision
Class 11.001.001.00
Class 21.001.001.00
Table 3. PLS-DA performance in the classification of green banana flour.
Training—PLS-DA
Real/Predicted ClassClass 1Class 2Not Assigned
Class 12000
Class 20290
ClassSensitivitySpecificityPrecision
Class 11.001.001.00
Class 21.001.001.00
Resultado Teste PLS-DA
Real/Predicted ClassClass 1Class 2Not Assigned
Class 1800
Class 20130
ClassSensitivitySpecificityPrecision
Class 11.001.001.00
Class 21.001.001.00
Disclaimer/Publisher’s Note: The statements, opinions and data contained in all publications are solely those of the individual author(s) and contributor(s) and not of MDPI and/or the editor(s). MDPI and/or the editor(s) disclaim responsibility for any injury to people or property resulting from any ideas, methods, instructions or products referred to in the content.

