Article

In Silico Identification of Genes Associated with Breast Cancer Progression and Prognosis and Novel Therapeutic Targets

1
Division of Diagnostic Pathology, Kikuna Memorial Hospital, Yokohama 222-0011, Japan
2
Pathology Division, Shizuoka Cancer Center, Shizuok 411-8777, Japan
3
Department of Human Pathology, Juntendo University School of Medicine, Tokyo 113-8421, Japan
*
Author to whom correspondence should be addressed.
Biomedicines 2022, 10(11), 2995; https://doi.org/10.3390/biomedicines10112995
Submission received: 8 October 2022 / Revised: 16 November 2022 / Accepted: 18 November 2022 / Published: 21 November 2022

Abstract

:
Molecular mechanisms underlying breast cancer (BC) progression are complex and remain unclear. In this study, we used bioinformatic tools to identify genes associated with tumor progression mechanisms and novel therapeutic targets in BC. We identified genes with stepwise upregulated expression overlapping between the T and N stages during BC progression using LinkedOmics. We compared the expression level of each gene in BC tissues with that in normal breast tissues and evaluated differences in expression in their intrinsic subtypes and their prognostic value using UALCAN and GEPIA2. We also investigated the dependency of BC cell lines on these genes and whether they are potential therapeutic targets using DepMap. SPDEF, TRIM3, ABCB9, HSPB1, RHBG, SPINT1, EPN3, LRFN2, and PRPH were found to be involved in BC progression. High expression of ABCB9 and SPINT1 was associated with a poor prognosis. SPDEF, TRIM3, ABCB9, RHBG, SPINT1, and PRPH were found to be essential for survival in some BC cell lines (gene effect score < −0.5). PRPH was newly discovered to be involved in the progression of BC and the growth and survival of BC cell lines. Hence, SPDEF, TRIM3, ABCB9, RHBG, SPINT1, and PRPH may serve as novel potential therapeutic targets in BC.

1. Introduction

Breast cancer (BC) is the most diagnosed cancer (accounting for 30.8% of all cancers) and a leading cause of cancer-related deaths (accounting for approximately 15% of all cancers) in women [1,2]. BC is now classified according to the expression of estrogen receptor (ER), progesterone receptor (PR), and human epidermal growth factor receptor 2 (HER2) proteins, and specialized treatments for each have been shown to be available and effective. These disease-subtyping-based treatment strategies have provided more effective treatment strategies than previously available [3]. However, complete remission remains a challenge because cancers are resistant to conventional targeted therapies. Therefore, molecular elucidation of BC is needed to further improve BC outcomes [4]. The complex molecular mechanisms underlying BC progression remain unclear. Therefore, it is important to identify more accurate tumor progression and establish novel and effective therapeutic methods.
The tumor–node–metastasis (TNM) system was contrived by Pierre Denoix in the 1940s; it has become the basic principle of tumor staging in the world. Generally, local (only in the affected organ), regional (spread to nearby lymph nodes), and metastatic (spread to distant organs) cancers are recognized to have worsening prognosis. BC can be traced to this stepwise progression [5]. The TNM staging system is useful for not only determining the stage but also assessing prognosis, treatment planning, and treatment efficacy. Determining the genes involved in the progression of BC could also lead to the discovery of new therapeutic approaches that target these genes. Recently, patient samples and in vitro and in vivo analyses have shown that several novel genes promote treatment resistance and progression of triple negative BC (TNBC); these include liver x receptor alpha (LXR alpha) [6], semaphorin 6D (SEMA6D) [7], and integrin subunit alpha 7 (ITGA7) [8]. In the past, simultaneous discovery of multiple genes would have required very large-scale studies; however, in recent years, public databases have made it possible to identify groups of genes associated with BC [9,10,11]. Therefore, we used bioinformatics to identify genes associated with BC progression that are involved with both the T and N stages.
As a background for the development of cancer therapeutic approaches, methods using new modalities such as nucleic acid drugs and genome editing using clustered regularly interspaced short palindromic repeats (CRISPR)-Cas9 have been devised and developed [12,13]. These act on mRNAs but not on conventional low-molecular-weight compounds or antibody drugs. In the future, nucleic acid drugs are expected to achieve high therapeutic efficacy as major anticancer agents. Moreover, recently, bioinformatic tools, such as the Cancer Dependency Map (DepMap) database (https://depmap.org/portal/, accessed on 25 April 2022) [14,15], have been developed to comprehensively screen dependency genes essential for the survival and proliferation of hundreds of cell lines with various tissue origins using RNA interference (RNAi) and CRISPR-Cas9 knockout/knockdown technologies [14,15]. These can be used to explore dependency on genes that are potential candidates for therapeutic targeting. We validated whether suppressing the expression of genes involved in breast cancer progression could be a potential therapeutic target for BC using DepMap. Indeed, successful identification of novel drug target factors using DepMap has been reported [16].
In this study, we used various bioinformatic tools to identify tumor-progression-associated genes and validate whether those genes could serve as prognostic factors or novel effective therapeutic targets in BC. We identified genes stepwise expressed in the T and N stages during BC progression, of which, we selected those with expression overlap between the T and N stages. These overlapping genes were implicated in BC progression and evaluated for their prognostic value. Because regulating these genes may halt the progression of BC, we used the DepMap database to verify whether these genes are essential for survival in BC cell lines and whether they are potential therapeutic targets.

2. Methods

2.1. LinkedOmics Analysis

LinkedOmics (http://www.linkedomics.org/login.php) (accessed on 17 November 2022), a public online analysis tool, contains cancer-associated multidimensional datasets derived from all of the 32 The Cancer Genome Atlas (TCGA) data types [17]. We used the LinkedOmics BRCA dataset to identify differentially expressed genes (DEGs) associated with the T and N stages. The Jonckheere trend test (JT test) was performed to identify DEGs among the T (T1, T2, T3, and T4) and N stages (N0, N1, N2, and N3), and p-values and false discovery rate (FDR) were calculated on the web page. We then screened for DEGs that correlated with pathology_T_stage and pathology_N_stage. We adopted a statistical threshold of FDR < 0.05 and extracted genes found to be differentially expressed in the JT test and genes overlapping between the T and N stages. In both stages, 20,155 DEGs were identified, and 551 and 1209 genes were positively and negatively correlated, respectively, in the T stage, whereas 354 and 128 genes were positively and negatively correlated, respectively, in the N stage. We identified 9 genes with overlapping positive correlations in both stages. The detailed study flowchart is demonstrated in Figure 1.

2.2. UALCAN Analysis

UALCAN (http://ualcan.path.uab.edu/analysis.html) (accessed on 17 November 2022), a comprehensive web resource, allows analyses based on TCGA and MET500 cohort data [18]. In our study, the expression data for the nine genes were obtained using the “Expression Analysis” module of UALCAN and the “BRCA” dataset. Student’s t test was used to generate p-values. p-Values were calculated and displayed on the web page.

2.3. Gene Expression Profiling Interactive Analysis 2 (GEPIA2)

GEPIA2 (http://gepia2.cancer-pku.cn/) (accessed on 17 November 2022) is a web server for expression profiling and user-friendly interactive analysis based on the GTEx and TCGA databases [19]. In this study, we evaluated the prognostic value of each of the nine candidate genes. The overall survival (OS) of the patients was evaluated using the Kaplan–Meier method with a 50% (median) cut-off for both low- and high-expression groups. The log-rank test (the Mantel–Cox test) was used for hypothesis testing, and the results were displayed on the web page.

2.4. DepMap Analysis

DepMap (https://depmap.org/portal/) (accessed on 17 November 2022) is an accessible website [14] based on large-scale multiomics screening projects based on CRISPR-Cas9 and RNAi. Gene effect scores evaluated the effect size of either knocking out or knocking down a gene while normalizing the expression against the distribution of pan-essential and nonessential genes [14,15]. Negative scores indicated that the cell line would grow slower, whereas positive scores indicated that the cell line would grow faster after experimental manipulation. For gene effect, a score < −0.5 represents depletion in most cell lines, whereas a score < −1 represents strong killing. Therefore, we set the cut-off value at −0.5 according to the DepMap website (https://forum.depmap.org/t/depmap-genetic-dependencies-faq/131) (accessed on 17 November 2022) and a previous study [20]. We investigated the dependency on the nine genes in BC cell lines. The datasets were CRISP (DepMap 22Q1 public + score, Chronos) and RNAi (Achilles + DRIVE + Marcotte, DEMETER2), with BC subtypes including carcinoma, breast ductal carcinoma, and adenocarcinoma, with no data on cell lines. CRISP (DepMap 22Q1 public + score, Chronos) datasets were not available for Rh family B glycoprotein (RHBG). For EPN3, we did not obtain RNAi data.

2.5. Statistical Analysis

The JT test was performed to detect DEGs among the T and N stages using LinkedOmics. Expression analyses between normal and tumor tissues for each gene and among intrinsic subtypes for each gene using UALCAN analysis results were performed within each web page. Statistical significance was set at p < 0.05.

3. Results

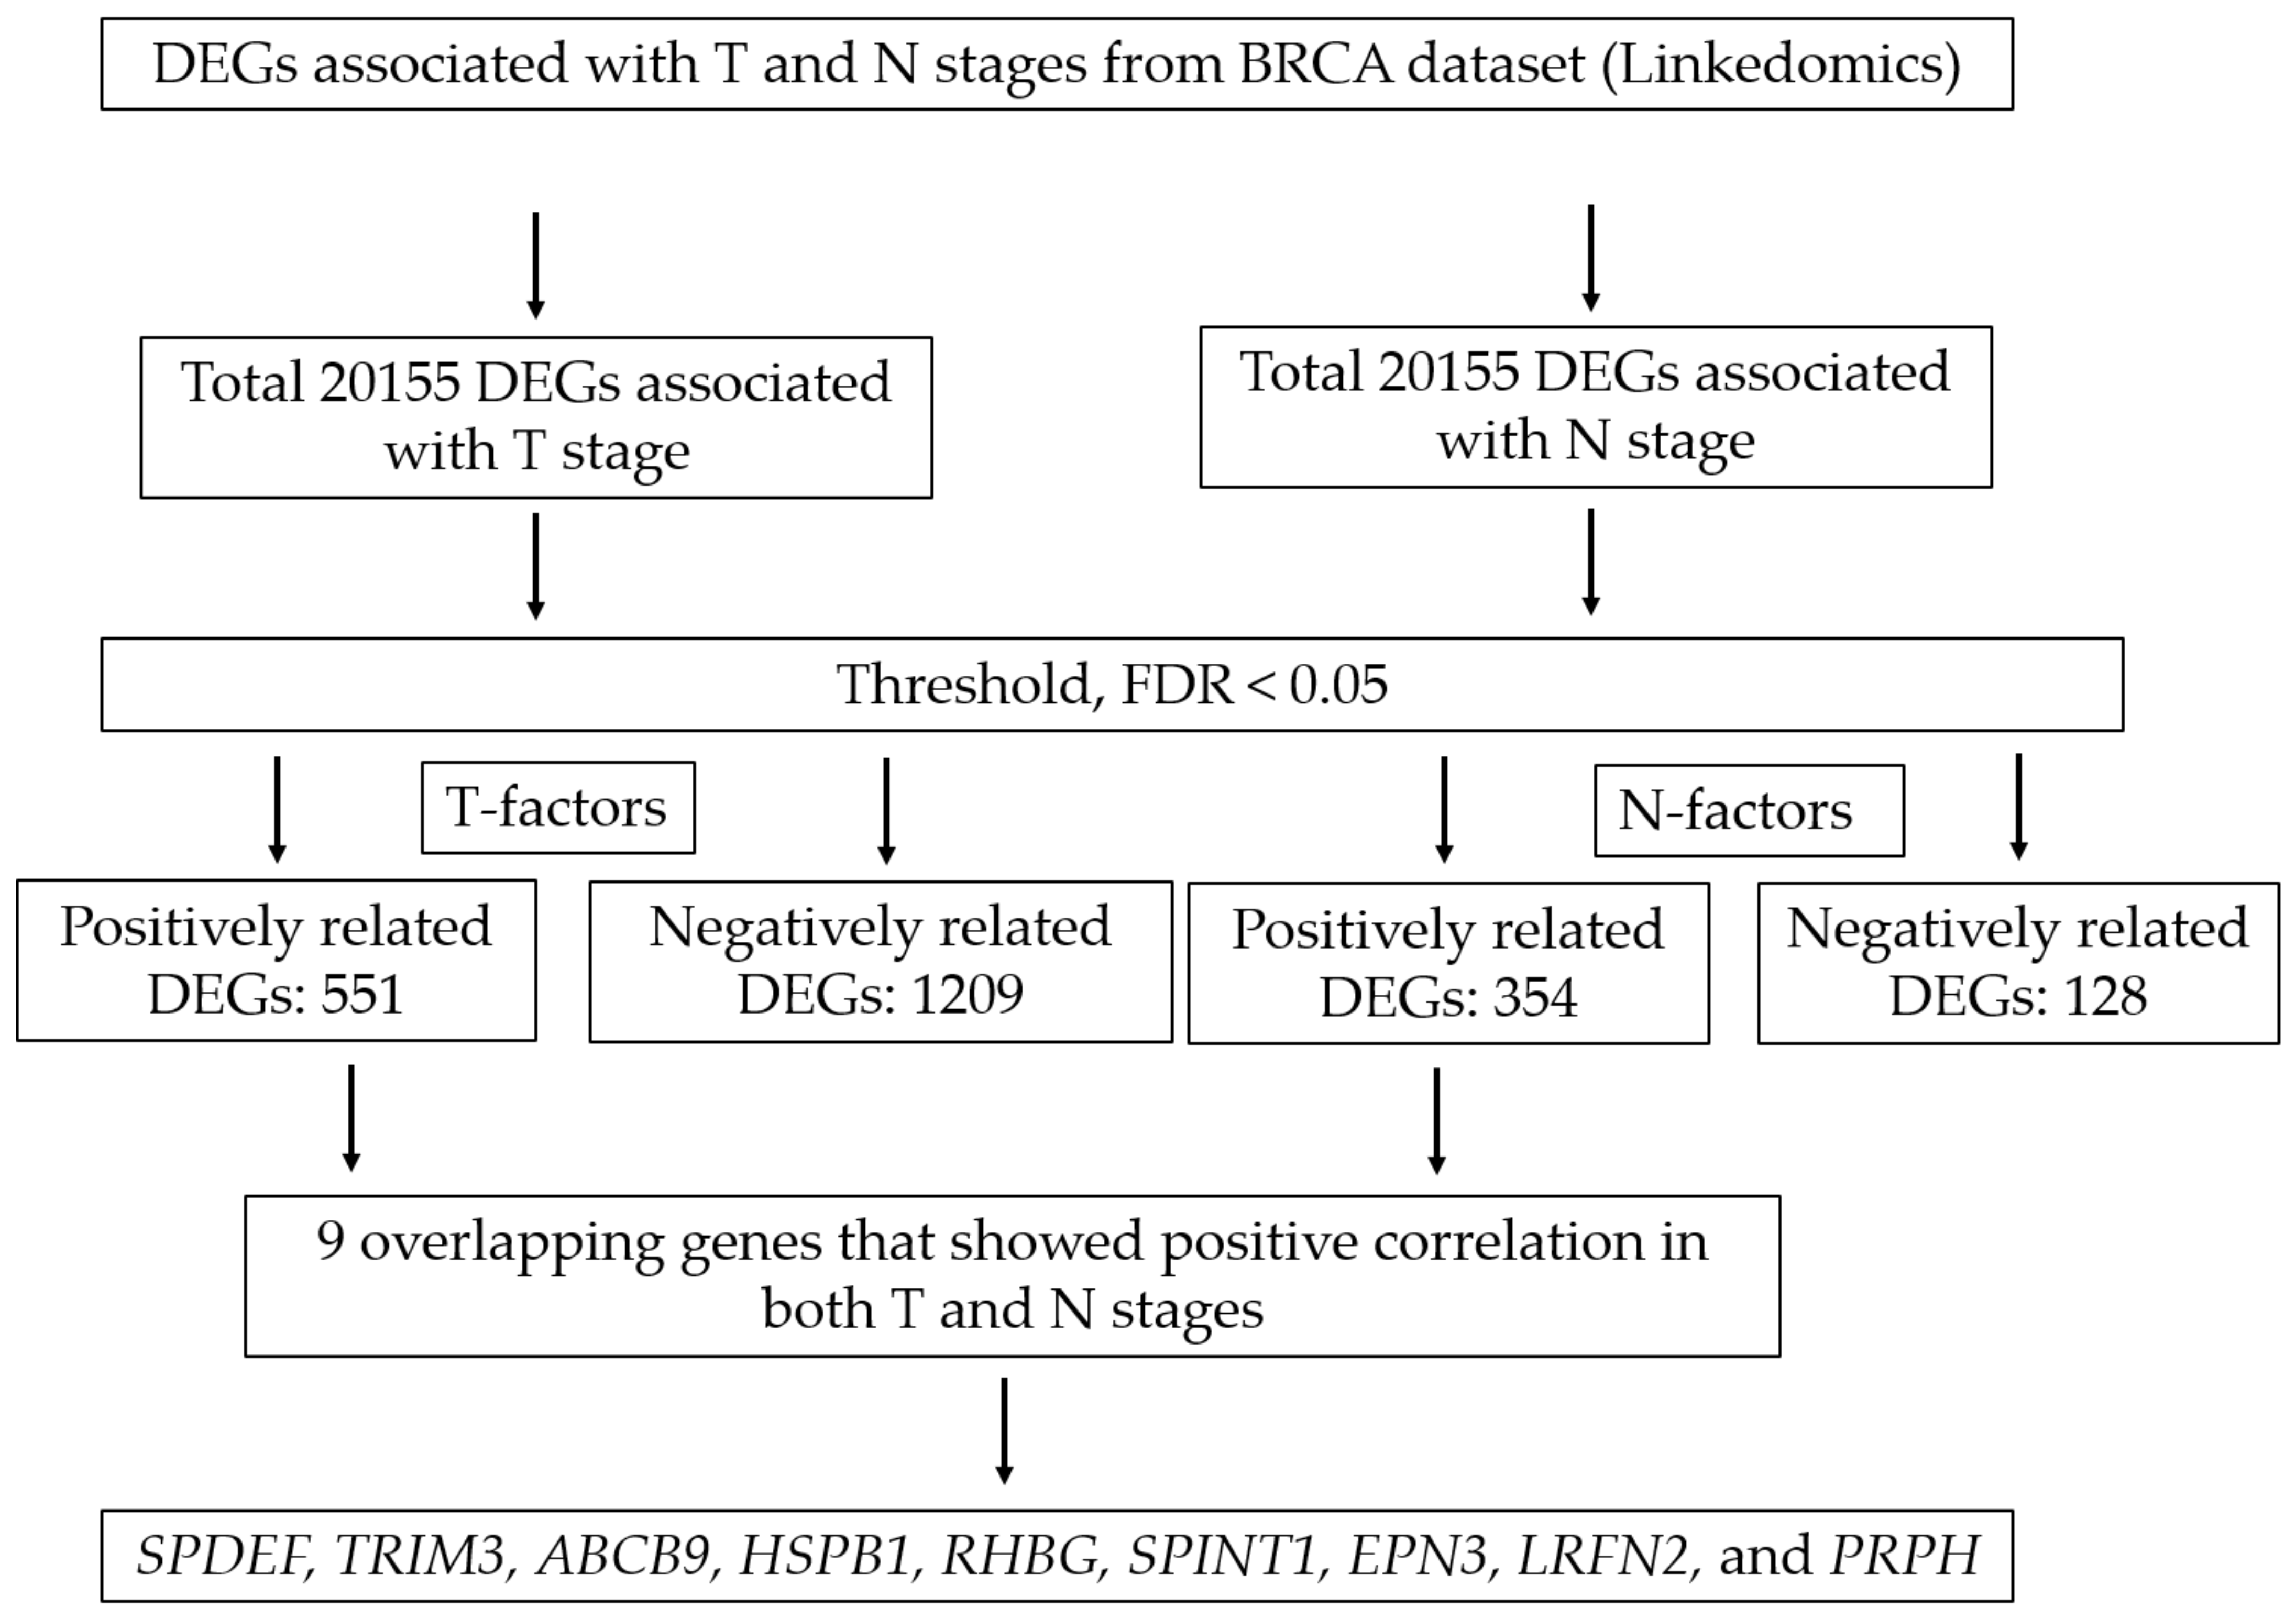
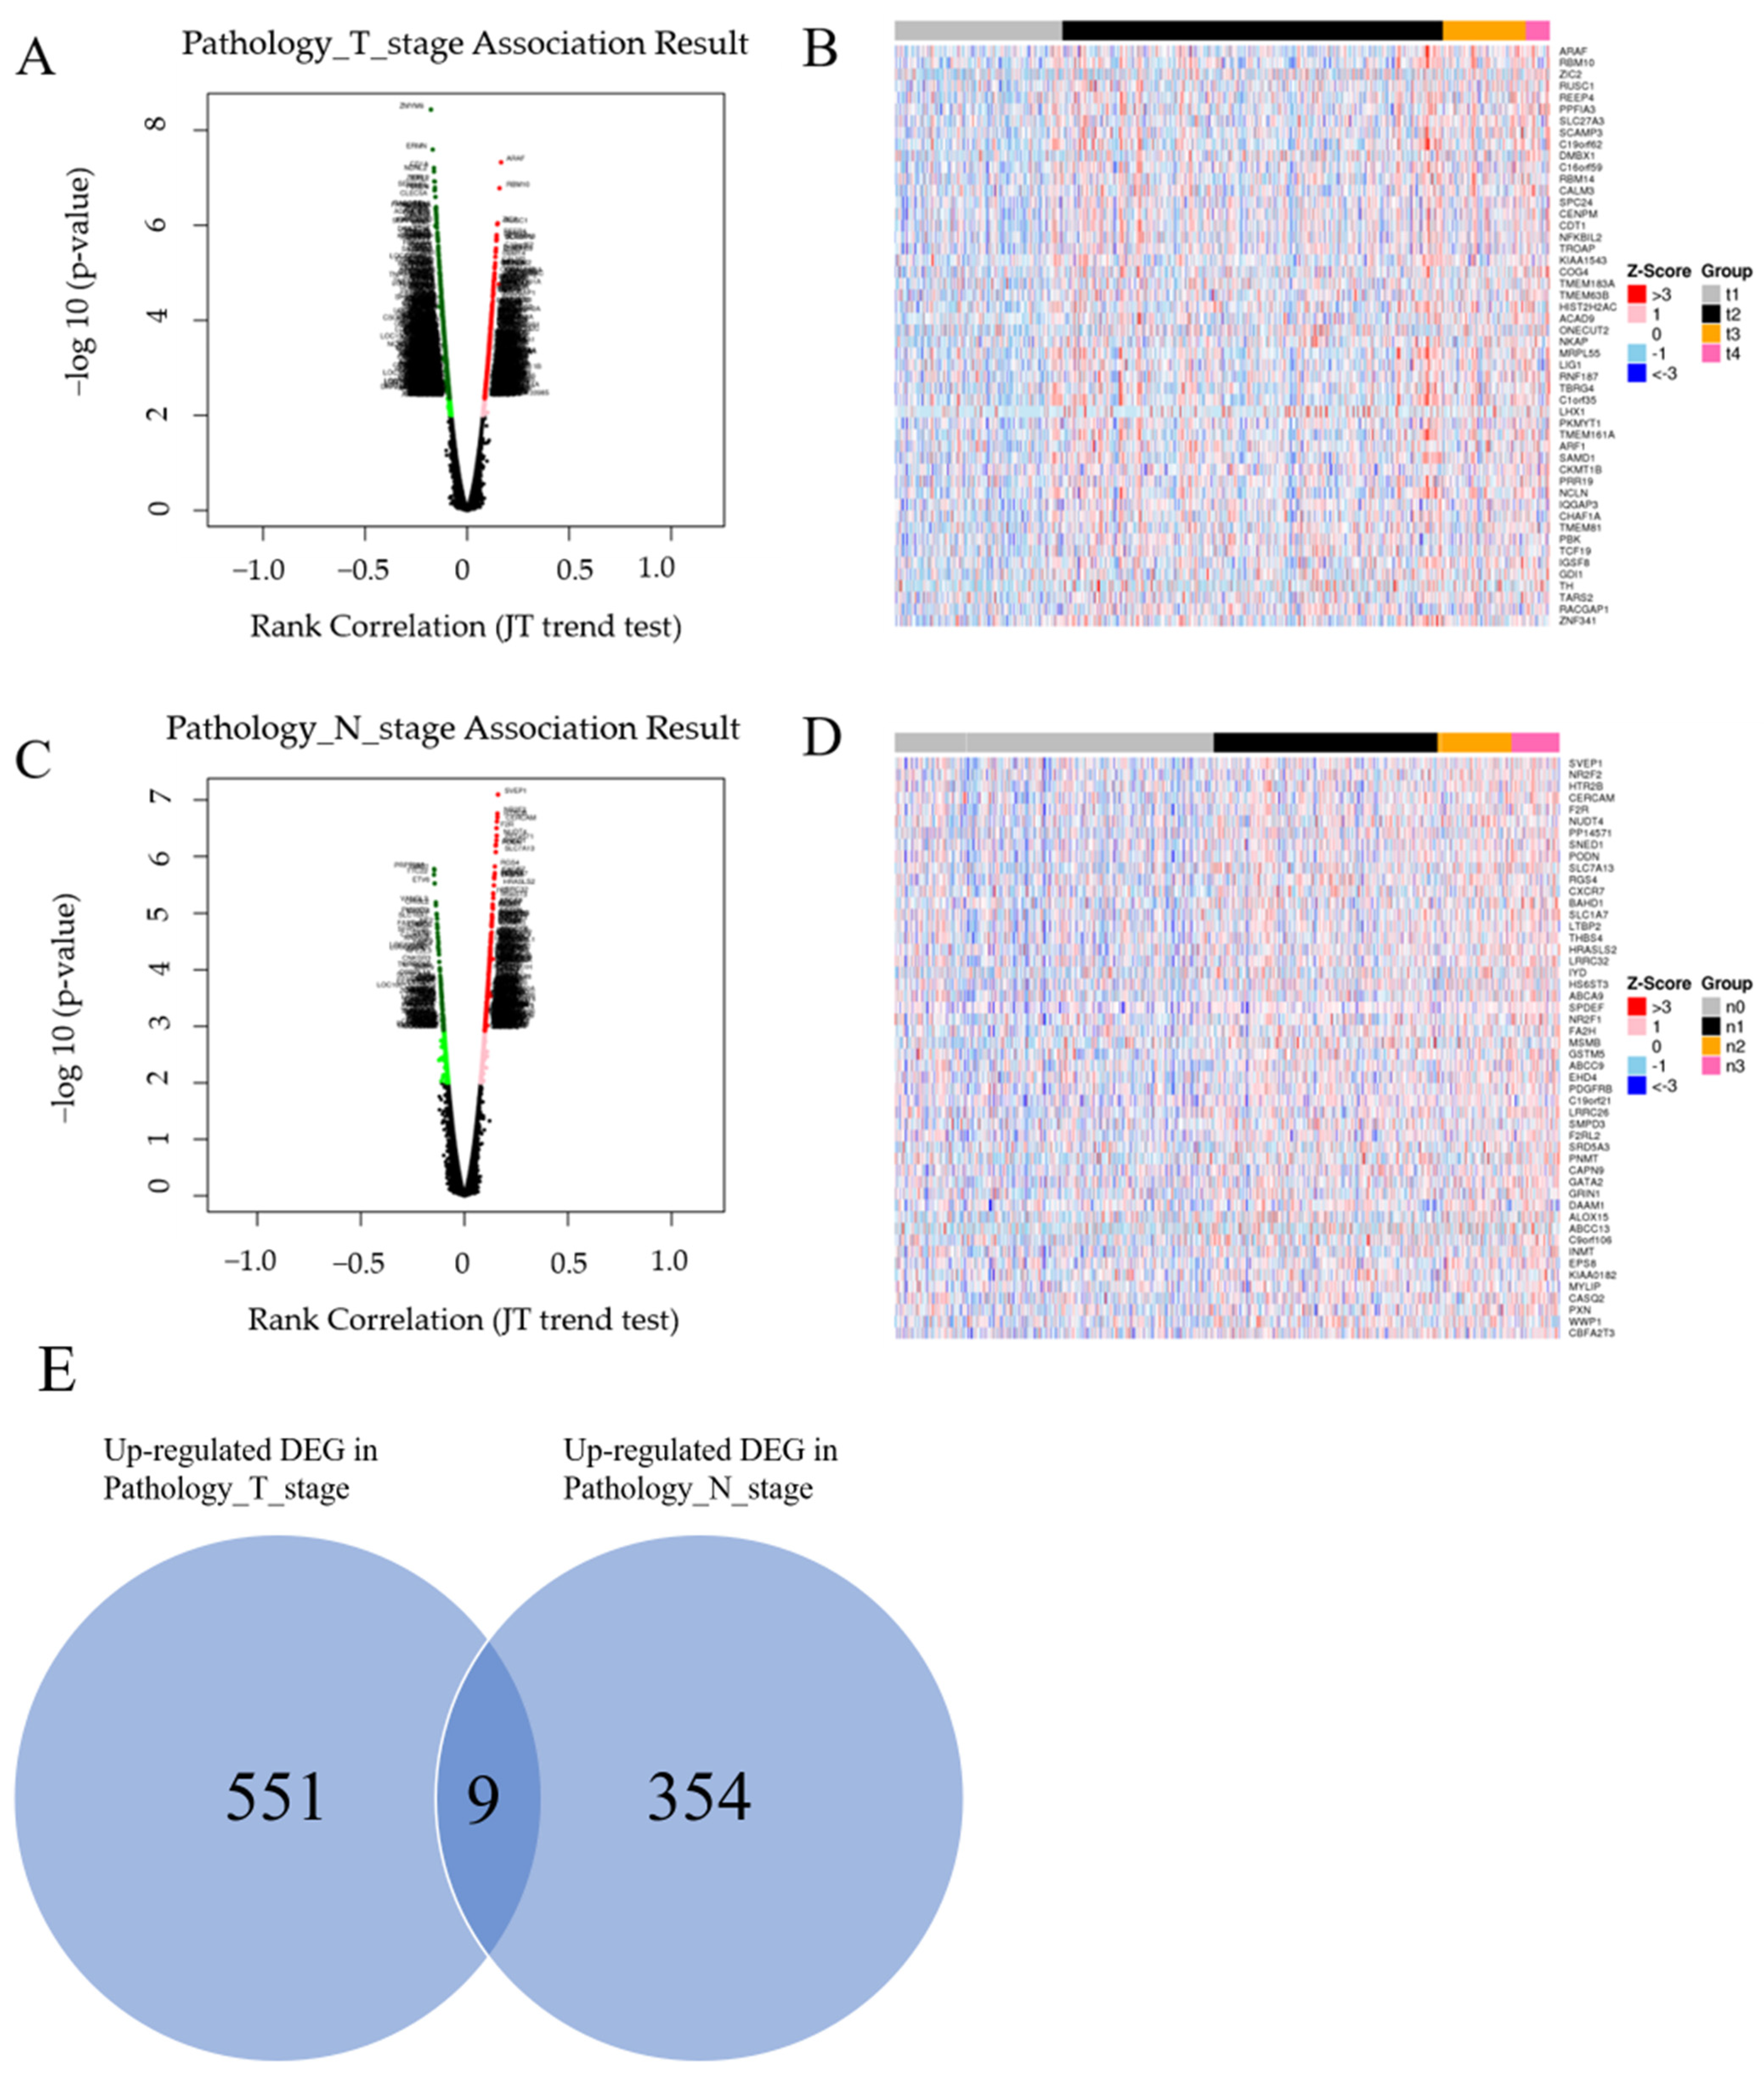
3.1. Screening Overlapping Upregulated DEGs

LinkedOmics analysis results are shown as a volcano plot (Figure 2A,B), and heatmaps showed the top 50 genes positively related to the T and N factors (Figure 2C,D); 551 and 354 upregulated DEGs fulfilling the positive correlation and threshold (FDR < 0.05) were identified in the T and N stages, respectively. The following nine genes overlapping between the T (551 genes) and N (354 genes) stages were identified: SAM pointed domain-containing ETS transcription factor (SPDEF), tripartite motif containing 3 (TRIM3), ATP binding cassette subfamily B member 9 (ABCB9), heat shock protein family B (small) member 1 (HSPB1), RHBG, serine peptidase inhibitor, Kunitz type 1 (SPINT1), epsin 3 (EPN3), leucine rich repeat and fibronectin type III domain-containing 2 (LRFN2), and peripherin (PRPH). All of these genes were upregulated in both the T and N stages (Figure 2E). The details and p-values of these nine genes are given in Table 1. The box plot of stepwise gene expression among T and N stages is shown in Figure 3.

3.2. Validation of the Expression of Selected Genes in BC

We used TCGA data from UALCAN and analyzed the expression of the nine selected genes in TCGA_BRCA (n = 1097) and normal tissues (n = 114). SPDEF, TRIM3, ABCB9, HSPB1, RHBG, SPINT1, EPN3, and LRFN2 were highly expressed in BRCA tissues, and the differences were statistically significant (Figure 4A–H, p < 0.01). However, PRPH expression was lower than that in normal tissues, and the difference was not statistically significant (Figure 4I, p = 0.876).

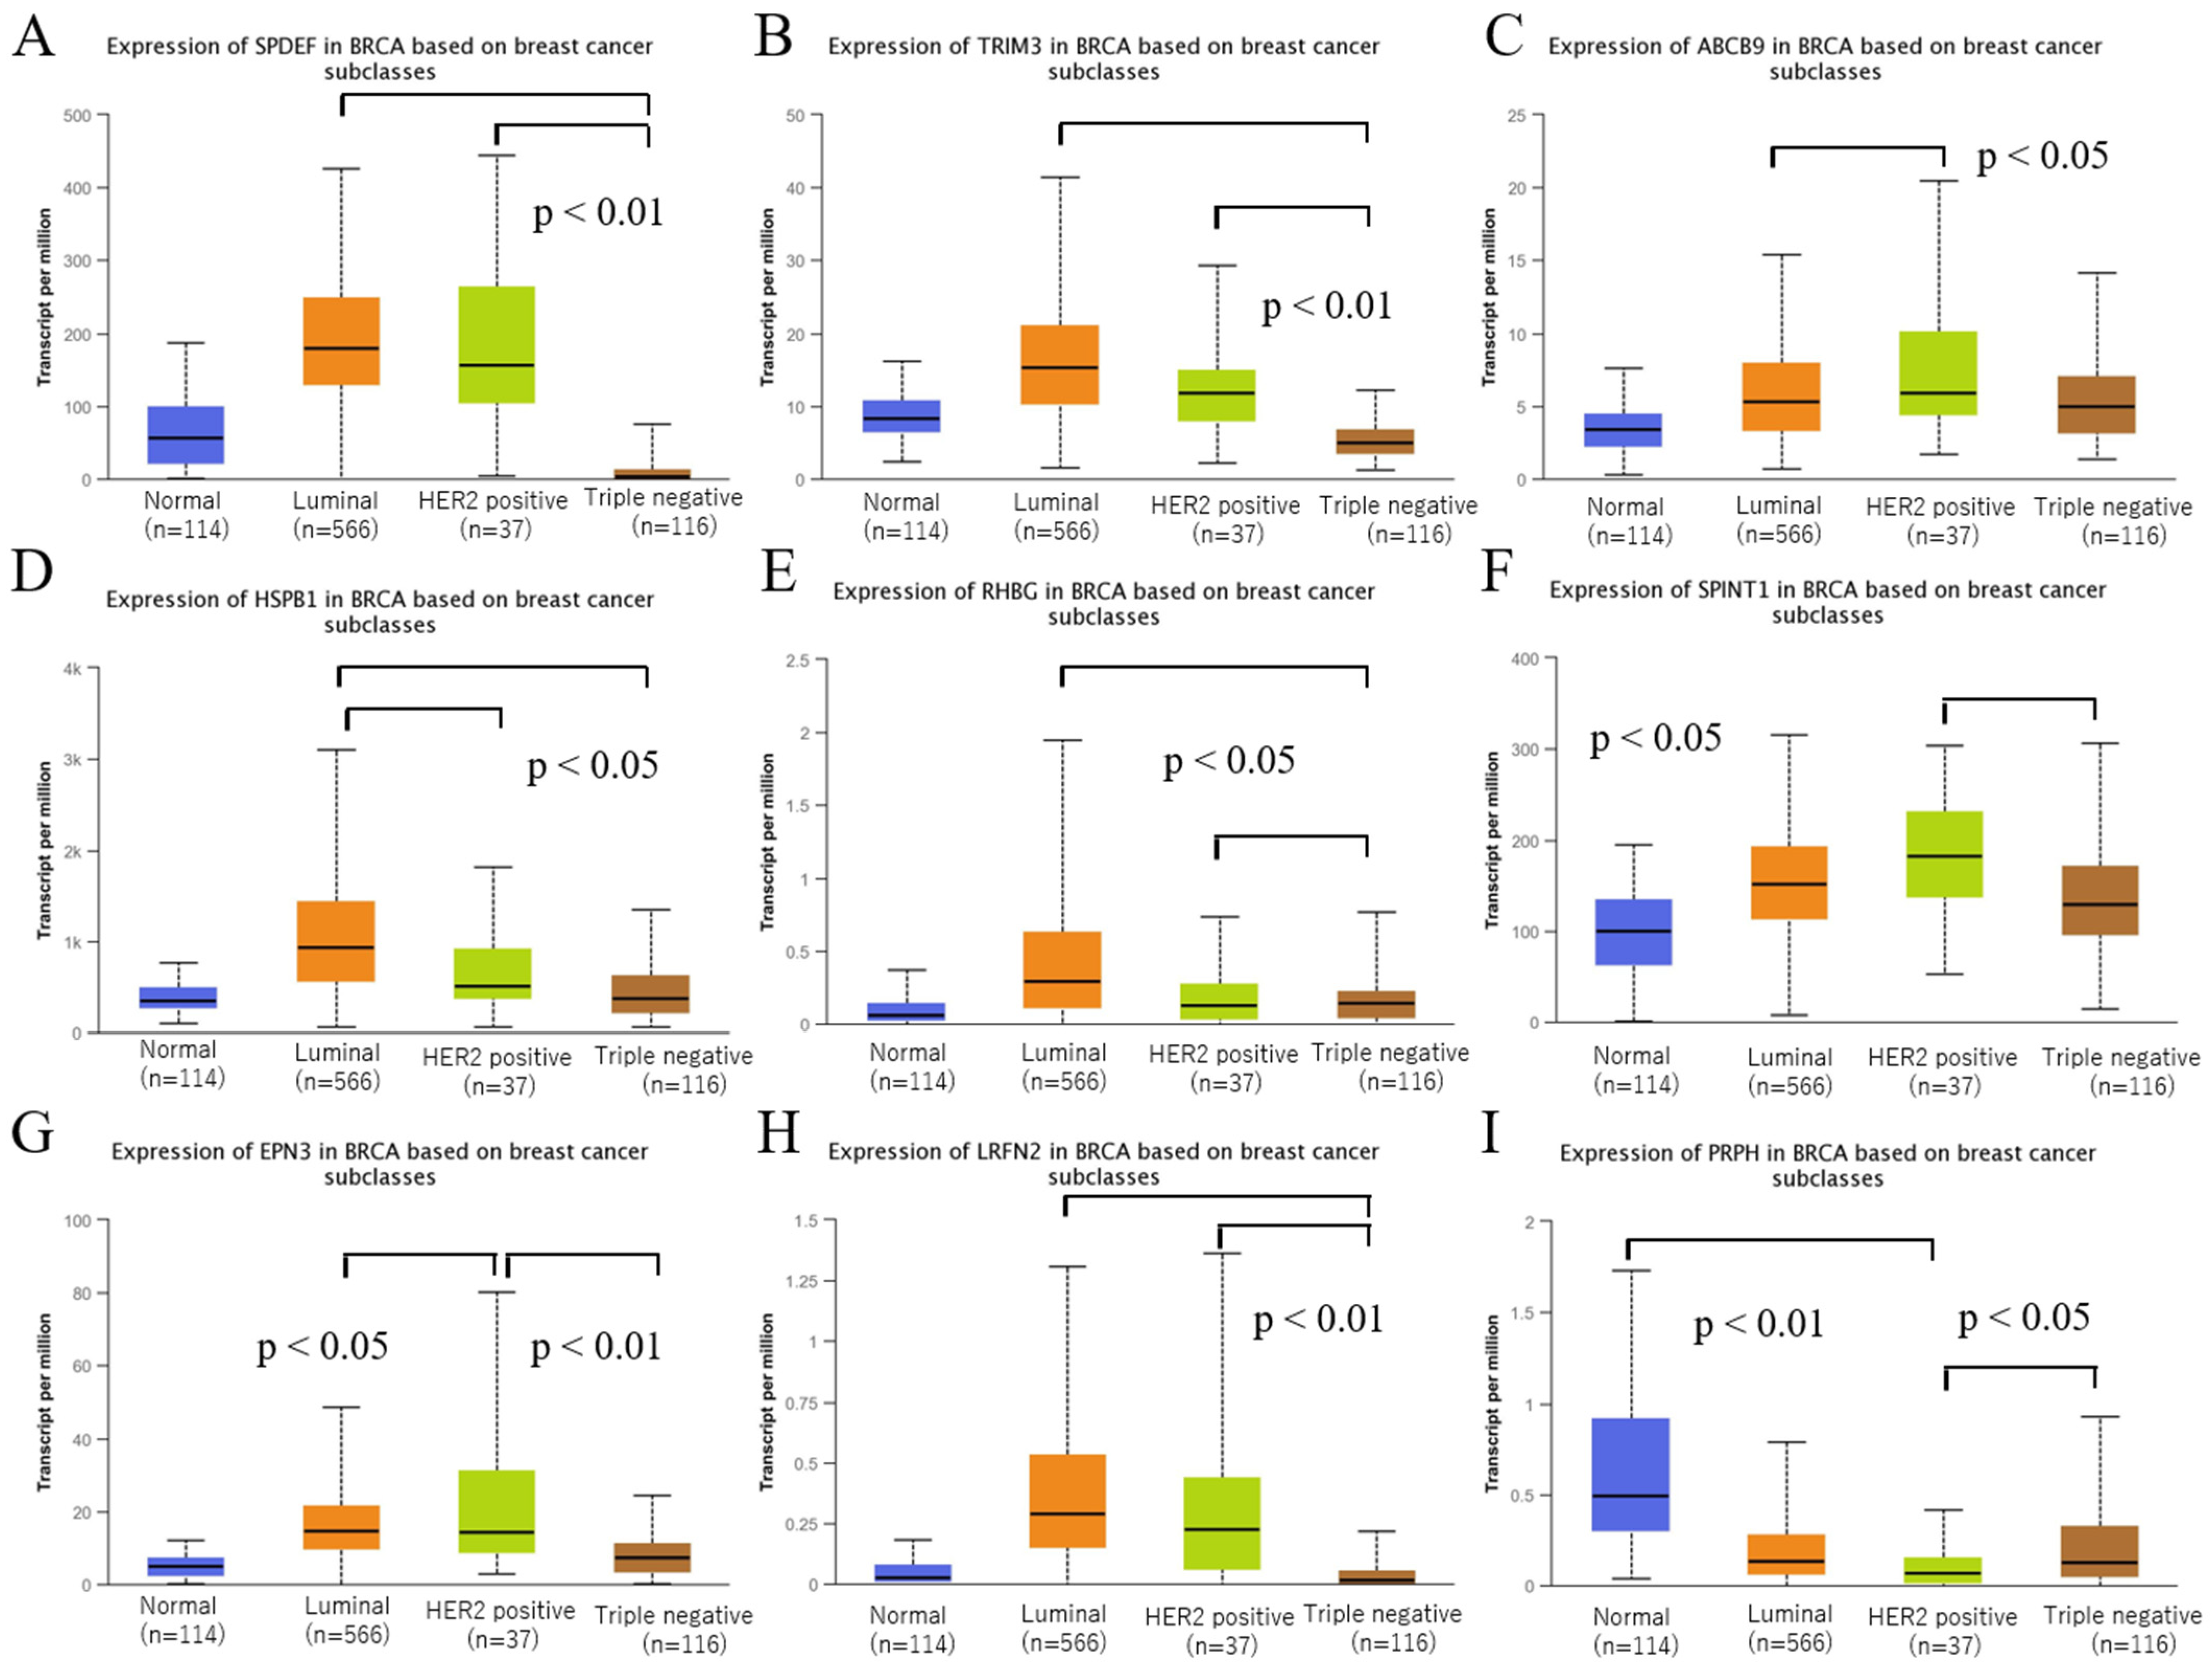
3.3. Validation of the Expression of Selected Genes among Intrinsic Subtypes of BRCA

BC is classified into three subtypes: luminal, HER2, and TNBC. SPDEF, TRIM3, and LRFN2 expression was significantly higher in the luminal and HER2 types than in the TNBC type (p < 0.01, Figure 5A,B,H). ABCB9 and EPN3 expression was significantly higher in the HER2 type than in the luminal type (p < 0.05, Figure 5C,G). In the luminal type, HSPB1 and RHBG expression was significantly higher than that in the HER2 and TNBC types (p < 0.05, Figure 5D,E). SPINT1 expression was significantly higher in the HER2 type than in the TNBC type (p < 0.05, Figure 5F). PRPH expression was lower in all subtypes than in the normal tissues (Figure 5I). Detailed statistical analysis results are given in Supplementary Materials.

3.4. Survival Analysis for the Nine Genes

To investigate the prognostic value of the nine genes, we used the GEPIA2 platform (Figure 6). ABCB9 (Figure 6C) and SPINT1 (Figure 6F) showed significantly worse prognoses (p = 0.0034 and p = 0.0067, respectively). The expressions of SPDEF, TRIM3, HSPB1, RHBG, EPN3, LRFN2, and PRPH were not significant (p = 0.4, p = 0.6, p = 0.49, p = 0.77, p = 0.12, p = 0.56, and p = 0.92, respectively).

3.5. CRISPR-Cas9 and RNAi Screening Using DepMap

We next examined the gene effect scores of the nine genes in BC cell lines using DepMap. In SPDEF, 14 cell lines were below the cut-off value (−0.5) of the gene effect score for CRISPR-Cas9 data (14/27, 29.8%; Figure 7A). In SPINT1, six cell lines were below the cut-off value (−0.5) of the gene effect score for CRISPR-Cas9 data (6/47, 12.8%, Figure 7B). In SPDEF, 24 cell lines were below the cut-off value (−0.5) of the gene effect score for RNAi data (24/77, 31.2%, Figure 7C). In TRIM3, two cell lines were below the cut-off value (−0.5) of the gene effect score for RNAi data (2/73, 2.7%, Figure 7D). In ABCB9, one cell line was below the cut-off value (−0.5) of the gene effect score for RNAi data (1/78, 1.3%, Figure 7E). In RHBG, two cell lines were below the cut-off value (−0.5) of the gene effect score for RNAi data (2/75, 2.7%, Figure 7F). In PRPH, six cell lines were below the cut-off value (−0.5) of the gene effect score for RNAi data (6/76, 7.9%, Figure 7G). The details of the scores and cell lines are presented in Table 2 and Table 3, respectively. CRISPR-Cas9 screening results for TRIM3, ABCB9, HSPB1, RHBG, EPN3, LRFN2, and PRPH as well as RNAi screening results for HSPB1, SPINT1, and LRFN2 are summarized in Supplementary Materials.

4. Discussion

In this study, we used LinkedOmics to extract a set of genes involved in the T and N stages of BC progression and identified nine genes with overlapping expression. We examined their expression levels between normal breast tissues and BC tumor tissues and among intrinsic subtypes of BC using UALCAN and applicability as potential therapeutic targets in BC using DepMap.
LinkedOmics analysis revealed that SPDEF, TRIM3, ABCB9, HSPB1, RHBG, SPINT1, EPN3, LRFN2, and PRPH were involved in both T and N stages of BC. In UALCAN analysis, SPDEF, TRIM3, ABCB9, HSPB1, RHBG, SPINT1, EPN3, and LRFN2 were found to be highly expressed in BRCA tissues (Figure 4, p < 0.01). However, PRPH expression was lower than that in normal tissues (Figure 4I, p = 0.876). In the present study, RHBG, LRFN2, and PRPH were also found to be involved in the progression of BC. The relationship between RHBG and BC has not been reported to date; this study is the first to report that RHBG is directly involved in the progression of BC. RHBG has been shown to be a direct target of β-catenin regulation [21]. Further, since it has been shown to affect Wnt/β-catenin signaling for immune microenvironment regulation, stem cell maintenance, therapeutic resistance, and phenotyping [22], RHBG may be involved in BC progression via β-catenin. Regarding the relationship between LRFN2 and cancer, LRFN2 is known to inhibit esophageal cancer progression via the regulation of the Wnt/β-catenin and NF-κB signaling pathways [23]. Its relevance to BC remains unclear, as in esophageal cancer, LRFN2 may be involved in BC progression via the Wnt/β-catenin and NF-κB signaling pathways. Further studies on the relationship between these genes and BC should be carried out in the future. PRPH encodes a 58 kDa type III intermediate protein filament that is mainly found in the peripheral and central nervous system neurons that project to peripheral structures, such as lower motor neurons that assemble with neurofilaments [24]. In recent years, it has been shown that the autonomic nervous system can reach the BC tissue, significantly impacting BC growth and metastasis [25]. As mentioned above, PRPH is known to associate with peripheral nerve formation [24], LRFN2 is known to recruit and combine with the N-methyl-d-aspartate receptor (NMDARs) through the C-terminal PDZ domain to promote neurodevelopment [26,27,28], and PRPH and LRFN2 may also be involved in this mechanism. Therefore, the expression of LRFN2 and PRPH may be stepwise upregulated with the progression of BC.
We validated the expression of nine genes among intrinsic subtypes using UALCAN. We found that SPDEF, TRIM3, HSPB1, RHBG, EPN3, and LRFN2 were significantly highly expressed in the luminal type than those in TNBC (Figure 5, p < 0.01); the luminal type was reported to have a considerably higher frequency of positive lymph nodes than TNBC [29]. In this study, because we extracted genes that are upregulated in the N stage, these genes are thought to be highly expressed in the luminal type. High SPDEF expression was reported to be more common in the luminal type and is positively correlated with the TNM stage, lymphoid nodal status, and tumor invasion, with a poor prognosis in high-expression groups [30,31,32]. TRIM3 promotes estrogen signaling and BC progression [33]. The results of these previous studies are consistent with those of the present study. SPDEF, TRIM3, HSPB1, SPINT1, EPN3, and LRFN2 were significantly highly expressed in the HER2-positive type than in TNBC (Figure 5, p < 0.05), as the HER2-positive type is reported to have a larger tumor size and higher stage [34,35]. We extracted genes that were upregulated and whose expression overlapped between the T and N stages; it is thought that genes related to tumor size, cell proliferation, and higher stage were highly expressed in the HER2-positive type. HSPB1 is frequently upregulated in BC [36], wherein it promotes cancer cell growth and metastasis by inducing the SUMOylation of HSPB8 and increasing its expression [37], and SPINT1 was highly expressed in the HER2-positive type, with a relatively high rate in node-positive patients [38]. The results of these previous studies are consistent with those of the present study. PRPH was the only gene whose expression was lower in BC tissues than in normal tissues. Its expression level in the TNBC type was significantly higher than that in the HER2-positive type (Figure 5I, p = 0.0103) and demonstrated the difference in the distribution of intrinsic subtypes from the other eight genes.
Prognostic analysis by GEPIA2 showed that the high-expression group of ABCB9 and SPINT1 had a significantly worse prognosis (p = 0.0034 and p = 0.0067, respectively), whereas prognosis for the other genes, although involved in BC progression, did not differ remarkably between the high and low expression groups. Genes involved in BC progression were not considered to equate with poor prognostic factors. ABCB9 is highly expressed in paclitaxel-resistant BC, and microRNA-24 is known to suppress ABCB9 and increase paclitaxel sensitivity [39]. For SPINT1, KEGG enrichment analysis showed that ErbB signaling is substantially enriched. ErbB signaling is involved in regulating drug resistance [40,41]. Because the GEPIA2 dataset includes patients with a history of drug treatment, it is likely that the prognosis differed according to the genes involved in drug resistance.
In this study, we identified a set of genes involved in BC progression, and DepMap analysis was used to validate the dependency and essentiality of the nine genes for proliferation and survival of BC cell lines and whether they are potential therapeutic targets. Regarding SPDEF, TRIM3, ABCB9, RHBG, SPINT1, and PRPH, the cell lines below the cut-off value (gene effect score: −0.5) were a part of the total (1.3–31.2%). These genes proved essential for BC cell line survival; knocking out or knocking down their expression has been shown to serve as a potential therapeutic targeting approach. As SPDEF, TRIM3, ABCB9, and SPINT1 have already been linked to BC, knocking out or knocking down the expression of these genes can suppress the growth of or kill BC cell lines. Interestingly, the finding that PRPH, a neuronal intermediate filament protein, is essential for survival in several BC cell lines is novel. We initially thought that since PRPH is a type III intermediate filament protein expressed mainly in the neurons of the peripheral nervous system, its elevated expression was the result of the upregulation of an upstream transcription factor, rather than PRPH being associated with BC. However, when the knockdown of PRPH was performed using RNAi, 7.9% of cell lines were below the cut-off value (−0.5), suggesting a direct causal relationship between PRPH and BC. The results of this study are of high clinical significance as PRPH was found to be a potential therapeutic target in BC.
Additional studies are needed to elucidate the role of PRPH in BC progression and survival and the underlying molecular mechanisms. Originally, knockout of a gene using CRISPR-Cas9 was considered to have a more serious impact than knockdown using RNAi. However, it is now clear that knockdown of a gene has a greater effect than its knockout [42]. A genetic compensation response is said to activate the transcription of genes related to the gene inactivated by knockout. In other words, the expression of genes associated with the knockout gene increases, complementing the knocked-out gene function, often having no effect on the cell. However, this mechanism does not occur when the expression of a gene is knocked down, and as a result, several genes that are knocked down by RNAi can induce biological defects [43]. This mechanism may explain why RNAi had a more severe effect on several cell lines in this study; 1.3%–31.2% of the total cell lines were below the cut-off value (−0.5) in the cases of SPDEF, SPINT1, TRIM3, ABCB9, RHBG, and PRPH. Currently, there are no molecular therapies targeting SPDEF, SPINT1, TRIM3, ABCB9, RHBG, or PRPH. However, since the current study showed that knockout/knockdown of these genes was essential for the survival of BC cell lines, development of drugs targeting these genes might be worth exploring in the future. To establish novel therapeutic strategies for BC, it is essential to conduct active translational research involving previously reported genes (i.e., LXR alpha, SEMA6D, and ITGA7) and those identified in the current study.
Our study has some limitations. This study was conducted using bioinformatics only; hence, additional evaluation, validation, verification, and demonstration with actual BC tissues and cell lines are required. In addition, screening with the DepMap database successfully identified genes that could be potential therapeutic targets; however, a more careful analysis is needed if these gene groups are to be considered as drug target candidates. Whether these genes are prognostic factors should be stringently established and precisely matched to treatment history, treatment method, and staging.
In summary, SPDEF, TRIM3, ABCB9, HSPB1, RHBG, SPINT1, EPN3, LRFN2, and PRPH are involved in BC progression. ABCB9 and SPINT1 are associated with worse prognosis in BC. Furthermore, SPDEF, TRIM3, ABCB9, RHBG, SPINT1, and PRPH were found to be essential for survival in some BC cell lines, indicating that these genes are potential therapeutic targets in BC. We hope that future studies will verify these findings using BC tissues and cell lines and validate these genes as new and effective therapeutic targets.

Supplementary Materials

The following supporting information can be downloaded at: https://www.mdpi.com/article/10.3390/biomedicines10112995/s1, Figure S1: CRISPR-Cas9 screening: (a) TRIM3, (b) ABCB9, (c) HSPB1, (d) EPN3, (e) LRFN2, and (f) PRPH. RNAi screening: (g) HSPB1, (h) SPINT1, and (i) LRFN2; Table S1: Statistical comparison of normal, luminal, HER2, and TNBC type for the nine candidate genes.

Author Contributions

Conceptualization, S.U. and T.S.; formal analysis, S.U.; writing—original draft preparation, S.U. and T.S. All authors have read and agreed to the published version of the manuscript.

Funding

This research received no external funding.

Institutional Review Board Statement

Not applicable.

Informed Consent Statement

Not applicable.

Data Availability Statement

The datasets generated and/or analyzed during this study are available from the corresponding author upon reasonable request.

Acknowledgments

We appreciate the Bioinformatics Consultation Forum of the Society for Biotechnology (Japan).

Conflicts of Interest

The authors declare that they have no competing interests.

References

  1. Siegel, R.L.; Miller, K.D.; Fuchs, H.E.; Jemal, A. Cancer statistics, 2022. CA Cancer J. Clin. 2022, 72, 7–33. [Google Scholar] [CrossRef] [PubMed]
  2. WHO Classification of Tumours Editorial Board. WHO Classification of Tumours Editorial Board. WHO classification of tumours. In Breast Tumours, 5th ed.; IARC: Lyon, France, 2019. [Google Scholar]
  3. Waks, A.G.; Winer, E.P. Breast cancer treatment: A review. JAMA 2019, 321, 288–300. [Google Scholar] [CrossRef] [PubMed]
  4. Tsuchida, J.; Rothman, J.; McDonald, K.A.; Nagahashi, M.; Takabe, K.; Wakai, T. Clinical target sequencing for precision medicine of breast cancer. Int. J. Clin. Oncol. 2019, 24, 131–140. [Google Scholar] [CrossRef] [PubMed]
  5. Cserni, G.; Chmielik, E.; Cserni, B.; Tot, T. The new TNM-Based staging of breast cancer. Virchows Arch. 2018, 472, 697–703. [Google Scholar] [CrossRef]
  6. Hutchinson, S.A.; Websdale, A.; Cioccoloni, G.; Røberg-Larsen, H.; Lianto, P.; Kim, B.; Rose, A.; Soteriou, C.; Pramanik, A.; Wastall, L.M.; et al. Liver x receptor alpha drives chemoresistance in response to side-Chain hydroxycholesterols in triple negative breast cancer. Oncogene 2021, 40, 2872–2883. [Google Scholar] [CrossRef] [PubMed]
  7. Gunyuz, Z.E.; Sahi-Ilhan, E.; Kucukkose, C.; Ipekgil, D.; Tok, G.; Mese, G.; Ozcivici, E.; Yalcin-Ozuysal, O. SEMA6D differentially regulates proliferation, migration, and invasion of breast cell lines. ACS Omega 2022, 7, 15769–15778. [Google Scholar] [CrossRef]
  8. Bhandari, A.; Xia, E.; Zhou, Y.; Guan, Y.; Xiang, J.; Kong, L.; Wang, Y.; Yang, F.; Wang, O.; Zhang, X. ITGA7 functions as a tumor suppressor and regulates migration and invasion in breast cancer. Cancer Manag. Res. 2018, 10, 969–976. [Google Scholar] [CrossRef] [Green Version]
  9. Feng, H.; Song, Z. Identification of core miRNAs and regulatory pathways in breast cancer by integrated bioinformatics analysis. Mol. Omics. 2021, 17, 277–287. [Google Scholar] [CrossRef]
  10. Zheng, S.; Zou, Y.; Liang, J.Y.; Xiao, W.; Yang, A.; Meng, T.; Lu, S.; Luo, Z.; Xie, X. Identification and validation of a combined hypoxia and immune index for triple-negative breast cancer. Mol. Oncol. 2020, 14, 2814–2833. [Google Scholar] [CrossRef]
  11. Craven, K.E.; Gökmen-Polar, Y.; Badve, S.S. CIBERSORT analysis of TCGA and METABRIC identifies subgroups with better outcomes in triple negative breast cancer. Sci. Rep. 2021, 11, 4691. [Google Scholar] [CrossRef]
  12. Singh, A.; Trivedi, P.; Jain, N.K. Advances in siRNA delivery in cancer therapy. Artif. Cells Nanomed. Biotechnol. 2018, 46, 274–283. [Google Scholar] [CrossRef] [PubMed]
  13. Chen, M.; Mao, A.; Xu, M.; Weng, Q.; Mao, J.; Ji, J. CRISPR-Cas9 for cancer therapy: Opportunities and challenges. Cancer Lett. 2019, 447, 48–55. [Google Scholar] [CrossRef] [PubMed]
  14. Tsherniak, A.; Vazquez, F.; Montgomery, P.G.; Weir, B.A.; Kryukov, G.; Cowley, G.S.; Gill, S.; Harrington, W.F.; Pantel, S.; Krill-Burger, J.M.; et al. Defining a cancer dependency map. Cell 2017, 170, 564–576. [Google Scholar] [CrossRef] [PubMed] [Green Version]
  15. Meyers, R.M.; Bryan, J.G.; McFarland, J.M.; Weir, B.A.; Sizemore, A.E.; Xu, H.; Dharia, N.V.; Montgomery, P.G.; Cowley, G.S.; Pantel, S.; et al. Computational correction of copy number effect improves specificity of CRISPR-Cas9 essentiality screens in cancer cells. Nat. Genet. 2017, 49, 1779–1784. [Google Scholar] [CrossRef] [Green Version]
  16. Lin, S.; Larrue, C.; Scheidegger, N.K.; Seong, B.K.A.; Dharia, N.V.; Kuljanin, M.; Wechsler, C.S.; Kugener, G.; Robichaud, A.L.; Conway, A.S.; et al. An in vivo CRISPR screening platform for prioritizing therapeutic targets in AML. Cancer Discov. 2022, 12, 432–449. [Google Scholar] [CrossRef]
  17. Vasaikar, S.V.; Straub, P.; Wang, J.; Zhang, B. LinkedOmics: Analyzing multi-omics data within and across 32 cancer types. Nucleic Acids Res. 2018, 46, D956–D963. [Google Scholar] [CrossRef] [Green Version]
  18. Chandrashekar, D.S.; Bashel, B.; Balasubramanya, S.A.H.; Creighton, C.J.; Ponce-Rodriguez, I.; Chakravarthi, B.V.S.K.; Varambally, S. UALCAN: A portal for facilitating tumor subgroup gene expression and survival analyses. Neoplasia 2017, 19, 649–658. [Google Scholar] [CrossRef]
  19. Tang, Z.; Kang, B.; Li, C.; Chen, T.; Zhang, Z. GEPIA2: An enhanced web server for large-scale expression profiling and interactive analysis. Nucleic Acids Res. 2019, 47, W556–W560. [Google Scholar] [CrossRef] [Green Version]
  20. Shi, B.; Ding, J.; Qi, J.; Gu, Z. Characteristics and prognostic value of potential dependency genes in clear cell renal cell carcinoma based on a large-Scale CRISPR-Cas9 and RNAi screening database DepMap. Int. J. Med. Sci. 2021, 18, 2063–2075. [Google Scholar] [CrossRef]
  21. Merhi, A.; De Mees, C.; Abdo, R.; Alberola, J.V.; Marini, A.M. Wnt/β-catenin signaling regulates the expression of the ammonium permease gene RHBG in human cancer cells. PLoS ONE 2015, 10, e0128683. [Google Scholar] [CrossRef]
  22. Xu, X.; Zhang, M.; Xu, F.; Jiang, S. Wnt signaling in breast cancer: Biological mechanisms, challenges and opportunities. Mol. Cancer 2020, 19, 165. [Google Scholar] [CrossRef] [PubMed]
  23. Zhou, Y.; Xu, L.; Wang, J.; Ge, B.; Wang, Q.; Wang, T.; Liu, C.; Wei, B.; Wang, Q.; Gao, Y. LRFN2 binding to NMDAR inhibits the progress of ESCC via regulating the Wnt/β-Catenin and NF-κB signaling pathway. Cancer Sci. 2022, 113, 3566–3578. [Google Scholar] [CrossRef] [PubMed]
  24. Zhao, J.; Liem, R.K.H. α-internexin and peripherin: Expression, assembly, functions, and roles in disease. Methods Enzymol. 2016, 568, 477–507. [Google Scholar] [CrossRef] [PubMed]
  25. Kamiya, A.; Hayama, Y.; Kato, S.; Shimomura, A.; Shimomura, T.; Irie, K.; Kaneko, R.; Yanagawa, Y.; Kobayashi, K.; Ochiya, T. Genetic manipulation of autonomic nerve fiber innervation and activity and its effect on breast cancer progression. Nat. Neurosci. 2019, 22, 1289–1305. [Google Scholar] [CrossRef] [PubMed]
  26. Morimura, N.; Yasuda, H.; Yamaguchi, K.; Katayama, K.I.; Hatayama, M.; Tomioka, N.H.; Odagawa, M.; Kamiya, A.; Iwayama, Y.; Maekawa, M.; et al. Autism-like behaviours and enhanced memory formation and synaptic plasticity in Lrfn2/SALM1-deficient mice. Nat. Commun. 2017, 8, 15800. [Google Scholar] [CrossRef] [Green Version]
  27. Ko, J.; Kim, S.; Chung, H.S.; Kim, K.; Han, K.; Kim, H.; Jun, H.; Kaang, B.K.; Kim, E. SALM synaptic cell adhesion-like molecules regulate the differentiation of excitatory synapses. Neuron 2006, 50, 233–245. [Google Scholar] [CrossRef] [Green Version]
  28. Morimura, N.; Inoue, T.; Katayama, K.; Aruga, J. Comparative analysis of structure, expression and PSD95-binding capacity of Lrfn, a novel family of neuronal transmembrane proteins. Gene 2006, 380, 72–83. [Google Scholar] [CrossRef]
  29. Mattes, M.D.; Bhatia, J.K.; Metzger, D.; Ashamalla, H.; Katsoulakis, E. Breast cancer subtype as a predictor of lymph node metastasis according to the SEER registry. J. Breast Cancer 2015, 18, 143–148. [Google Scholar] [CrossRef] [Green Version]
  30. Feldman, R.J.; Sementchenko, V.I.; Gayed, M.; Fraig, M.M.; Watson, D.K. Pdef expression in human breast cancer is correlated with invasive potential and altered gene expression. Cancer Res. 2003, 63, 4626–4631. [Google Scholar]
  31. Turner, D.P.; Moussa, O.; Sauane, M.; Fisher, P.B.; Watson, D.K. Prostate-derived ETS factor is a mediator of metastatic potential through the inhibition of migration and invasion in breast cancer. Cancer Res. 2007, 67, 1618–1625. [Google Scholar] [CrossRef] [Green Version]
  32. Ye, T.; Li, J.; Feng, J.; Guo, J.; Wan, X.; Xie, D.; Liu, J. The subtype-specific molecular function of SPDEF in breast cancer and insights into prognostic significance. J. Cell. Mol. Med. 2021, 25, 7307–7320. [Google Scholar] [CrossRef] [PubMed]
  33. Zhuang, T.; Wang, B.; Tan, X.; Wu, L.; Li, X.; Li, Z.; Cai, Y.; Fan, R.; Yang, X.; Zhang, C.; et al. TRIM3 facilitates estrogen signaling and modulates breast cancer cell progression. Cell Commun. Signal. 2022, 20, 45. [Google Scholar] [CrossRef] [PubMed]
  34. Dang Cong, T.; Nguyen Thanh, T.; Nguyen Phan, Q.A.; Hoang Thi, A.P.; Nguyen Tran, B.S.; Nguyen Vu, Q.H. Correlation between HER2 expression and clinicopathological features of breast cancer: A cross- sectional study in Vietnam. Asian Pac. J. Cancer Prev. 2020, 21, 1135–1142. [Google Scholar] [CrossRef] [PubMed]
  35. Shokouh, T.Z.; Ezatollah, A.; Barand, P. Interrelationships between Ki67, HER2/neu, p53, ER, and PR status and their associations with tumor grade and lymph node involvement in breast carcinoma subtypes: Retrospective-observational analytical study. Medicine 2015, 94, e1359. [Google Scholar] [CrossRef]
  36. Wei, L.; Liu, T.T.; Wang, H.H.; Hong, H.M.; Yu, A.L.; Feng, H.P.; Chang, W.W. Hsp27 participates in the maintenance of breast cancer stem cells through regulation of epithelial-mesenchymal transition and nuclear factor-κB. Breast Cancer Res. 2011, 13, R101. [Google Scholar] [CrossRef] [Green Version]
  37. Wang, S.; Zhang, X.; Wang, H.; Wang, Y.; Chen, P.; Wang, L. Heat shock Protein 27 enhances SUMOylation of heat shock protein B8 to accelerate the progression of breast cancer. Am. J. Pathol. 2020, 190, 2464–2477. [Google Scholar] [CrossRef]
  38. Wu, Q.; Yin, G.; Luo, J.; Zhang, Y.; Ai, T.; Tian, J.; Jin, Y.; Lei, J.; Liu, S. Comprehensive analysis of the expression and prognostic value of SPINT1/2 in breast carcinoma. Front. Endocrinol. 2021, 12, 665666. [Google Scholar] [CrossRef]
  39. Gong, J.P.; Yang, L.; Tang, J.W.; Sun, P.; Hu, Q.; Qin, J.W.; Xu, X.M.; Sun, B.C.; Tang, J.H. Overexpression of microRNA-24 increases the sensitivity to paclitaxel in drug-resistant breast carcinoma cell lines via targeting ABCB9. Oncol. Lett. 2016, 12, 3905–3911. [Google Scholar] [CrossRef] [Green Version]
  40. Pandya, K.; Wyatt, D.; Gallagher, B.; Shah, D.; Baker, A.; Bloodworth, J.; Zlobin, A.; Pannuti, A.; Green, A.; Ellis, I.O.; et al. PKCα attenuates Jagged-1-Mediated Notch signaling in ErbB-2-Positive breast cancer to reverse trastuzumab resistance. Clin. Cancer Res. 2016, 22, 175–186. [Google Scholar] [CrossRef] [Green Version]
  41. Elizalde, P.V.; Cordo Russo, R.I.; Chervo, M.F.; Schillaci, R. ErbB-2 nuclear function in breast cancer growth, metastasis and resistance to therapy. Endocr. Relat. Cancer 2016, 23, T243–T257. [Google Scholar] [CrossRef] [Green Version]
  42. El-Brolosy, M.A.; Stainier, D.Y.R. Genetic compensation: A phenomenon in search of mechanisms. PLoS Genet. 2017, 13, e1006780. [Google Scholar] [CrossRef] [PubMed]
  43. Rossi, A.; Kontarakis, Z.; Gerri, C.; Nolte, H.; Hölper, S.; Krüger, M.; Stainier, D.Y. Genetic compensation induced by deleterious mutations but not gene knockdowns. Nature 2015, 524, 230–233. [Google Scholar] [CrossRef] [PubMed]
Figure 1. Study flowchart.
Biomedicines 10 02995 g001
Figure 2. (A) LinkedOmics analysis. A volcano map showing genes that are positively and negatively correlated with T factor. (B) The heatmap shows the top 50 genes that are positively correlated with T factor. (C) The volcano map shows the genes that are positively and negatively correlated with N factor. (D) The heatmap shows the top 50 genes that are positively correlated with N factor. (E) Overlapping DEGs between the T (551) and N stages (354) are nine.
Biomedicines 10 02995 g002
Figure 3. Box plot showing stepwise expression of nine genes in each T and N stage using LinkedOmics (Jonckheere trend test). As the stage progresses, the expression level also increases. (A) SPDEF (pathology_T_stage), (B) SPDEF (pathology_N_stage), (C) TRIM3 (pathology_T_stage), (D) TRIM3 (pathology_N_stage), (E) ABCB9 (pathology_T_stage), (F) ABCB9 (pathology_N_stage), (G) HSPB1 (pathology_T_stage), (H) HSPB1 (pathology_N_stage), (I) RHBG (pathology_T_stage), (J) RHBG (pathology_N_stage), (K) SPINT1 (pathology_T_stage), (L) SPINT1 (pathology_N_stage), (M) EPN3 (pathology_T_stage), (N) EPN3 (pathology_N_stage), (O) LRFN2 (pathology_T_stage), (P) LRFN2 (pathology_N_stage), (Q) PRPH (pathology_T_stage), and (R) PRPH (pathology_N_stage).
Biomedicines 10 02995 g003
Figure 4. Validation of the expression of nine candidate genes in TCGA_BRCA samples and normal tissues using UALCAN. (A) SPDEF, (B) TRIM3, (C) ABCB9, (D) HSPB1, (E) RHBG, (F) SPINT1, (G) EPN3, (H) LRFN2, and (I) PRPH.
Biomedicines 10 02995 g004
Figure 5. Validation of the expression of genes in the intrinsic subtype of TCGA_BRCA in UALCAN. (A) SPDEF, (B) TRIM3, (C) ABCB9, (D) HSPB1, (E) RHBG, (F) SPINT1, (G) EPN3, (H) LRFN2, and (I) PRPH.
Biomedicines 10 02995 g005
Figure 6. Overall survival (OS) validation of TCGA BRCA patients (GEPIA2). (A) SPDEF, (B) TRIM3, (C) ABCB9, (D) HSPB1, (E) RHBG, (F) SPINT1, (G) EPN3, (H) LRFN2, and (I) PRPH.
Biomedicines 10 02995 g006
Figure 7. DepMap screening of candidate genes. Red line represents the cut-off value of −0.5. CRISPR-Cas9 screening: (A) SPDEF and (B) SPINT1. RNAi screening: (C) SPDEF, (D) TRIM3, (E) ABCB9, (F) RHBG, and (G) PRPH.
Biomedicines 10 02995 g007
Table 1. Upregulated genes with overlapping expression in T and N stages.
Gene IDGene SymbolGene Namep-Value (T Stage)p-Value (N Stage)
25,803SPDEFSAM pointed domain-containing ETS transcription factor6.28 × 10−47.07 × 10⁻⁶
10,612TRIM3Tripartite motif containing 33.96 × 10−33.05 × 10−5
23,457ABCB9ATP binding cassette subfamily B member 97.00 × 10−53.35 × 10−5
3315HSPB1Heat shock protein family B (small) member 14.35 × 10−33.91 × 10−5
57,127RHBGRh family B glycoprotein6.17 × 10−49.17 × 10⁻⁵
6692SPINT1Serine peptidase inhibitor, Kunitz type 12.39 × 10−31.82 × 10−4
55,040EPN3Epsin 31.56 × 10−32.72 × 10−4
57,497LRFN2Leucine rich repeat and fibronectin type III domain-containing 24.02 × 10−34.11 × 10−4
5630PRPHPeripherin5.85 × 10−48.92 × 10⁻⁴
Table 2. Gene effect score of CRISPR (DepMap 22Q1 public + score, Chronos).
Gene SymbolCell LineSubtypeGene Effect Score
SPDEFEVSATUnknown−1.24
MDAMB361HER2−1.23
OCUBMUnknown−1.21
MDAMB453HER2−1.08
MDAMB415HER2−0.76
HCC1419HER2−0.76
AU565HER2−0.74
EFM19Luminal−0.71
CAMA1Luminal−0.68
SKBR3HER2−0.66
MFM223Luminal−0.65
HCC1428Luminal−0.63
ZR751Luminal−0.53
KPL1Luminal−0.52
SPINT1VP228Unknown−1.00
HCC1954TN−0.84
HCC1937TN−0.58
SUM149PTTN−0.53
SUM159PTTN−0.52
HCC1187TN−0.51
TN: triple negative.
Table 3. Gene effect scores of RNAi (Achilles + DRIVE + Marcotte, DEMETER2).
Gene SymbolCell LineSubtypeGene Effect ScoreCell LineSubtypeGene Effect Score
SPDEFEVSATUnknown−1.74SKBR3HER2−1.35
MDAMB330Unknown−1.07MDAMB453HER2−1.05
ZR75BUnknown−1.05MDAMB361HER2−1.03
600MPEUnknown−0.94HCC228HER2−0.94
HCC1419HER2−0.92SKBR5Unknown−0.88
SUM225CWNTN−0.88OCUMBMUnknown−0.82
UACC812Luminal−0.78ZR7530HER2−0.77
CAMA1Luminal−0.76CAL148TN−0.74
UACC893HER2−0.66BT483Luminal −0.65
BT474HER2−0.58SUM190PTTN−0.57
LY2Unknown−0.54ZR751Luminal−0.53
HCC1428Luminal−0.51EFM19Luminal−0.51
TRIM3EFM192AHER2−0.63600MPEUnknown−0.55
ABCB9EVSATUnknown−0.81
RHBGCAL851TN−0.63MACLS2Unknown−0.52
PRPHBT474HER2−1.13SUM52PELuminal−0.88
HCC3153Unknown−0.62CAL51TN−0.58
SUM225CWNTN−0.53UACC893HER2−0.51
TN: triple negative.
Publisher’s Note: MDPI stays neutral with regard to jurisdictional claims in published maps and institutional affiliations.

