
PTML Modeling for Pancreatic Cancer Research: In Silico Design of Simultaneous Multi-Protein and Multi-Cell Inhibitors


Abstract
:1. Introduction
2. Materials and Methods
2.1. Bioactivity Data and Molecular Descriptors
2.2. PTML Modeling, Applicability Domain, Descriptor Interpretation, Fragments, and Virtual Design
3. Results and Discussion
3.1. PTML-MLP Models
3.2. Physicochemical and Structural Meanings of the Molecular Descriptors
3.2.1. First PTML-MLP Model (Model 1)
3.2.2. Second PTML-MLP Model (Model 2)
3.3. Designing Multi-Protein and Multi-Cell Inhibitors as Anti-PANC Agents
4. Conclusions
Supplementary Materials
Author Contributions
Funding
Institutional Review Board Statement
Informed Consent Statement
Data Availability Statement
Conflicts of Interest
References
- Bray, F.; Ferlay, J.; Soerjomataram, I.; Siegel, R.L.; Torre, L.A.; Jemal, A. Global cancer statistics 2018: GLOBOCAN estimates of incidence and mortality worldwide for 36 cancers in 185 countries. CA Cancer J. Clin. 2018, 68, 394–424. [Google Scholar] [CrossRef] [PubMed] [Green Version]
- Chang, J.S.; Chen, L.T.; Shan, Y.S.; Chu, P.Y.; Tsai, C.R.; Tsai, H.J. The incidence and survival of pancreatic cancer by histology, including rare subtypes: A nation-wide cancer registry-based study from Taiwan. Cancer Med. 2018, 7, 5775–5788. [Google Scholar] [CrossRef] [Green Version]
- Klein, A.P. Pancreatic cancer epidemiology: Understanding the role of lifestyle and inherited risk factors. Nat. Rev. Gastroenterol. Hepatol. 2021, 18, 493–502. [Google Scholar] [CrossRef]
- Cintas, C.; Douche, T.; Therville, N.; Arcucci, S.; Ramos-Delgado, F.; Basset, C.; Thibault, B.; Guillermet-Guibert, J. Signal-Targeted Therapies and Resistance Mechanisms in Pancreatic Cancer: Future Developments Reside in Proteomics. Cancers 2018, 10, 174. [Google Scholar] [CrossRef] [PubMed] [Green Version]
- Hu, C.; LaDuca, H.; Shimelis, H.; Polley, E.C.; Lilyquist, J.; Hart, S.N.; Na, J.; Thomas, A.; Lee, K.Y.; Davis, B.T.; et al. Multigene Hereditary Cancer Panels Reveal High-Risk Pancreatic Cancer Susceptibility Genes. JCO Precis. Oncol. 2018, 2, 1–28. [Google Scholar] [CrossRef]
- Dinarello, C.A. Interleukin 1 and interleukin 18 as mediators of inflammation and the aging process. Am. J. Clin. Nutr. 2006, 83, S447–S455. [Google Scholar] [CrossRef] [PubMed] [Green Version]
- Raupach, B.; Peuschel, S.K.; Monack, D.M.; Zychlinsky, A. Caspase-1-mediated activation of interleukin-1beta (IL-1beta) and IL-18 contributes to innate immune defenses against Salmonella enterica serovar Typhimurium infection. Infect. Immun. 2006, 74, 4922–4926. [Google Scholar] [CrossRef] [Green Version]
- Yang, Z.; Cao, J.; Yu, C.; Yang, Q.; Zhang, Y.; Han, L. Caspase-1 mediated interleukin-18 activation in neutrophils promotes the activity of rheumatoid arthritis in a NLRP3 inflammasome independent manner. Jt. Bone Spine 2016, 83, 282–289. [Google Scholar] [CrossRef] [PubMed]
- Du, T.; Gao, J.; Li, P.; Wang, Y.; Qi, Q.; Liu, X.; Li, J.; Wang, C.; Du, L. Pyroptosis, metabolism, and tumor immune microenvironment. Clin. Transl. Med. 2021, 11, e492. [Google Scholar] [CrossRef]
- Xia, S.; Zhang, Z.; Magupalli, V.G.; Pablo, J.L.; Dong, Y.; Vora, S.M.; Wang, L.; Fu, T.M.; Jacobson, M.P.; Greka, A.; et al. Gasdermin D pore structure reveals preferential release of mature interleukin-1. Nature 2021, 593, 607–611. [Google Scholar] [CrossRef]
- Furuoka, M.; Ozaki, K.; Sadatomi, D.; Mamiya, S.; Yonezawa, T.; Tanimura, S.; Takeda, K. TNF-alpha Induces Caspase-1 Activation Independently of Simultaneously Induced NLRP3 in 3T3-L1 Cells. J. Cell. Physiol. 2016, 231, 2761–2767. [Google Scholar] [CrossRef] [PubMed] [Green Version]
- Xu, S.; Li, X.; Liu, Y.; Xia, Y.; Chang, R.; Zhang, C. Inflammasome inhibitors: Promising therapeutic approaches against cancer. J. Hematol. Oncol. 2019, 12, 64. [Google Scholar] [CrossRef] [Green Version]
- Daley, D.; Mani, V.R.; Mohan, N.; Akkad, N.; Pandian, G.; Savadkar, S.; Lee, K.B.; Torres-Hernandez, A.; Aykut, B.; Diskin, B.; et al. NLRP3 signaling drives macrophage-induced adaptive immune suppression in pancreatic carcinoma. J. Exp. Med. 2017, 214, 1711–1724. [Google Scholar] [CrossRef] [PubMed] [Green Version]
- Schlosser, S.; Gansauge, F.; Ramadani, M.; Beger, H.G.; Gansauge, S. Inhibition of caspase-1 induces cell death in pancreatic carcinoma cells and potentially modulates expression levels of bcl-2 family proteins. FEBS Lett. 2001, 491, 104–108. [Google Scholar] [CrossRef] [Green Version]
- Zhao, X.; Fan, W.; Xu, Z.; Chen, H.; He, Y.; Yang, G.; Yang, G.; Hu, H.; Tang, S.; Wang, P.; et al. Inhibiting tumor necrosis factor-alpha diminishes desmoplasia and inflammation to overcome chemoresistance in pancreatic ductal adenocarcinoma. Oncotarget 2016, 7, 81110–81122. [Google Scholar] [CrossRef] [Green Version]
- Polireddy, K.; Chen, Q. Cancer of the Pancreas: Molecular Pathways and Current Advancement in Treatment. J. Cancer 2016, 7, 1497–1514. [Google Scholar] [CrossRef] [Green Version]
- Subramani, R.; Lopez-Valdez, R.; Arumugam, A.; Nandy, S.; Boopalan, T.; Lakshmanaswamy, R. Targeting insulin-like growth factor 1 receptor inhibits pancreatic cancer growth and metastasis. PLoS ONE 2014, 9, e97016. [Google Scholar] [CrossRef] [PubMed] [Green Version]
- Lai, E.; Puzzoni, M.; Ziranu, P.; Pretta, A.; Impera, V.; Mariani, S.; Liscia, N.; Soro, P.; Musio, F.; Persano, M.; et al. New therapeutic targets in pancreatic cancer. Cancer Treat. Rev. 2019, 81, 101926. [Google Scholar] [CrossRef]
- Ortega-Tenezaca, B.; Quevedo-Tumailli, V.; Bediaga, H.; Collados, J.; Arrasate, S.; Madariaga, G.; Munteanu, C.R.; Cordeiro, M.; Gonzalez-Diaz, H. PTML Multi-Label Algorithms: Models, Software, and Applications. Curr. Top. Med. Chem. 2020, 20, 2326–2337. [Google Scholar] [CrossRef]
- Speck-Planche, A.; Cordeiro, M.N.D.S. Multitasking models for quantitative structure-biological effect relationships: Current status and future perspectives to speed up drug discovery. Expert Opin. Drug Discov. 2015, 10, 245–256. [Google Scholar] [CrossRef]
- Kleandrova, V.V.; Speck-Planche, A. The urgent need for pan-antiviral agents: From multitarget discovery to multiscale design. Future Med. Chem. 2021, 13, 5–8. [Google Scholar] [CrossRef] [PubMed]
- Halder, A.K.; Delgado, A.H.S.; Cordeiro, M. First multi-target QSAR model for predicting the cytotoxicity of acrylic acid-based dental monomers. Dent. Mater. 2022, 38, 333–346. [Google Scholar] [CrossRef]
- Halder, A.K.; Cordeiro, M. Multi-Target in Silico Prediction of Inhibitors for Mitogen-Activated Protein Kinase-Interacting Kinases. Biomolecules 2021, 11, 1670. [Google Scholar] [CrossRef] [PubMed]
- Bediaga, H.; Arrasate, S.; Gonzalez-Diaz, H. PTML Combinatorial Model of ChEMBL Compounds Assays for Multiple Types of Cancer. ACS Comb. Sci. 2018, 20, 621–632. [Google Scholar] [CrossRef] [PubMed]
- Kleandrova, V.V.; Scotti, M.T.; Scotti, L.; Speck-Planche, A. Multi-Target Drug Discovery Via PTML Modeling: Applications to the Design of Virtual Dual Inhibitors of CDK4 and HER2. Curr. Top. Med. Chem. 2021, 21, 661–675. [Google Scholar] [CrossRef] [PubMed]
- Speck-Planche, A. Multicellular Target QSAR Model for Simultaneous Prediction and Design of Anti-Pancreatic Cancer Agents. ACS Omega 2019, 4, 3122–3132. [Google Scholar] [CrossRef]
- Diez-Alarcia, R.; Yanez-Perez, V.; Muneta-Arrate, I.; Arrasate, S.; Lete, E.; Meana, J.J.; Gonzalez-Diaz, H. Big Data Challenges Targeting Proteins in GPCR Signaling Pathways; Combining PTML-ChEMBL Models and [(35)S] GTPgammaS Binding Assays. ACS Chem. Neurosci. 2019, 10, 4476–4491. [Google Scholar] [CrossRef]
- Kleandrova, V.V.; Speck-Planche, A. PTML Modeling for Alzheimer’s Disease: Design and Prediction of Virtual Multi-Target Inhibitors of GSK3B, HDAC1, and HDAC6. Curr. Top. Med. Chem. 2020, 20, 1657–1672. [Google Scholar] [CrossRef]
- Ferreira da Costa, J.; Silva, D.; Caamano, O.; Brea, J.M.; Loza, M.I.; Munteanu, C.R.; Pazos, A.; Garcia-Mera, X.; Gonzalez-Diaz, H. Perturbation Theory/Machine Learning Model of ChEMBL Data for Dopamine Targets: Docking, Synthesis, and Assay of New l-Prolyl-l-leucyl-glycinamide Peptidomimetics. ACS Chem. Neurosci. 2018, 9, 2572–2587. [Google Scholar] [CrossRef]
- Abeijon, P.; Garcia-Mera, X.; Caamano, O.; Yanez, M.; Lopez-Castro, E.; Romero-Duran, F.J.; Gonzalez-Diaz, H. Multi-Target Mining of Alzheimer Disease Proteome with Hansch’s QSBR-Perturbation Theory and Experimental-Theoretic Study of New Thiophene Isosters of Rasagiline. Curr. Drug Targets 2017, 18, 511–521. [Google Scholar] [CrossRef]
- Martinez-Arzate, S.G.; Tenorio-Borroto, E.; Barbabosa Pliego, A.; Diaz-Albiter, H.M.; Vazquez-Chagoyan, J.C.; Gonzalez-Diaz, H. PTML Model for Proteome Mining of B-Cell Epitopes and Theoretical-Experimental Study of Bm86 Protein Sequences from Colima, Mexico. J. Proteome Res. 2017, 16, 4093–4103. [Google Scholar] [CrossRef]
- Tenorio-Borroto, E.; Penuelas-Rivas, C.G.; Vasquez-Chagoyan, J.C.; Castanedo, N.; Prado-Prado, F.J.; Garcia-Mera, X.; Gonzalez-Diaz, H. Model for high-throughput screening of drug immunotoxicity—Study of the anti-microbial G1 over peritoneal macrophages using flow cytometry. Eur. J. Med. Chem. 2014, 72, 206–220. [Google Scholar] [CrossRef] [PubMed]
- Vasquez-Dominguez, E.; Armijos-Jaramillo, V.D.; Tejera, E.; Gonzalez-Diaz, H. Multioutput Perturbation-Theory Machine Learning (PTML) Model of ChEMBL Data for Antiretroviral Compounds. Mol. Pharm. 2019, 16, 4200–4212. [Google Scholar] [CrossRef] [PubMed]
- Nocedo-Mena, D.; Cornelio, C.; Camacho-Corona, M.D.R.; Garza-Gonzalez, E.; Waksman de Torres, N.; Arrasate, S.; Sotomayor, N.; Lete, E.; Gonzalez-Diaz, H. Modeling Antibacterial Activity with Machine Learning and Fusion of Chemical Structure Information with Microorganism Metabolic Networks. J. Chem. Inf. Model. 2019, 59, 1109–1120. [Google Scholar] [CrossRef] [PubMed]
- Speck-Planche, A.; Kleandrova, V.V.; Ruso, J.M.; Cordeiro, M.N.D.S. First multitarget chemo-bioinformatic model to enable the discovery of antibacterial peptides against multiple Gram-positive pathogens. J. Chem. Inf. Model. 2016, 56, 588–598. [Google Scholar] [CrossRef]
- Speck-Planche, A.; Cordeiro, M.N.D.S. Chemoinformatics for medicinal chemistry: In silico model to enable the discovery of potent and safer anti-cocci agents. Future Med. Chem. 2014, 6, 2013–2028. [Google Scholar] [CrossRef]
- Kleandrova, V.V.; Scotti, M.T.; Speck-Planche, A. Computational Drug Repurposing for Antituberculosis Therapy: Discovery of Multi-Strain Inhibitors. Antibiotics 2021, 10, 1005. [Google Scholar] [CrossRef]
- Herrera-Ibata, D.M.; Pazos, A.; Orbegozo-Medina, R.A.; Romero-Duran, F.J.; Gonzalez-Diaz, H. Mapping chemical structure-activity information of HAART-drug cocktails over complex networks of AIDS epidemiology and socioeconomic data of U.S. counties. Biosystems 2015, 132, 20–34. [Google Scholar] [CrossRef]
- Santana, R.; Zuluaga, R.; Ganan, P.; Arrasate, S.; Onieva, E.; Gonzalez-Diaz, H. Predicting coated-nanoparticle drug release systems with perturbation-theory machine learning (PTML) models. Nanoscale 2020, 12, 13471–13483. [Google Scholar] [CrossRef]
- Speck-Planche, A.; Kleandrova, V.V. Chapter 16 Demystifying Artificial Neural Networks as Generators of New Chemical Knowledge: Antimalarial Drug Discovery as a Case Study. In Machine Learning in Chemistry: The Impact of Artificial Intelligence; The Royal Society of Chemistry: London, UK, 2020; pp. 398–423. [Google Scholar]
- Mendez, D.; Gaulton, A.; Bento, A.P.; Chambers, J.; De Veij, M.; Felix, E.; Magarinos, M.P.; Mosquera, J.F.; Mutowo, P.; Nowotka, M.; et al. ChEMBL: Towards direct deposition of bioassay data. Nucleic Acids Res. 2019, 47, D930–D940. [Google Scholar] [CrossRef]
- Yang, W.; Soares, J.; Greninger, P.; Edelman, E.J.; Lightfoot, H.; Forbes, S.; Bindal, N.; Beare, D.; Smith, J.A.; Thompson, I.R.; et al. Genomics of Drug Sensitivity in Cancer (GDSC): A resource for therapeutic biomarker discovery in cancer cells. Nucleic Acids Res. 2013, 41, D955–D961. [Google Scholar] [CrossRef] [Green Version]
- Attene-Ramos, M.S.; Austin, C.P.; Xia, M. High Throughput Screening. In Encyclopedia of Toxicology (Third Edition); Wexler, P., Ed.; Academic Press Elsevier: Cambridge, MA, USA, 2014; pp. 916–917. [Google Scholar]
- Estrada, E. Spectral moments of the edge adjacency matrix in molecular graphs. 1. Definition and applications for the prediction of physical properties of alkanes. J. Chem. Inf. Comput. Sci. 1996, 36, 844–849. [Google Scholar] [CrossRef]
- Estrada, E. Spectral moments of the edge adjacency matrix in molecular graphs. 2. Molecules containing heteroatoms and QSAR applications. J. Chem. Inf. Comput. Sci. 1997, 37, 320–328. [Google Scholar] [CrossRef]
- Estrada, E. Spectral moments of the edge adjacency matrix in molecular graphs. 3. Molecules containing cycles. J. Chem. Inf. Comput. Sci. 1998, 38, 23–27. [Google Scholar] [CrossRef]
- Randić, M. Characterization of molecular branching. J. Am. Chem. Soc. 1975, 97, 6609–6615. [Google Scholar] [CrossRef]
- Kier, L.B.; Hall, L.H. Molecular Connectivity in Structure-Activity Analysis; John Wiley & Sons: Hoboken, NJ, USA, 1986. [Google Scholar]
- Kier, L.B.; Hall, L.H. Derivation and significance of valence molecular connectivity. J. Pharm. Sci. 1981, 70, 583–589. [Google Scholar] [CrossRef] [PubMed]
- Estrada, E. Edge adjacency relationship and a novel topological index related to molecular volume. J. Chem. Inf. Comput. Sci. 1995, 35, 31–33. [Google Scholar] [CrossRef]
- Estrada, E.; Gutiérrez, Y. MODESLAB, v1.5; Estrada’s Laboratory: Santiago de Compostela, Spain, 2002–2004. [Google Scholar]
- Garcia, I.; Fall, Y.; Gomez, G. Using topological indices to predict anti-Alzheimer and anti-parasitic GSK-3 inhibitors by multi-target QSAR in silico screening. Molecules 2010, 15, 5408–5422. [Google Scholar] [CrossRef]
- O'Boyle, N.M.; Banck, M.; James, C.A.; Morley, C.; Vandermeersch, T.; Hutchison, G.R. Open Babel: An open chemical toolbox. J. Cheminformatics 2011, 3, 33. [Google Scholar] [CrossRef] [Green Version]
- Medina Marrero, R.; Marrero-Ponce, Y.; Barigye, S.J.; Echeverria Diaz, Y.; Acevedo-Barrios, R.; Casanola-Martin, G.M.; Garcia Bernal, M.; Torrens, F.; Perez-Gimenez, F. QuBiLs-MAS method in early drug discovery and rational drug identification of antifungal agents. SAR QSAR Environ. Res. 2015, 26, 943–958. [Google Scholar] [CrossRef]
- Valdes-Martini, J.R.; Marrero-Ponce, Y.; Garcia-Jacas, C.R.; Martinez-Mayorga, K.; Barigye, S.J.; Vaz d'Almeida, Y.S.; Pham-The, H.; Perez-Gimenez, F.; Morell, C.A. QuBiLS-MAS, open source multi-platform software for atom- and bond-based topological (2D) and chiral (2.5D) algebraic molecular descriptors computations. J. Cheminformatics 2017, 9, 35. [Google Scholar] [CrossRef] [PubMed]
- Marrero-Ponce, Y.; Siverio-Mota, D.; Galvez-Llompart, M.; Recio, M.C.; Giner, R.M.; Garcia-Domenech, R.; Torrens, F.; Aran, V.J.; Cordero-Maldonado, M.L.; Esguera, C.V.; et al. Discovery of novel anti-inflammatory drug-like compounds by aligning in silico and in vivo screening: The nitroindazolinone chemotype. Eur. J. Med. Chem. 2011, 46, 5736–5753. [Google Scholar] [CrossRef] [PubMed]
- Sampaio-Dias, I.E.; Rodriguez-Borges, J.E.; Yanez-Perez, V.; Arrasate, S.; Llorente, J.; Brea, J.M.; Bediaga, H.; Vina, D.; Loza, M.I.; Caamano, O.; et al. Synthesis, Pharmacological, and Biological Evaluation of 2-Furoyl-Based MIF-1 Peptidomimetics and the Development of a General-Purpose Model for Allosteric Modulators (ALLOPTML). ACS Chem. Neurosci. 2021, 12, 203–215. [Google Scholar] [CrossRef] [PubMed]
- Santana, R.; Zuluaga, R.; Ganan, P.; Arrasate, S.; Onieva Caracuel, E.; Gonzalez-Diaz, H. PTML Model of ChEMBL Compounds Assays for Vitamin Derivatives. ACS Comb. Sci. 2020, 22, 129–141. [Google Scholar] [CrossRef] [PubMed]
- Tenorio-Borroto, E.; Castanedo, N.; Garcia-Mera, X.; Rivadeneira, K.; Vazquez Chagoyan, J.C.; Barbabosa Pliego, A.; Munteanu, C.R.; Gonzalez-Diaz, H. Perturbation Theory Machine Learning Modeling of Immunotoxicity for Drugs Targeting Inflammatory Cytokines and Study of the Antimicrobial G1 Using Cytometric Bead Arrays. Chem. Res. Toxicol. 2019, 32, 1811–1823. [Google Scholar] [CrossRef]
- Ortega-Tenezaca, B.; Gonzalez-Diaz, H. IFPTML mapping of nanoparticle antibacterial activity vs. pathogen metabolic networks. Nanoscale 2021, 13, 1318–1330. [Google Scholar] [CrossRef]
- Urista, D.V.; Carrue, D.B.; Otero, I.; Arrasate, S.; Quevedo-Tumailli, V.F.; Gestal, M.; Gonzalez-Diaz, H.; Munteanu, C.R. Prediction of Antimalarial Drug-Decorated Nanoparticle Delivery Systems with Random Forest Models. Biology 2020, 9, 198. [Google Scholar] [CrossRef]
- Romero-Duran, F.J.; Alonso, N.; Yanez, M.; Caamano, O.; Garcia-Mera, X.; Gonzalez-Diaz, H. Brain-inspired cheminformatics of drug-target brain interactome, synthesis, and assay of TVP1022 derivatives. Neuropharmacology 2016, 103, 270–278. [Google Scholar] [CrossRef]
- Speck-Planche, A.; Kleandrova, V.V.; Scotti, M.T. In Silico Drug Repurposing for Anti-Inflammatory Therapy: Virtual Search for Dual Inhibitors of Caspase-1 and TNF-Alpha. Biomolecules 2021, 11, 1832. [Google Scholar] [CrossRef]
- Urias, R.W.; Barigye, S.J.; Marrero-Ponce, Y.; Garcia-Jacas, C.R.; Valdes-Martini, J.R.; Perez-Gimenez, F. IMMAN: Free software for information theory-based chemometric analysis. Mol. Divers. 2015, 19, 305–319. [Google Scholar] [CrossRef]
- Pearson, K. Notes on regression and inheritance in the case of two parents. Proc. R. Soc. Lond. 1895, 58, 240–242. [Google Scholar] [CrossRef]
- TIBCO-Software-Inc. STATISTICA (Data Analysis Software System), v13.5.0.17; TIBCO-Software-Inc: Palo Alto, CA, USA, 2018. [Google Scholar]
- Kleandrova, V.V.; Scotti, L.; Bezerra Mendonça Junior, F.J.; Muratov, E.; Scotti, M.T.; Speck-Planche, A. QSAR Modeling for Multi-Target Drug Discovery: Designing Simultaneous Inhibitors of Proteins in Diverse Pathogenic Parasites. Front. Chem. 2021, 9, 634663. [Google Scholar] [CrossRef]
- Speck-Planche, A.; Scotti, M.T. BET bromodomain inhibitors: Fragment-based in silico design using multi-target QSAR models. Mol. Divers. 2019, 23, 555–572. [Google Scholar] [CrossRef] [PubMed]
- Speck-Planche, A.; Cordeiro, M.N.D.S. Speeding up Early Drug Discovery in Antiviral Research: A Fragment-Based in Silico Approach for the Design of Virtual Anti-Hepatitis C Leads. ACS Comb. Sci. 2017, 19, 501–512. [Google Scholar] [CrossRef] [PubMed]
- Wassermann, A.M.; Nisius, B.; Vogt, M.; Bajorath, J. Identification of descriptors capturing compound class-specific features by mutual information analysis. J. Chem. Inf. Model. 2010, 50, 1935–1940. [Google Scholar] [CrossRef] [PubMed]
- Kullback, S.; Leibler, R.A. On Information and Sufficiency. Ann. Math. Stat. 1951, 22, 79–86. [Google Scholar] [CrossRef]
- Jeffreys, H. An invariant form for the prior probability in estimation problems. Proc. R. Soc. Lond. A Math. Phys. Sci. 1946, 186, 453–461. [Google Scholar] [CrossRef] [Green Version]
- Matthews, B.W. Comparison of the predicted and observed secondary structure of T4 phage lysozyme. Biochim. Biophys. Acta 1975, 405, 442–451. [Google Scholar] [CrossRef]
- Santana, R.; Zuluaga, R.; Ganan, P.; Arrasate, S.; Onieva, E.; Montemore, M.M.; Gonzalez-Diaz, H. PTML Model for Selection of Nanoparticles, Anticancer Drugs, and Vitamins in the Design of Drug-Vitamin Nanoparticle Release Systems for Cancer Cotherapy. Mol. Pharm. 2020, 17, 2612–2627. [Google Scholar] [CrossRef]
- Cabrera-Andrade, A.; Lopez-Cortes, A.; Jaramillo-Koupermann, G.; Gonzalez-Diaz, H.; Pazos, A.; Munteanu, C.R.; Perez-Castillo, Y.; Tejera, E. A Multi-Objective Approach for Anti-Osteosarcoma Cancer Agents Discovery through Drug Repurposing. Pharmaceuticals 2020, 13, 409. [Google Scholar] [CrossRef]
- Santana, R.; Zuluaga, R.; Ganan, P.; Arrasate, S.; Onieva, E.; Gonzalez-Diaz, H. Designing nanoparticle release systems for drug-vitamin cancer co-therapy with multiplicative perturbation-theory machine learning (PTML) models. Nanoscale 2019, 11, 21811–21823. [Google Scholar] [CrossRef]
- Casanola-Martin, G.M.; Le-Thi-Thu, H.; Perez-Gimenez, F.; Marrero-Ponce, Y.; Merino-Sanjuan, M.; Abad, C.; Gonzalez-Diaz, H. Multi-output model with Box-Jenkins operators of linear indices to predict multi-target inhibitors of ubiquitin-proteasome pathway. Mol. Divers. 2015, 19, 347–356. [Google Scholar] [CrossRef] [PubMed]
- Marzaro, G.; Chilin, A.; Guiotto, A.; Uriarte, E.; Brun, P.; Castagliuolo, I.; Tonus, F.; Gonzalez-Diaz, H. Using the TOPS-MODE approach to fit multi-target QSAR models for tyrosine kinases inhibitors. Eur. J. Med. Chem. 2011, 46, 2185–2192. [Google Scholar] [CrossRef] [PubMed]
- Munteanu, C.R.; Magalhaes, A.L.; Uriarte, E.; Gonzalez-Diaz, H. Multi-target QPDR classification model for human breast and colon cancer-related proteins using star graph topological indices. J. Theor. Biol. 2009, 257, 303–311. [Google Scholar] [CrossRef]
- Speck-Planche, A. Combining Ensemble Learning with a Fragment-Based Topological Approach to Generate New Molecular Diversity in Drug Discovery: In Silico Design of Hsp90 Inhibitors. ACS Omega 2018, 3, 14704–14716. [Google Scholar] [CrossRef] [PubMed]
- Estrada, E. How the parts organize in the whole? A top-down view of molecular descriptors and properties for QSAR and drug design. Mini Rev. Med. Chem. 2008, 8, 213–221. [Google Scholar] [CrossRef] [PubMed] [Green Version]
- Estrada, E.; Patlewicz, G.; Gutierrez, Y. From knowledge generation to knowledge archive. A general strategy using TOPS-MODE with DEREK to formulate new alerts for skin sensitization. J. Chem. Inf. Comput. Sci. 2004, 44, 688–698. [Google Scholar] [CrossRef]
- Estrada, E.; Molina, E. Automatic extraction of structural alerts for predicting chromosome aberrations of organic compounds. J. Mol. Graph. Model. 2006, 25, 275–288. [Google Scholar] [CrossRef]
- Ghose, A.K.; Crippen, G.M. Atomic physicochemical parameters for three-dimensional-structure-directed quantitative structure-activity relationships. 2. Modeling dispersive and hydrophobic interactions. J. Chem. Inf. Comput. Sci. 1987, 27, 21–35. [Google Scholar] [CrossRef]
- Estrada, E. Physicochemical Interpretation of Molecular Connectivity Indices. J. Phys. Chem. A 2002, 106, 9085–9091. [Google Scholar] [CrossRef]
- Randić, M.; Zupan, J. On interpretation of well-known topological indices. J. Chem. Inf. Comput. Sci. 2001, 41, 550–560. [Google Scholar] [CrossRef] [PubMed]
- Estrada, E. Edge adjacency relationships in molecular graphs containing heteroatoms: A new topological index related to molar volume. J. Chem. Inf. Comput. Sci. 1995, 35, 701–707. [Google Scholar] [CrossRef]
- Estrada, E.; Rodríguez, L. Edge-Connectivity Indices in QSPR/QSAR Studies. 1. Comparison to Other Topological Indices in QSPR Studies. J. Chem. Inf. Comput. Sci. 1999, 39, 1037–1041. [Google Scholar] [CrossRef]
- Matsson, P.; Kihlberg, J. How Big Is Too Big for Cell Permeability? J. Med. Chem. 2017, 60, 1662–1664. [Google Scholar] [CrossRef] [PubMed] [Green Version]
- Marrero-Ponce, Y.; Medina-Marrero, R.; Torrens, F.; Martinez, Y.; Romero-Zaldivar, V.; Castro, E.A. Atom, atom-type, and total nonstochastic and stochastic quadratic fingerprints: A promising approach for modeling of antibacterial activity. Bioorg. Med. Chem. 2005, 13, 2881–2899. [Google Scholar] [CrossRef]
- Ghose, A.K.; Viswanadhan, V.N.; Wendoloski, J.J. Prediction of Hydrophobic (Lipophilic) Properties of Small Organic Molecules Using Fragmental Methods: An Analysis of ALOGP and CLOGP Methods. J. Phys. Chem. A 1998, 102, 3762–3772. [Google Scholar] [CrossRef]
- Kleandrova, V.V.; Scotti, M.T.; Scotti, L.; Nayarisseri, A.; Speck-Planche, A. Cell-based multi-target QSAR model for design of virtual versatile inhibitors of liver cancer cell lines. SAR QSAR Environ. Res. 2020, 31, 815–836. [Google Scholar] [CrossRef]
- Gaulton, A.; Bellis, L.J.; Bento, A.P.; Chambers, J.; Davies, M.; Hersey, A.; Light, Y.; McGlinchey, S.; Michalovich, D.; Al-Lazikani, B.; et al. ChEMBL: A large-scale bioactivity database for drug discovery. Nucleic Acids Res. 2012, 40, D1100–D1107. [Google Scholar] [CrossRef] [Green Version]
- Irwin, J.J.; Shoichet, B.K. ZINC—A free database of commercially available compounds for virtual screening. J. Chem. Inf. Model. 2005, 45, 177–182. [Google Scholar] [CrossRef] [Green Version]
- Gubernator, K.; James, C.A.; Gubernator, N. eMolecules. Available online: https://www.emolecules.com/ (accessed on 20 January 2022).
- Lipinski, C.A.; Lombardo, F.; Dominy, B.W.; Feeney, P.J. Experimental and computational approaches to estimate solubility and permeability in drug discovery and development settings. Adv. Drug Deliv. Rev. 2001, 46, 3–26. [Google Scholar] [CrossRef]
- Ghose, A.K.; Viswanadhan, V.N.; Wendoloski, J.J. A knowledge-based approach in designing combinatorial or medicinal chemistry libraries for drug discovery. 1. A qualitative and quantitative characterization of known drug databases. J. Comb. Chem. 1999, 1, 55–68. [Google Scholar] [CrossRef] [PubMed]
- Veber, D.F.; Johnson, S.R.; Cheng, H.Y.; Smith, B.R.; Ward, K.W.; Kopple, K.D. Molecular properties that influence the oral bioavailability of drug candidates. J. Med. Chem. 2002, 45, 2615–2623. [Google Scholar] [CrossRef] [PubMed]


| maa | Cutoff b | tgc | eid |
|---|---|---|---|
| IC50 (nM)p | ≤1100 nM | Caspase-1 | B (assay format) |
| Caspase-1 | B (single protein format) | ||
| Caspase-1 | B (cell-based format) | ||
| ≤1635 nM | TNF-alpha | B (single protein format) | |
| TNF-alpha | F (assay format) | ||
| TNF-alpha | B (assay format) | ||
| TNF-alpha | B (cell-based format) | ||
| TNF-alpha | F (cell-based format) | ||
| ≤50 nM | IGF1R | B (single protein format) | |
| IGF1R | B (cell-based format) | ||
| IGF1R | B (assay format) | ||
| IGF1R | F (cell-based format) | ||
| IGF1R | F (assay format) | ||
| IC50 (nM)c | ≤6449.735 nM | PSN1 | F (cell-based format) |
| PANC-03-27 | F (cell-based format) | ||
| HPAC | F (cell-based format) | ||
| MZ1-PC | F (cell-based format) | ||
| KP-4 | F (cell-based format) | ||
| KP-2 | F (cell-based format) | ||
| PA-TU-8988T | F (cell-based format) | ||
| Capan-2 | F (cell-based format) | ||
| MIA-PaCa-2 | F (cell-based format) | ||
| CFPAC-1 | F (cell-based format) | ||
| PANC-10-05 | F (cell-based format) | ||
| BxPC-3 | F (cell-based format) | ||
| SUIT-2 | F (cell-based format) | ||
| KP-1N | F (cell-based format) | ||
| HuP-T4 | F (cell-based format) | ||
| SW1990 | F (cell-based format) | ||
| PL18 | F (cell-based format) | ||
| QGP-1 | F (cell-based format) | ||
| HuP-T3 | F (cell-based format) | ||
| SU8686 | F (cell-based format) | ||
| PL4 | F (cell-based format) | ||
| PA-TU-8902 | F (cell-based format) | ||
| PANC-02-03 | F (cell-based format) | ||
| DAN-G | F (cell-based format) | ||
| CAPAN-1 | F (cell-based format) | ||
| PANC-08-13 | F (cell-based format) | ||
| HPAF-II | F (cell-based format) | ||
| KP-3 | F (cell-based format) | ||
| YAPC | F (cell-based format) | ||
| AsPC-1 | F (cell-based format) | ||
| PANC-04-03 | F (cell-based format) |
| Model a | Symbology b | Code c | Concept |
|---|---|---|---|
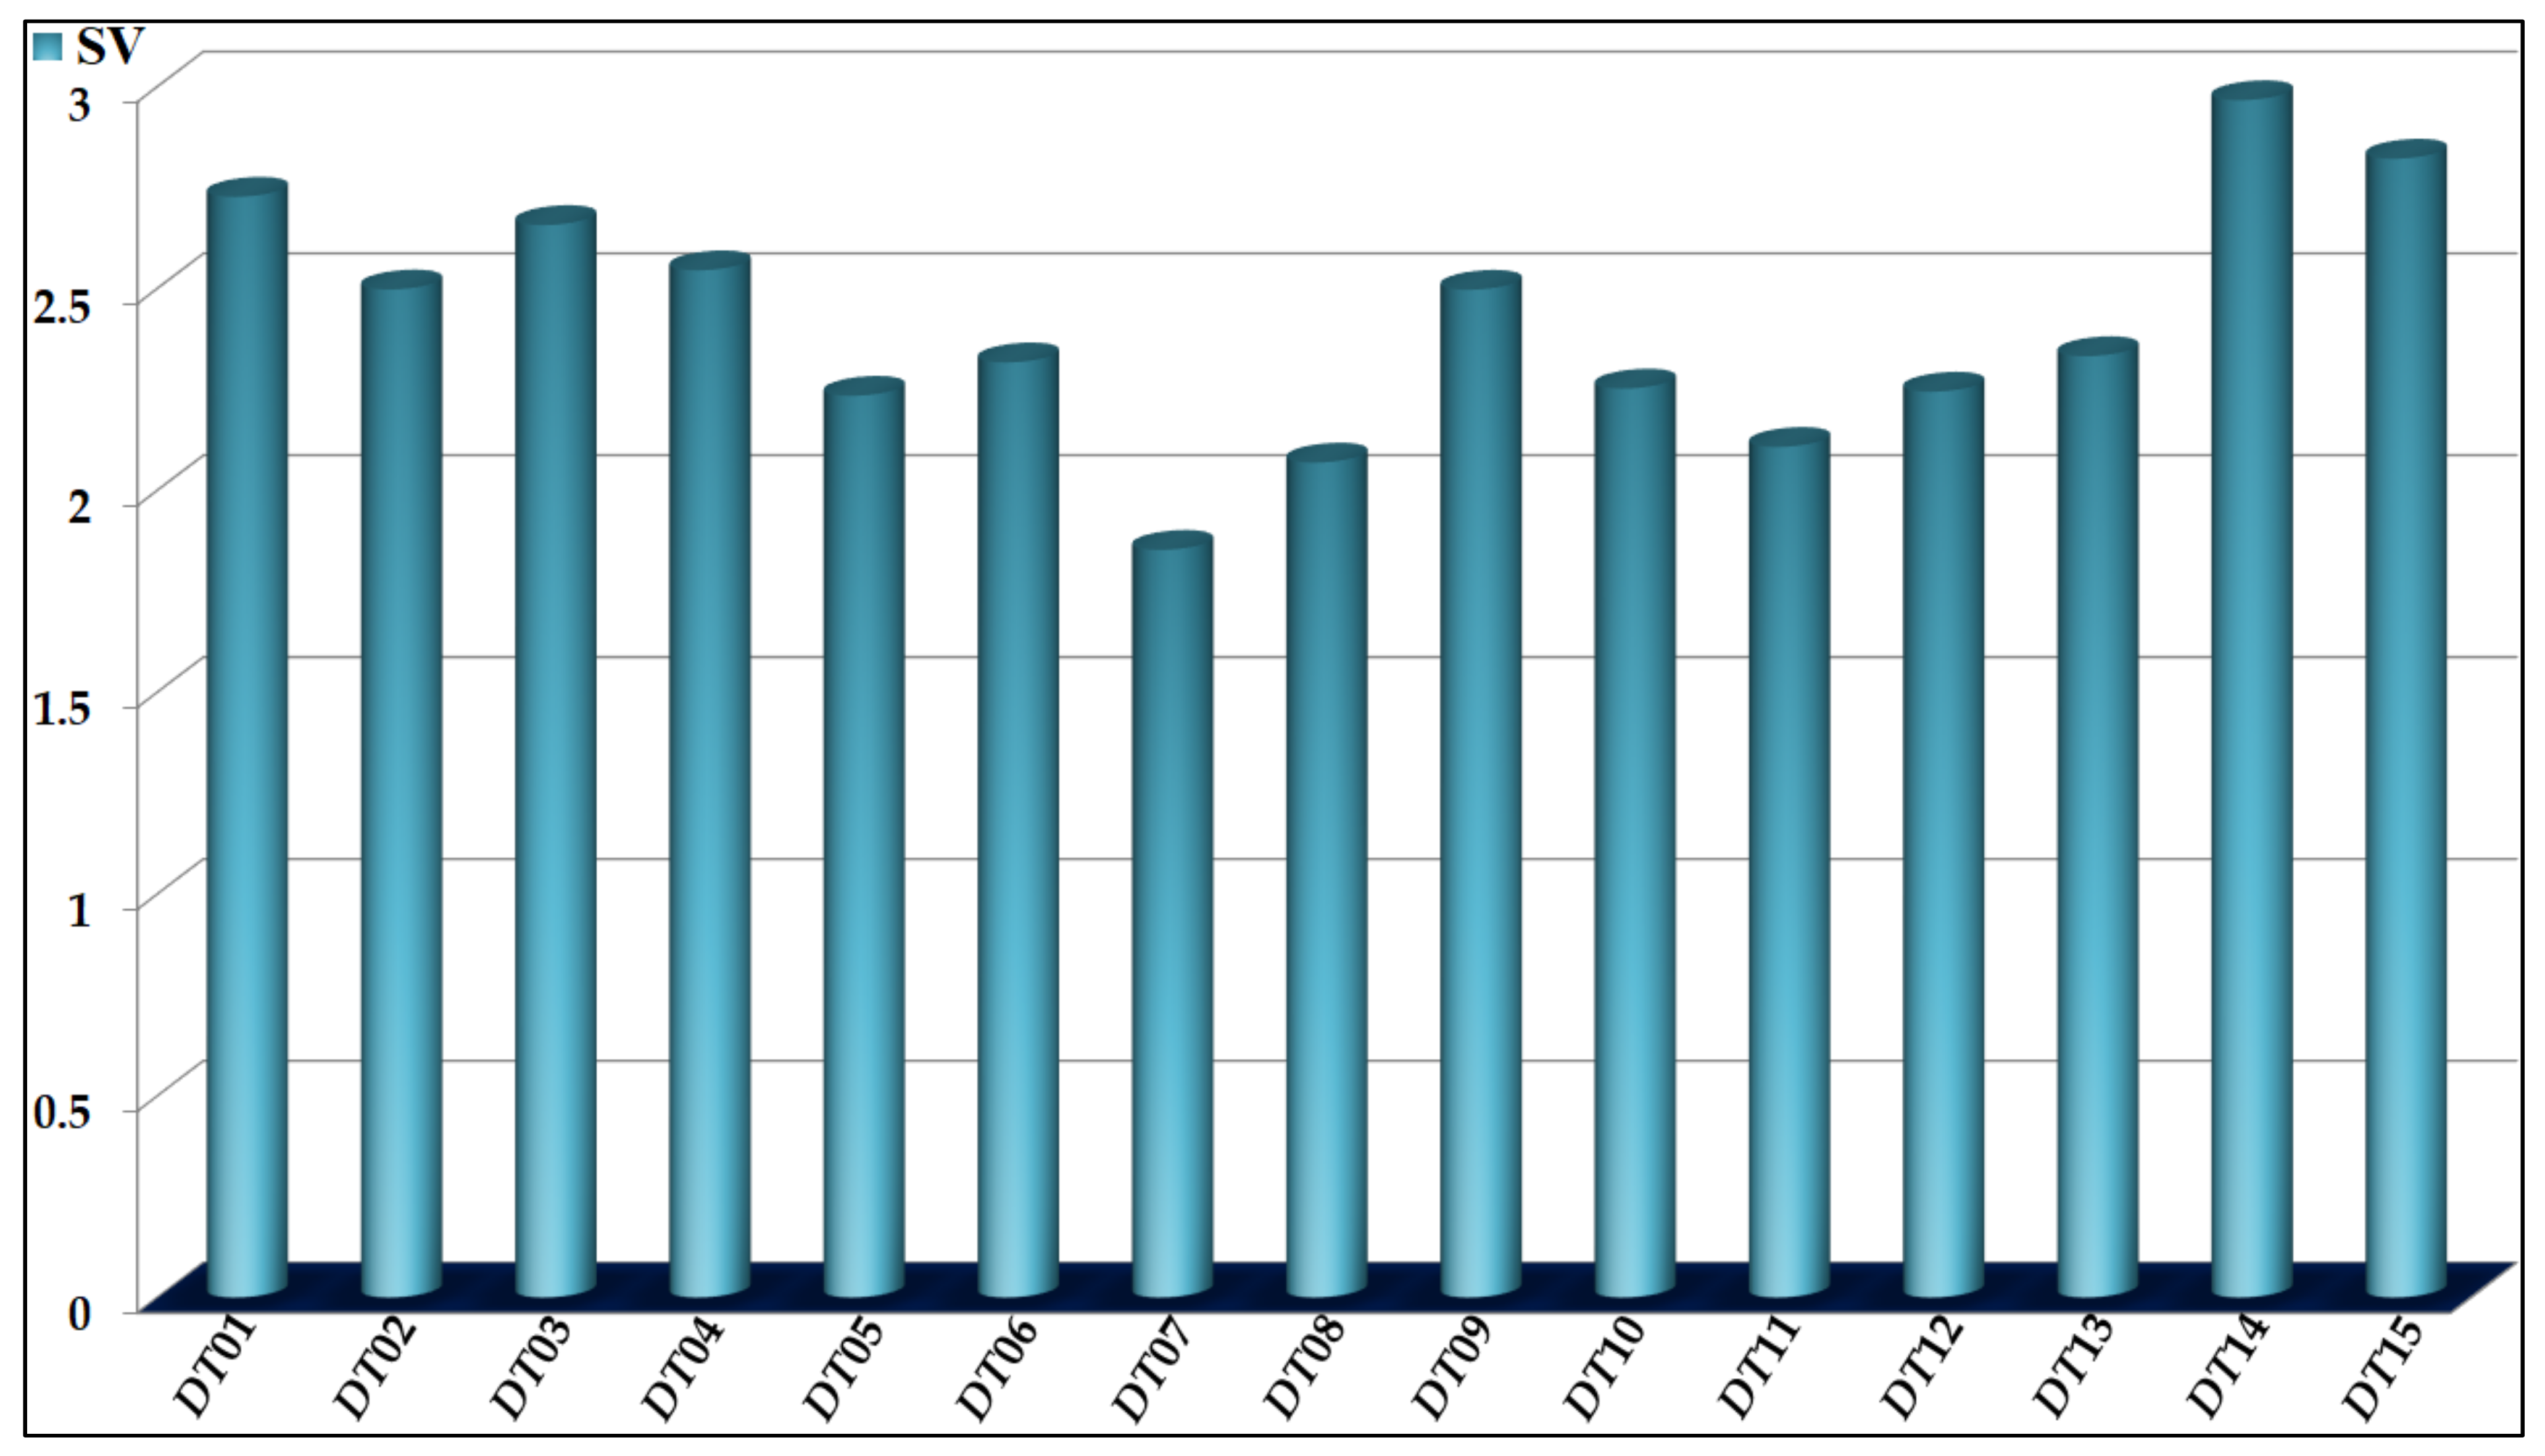
| Model 1 | D(NSM(Hyd)3)ma | DT01 | Deviation of the normalized spectral moment of order 3 based on hydrophobicity-weighted bonds. |
| D(NXv(P)4)ma | DT02 | Deviation of the normalized Kier–Hall (valence) connectivity index involving only path-based subgraphs of order 4. | |
| D(Ne(P)1)ma | DT03 | Deviation of the normalized edge (bond) connectivity index involving only path-based subgraphs of order 1. | |
| D(Ne(P)2)ma | DT04 | Deviation of the normalized edge (bond) connectivity index involving only path-based subgraphs of order 2. | |
| D(Ne(Ch)6)ma | DT05 | Deviation of the normalized edge (bond) connectivity index involving only chain-based subgraphs of order 6. | |
| D(SM(Hyd)7)tg | DT06 | Deviation of the spectral moment of order 7 based on hydrophobicity-weighted bonds. | |
| D(e(Ch)5)tg | DT07 | Deviation of the edge (bond) connectivity index involving only chain-based subgraphs of order 5. | |
| D(NSM(Psa)1)tg | DT08 | Deviation of the normalized spectral moment of order 1 based on bonds weighted by the polar surface area. | |
| D(NSM(Gas)3)tg | DT09 | Deviation of the normalized spectral moment of order 3 based on bonds weighted by the Gasteiger–Marsili charges. | |
| D(NXv(P)1)tg | DT10 | Deviation of the normalized Kier-Hall (valence) connectivity index involving only path-based subgraphs of order 1. | |
| D(Xv(Ch)6)ei | DT11 | Deviation of the Kier-Hall (valence) connectivity index involving only chain-based subgraphs of order 6. | |
| D(NSM(Hyd)1)ei | DT12 | Deviation of the normalized spectral moment of order 1 based on hydrophobicity-weighted bonds. | |
| D(NSM(Mol)1)ei | DT13 | Deviation of the normalized spectral moment of order 1 based on bonds weighted by the molar refractivity. | |
| D(Ne(P)5)ei | DT14 | Deviation of the normalized edge (bond) connectivity index involving only path-based subgraphs of order 5. | |
| D(Ne(PC)6)ei | DT15 | Deviation of the normalized edge (bond) connectivity index involving only path-cluster subgraphs of order 6. | |
| Model 2 | D(ASq4(Hyd)G)ma | DQ01 | Deviation of the stochastic atom-based local quadratic index weighted by the hydrophobicity of the halogens and their neighbor atoms located at the topological distance of 4. |
| D(ASq3(Hyd)Y)ma | DQ02 | Deviation of the stochastic atom-based local quadratic index weighted by the hydrophobicity of the heteroatoms (N, O, S, P, and Se) and their neighbor atoms located at the topological distance of 3. | |
| D(ASq4(Hyd)Y)ma | DQ03 | Deviation of the stochastic atom-based local quadratic index weighted by the hydrophobicity of the heteroatoms (N, O, S, P, and Se) and their neighbor atoms located at the topological distance of 4. | |
| D(ASq2(E)Y)ma | DQ04 | Deviation of the stochastic atom-based local quadratic index weighted by the electronegativity of the heteroatoms (N, O, S, P, and Se) and their neighbor atoms located at the topological distance of 2. | |
| D(ASq1(Psa)Y)ma | DQ05 | Deviation of the stochastic atom-based local quadratic index weighted by the polar surface area of the heteroatoms (N, O, S, P, and Se) and their neighbor atoms located at the topological distance of 1. | |
| D(ASq1(Aw)C)tg | DQ06 | Deviation of the stochastic atom-based local quadratic index weighted by the atomic weight of the aliphatic carbons and their neighbor atoms located at the topological distance of 1. | |
| D(ASq0(Ku)G)tg | DQ07 | Deviation of the stochastic atom-based local quadratic index (order 0) weighted by the Kupchik’s vertex degree of the halogens in a molecule. | |
| D(ASq4(Psa)Y)tg | DQ08 | Deviation of the stochastic atom-based local quadratic index weighted by the polar surface area of the heteroatoms (N, O, S, P, and Se) and their neighbor atoms located at the topological distance of 4. | |
| D(ASq1(Hyd)G)ei | DQ09 | Deviation of the stochastic atom-based local quadratic index weighted by the hydrophobicity of the halogens and their neighbor atoms located at the topological distance of 1. | |
| D(ASq2(Hyd)G)ei | DQ10 | Deviation of the stochastic atom-based local quadratic index weighted by the hydrophobicity of the halogens and their neighbor atoms located at the topological distance of 2. | |
| D(ASq2(Aw)G)ei | DQ11 | Deviation of the stochastic atom-based local quadratic index weighted by the atomic weight of the halogens and their neighbor atoms located at the topological distance of 2. | |
| D(ASq1(Hyd)M)ei | DQ12 | Deviation of the stochastic atom-based local quadratic index weighted by the hydrophobicity of the aliphatic carbons (only methyl groups) and their neighbor atoms located at the topological distance of 1. | |
| D(ASq1(Ku)M)ei | DQ13 | Deviation of the stochastic atom-based local quadratic index weighted by the Kupchik’s vertex degree of the aliphatic carbons (only methyl groups) and their neighbor atoms located at the topological distance of 1. | |
| D(ASq0(Hyd)Y)ei | DQ14 | Deviation of the stochastic atom-based local quadratic index (order 0) weighted by the hydrophobicity heteroatoms (N, O, S, P, and Se) in a molecule. |
| SYMBOLS a,b | Model 1 | Model 2 | ||
|---|---|---|---|---|
| Training Set | Test Set | Training Set | Test Set | |
| NActive | 3010 | 1001 | 3010 | 1001 |
| CCCActive | 2495 (1293) | 799 (447) | 2486 (1084) | 785 (352) |
| Sn(%) | 82.89% (42.96%) | 79.82% (44.66%) | 82.59% (36.01%) | 78.42% (35.16%) |
| NInactive | 4273 | 1421 | 4273 | 1421 |
| CCCInactive | 3817 (3693) | 1207 (1219) | 3813 (3625) | 1195 (1194) |
| Sp(%) | 89.33% (86.43%) | 84.94% (85.78%) | 89.23% (84.84%) | 84.10% (84.03%) |
| MCC | 0.724 (0.331) | 0.646 (0.338) | 0.721 (0.241) | 0.624 (0.222) |
| Codes a | Descriptors | CLASS-BASED MEANS b | Propensity c | |
|---|---|---|---|---|
| Active | Inactive | |||
| DTI01 | D(NSM(Hyd)3)ma | −2.3485 × 10⁻² | 1.0631 × 10⁻¹ | Decrease |
| DTI02 | D(NXv(P)4)ma | 6.6912 × 10⁻³ | 5.5922 × 10⁻³ | Increase |
| DTI03 | D(Ne(P)1)ma | −3.2309 × 10⁻⁴ | 8.6125 × 10⁻² | Decrease |
| DTI04 | D(Ne(P)2)ma | −4.7514 × 10⁻² | 1.4992 × 10⁻¹ | Decrease |
| DTI05 | D(Ne(Ch)6)ma | −4.1335 × 10⁻² | 1.7654 × 10⁻¹ | Decrease |
| DTI06 | D(SM(Hyd)7)tg | 3.1706 × 10⁻² | −2.5668 × 10⁻¹ | Increase |
| DTI07 | D(e(Ch)5)tg | 5.2858 × 10⁻³ | −4.9427 × 10⁻² | Increase |
| DTI08 | D(NSM(Psa)1)tg | 2.2379 × 10⁻² | −1.9481 × 10⁻² | Increase |
| DTI09 | D(NSM(Gas)3)tg | 2.8122 × 10⁻² | −1.3897 × 10⁻¹ | Increase |
| DTI10 | D(NXv(P)1)tg | −1.2919 × 10⁻² | 1.1367 × 10⁻¹ | Decrease |
| DTI11 | D(Xv(Ch)6)ei | −4.9125 × 10⁻³ | −7.1198 × 10⁻² | Increase |
| DTI12 | D(NSM(Hyd)1)ei | −5.5366 × 10⁻² | 2.3959 × 10⁻¹ | Decrease |
| DTI13 | D(NSM(Mol)1)ei | −4.2905 × 10⁻² | 2.2042 × 10⁻¹ | Decrease |
| DTI14 | D(Ne(P)5)ei | −1.2401 × 10⁻² | −5.6792 × 10⁻² | Increase |
| DTI15 | D(Ne(PC)6)ei | 3.4465 × 10⁻² | −2.3273 × 10⁻¹ | Increase |
| Codes a | Descriptors | CLASS-BASED MEANS b | Propensity c | |
|---|---|---|---|---|
| Active | Inactive | |||
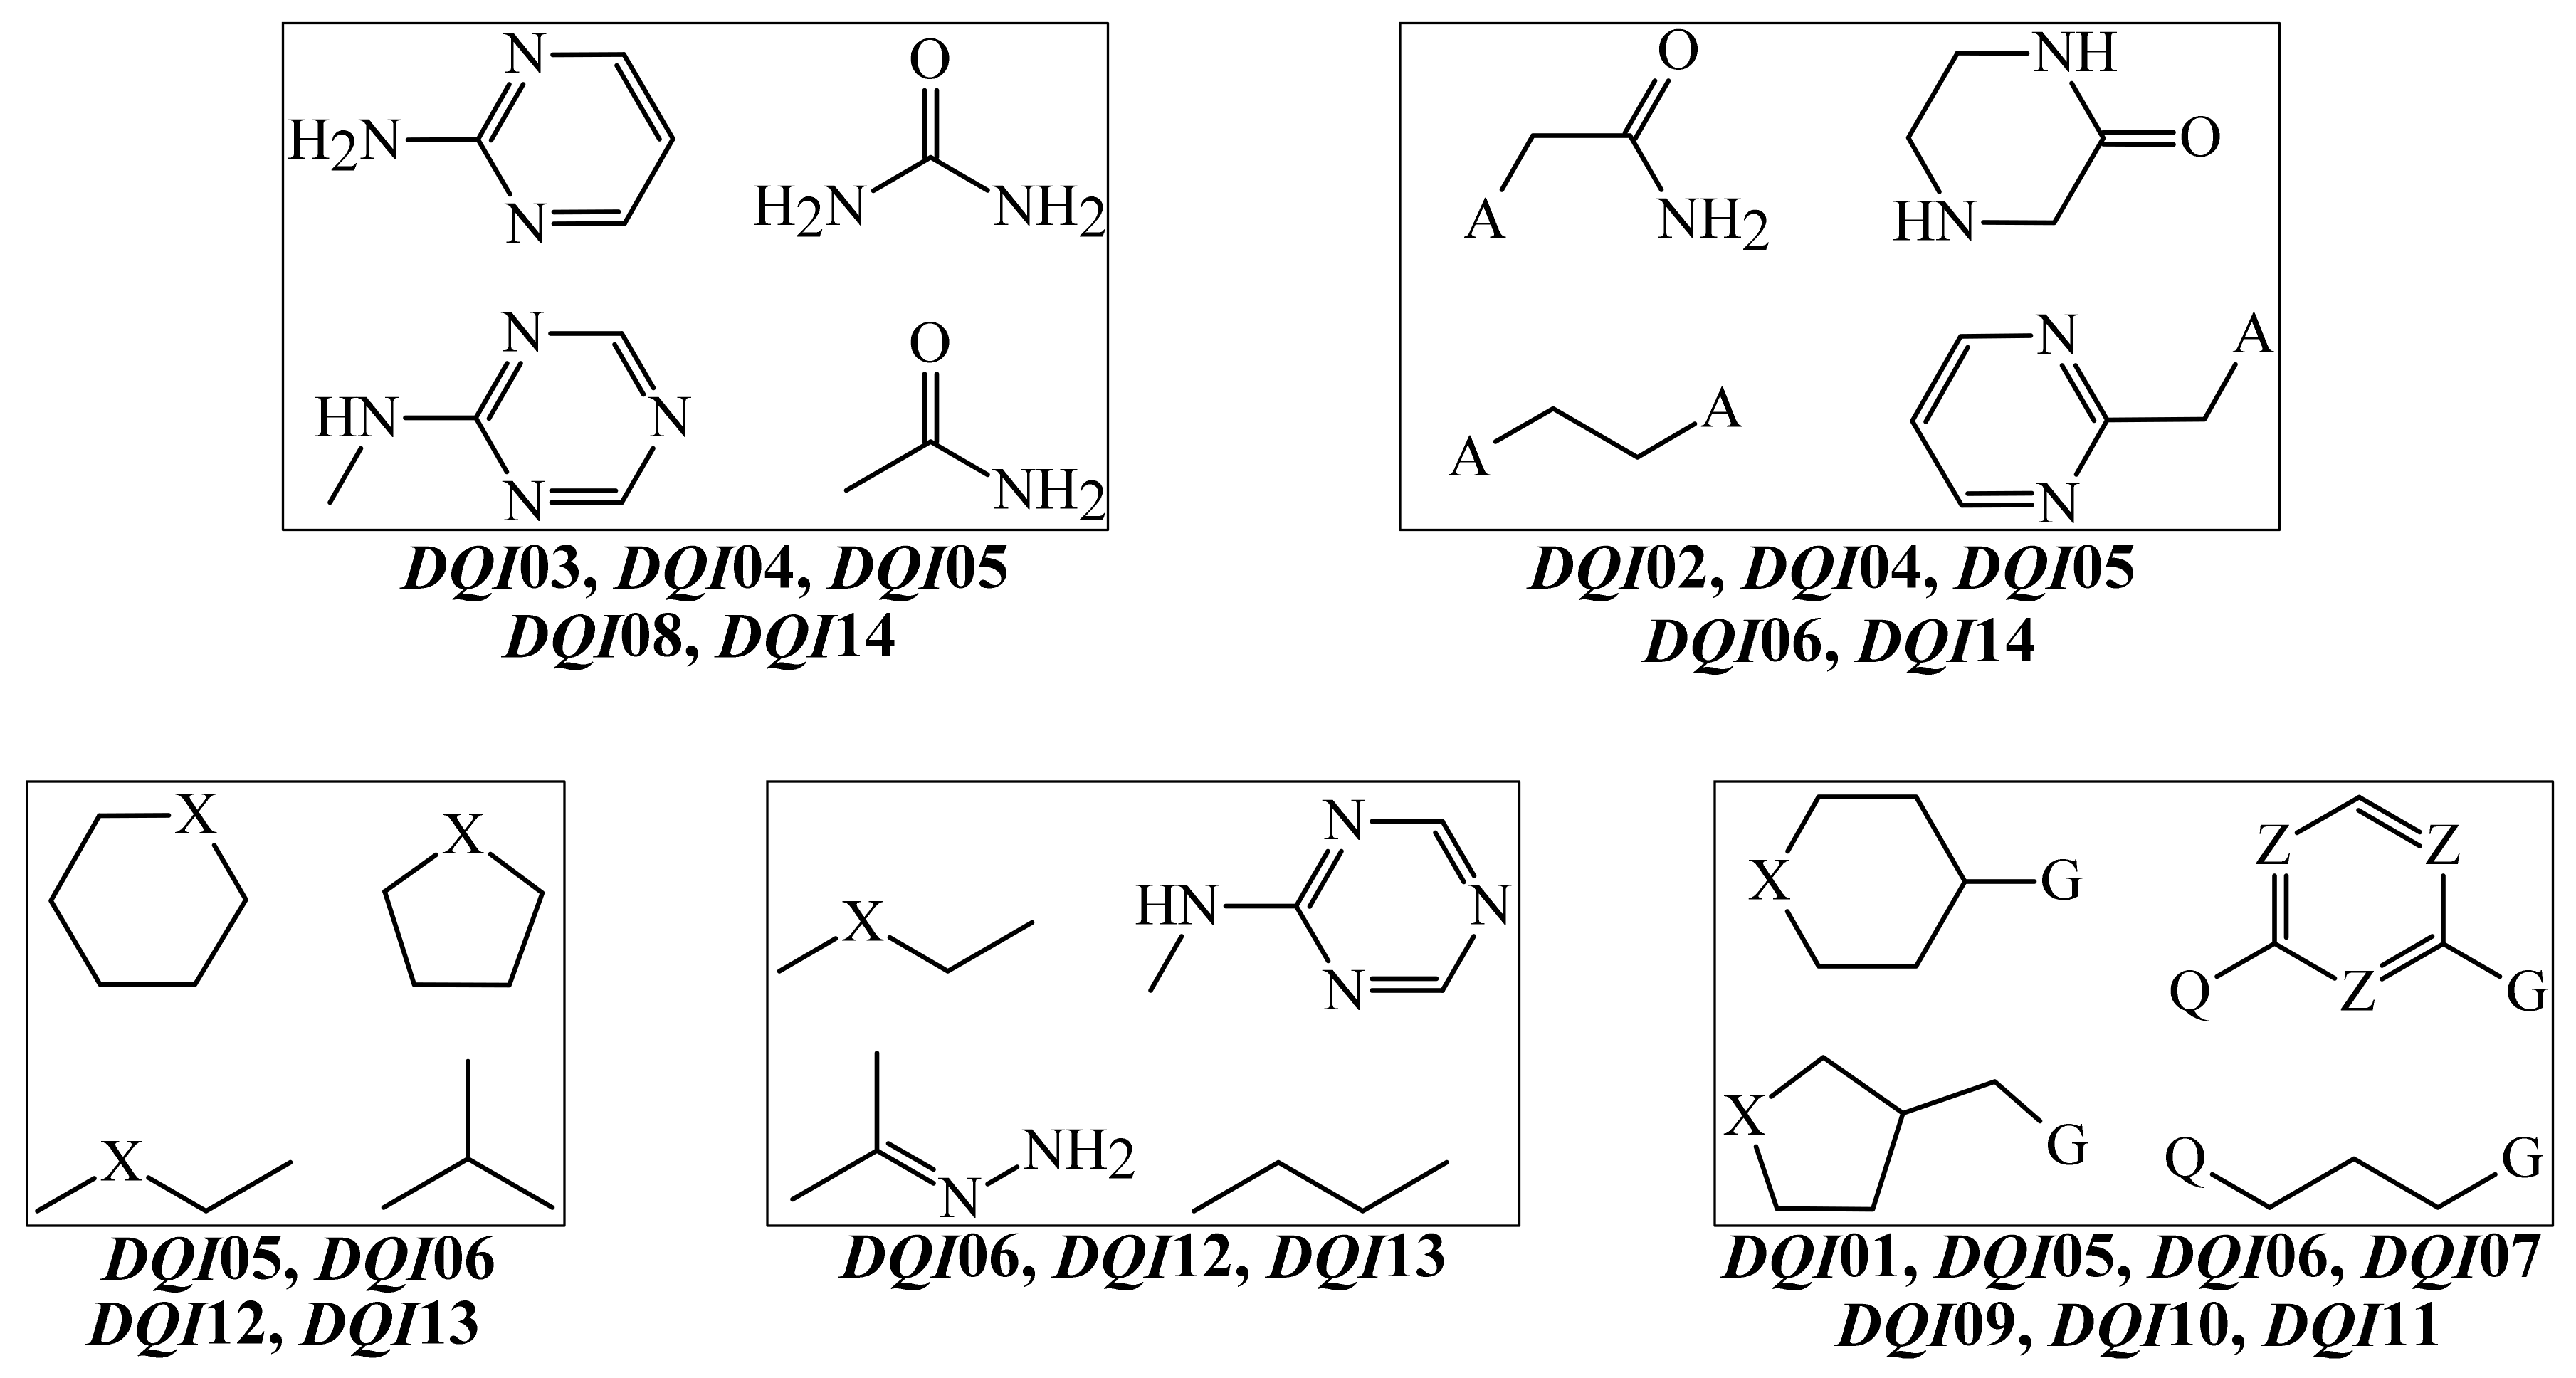
| DQI01 | D(ASq4(Hyd)G)ma | −5.4750 × 10⁻³ | −4.6447 × 10⁻³ | Decrease |
| DQI02 | D(ASq3(Hyd)Y)ma | 2.6348 × 10⁻² | −1.8596 × 10⁻¹ | Increase |
| DQI03 | D(ASq4(Hyd)Y)ma | 3.5673 × 10⁻² | −1.3724 × 10⁻¹ | Increase |
| DQI04 | D(ASq2(E)Y)ma | 5.0259 × 10⁻² | −2.2849 × 10⁻¹ | Increase |
| DQI05 | D(ASq1(Psa)Y)ma | 3.8557 × 10⁻³ | 6.3789 × 10⁻² | Decrease |
| DQI06 | D(ASq1(Aw)C)tg | 5.9744 × 10⁻² | −3.4756 × 10⁻¹ | Increase |
| DQI07 | D(ASq0(Ku)G)tg | 3.9557 × 10⁻³ | 1.1249 × 10⁻¹ | Decrease |
| DQI08 | D(ASq4(Psa)Y)tg | 3.1247 × 10⁻² | −1.2646 × 10⁻¹ | Increase |
| DQI09 | D(ASq1(Hyd)G)ei | −1.1160 × 10⁻² | 4.0920 × 10⁻² | Decrease |
| DQI10 | D(ASq2(Hyd)G)ei | 5.8725 × 10⁻⁴ | 3.3683 × 10⁻² | Decrease |
| DQI11 | D(ASq2(Aw)G)ei | 9.2750 × 10⁻³ | 1.9038 × 10⁻² | Decrease |
| DQI12 | D(ASq1(Hyd)M)ei | 2.6208 × 10⁻² | −1.7829 × 10⁻¹ | Increase |
| DQI13 | D(ASq1(Ku)M)ei | 2.8400 × 10⁻² | −3.0151 × 10⁻¹ | Increase |
| DQI14 | D(ASq0(Hyd)Y)ei | 1.3478 × 10⁻² | −2.1995 × 10⁻² | Increase |
| ID a | nHDon | nHAcc | MW (Da) | MlogP | AlogP | MR (cm3/mol) | nAT | RBN | PSA (Å) |
|---|---|---|---|---|---|---|---|---|---|
| MPMCI-001 | 4 | 8 | 311.41 | 1.429 | 0.675 | 83.009 | 44 | 6 | 104.37 |
| MPMCI-002 | 4 | 9 | 354.49 | 2.259 | 1.578 | 99.009 | 52 | 8 | 102.41 |
| MPMCI-003 | 2 | 9 | 340.46 | 2.151 | 1.515 | 92.717 | 49 | 8 | 92.27 |
Publisher’s Note: MDPI stays neutral with regard to jurisdictional claims in published maps and institutional affiliations. |
© 2022 by the authors. Licensee MDPI, Basel, Switzerland. This article is an open access article distributed under the terms and conditions of the Creative Commons Attribution (CC BY) license (https://creativecommons.org/licenses/by/4.0/).
Share and Cite
Kleandrova, V.V.; Speck-Planche, A. PTML Modeling for Pancreatic Cancer Research: In Silico Design of Simultaneous Multi-Protein and Multi-Cell Inhibitors. Biomedicines 2022, 10, 491. https://doi.org/10.3390/biomedicines10020491
Kleandrova VV, Speck-Planche A. PTML Modeling for Pancreatic Cancer Research: In Silico Design of Simultaneous Multi-Protein and Multi-Cell Inhibitors. Biomedicines. 2022; 10(2):491. https://doi.org/10.3390/biomedicines10020491
Chicago/Turabian StyleKleandrova, Valeria V., and Alejandro Speck-Planche. 2022. "PTML Modeling for Pancreatic Cancer Research: In Silico Design of Simultaneous Multi-Protein and Multi-Cell Inhibitors" Biomedicines 10, no. 2: 491. https://doi.org/10.3390/biomedicines10020491
APA StyleKleandrova, V. V., & Speck-Planche, A. (2022). PTML Modeling for Pancreatic Cancer Research: In Silico Design of Simultaneous Multi-Protein and Multi-Cell Inhibitors. Biomedicines, 10(2), 491. https://doi.org/10.3390/biomedicines10020491