
Associations of Texture Features of Proton Density Fat Fraction Maps between Lumbar Vertebral Bone Marrow and Paraspinal Musculature

 , ,
, ,  , , , ,
  , , , and
Abstract
:1. Introduction
2. Materials and Methods
2.1. Study Population
2.2. Magnetic Resonance Imaging
2.3. Segmentation and PDFF Measurements
2.4. Texture Analysis
2.5. Statistical Analysis
3. Results
3.1. Measurements of PDFF and Texture Features
3.2. Associations between Texture Features of the Bone Marrow and the Muscle Compartments
4. Discussion
5. Conclusions
Author Contributions
Funding
Institutional Review Board Statement
Informed Consent Statement
Data Availability Statement
Conflicts of Interest
References
- Scheller, E.L.; Doucette, C.R.; Learman, B.S.; Cawthorn, W.P.; Khandaker, S.; Schell, B.; Wu, B.; Ding, S.Y.; Bredella, M.A.; Fazeli, P.K.; et al. Region-specific variation in the properties of skeletal adipocytes reveals regulated and constitutive marrow adipose tissues. Nat. Commun. 2015, 6, 8808. [Google Scholar] [CrossRef] [PubMed]
- Devlin, M.J.; Rosen, C.J. The bone-fat interface: Basic and clinical implications of marrow adiposity. Lancet Diabetes Endocrinol. 2015, 3, 141–147. [Google Scholar] [CrossRef]
- Griffith, J.F.; Yeung, D.K.W.; Antonio, G.E.; Lee, F.K.H.; Hong, A.W.L.; Wong, S.Y.S.; Lau, E.M.C.; Leung, P.C. Vertebral Bone Mineral Density, Marrow Perfusion, and Fat Content in Healthy Men and Men with Osteoporosis: Dynamic Contrast-enhanced MR Imaging and MR Spectroscopy. Radiology 2005, 236, 945–951. [Google Scholar] [CrossRef]
- Griffith, J.F.; Yeung, D.K.; Antonio, G.E.; Wong, S.Y.; Kwok, T.C.; Woo, J.; Leung, P.C. Vertebral marrow fat content and diffusion and perfusion indexes in women with varying bone density: MR evaluation. Radiology 2006, 241, 831–838. [Google Scholar] [CrossRef] [PubMed]
- Yu, E.W.; Greenblatt, L.; Eajazi, A.; Torriani, M.; Bredella, M.A. Marrow adipose tissue composition in adults with morbid obesity. Bone 2017, 97, 38–42. [Google Scholar] [CrossRef] [PubMed]
- Karampinos, D.C.; Baum, T.; Nardo, L.; Alizai, H.; Yu, H.; Carballido-Gamio, J.; Yap, S.P.; Shimakawa, A.; Link, T.M.; Majumdar, S. Characterization of the regional distribution of skeletal muscle adipose tissue in type 2 diabetes using chemical shift-based water/fat separation. J. Magn. Reson. Imaging 2012, 35, 899–907. [Google Scholar] [CrossRef] [PubMed]
- Teichtahl, A.J.; Urquhart, D.M.; Wang, Y.; Wluka, A.E.; Wijethilake, P.; O’Sullivan, R.; Cicuttini, F.M. Fat infiltration of paraspinal muscles is associated with low back pain, disability, and structural abnormalities in community-based adults. Spine J. 2015, 15, 1593–1601. [Google Scholar] [CrossRef]
- Dahlqvist, J.R.; Vissing, C.R.; Thomsen, C.; Vissing, J. Severe paraspinal muscle involvement in facioscapulohumeral muscular dystrophy. Neurology 2014, 83, 1178–1183. [Google Scholar] [CrossRef]
- Janssen, B.H.; Voet, N.B.; Nabuurs, C.I.; Kan, H.E.; de Rooy, J.W.; Geurts, A.C.; Padberg, G.W.; van Engelen, B.G.; Heerschap, A. Distinct disease phases in muscles of facioscapulohumeral dystrophy patients identified by MR detected fat infiltration. PLoS ONE 2014, 9, e85416. [Google Scholar] [CrossRef]
- Bailey, J.F.; Fields, A.J.; Ballatori, A.; Cohen, D.; Jain, D.; Coughlin, D.; O’Neill, C.; McCormick, Z.; Han, M.; Krug, R.; et al. The Relationship Between Endplate Pathology and Patient-reported Symptoms for Chronic Low Back Pain Depends on Lumbar Paraspinal Muscle Quality. Spine 2019, 44, 1010–1017. [Google Scholar] [CrossRef]
- Kim, J.Y.; Chae, S.U.; Kim, G.D.; Cha, M.S. Changes of paraspinal muscles in postmenopausal osteoporotic spinal compression fractures: Magnetic resonance imaging study. J. Bone Metab. 2013, 20, 75–81. [Google Scholar] [CrossRef]
- Sollmann, N.; Dieckmeyer, M.; Schlaeger, S.; Rohrmeier, A.; Syvaeri, J.; Diefenbach, M.N.; Weidlich, D.; Ruschke, S.; Klupp, E.; Franz, D.; et al. Associations Between Lumbar Vertebral Bone Marrow and Paraspinal Muscle Fat Compositions—An Investigation by Chemical Shift Encoding-Based Water-Fat MRI. Front. Endocrinol. 2018, 9, 563. [Google Scholar] [CrossRef] [PubMed]
- Paccou, J.; Penel, G.; Chauveau, C.; Cortet, B.; Hardouin, P. Marrow adiposity and bone: Review of clinical implications. Bone 2019, 118, 8–15. [Google Scholar] [CrossRef] [PubMed]
- Reeder, S.B.; Hu, H.H.; Sirlin, C.B. Proton density fat-fraction: A standardized MR-based biomarker of tissue fat concentration. J. Magn. Reson. Imaging 2012, 36, 1011–1014. [Google Scholar] [CrossRef]
- Hu, H.H.; Kan, H.E. Quantitative proton MR techniques for measuring fat. NMR Biomed. 2013, 26, 1609–1629. [Google Scholar] [CrossRef] [PubMed]
- Fischer, M.A.; Nanz, D.; Shimakawa, A.; Schirmer, T.; Guggenberger, R.; Chhabra, A.; Carrino, J.A.; Andreisek, G. Quantification of muscle fat in patients with low back pain: Comparison of multi-echo MR imaging with single-voxel MR spectroscopy. Radiology 2013, 266, 555–563. [Google Scholar] [CrossRef]
- Smith, A.C.; Parrish, T.B.; Abbott, R.; Hoggarth, M.A.; Mendoza, K.; Chen, Y.F.; Elliott, J.M. Muscle-fat MRI: 1.5 Tesla and 3.0 Tesla versus histology. Muscle Nerve. 2014, 50, 170–176. [Google Scholar] [CrossRef]
- Burian, E.; Subburaj, K.; Mookiah, M.R.K.; Rohrmeier, A.; Hedderich, D.M.; Dieckmeyer, M.; Diefenbach, M.N.; Ruschke, S.; Rummeny, E.J.; Zimmer, C.; et al. Texture analysis of vertebral bone marrow using chemical shift encoding-based water-fat MRI: A feasibility study. Osteoporos. Int. 2019, 30, 1265–1274. [Google Scholar] [CrossRef]
- Dieckmeyer, M.; Inhuber, S.; Schlaeger, S.; Weidlich, D.; Mookiah, M.R.K.; Subburaj, K.; Burian, E.; Sollmann, N.; Kirschke, J.S.; Karampinos, D.C.; et al. Texture Features of Proton Density Fat Fraction Maps from Chemical Shift Encoding-Based MRI Predict Paraspinal Muscle Strength. Diagnostics 2021, 11, 239. [Google Scholar] [CrossRef]
- Karampinos, D.C.; Yu, H.; Shimakawa, A.; Link, T.M.; Majumdar, S. T1-corrected fat quantification using chemical shift-based water/fat separation: Application to skeletal muscle. Magn. Reson. Med. 2011, 66, 1312–1326. [Google Scholar] [CrossRef] [Green Version]
- Haralick, R.M.; Shanmugam, K.; Dinstein, I. Textural Features for Image Classification. IEEE Trans. Syst. Man Cybern. 1973, 3, 610–621. [Google Scholar] [CrossRef]
- Assefa, D.; Keller, H.; Ménard, C.; Laperriere, N.; Ferrari, R.J.; Yeung, I. Robust texture features for response monitoring of glioblastoma multiforme on -weighted and -FLAIR MR images: A preliminary investigation in terms of identification and segmentation. Med. Phys. 2010, 37, 1722–1736. [Google Scholar] [CrossRef] [PubMed]
- Thibault, G.; Devic, C.; Fertil, B.; Mari, J.; Sequeira, J. Indices de formes: De la 2D vers la 3D Application au classement de noyaux de cellules. Journées L’association Francoph. D’informatique Graph. 2007, 17, 17–24. [Google Scholar]
- Freedman, D.; Diaconis, P. On the histogram as a density estimator:L2 theory. Z. Wahrscheinlichkeitstheorie Verwandte Geb. 1981, 57, 453–476. [Google Scholar] [CrossRef]
- Scott, D.W. On optimal and data-based histograms. Biometrika 1979, 66, 605–610. [Google Scholar] [CrossRef]
- Sturges, H.A. The Choice of a Class Interval. J. Am. Stat. Assoc. 1926, 21, 65–66. [Google Scholar] [CrossRef]
- Vallières, M.; Freeman, C.R.; Skamene, S.R.; El Naqa, I. A radiomics model from joint FDG-PET and MRI texture features for the prediction of lung metastases in soft-tissue sarcomas of the extremities. Phys. Med. Biol. 2015, 60, 5471–5496. [Google Scholar] [CrossRef]
- Zhou, H.; Vallières, M.; Bai, H.X.; Su, C.; Tang, H.; Oldridge, D.; Zhang, Z.; Xiao, B.; Liao, W.; Tao, Y.; et al. MRI features predict survival and molecular markers in diffuse lower-grade gliomas. Neuro. Oncol. 2017, 19, 862–870. [Google Scholar] [CrossRef]
- Vallières, M.; Kay-Rivest, E.; Perrin, L.J.; Liem, X.; Furstoss, C.; Aerts, H.; Khaouam, N.; Nguyen-Tan, P.F.; Wang, C.S.; Sultanem, K.; et al. Radiomics strategies for risk assessment of tumour failure in head-and-neck cancer. Sci. Rep. 2017, 7, 10117. [Google Scholar] [CrossRef]
- Kühn, J.-P.; Hernando, D.; Meffert, P.J.; Reeder, S.; Hosten, N.; Laqua, R.; Steveling, A.; Ender, S.; Schröder, H.; Pillich, D.-T. Proton-density fat fraction and simultaneous R2* estimation as an MRI tool for assessment of osteoporosis. Eur. Radiol. 2013, 23, 3432–3439. [Google Scholar] [CrossRef]
- Compston, J.E.; Flahive, J.; Hooven, F.H.; Anderson, F.A.; Adachi, J.D.; Boonen, S.; Chapurlat, R.D.; Cooper, C.; Díez-Perez, A.; Greenspan, S.L.; et al. Obesity, Health-Care Utilization, and Health-Related Quality of Life After Fracture in Postmenopausal Women: Global Longitudinal Study of Osteoporosis in Women (GLOW). Calcif. Tissue Int. 2014, 94, 223–231. [Google Scholar] [CrossRef] [PubMed] [Green Version]

| Male | Female | p-Value | |
|---|---|---|---|
| Age [years] | 54.79 ± 29.53 | 38.74 ± 16.73 | 0.043 * |
| BMI [kg/m2] | 26.94 ± 4.62 | 24.87 ± 4.12 | 0.203 |
| PDFFES [%] | 7.79 ± 6.88 | 16.11 ± 9.27 | 0.014 * |
| Variance(global)ES | 139.12 ± 14.36 | 117.65 ± 13.15 | 0.005 * |
| Skewness(global)ES | −0.13 ± 0.82 | 0.59 ± 0.55 | 0.016 * |
| Kurtosis(global)ES | 3.25 ± 0.92 | 2.06 ± 1.54 | 0.012 * |
| EnergyES [×103] | 0.98 ± 0.27 | 0.77 ± 0.43 | 0.011 * |
| ContrastES | 341.29 ± 57.20 | 405.40 ± 87.81 | 0.005 * |
| EntropyES | 11.20 ± 0.50 | 11.81 ± 0.74 | 0.016 * |
| HomogeneityES | 0.22 ± 0.02 | 0.20 ± 0.03 | 0.004 * |
| CorrelationES | 0.45 ± 0.12 | 0.60 ± 0.14 | 0.010 * |
| SumAverageES [×102] | 0.22 ± 0.02 | 0.21 ± 0.02 | 0.853 |
| VarianceES [×102] | 0.82 ± 0.27 | 1.53 ± 0.98 | 0.012 * |
| DissimilarityES | 10.84 ± 1.34 | 12.52 ± 1.99 | 0.005 * |
| PDFFPS [%] | 3.63 ± 5.38 | 5.39 ± 4.17 | 0.043 * |
| Variance(global)PS | 95.68 ± 15.64 | 66.29 ± 8.62 | 0.002 * |
| Skewness(global)PS | −0.60 ± 0.29 | −0.42 ± 0.52 | 0.031 * |
| Kurtosis(global)PS | 0.89 ± 0.47 | 1.46 ± 0.82 | 0.042 * |
| EnergyPS [×103] | 0.39 ± 0.07 | 0.44 ± 0.11 | 0.151 |
| ContrastPS | 376.88 ± 49.26 | 389.69 ± 71.36 | 0.900 |
| EntropyPS | 12.11 ± 0.22 | 11.98 ± 0.31 | 0.216 |
| HomogeneityPS | 0.17 ± 0.01 | 0.18 ± 0.01 | 0.135 |
| CorrelationPS | 0.51 ± 0.09 | 0.49 ± 0.11 | 0.547 |
| SumAveragePS [×102] | 0.25 ± 0.02 | 0.24 ± 0.03 | 0.252 |
| VariancePS [×102] | 0.98 ± 0.14 | 0.97 ± 0.18 | 0.686 |
| DissimilarityPS | 13.12 ± 0.97 | 12.86 ± 1.03 | 0.376 |
| PDFFLS [%] | 33.40 ± 6.77 | 33.08 ± 10.30 | 0.917 |
| Variance(global)LS | 41.00 ± 4.83 | 35.11 ± 3.24 | 0.006 * |
| Skewness(global)LS | −0.38 ± 0.45 | −0.06 ± 0.65 | 0.049 * |
| Kurtosis(global)LS | 1.10 ± 0.44 | 1.41 ± 1.02 | 0.420 * |
| EnergyLS [×102] | 0.21 ± 0.06 | 0.24 ± 0.09 | 0.894 |
| ContrastLS | 93.27 ± 83.51 | 79.36 ± 38.61 | 0.876 |
| EntropyLS | 9.66 ± 0.48 | 9.55 ± 0.59 | 0.919 |
| HomogeneityLS | 0.28 ± 0.02 | 0.28 ± 0.04 | 0.642 |
| CorrelationLS | 0.60 ± 0.08 | 0.61 ± 0.05 | 0.491 |
| SumAverageLS [×102] | 0.34 ± 0.07 | 0.34 ± 0.11 | 0.976 |
| VarianceLS [×102] | 10.1 ± 0.58 | 11.1 ± 0.68 | 0.468 |
| DissimilarityLS | 6.31 ± 2.04 | 6.03 ± 1.47 | 0.831 |
| Lumbar Spine vs. ES | Lumbar Spine vs. PS | |
|---|---|---|
| PDFF | 0.13, n.s. | 0.08, n.s. |
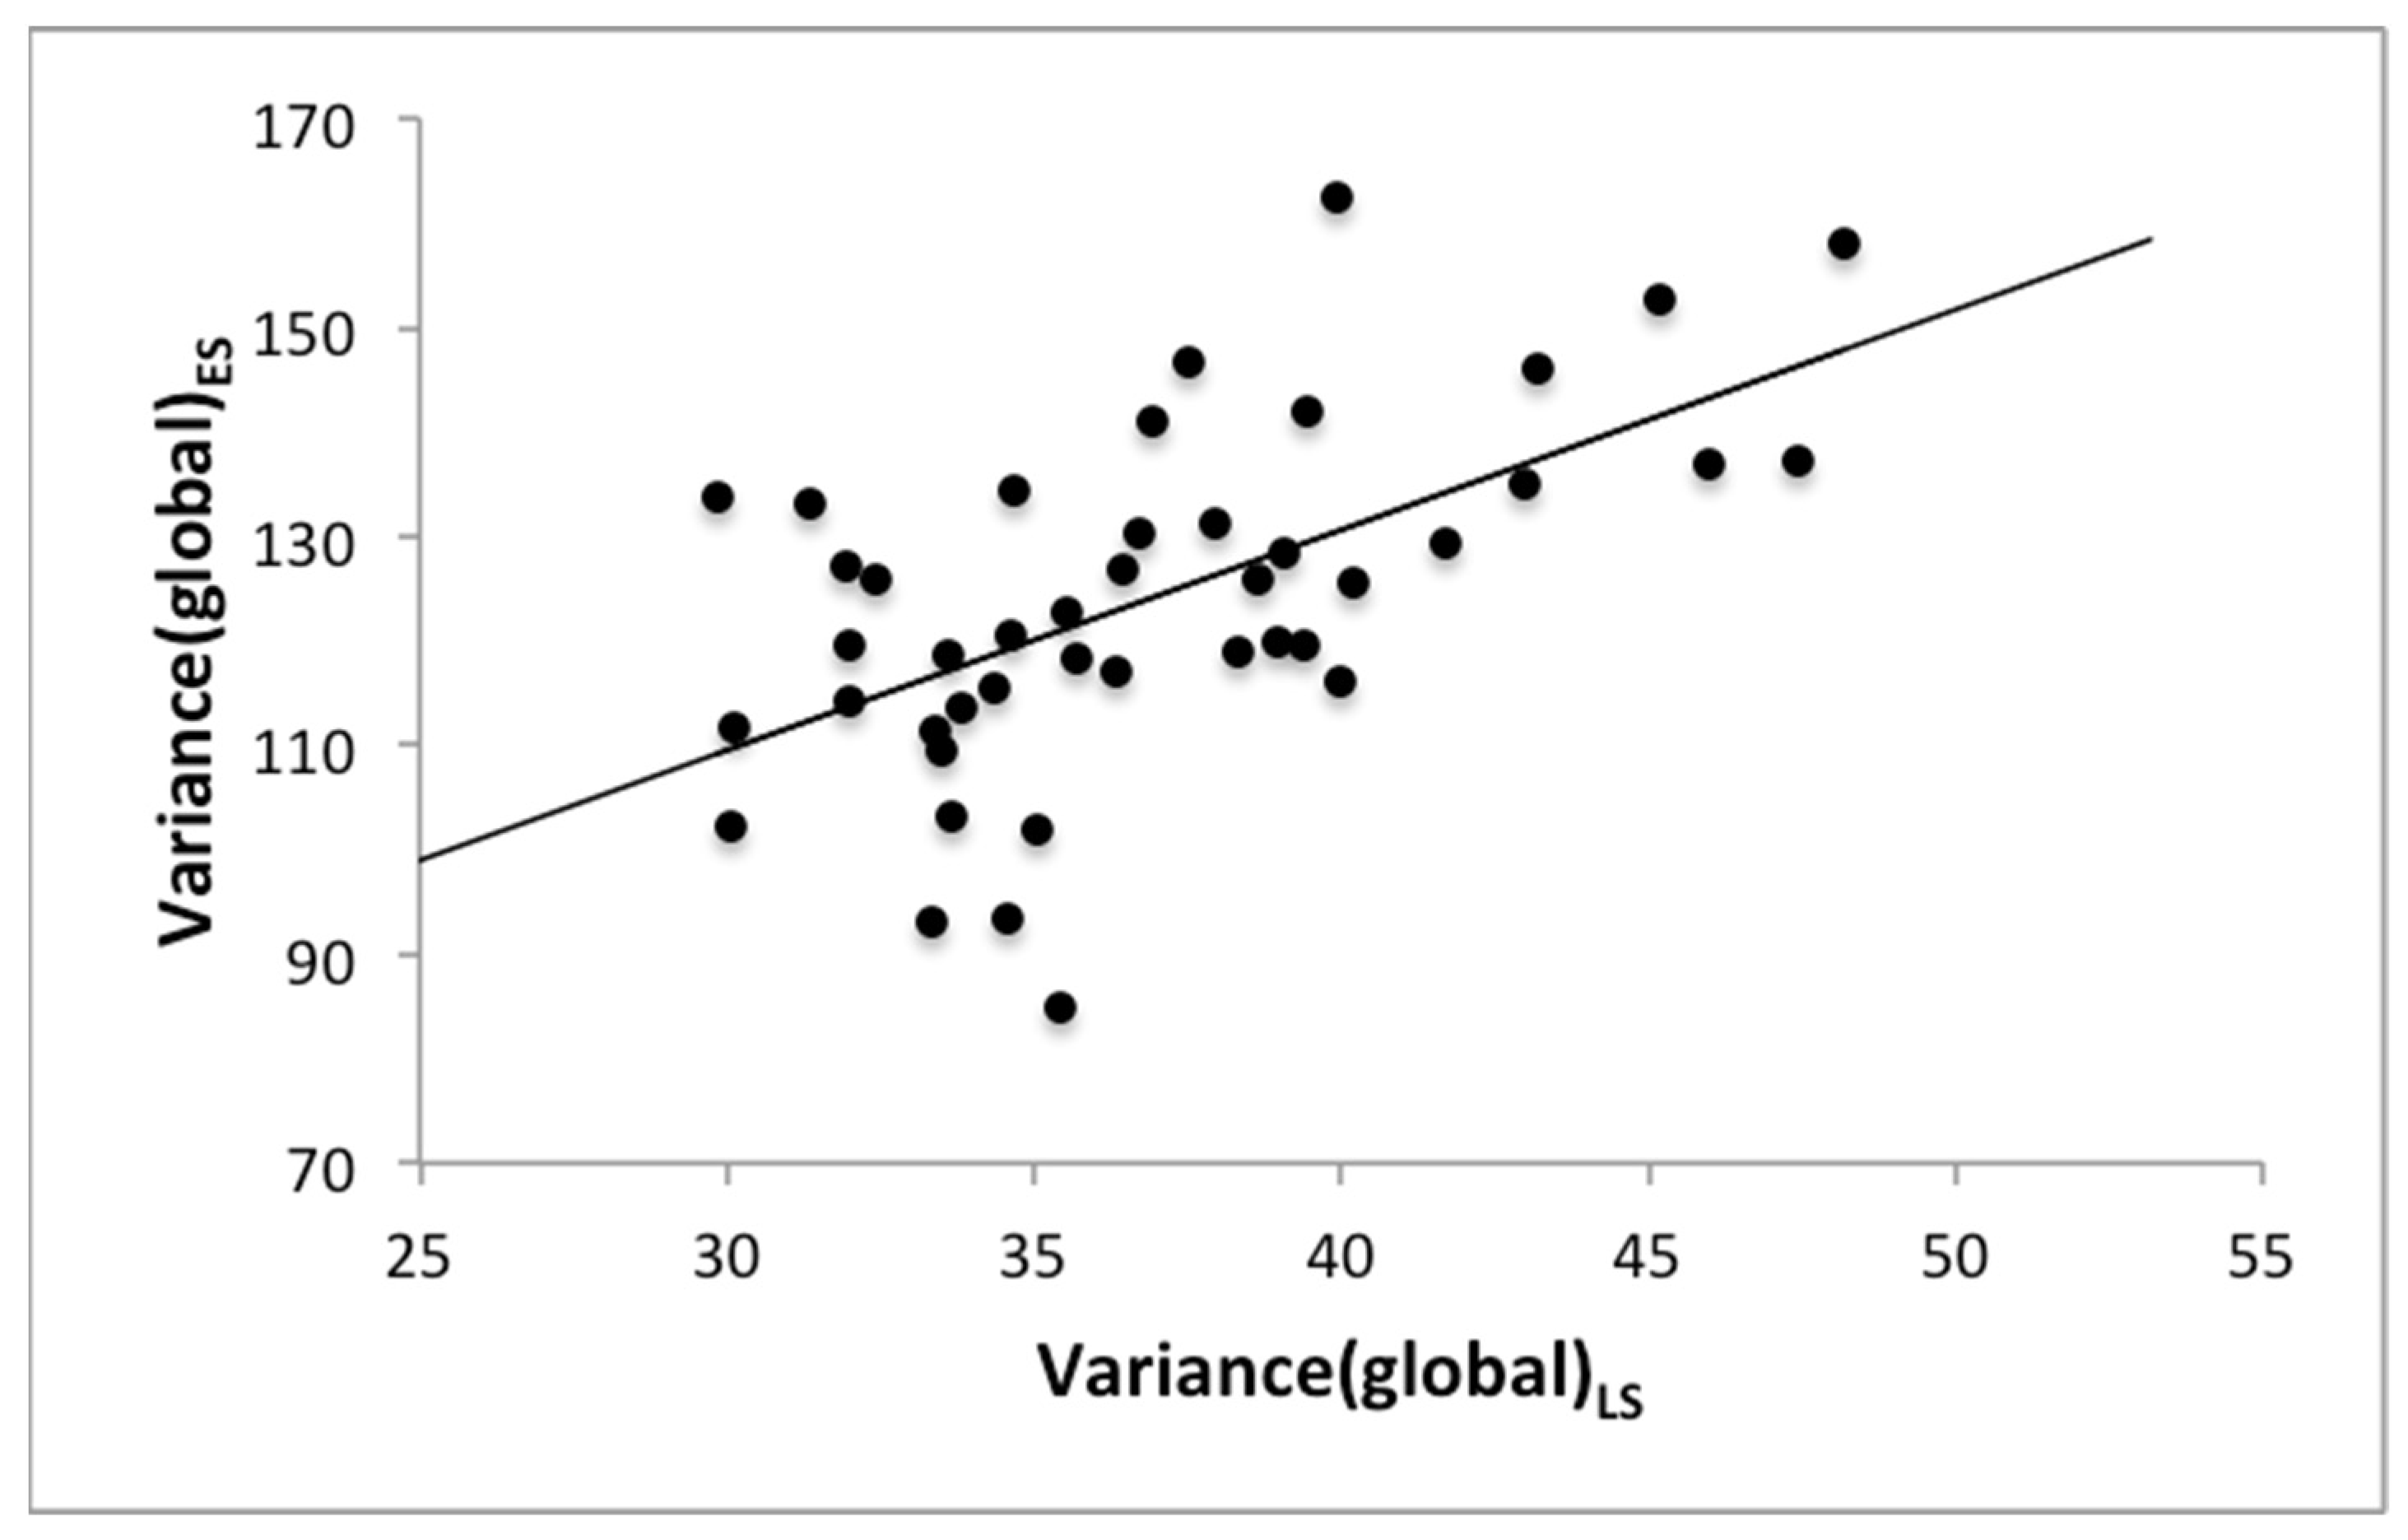
| Variance(global) | 0.61, p < 0.001 | 0.62, p < 0.001 |
| Skewness(global) | 0.30, n.s. | 0.28, n.s. |
| Kurtosis(global) | −0.33, n.s. | −0.31, n.s. |
| Energy | −0.15, n.s. | −0.32, n.s. |
| Contrast | 0.23, n.s. | 0.09, n.s. |
| Entropy | 0.03, n.s. | 0.28, n.s. |
| Homogeneity | 0.06, n.s. | −0.15, n.s. |
| Correlation | 0.05, n.s. | −0.11, n.s. |
| Sum Average | −0.14, n.s. | −0.04, n.s. |
| Variance | 0.28, n.s. | −0.09, n.s. |
| Dissimilarity | 0.25, n.s. | −0.07, n.s. |
Publisher’s Note: MDPI stays neutral with regard to jurisdictional claims in published maps and institutional affiliations. |
© 2022 by the authors. Licensee MDPI, Basel, Switzerland. This article is an open access article distributed under the terms and conditions of the Creative Commons Attribution (CC BY) license (https://creativecommons.org/licenses/by/4.0/).
Share and Cite
Leonhardt, Y.; Dieckmeyer, M.; Zoffl, F.; Feuerriegel, G.C.; Sollmann, N.; Junker, D.; Greve, T.; Holzapfel, C.; Hauner, H.; Subburaj, K.; et al. Associations of Texture Features of Proton Density Fat Fraction Maps between Lumbar Vertebral Bone Marrow and Paraspinal Musculature. Biomedicines 2022, 10, 2075. https://doi.org/10.3390/biomedicines10092075
Leonhardt Y, Dieckmeyer M, Zoffl F, Feuerriegel GC, Sollmann N, Junker D, Greve T, Holzapfel C, Hauner H, Subburaj K, et al. Associations of Texture Features of Proton Density Fat Fraction Maps between Lumbar Vertebral Bone Marrow and Paraspinal Musculature. Biomedicines. 2022; 10(9):2075. https://doi.org/10.3390/biomedicines10092075
Chicago/Turabian StyleLeonhardt, Yannik, Michael Dieckmeyer, Florian Zoffl, Georg C. Feuerriegel, Nico Sollmann, Daniela Junker, Tobias Greve, Christina Holzapfel, Hans Hauner, Karupppasamy Subburaj, and et al. 2022. "Associations of Texture Features of Proton Density Fat Fraction Maps between Lumbar Vertebral Bone Marrow and Paraspinal Musculature" Biomedicines 10, no. 9: 2075. https://doi.org/10.3390/biomedicines10092075
APA StyleLeonhardt, Y., Dieckmeyer, M., Zoffl, F., Feuerriegel, G. C., Sollmann, N., Junker, D., Greve, T., Holzapfel, C., Hauner, H., Subburaj, K., Kirschke, J. S., Karampinos, D. C., Zimmer, C., Makowski, M. R., Baum, T., & Burian, E. (2022). Associations of Texture Features of Proton Density Fat Fraction Maps between Lumbar Vertebral Bone Marrow and Paraspinal Musculature. Biomedicines, 10(9), 2075. https://doi.org/10.3390/biomedicines10092075