
C-Reactive Protein as a Marker of Inflammation in Children and Adolescents with Metabolic Syndrome: A Systematic Review and Meta-Analysis


 , ,
, ,  ,
,  , and
, and
Abstract
:1. Introduction
2. Materials and Methods
2.1. Search Strategy
2.2. Inclusion and Exclusion Criteria
2.3. Statistical Analysis
3. Results
3.1. Study Selection and Characteristics of Included Studies
3.2. Meta-Analysis of Studies Measuring hsCRP in MetS Patients Compared with Healthy Controls
3.3. Meta-Analysis of Studies Measuring hsCRP in MetS Patients Compared with Obese Patients
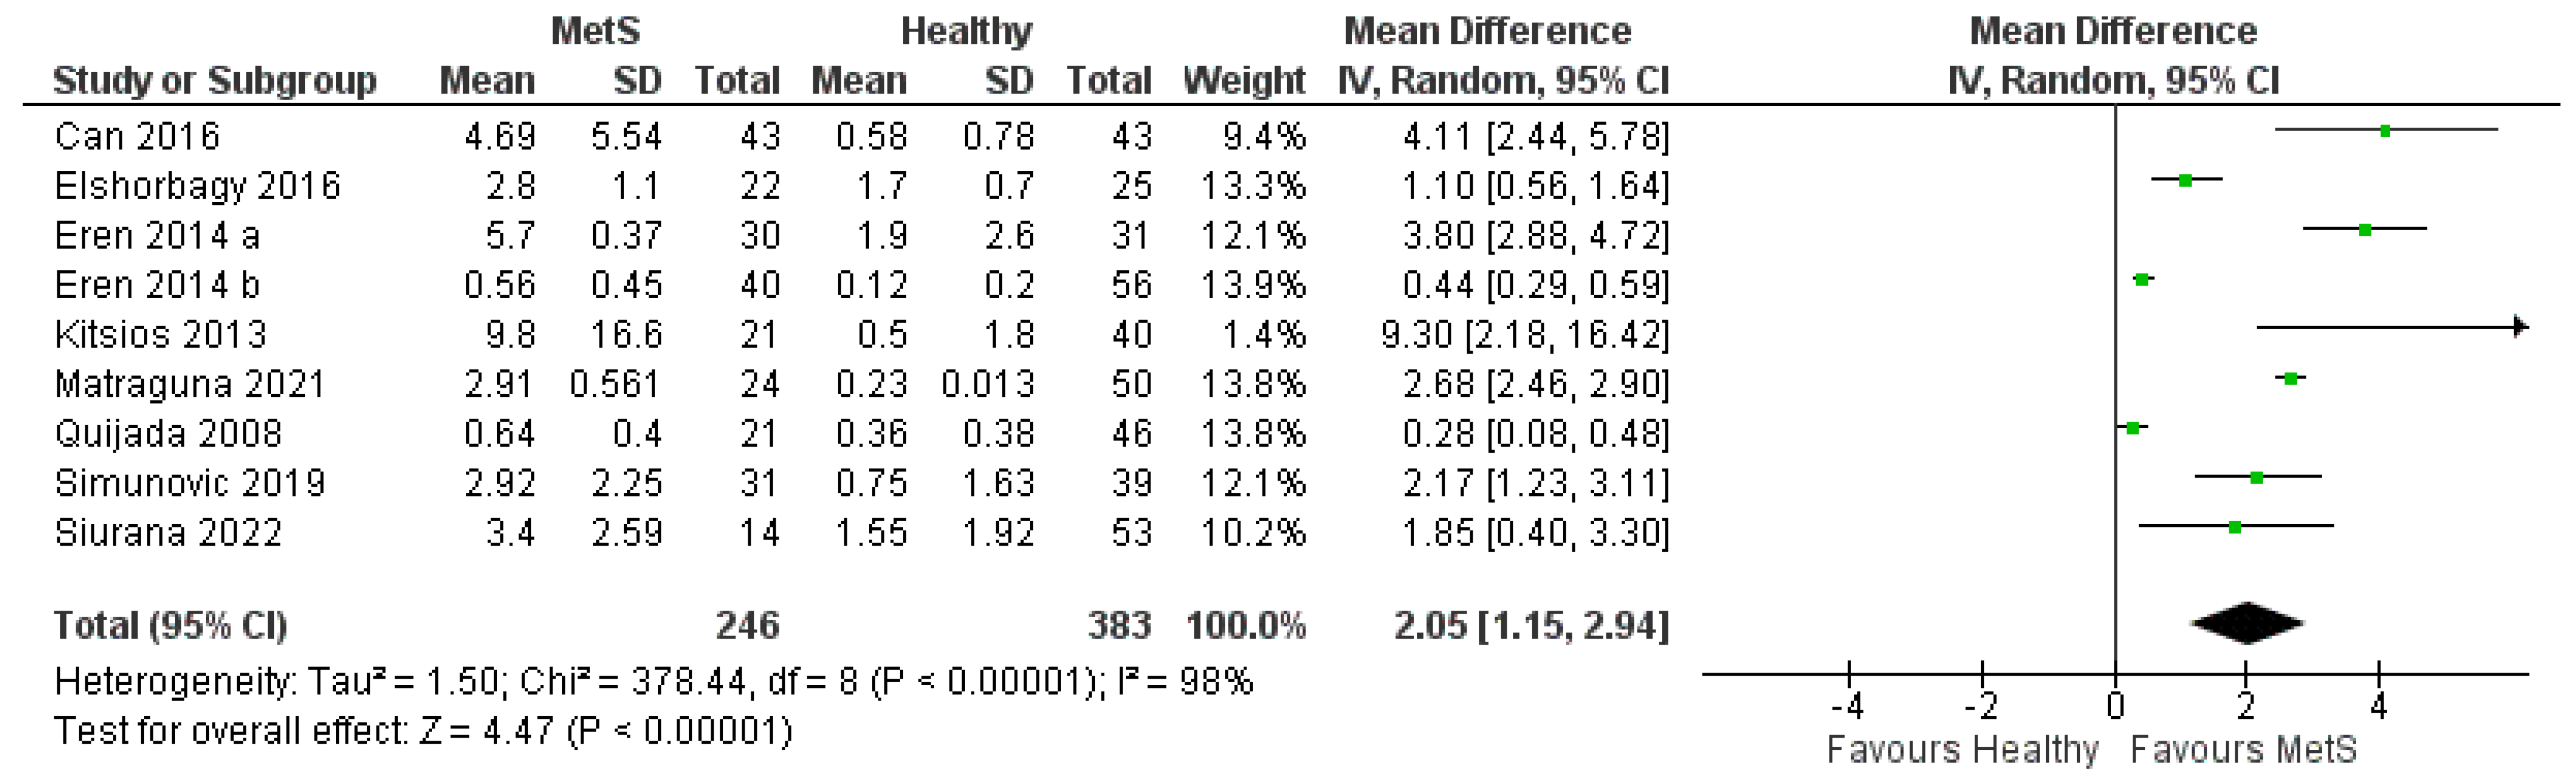
3.4. Meta-Analysis of Studies Measuring CRP in MetS Patients Compared with Healthy Controls
3.5. Meta-Analysis of Studies Measuring CRP in MetS Patients Compared with Obese Patients
4. Discussion
5. Conclusions
Author Contributions
Funding
Institutional Review Board Statement
Informed Consent Statement
Data Availability Statement
Conflicts of Interest
References
- Swarup, S.; Goyal, A.; Grigorova, Y.; Zeltser, R. Metabolic Syndrome; StatPearls Publishing: Treasure Island, FL, USA, 2023. [Google Scholar]
- Stepan, M.D.; Vintilescu, Ș.B.; Streață, I.; Podeanu, M.A.; Florescu, D.N. The Role of Vitamin D in Obese Children with Non-Alcoholic Fatty Liver Disease and Associated Metabolic Syndrome. Nutrients 2023, 15, 2113. [Google Scholar] [CrossRef] [PubMed]
- Wan Mahmud Sabri, W.M.N.; Mohamed, R.Z.; Yaacob, N.M.; Hussain, S. Prevalence of Metabolic Syndrome and Its Associated Risk Factors in Pediatric Obesity. J. ASEAN Fed. Endocr. Soc. 2022, 37, 24–30. [Google Scholar] [CrossRef] [PubMed]
- Al-Hamad, D.; Raman, V. Metabolic Syndrome in Children and Adolescents. Transl. Pediatr. 2017, 6, 397–407. [Google Scholar] [CrossRef]
- Lemieux, I.; Després, J.-P. Metabolic Syndrome: Past, Present and Future. Nutrients 2020, 12, 3501. [Google Scholar] [CrossRef] [PubMed]
- Zong, X.; Bovet, P.; Xi, B. A Proposal to Unify the Definition of the Metabolic Syndrome in Children and Adolescents. Front. Endocrinol. 2022, 13, 925976. [Google Scholar] [CrossRef]
- Arellano-Ruiz, P.; García-Hermoso, A.; Cavero-Redondo, I.; Pozuelo-Carrascosa, D.; Martínez-Vizcaíno, V.; Solera-Martinez, M. Homeostasis Model Assessment Cut-off Points Related to Metabolic Syndrome in Children and Adolescents: A Systematic Review and Meta-Analysis. Eur. J. Pediatr. 2019, 178, 1813–1822. [Google Scholar] [CrossRef] [PubMed]
- McCracken, E.; Monaghan, M.; Sreenivasan, S. Pathophysiology of the Metabolic Syndrome. Clin. Dermatol. 2018, 36, 14–20. [Google Scholar] [CrossRef]
- Pekgor, S.; Duran, C.; Berberoglu, U.; Eryilmaz, M.A. The Role of Visceral Adiposity Index Levels in Predicting the Presence of Metabolic Syndrome and Insulin Resistance in Overweight and Obese Patients. Metab. Syndr. Relat. Disord. 2019, 17, 296–302. [Google Scholar] [CrossRef]
- Matsuzawa, Y.; Funahashi, T.; Nakamura, T. The Concept of Metabolic Syndrome: Contribution of Visceral Fat Accumulation and Its Molecular Mechanism. J. Atheroscler. Thromb. 2011, 18, 629–639. [Google Scholar] [CrossRef]
- Băloşeanu, C.L.; Streba, C.T.; Vere, C.C.; Comănescu, V.; Rogoveanu, I. Association between Liver Histology, Carotid Ultrasonography and Retinal Vascular Changes in Patients with Nonalcoholic Fatty Liver Disease (NAFLD). Rom. J. Morphol. Embryol. 2012, 53, 609–614. [Google Scholar]
- Fahed, G.; Aoun, L.; Bou Zerdan, M.; Allam, S.; Bou Zerdan, M.; Bouferraa, Y.; Assi, H.I. Metabolic Syndrome: Updates on Pathophysiology and Management in 2021. Int. J. Mol. Sci. 2022, 23, 786. [Google Scholar] [CrossRef]
- Song, Y.; Yang, S.K.; Kim, J.; Lee, D.-C. Association between C-Reactive Protein and Metabolic Syndrome in Korean Adults. Korean J. Fam. Med. 2019, 40, 116–123. [Google Scholar] [CrossRef] [PubMed]
- Hotamisligil, G.S. Inflammation and Metabolic Disorders. Nature 2006, 444, 860–867. [Google Scholar] [CrossRef] [PubMed]
- Ridker, P.M.; Hennekens, C.H.; Buring, J.E.; Rifai, N. C-Reactive Protein and Other Markers of Inflammation in the Prediction of Cardiovascular Disease in Women. N. Engl. J. Med. 2000, 342, 836–843. [Google Scholar] [CrossRef]
- Burstein, S.A.; Peng, J.; Friese, P.; Wolf, R.F.; Harrison, P.; Downs, T.; Hamilton, K.; Comp, P.; Dale, G.L. Cytokine-Induced Alteration of Platelet and Hemostatic Function. Stem Cells 1996, 14, 154–162. [Google Scholar] [CrossRef] [PubMed]
- Wassmann, S.; Stumpf, M.; Strehlow, K.; Schmid, A.; Schieffer, B.; Böhm, M.; Nickenig, G. Interleukin-6 Induces Oxidative Stress and Endothelial Dysfunction by Overexpression of the Angiotensin II Type 1 Receptor. Circ. Res. 2004, 94, 534–541. [Google Scholar] [CrossRef]
- Nehring, S.M.; Goyal, A.; Patel, B.C. C Reactive Protein; StatPearls Publishing: Treasure Island, FL, USA, 2023. [Google Scholar]
- Ansar, W.; Ghosh, S. C-Reactive Protein and the Biology of Disease. Immunol. Res. 2013, 56, 131–142. [Google Scholar] [CrossRef]
- Harrison, M. Abnormal Laboratory Results: Erythrocyte Sedimentation Rate and C-Reactive Protein. Aust. Prescr. 2015, 38, 93–94. [Google Scholar] [CrossRef]
- FDA. Review Criteria for Assessment of C-Reactive Protein (CRP), High Sensitivity C-Reactive Protein (HsCRP) and Cardiac C-Reactive Protein (CCRP) Assays. 2005. Available online: https://www.fda.gov/regulatory-information/search-fda-guidance-documents/review-criteria-assessment-c-reactive-protein-crp-high-sensitivity-c-reactive-protein-hscrp-and (accessed on 15 August 2023).
- Alberti, K.G.M.M.; Zimmet, P.; Shaw, J. Metabolic Syndrome-a New World-Wide Definition. A Consensus Statement from the International Diabetes Federation. Diabet. Med. 2006, 23, 469–480. [Google Scholar] [CrossRef]
- Devaraj, S.; Singh, U.; Jialal, I. Human C-Reactive Protein and the Metabolic Syndrome. Curr. Opin. Lipidol. 2009, 20, 182–189. [Google Scholar] [CrossRef]
- Chakraborty, S.; Prasad, G.; Marwaha, R.; Basu, A.; Tandon, N.; Bharadwaj, D. Comparison of Plasma Adipocytokines & C-Reactive Protein Levels in Healthy Schoolgoing Adolescents from Private & Government-Funded Schools of Delhi, India. Indian J. Med. Res. 2020, 151, 47. [Google Scholar] [CrossRef] [PubMed]
- Ford, E.S.; Ajani, U.A.; Mokdad, A.H. The Metabolic Syndrome and Concentrations of C-Reactive Protein Among U.S. Youth. Diabetes Care 2005, 28, 878–881. [Google Scholar] [CrossRef] [PubMed]
- Plebani, M. Why C-Reactive Protein Is One of the Most Requested Tests in Clinical Laboratories? Clin. Chem. Lab. Med. 2023, 61, 1540–1545. [Google Scholar] [CrossRef]
- Reddy, P.; Lent-Schochet, D.; Ramakrishnan, N.; McLaughlin, M.; Jialal, I. Metabolic Syndrome Is an Inflammatory Disorder: A Conspiracy between Adipose Tissue and Phagocytes. Clin. Chim. Acta 2019, 496, 35–44. [Google Scholar] [CrossRef]
- Page, M.J.; McKenzie, J.E.; Bossuyt, P.M.; Boutron, I.; Hoffmann, T.C.; Mulrow, C.D.; Shamseer, L.; Tetzlaff, J.M.; Akl, E.A.; Brennan, S.E.; et al. The PRISMA 2020 Statement: An Updated Guideline for Reporting Systematic Reviews. BMJ 2021, 372, n71. [Google Scholar] [CrossRef]
- Aslam, S.; Emmanuel, P. Formulating a Researchable Question: A Critical Step for Facilitating Good Clinical Research. Indian J. Sex. Transm. Dis. AIDS 2010, 31, 47. [Google Scholar] [CrossRef]
- Wells, G.A.; Shea, B.; O’Connell, D.; Peterson, J.; Welch, V.; Losos, M.; Tugwell, P. The Newcastle-Ottawa Scale (NOS) for Assessing the Quality of Nonrandomised Studies in Meta-Analyses. Available online: https://www.ohri.ca/programs/clinical_epidemiology/oxford.asp (accessed on 25 August 2023).
- Luchini, C.; Stubbs, B.; Solmi, M.; Veronese, N. Assessing the Quality of Studies in Meta-Analyses: Advantages and Limitations of the Newcastle Ottawa Scale. World J. Metaanal. 2017, 5, 80. [Google Scholar] [CrossRef]
- Cook, R.D. Detection of Influential Observations in Linear Regression. Technometrics 1977, 19, 15–18. [Google Scholar] [CrossRef]
- Kitsios, K.; Papadopoulou, M.; Kosta, K.; Kadoglou, N.; Papagianni, M.; Tsiroukidou, K. High-Sensitivity C-Reactive Protein Levels and Metabolic Disorders in Obese and Overweight Children and Adolescents. J. Clin. Res. Pediatr. Endocrinol. 2013, 5, 44–49. [Google Scholar] [CrossRef]
- Matraguna, N.; Cojocari, S.; Bichir-Thoreac, L.; Revenco, N.; Mazur-Nicorici, L. Metabolic Syndrome in Children. Arch. Balk. Med. Union 2021, 56, 213–220. [Google Scholar] [CrossRef]
- Eren, E.; Koca, B.; Ture, M.; Guzel, B. Epicardial Adiposity in Children with Obesity and Metabolic Syndrome. Iran J. Pediatr. 2014, 24, 411–417. [Google Scholar] [PubMed]
- Siurana, J.M.; Sabaté-Rotés, A.; Amigó, N.; Martínez-Micaelo, N.; Arciniegas, L.; Riaza, L.; Mogas, E.; Rosés-Noguer, F.; Ventura, P.S.; Yeste, D. Different Profiles of Lipoprotein Particles Associate Various Degrees of Cardiac Involvement in Adolescents with Morbid Obesity. Front. Pediatr. 2022, 10, 887771. [Google Scholar] [CrossRef] [PubMed]
- Eren, E.; Abuhandan, M.; Solmaz, A.; Taşkın, A. Serum Paraoxonase/Arylesterase Activity and Oxidative Stress Status in Children with Metabolic Syndrome. J. Clin. Res. Pediatr. Endocrinol. 2014, 6, 163–168. [Google Scholar] [CrossRef] [PubMed]
- Can, U.; Buyukinan, M.; Guzelant, A.; Ugur, A.; Karaibrahimoglu, A.; Yabancıun, S. Investigation of the Inflammatory Biomarkers of Metabolic Syndrome in Adolescents. J. Pediatr. Endocrinol. Metab. 2016, 29, 1277–1283. [Google Scholar] [CrossRef]
- Simunovic, M.; Supe-Domic, D.; Karin, Z.; Degoricija, M.; Paradzik, M.; Bozic, J.; Unic, I.; Skrabic, V. Serum Catestatin Concentrations Are Decreased in Obese Children and Adolescents. Pediatr. Diabetes 2019, 20, 549–555. [Google Scholar] [CrossRef]
- Elshorbagy, H.H.; Fouda, E.R.; Kamal, N.M.; Bassiouny, M.M.; Fathi, W.M. Evaluation oF Epicardial Fat and Carotid Intima-Media Thickness in Obese Children. Iran. J. Pediatr. 2016, 26, e2968. [Google Scholar] [CrossRef]
- Stroescu, R.F.; Mărginean, O.; Bizerea, T.; Gafencu, M.; Voicu, A.; Doroș, G. Adiponectin, Leptin and High Sensitivity C-Reactive Protein Values in Obese Children—Important Markers for Metabolic Syndrome? J. Pediatr. Endocrinol. Metab. 2019, 32, 27–31. [Google Scholar] [CrossRef]
- Buyukinan, M.; Atar, M.; Can, U.; Pirgon, O.; Guzelant, A.; Deniz, I. The Association Between Serum Vaspin and Omentin-1 Levels in Obese Children with Metabolic Syndrome. Metab. Syndr. Relat. Disord. 2018, 16, 76–81. [Google Scholar] [CrossRef]
- Soriano-Guillén, L.; Hernández-García, B.; Pita, J.; Domínguez-Garrido, N.; Del Río-Camacho, G.; Rovira, A. High-Sensitivity C-Reactive Protein Is a Good Marker of Cardiovascular Risk in Obese Children and Adolescents. Eur. J. Endocrinol. 2008, 159, R1–R4. [Google Scholar] [CrossRef]
- Holst-Schumacher, I.; Nuñez-Rivas, H.; Monge-Rojas, R.; Barrantes-Santamaría, M. Components of the Metabolic Syndrome among a Sample of Overweight and Obese Costa Rican Schoolchildren. Food Nutr. Bull. 2009, 30, 161–170. [Google Scholar] [CrossRef]
- Aypak, C.; Türedi, Ö.; Bircan, M.A.; Yüce, A. Could Mean Platelet Volume among Complete Blood Count Parameters Be a Surrogate Marker of Metabolic Syndrome in Pre-Pubertal Children? Platelets 2014, 25, 393–398. [Google Scholar] [CrossRef] [PubMed]
- Aldhoon-Hainerová, I.; Hainer, V.; Zamrazilová, H. Impact of Dietary Intake, Lifestyle and Biochemical Factors on Metabolic Health in Obese Adolescents. Nutr. Metab. Cardiovasc. Dis. 2017, 27, 703–710. [Google Scholar] [CrossRef] [PubMed]
- Foster, C.; Smith, L.; Alemzadeh, R. Excess Serum Uric Acid Is Associated with Metabolic Syndrome in Obese Adolescent Patients. J. Diabetes Metab. Disord. 2020, 19, 535–543. [Google Scholar] [CrossRef] [PubMed]
- Kamal, N.N.; Ragy, M.M. The Effects of Exercise on C-Reactive Protein, Insulin, Leptin and Some Cardiometabolic Risk Factors in Egyptian Children with or without Metabolic Syndrome. Diabetol. Metab. Syndr. 2012, 4, 27. [Google Scholar] [CrossRef]
- Zhao, Y.; Yu, Y.; Li, H.; Li, M.; Zhang, D.; Guo, D.; Yu, X.; Lu, C.; Wang, H. The Association between Metabolic Syndrome and Biochemical Markers in Beijing Adolescents. Int. J. Environ. Res. Public Health 2019, 16, 4557. [Google Scholar] [CrossRef]
- Bilinski, W.J.; Stefanska, A.; Szternel, L.; Bergmann, K.; Siodmiak, J.; Krintus, M.; Paradowski, P.T.; Sypniewska, G. Relationships between Bone Turnover Markers and Factors Associated with Metabolic Syndrome in Prepubertal Girls and Boys. Nutrients 2022, 14, 1205. [Google Scholar] [CrossRef]
- Makni, E.; Moalla, W.; Benezzeddine-Boussaidi, L.; Lac, G.; Tabka, Z.; Elloumi, M. Correlation of Resistin with Inflammatory and Cardiometabolic Markers in Obese Adolescents with and without Metabolic Syndrome. Obes. Facts 2013, 6, 393–404. [Google Scholar] [CrossRef]
- Wani, K.; Khattak, M.N.K.; Saadawy, G.M.; Al-Attas, O.S.; Alokail, M.S.; Al-Daghri, N.M. Sex-Specific Cut-Offs of Single Point Insulin Sensitivity Estimator (SPISE) in Predicting Metabolic Syndrome in the Arab Adolescents. Diagnostics 2023, 13, 324. [Google Scholar] [CrossRef]
- Zhang, H.; Wang, L.; Li, S.; Liu, X.; Li, Y.; He, Y.; Man, Q.; Yang, L. Association of Iron Storage Markers with Metabolic Syndrome and Its Components in Chinese Rural 6–12 Years Old Children: The 2010–2012 China National Nutrition and Health Survey. Nutrients 2020, 12, 1486. [Google Scholar] [CrossRef]
- Invitti, C.; Maffeis, C.; Gilardini, L.; Pontiggia, B.; Mazzilli, G.; Girola, A.; Sartorio, A.; Morabito, F.; Viberti, G.C. Metabolic Syndrome in Obese Caucasian Children: Prevalence Using WHO-Derived Criteria and Association with Nontraditional Cardiovascular Risk Factors. Int. J. Obes. 2006, 30, 627–633. [Google Scholar] [CrossRef]
- Rigamonti, A.E.; Bollati, V.; Favero, C.; Albetti, B.; Caroli, D.; De Col, A.; Cella, S.G.; Sartorio, A. Changes in DNA Methylation of Clock Genes in Obese Adolescents after a Short-Term Body Weight Reduction Program: A Possible Metabolic and Endocrine Chrono-Resynchronization. Int. J. Environ. Res. Public Health 2022, 19, 15492. [Google Scholar] [CrossRef]
- Kelishadi, R.; Hashemipour, M.; Sarrafzadegan, N.; Mohammadifard, N.; Alikhasy, H.; Beizaei, M.; Sajjadi, F.; Poursafa, P.; Amin, Z.; Ghatreh-Samani, S.; et al. Effects of a Lifestyle Modification Trial among Phenotypically Obese Metabolically Normal and Phenotypically Obese Metabolically Abnormal Adolescents in Comparison with Phenotypically Normal Metabolically Obese Adolescents. Matern. Child Nutr. 2009, 6, 275–286. [Google Scholar] [CrossRef]
- Serbis, A.; Giapros, V.; Galli-Tsinopoulou, A.; Siomou, E. Metabolic Syndrome in Children and Adolescents: Is There a Universally Accepted Definition? Does It Matter? Metab. Syndr. Relat. Disord. 2020, 18, 462–470. [Google Scholar] [CrossRef]
- Christian Flemming, G.M.; Bussler, S.; Körner, A.; Kiess, W. Definition and Early Diagnosis of Metabolic Syndrome in Children. J. Pediatr. Endocrinol. Metab. 2020, 33, 821–833. [Google Scholar] [CrossRef]
- Fernández, J.R.; Redden, D.T.; Pietrobelli, A.; Allison, D.B. Waist Circumference Percentiles in Nationally Representative Samples of African-American, European-American, and Mexican-American Children and Adolescents. J Pediatr. 2004, 145, 439–444. [Google Scholar] [CrossRef]
- Cook, S.; Weitzman, M.; Auinger, P.; Nguyen, M.; Dietz, W.H. Prevalence of a Metabolic Syndrome Phenotype in Adolescents. Arch Pediatr Adolesc Med. 2003, 157, 821. [Google Scholar] [CrossRef]
- Kim, J.H.; Lim, J.S. The Association between C-Reactive Protein, Metabolic Syndrome, and Prediabetes in Korean Children and Adolescents. Ann. Pediatr. Endocrinol. Metab. 2022, 27, 273–280. [Google Scholar] [CrossRef]
- Xue, Q.; Yang, X.; Huang, Y.; Zhu, D.; Wang, Y.; Wen, Y.; Zhao, J.; Liu, Y.; Yang, C.-X.; Pan, J.; et al. Association between Baseline and Changes in High-Sensitive C-Reactive Protein and Metabolic Syndrome: A Nationwide Cohort Study and Meta-Analysis. Nutr. Metab. 2022, 19, 2. [Google Scholar] [CrossRef]
- Yeh, E.T.H. High-Sensitivity C-Reactive Protein as a Risk Assessment Tool for Cardiovascular Disease. Clin. Cardiol. 2005, 28, 408–412. [Google Scholar] [CrossRef]
- Li, R.; Xue, Y.; Wang, T.; Gong, L.; Peng, P.; Xiong, P.; Dai, M.; Shao, T.; Hu, Y.; Ye, X. A Comparison Study between Wide-range and High-sensitivity C-reactive Protein Assays (Roche Cobas C702) for Low C-reactive Protein Concentration in Patients with Cardiovascular Risk. J. Clin. Lab. Anal. 2019, 33, e2295. [Google Scholar] [CrossRef]
- Brindle, E.; Fujita, M.; Shofer, J.; O’Connor, K.A. Serum, Plasma, and Dried Blood Spot High-Sensitivity C-Reactive Protein Enzyme Immunoassay for Population Research. J. Immunol. Methods 2010, 362, 112–120. [Google Scholar] [CrossRef]
- Denegri, A.; Boriani, G. High Sensitivity C-Reactive Protein (HsCRP) and Its Implications in Cardiovascular Outcomes. Curr. Pharm. Des. 2021, 27, 263–275. [Google Scholar] [CrossRef]
- Wolska, A.; Remaley, A.T. CRP and High-Sensitivity CRP: “What’s in a Name?”. J. Appl. Lab. Med. 2022, 7, 1255–1258. [Google Scholar] [CrossRef]
- Nicoară, D.-M.; Munteanu, A.-I.; Scutca, A.-C.; Mang, N.; Juganaru, I.; Brad, G.-F.; Mărginean, O. Assessing the Relationship between Systemic Immune-Inflammation Index and Metabolic Syndrome in Children with Obesity. Int. J. Mol. Sci. 2023, 24, 8414. [Google Scholar] [CrossRef]
- Flynn, F. V Screening for Presymptomatic Disease. J. Clin. Pathol. 1991, 44, 529–538. [Google Scholar] [CrossRef]
- Haverinen, E.; Paalanen, L.; Palmieri, L.; Padron-Monedero, A.; Noguer-Zambrano, I.; Sarmiento Suárez, R.; Tolonen, H. Comparison of Metabolic Syndrome Prevalence Using Four Different Definitions—A Population-Based Study in Finland. Arch. Public Health 2021, 79, 231. [Google Scholar] [CrossRef]
- Bitew, Z.W.; Alemu, A.; Ayele, E.G.; Tenaw, Z.; Alebel, A.; Worku, T. Metabolic Syndrome among Children and Adolescents in Low and Middle Income Countries: A Systematic Review and Meta-Analysis. Diabetol. Metab. Syndr. 2020, 12, 93. [Google Scholar] [CrossRef]
- Khanna, D.; Khanna, S.; Khanna, P.; Kahar, P.; Patel, B.M. Obesity: A Chronic Low-Grade Inflammation and Its Markers. Cureus 2022, 14, e22711. [Google Scholar] [CrossRef]
- Cura–Esquivel, I.; Perales-Quintana, M.M.; Torres-González, L.; Guzmán-Avilán, K.; Muñoz-Espinosa, L.; Cordero-Pérez, P. Metabolic, Inflammatory and Adipokine Differences on Overweight/Obese Children with and without Metabolic Syndrome: A Cross-Sectional Study. PLoS ONE 2023, 18, e0281381. [Google Scholar] [CrossRef]
- Monteiro, R.; Azevedo, I. Chronic Inflammation in Obesity and the Metabolic Syndrome. Mediat. Inflamm. 2010, 2010, 289645. [Google Scholar] [CrossRef]
- Welsh, P.; Polisecki, E.; Robertson, M.; Jahn, S.; Buckley, B.M.; de Craen, A.J.M.; Ford, I.; Jukema, J.W.; Macfarlane, P.W.; Packard, C.J.; et al. Unraveling the Directional Link between Adiposity and Inflammation: A Bidirectional Mendelian Randomization Approach. J. Clin. Endocrinol. Metab. 2010, 95, 93–99. [Google Scholar] [CrossRef] [PubMed]
- Ouchi, N.; Kihara, S.; Funahashi, T.; Nakamura, T.; Nishida, M.; Kumada, M.; Okamoto, Y.; Ohashi, K.; Nagaretani, H.; Kishida, K.; et al. Reciprocal Association of C-Reactive Protein With Adiponectin in Blood Stream and Adipose Tissue. Circulation 2003, 107, 671–674. [Google Scholar] [CrossRef] [PubMed]
- den Engelsen, C.; Koekkoek, P.S.; Gorter, K.J.; van den Donk, M.; Salome, P.L.; Rutten, G.E. High-Sensitivity C-Reactive Protein to Detect Metabolic Syndrome in a Centrally Obese Population: A Cross-Sectional Analysis. Cardiovasc. Diabetol. 2012, 11, 25. [Google Scholar] [CrossRef] [PubMed]


| Study | Country | Number of Subjects Included | With MetS | Controls with Obesity | Controls without Obesity | Quality Assessment (NOS) | ||
|---|---|---|---|---|---|---|---|---|
| Total | Females | Males | ||||||
| Kitsios et al., 2013 [33] | Greece | 144 | 64 | 80 | 21 | 83 | 40 | 8 |
| Matraguna et al., 2021 [34] | Republic of Moldova | 74 | - | - | 24 | - | 50 | 7 |
| Eren et al., 2014 a * [35] | Turkey | 94 | 44 | 50 | 30 | 31 | 33 | 8 |
| Siurana et al., 2022 [36] | Spain | 67 | - | - | 14 | - | 53 | 7 |
| Eren et al., 2014 b * [37] | Turkey | 96 | 40 | 56 | 40 | - | 56 | 8 |
| Can et al., 2016 [38] | Turkey | 86 | 38 | 58 | 43 | - | 43 | 8 |
| Simunovic et al., 2019 [39] | Croatia | 131 | 70 | 61 | 31 | 61 | 39 | 8 |
| Elshorbagy et al., 2016 [40] | Egypt | 60 | - | - | 22 | 38 | - | 8 |
| Stroescu et al., 2018 [41] | Romania | 122 | 49 | 73 | 32 | 92 | - | 8 |
| Buyukinan et al., 2018 [42] | Turkey | 121 | 42 | 79 | 45 | 76 | - | 8 |
| Soriano-Guillen et al., 2008 [43] | Spain | 115 | - | - | 28 | 87 | - | 8 |
| Holst-Schumacher et al., 2009 [44] | Costa Rica | 214 | 110 | 104 | 12 | 202 | - | 8 |
| Aypak et al., 2014 [45] | Turkey | 205 | - | - | 28 | 177 | - | 8 |
| Aldhoon-Hainerová et al., 2017 [46] | Czech Republic | 442 | 188 | 254 | 100 | 342 | - | 7 |
| Foster et al., 2020 [47] | United States of America | 100 | 43 | 57 | 30 | 70 | - | 8 |
| Kamal et al., 2012 [48] | Egypt | 93 | 53 | 40 | 12 | 32 | 49 | 8 |
| Zhao et al., 2019 [49] | China | 1766 | 871 | 895 | 59 | - | 1707 | 8 |
| Bilinski et al., 2022 [50] | Poland | 115 | 54 | 61 | 26 | - | 81 | 9 |
| Makni et al., 2013 [51] | Tunisia | 151 | 76 | 75 | 54 | 60 | 37 | 9 |
| Wani et al., 2023 [52] | Saudi Arabia | 951 | 503 | 448 | 82 | - | 869 | 8 |
| Zhang et al., 2020 [53] | China | 738 | - | - | 13 | - | 725 | 9 |
| Invitti et al., 2006 [54] | Italy | 206 | - | - | 47 | 159 | 8 | |
| Rigamonti et al., 2022 [55] | Italy | 45 | 17 | 28 | 17 | 28 | - | 8 |
| Kelishadi et al., 2009 [56] | Iran | 240 | - | - | 120 | 120 | - | 7 |
| Study | Criteria Used to Diagnose Metabolic Syndrome |
|---|---|
| Kitsios et al., 2013 [33] | Modified Cook criteria: • Fasting glucose levels > 100 mg/dL • Waist circumference values were plotted based on the centiles established by Fernandez et al. [59] for US children and adolescents of European origin, since there are no published reference data for the Greek population • Elevated systolic and diastolic blood pressure ≥ 90th percentile for age, sex, and height or previously diagnosed hypertension • Triglycerides ≥ 110 mg/dL (≥1.24 mmol/L) • HDL-cholesterol ≤ 40 mg/dL (≤1.03 mmol/L) |
| Matraguna et al., 2021 [34] | IDF criteria (2007): • Central obesity (WC): ≥90th percentile or adult cutoff if lower and at least two of the following criteria • Triglycerides ≥ 1.7 mmol/L (≥150 mg/dL) • HDL-cholesterol < 1.03 mmol/L (<40 mg/dL) • Blood pressure: systolic BP ≥ 130 or diastolic BP ≥ 85 mmHg (or treatment of previously diagnosed hypertension) • Fasting plasma glucose ≥ 5.6 mmol/L (100 mg/dL) (or previously diagnosed type 2 diabetes) |
| Eren et al., 2014 a [35] | IDF criteria: • Central obesity (WC) and at least two of the following criteria • Triglycerides ≥ 1.7 mmol/L (150 mg/dL) • HDL-cholesterol < 1.03 mmol/L (40 mg/dL) in males and <1.29 mmol/L (50 mg/dL) in females (or specific treatment for these lipid abnormalities) • Blood pressure: systolic BP ≥ 130 or diastolic BP ≥ 85 mmHg (or treatment of previously diagnosed hypertension) • Fasting plasma glucose ≥ 5.6 mmol/L (100 mg/dL) (or previously diagnosed type 2 diabetes) |
| Siurana et al., 2022 [36] | Cook et al. [60]: • Waist circumference ≥ 90th percentile for age and sex • Elevated systolic and diastolic blood pressure ≥ 90th percentile for age, sex, and height or previously diagnosed hypertension • Fasting glucose levels ≥ 110 mg/dL (≥6.1 mmol/L) • Triglycerides ≥ 110 mg/dL (≥1.24 mmol/L) • HDL-cholesterol ≤ 40 mg/dL (≤1.03 mmol/L) |
| Eren et al., 2014 b [37] | IDF criteria: • Central obesity (WC) and at least two of the following criteria • Triglycerides ≥ 1.7 mmol/L (≥150 mg/dL) • HDL-cholesterol < 1.03 mmol/L (<40 mg/dL) and <1.29 mmol/L (50 mg/dL) in females (or specific treatment for these lipid abnormalities) • Blood pressure: systolic BP ≥ 130 or diastolic BP ≥ 85 mmHg (or treatment of previously diagnosed hypertension) • Fasting plasma glucose ≥ 5.6 mmol/L (100 mg/dL) (or previously diagnosed type 2 diabetes) |
| Can et al., 2016 [38] | IDF criteria: • Central obesity (WC) and at least two of the following criteria • Triglycerides ≥ 1.7 mmol/L (≥150 mg/dL) • HDL-cholesterol < 1.03 mmol/L (<40 mg/dL) and <1.29 mmol/L (50 mg/dL) in females (or specific treatment for these lipid abnormalities) • Blood pressure: systolic BP ≥ 130 or diastolic BP ≥ 85 mmHg (or treatment of previously diagnosed hypertension) Fasting plasma glucose ≥ 5.6 mmol/L (100 mg/dL) (or previously diagnosed type 2 diabetes) |
| Simunovic et al., 2019 [39] | IDF criteria (2007): • Central obesity (WC): ≥90th percentile or adult cutoff if lower (from 10 to 16 years old) • WC >80 cm for women and >94 cm for men (>16 years old) and at least two of the following criteria • Triglycerides ≥ 1.7 mmol/L (≥150 mg/dL) • HDL-cholesterol <1.03 mmol/L (<40 mg/dL) • Blood pressure: systolic BP ≥ 130 or diastolic BP ≥ 85 mmHg (or treatment of previously diagnosed hypertension) • Fasting plasma glucose ≥ 5.6 mmol/L (100 mg/dL) (or previously diagnosed type 2 diabetes) |
| Elshorbagy et al., 2016 [40] | IDF criteria: • Central obesity and at least two of the following criteria • Triglycerides ≥ 1.7 mmol/L (≥150 mg/dL) • HDL-cholesterol < 1.03 mmol/L (<40 mg/dL) and <1.29 mmol/L (50 mg/dL) in females (or specific treatment for these lipid abnormalities) • Blood pressure: systolic BP ≥ 130 or diastolic BP ≥ 85 mmHg (or treatment of previously diagnosed hypertension) Fasting plasma glucose ≥ 5.6 mmol/L (100 mg/dL) (or previously diagnosed type 2 diabetes) |
| Stroescu et al., 2018 [41] | Weiss et al.: • Obesity and at least two of the following criteria • Triglycerides above the 95th percentile • HDLc under the 5th percentile adjusted for age and sex • Elevated systolic and diastolic blood pressure values that exceed the 95th percentile for age and sex • Glycemia (oral glucose tolerance test (OGTT)) of 140–200 mg/dL |
| Buyukinan et al., 2018 [42] | IDF criteria: • Central obesity: WC ≥ 90th percentile or adult cutoff if lower and at least two of the following criteria • Triglycerides ≥ 1.7 mmol/L (150 mg/dL) • HDL-cholesterol < 1.03 mmol/L (40 mg/dL) in males and <1.29 mmol/L (50 mg/dL) in females (or specific treatment for these lipid abnormalities) • Blood pressure: systolic BP ≥ 130 or diastolic BP ≥ 85 mmHg (or treatment of previously diagnosed hypertension) Fasting plasma glucose ≥ 5.6 mmol/L (100 mg/dL) (or previously diagnosed type 2 diabetes) |
| Soriano-Guillen et al., 2008 [43] | • Obesity: BMI > 2 SDS for age and sex according to Spanish BMI data and at least two of the following criteria • HDL-cholesterol < 5th percentile • Triglycerides > 95th percentile for age and sex • Diastolic and/or systolic blood pressure higher than 95th percentile for age, sex, and height • Alteration in glucose metabolism according to criteria of the American Society of Diabetes (fasting plasma glucose ≥ 5.6 mmol/L (100 mg/dL)) |
| Holst-Schumacher et al., 2009 [44] | Tapia-Ceballos criteria: • Triglycerides ≥ 110 mg/dL (≥1.24 mmol/L) • HDL-cholesterol < 40mg/dL (<1.03 mmol/L) • Fasting glucose (≥5.55 mmol/L) • Waist circumference ≥ 90th percentile for age and sex • Elevated blood pressure ≥ 90th percentile for age, sex, and height |
| Aypak et al., 2014 [45] | National Cholesterol Education Program Adult Treatment Panel III: • Abdominal obesity (waist circumference): >102 cm in men and >88 cm in women • Triglycerides ≥ 150 mg/dL • HDL-cholesterol: <40 mg/dL in men and <50 mg/dL in women • Blood pressure: ≥130/≥85 mmHg • Fasting plasma glucose ≥ 110 mg/dL |
| Aldhoon-Hainerová et al., 2017 [46] | IDF criteria:• Obesity (BMI > 97 percentile; waist circumference 10–16 years: ≥ 90.0 percentile or adult 25 cutoff if lower; >16 years: ≥ 94 cm for boys and ≥ 80 cm for girls) and at least two of the following criteria • Triglycerides ≥ 1.7 mmol/L (≥150 mg/dL) • HDL-cholesterol < 1.03 mmol/L (<40 mg/dL) for individuals 13–15.9 years and boys ≥ 16 years and <1.29 mmol/L (50 mg/dL) in girls ≥16 years • Blood pressure: systolic BP ≥ 130 or diastolic BP ≥ 85 mmHg (or treatment of previously diagnosed hypertension) • Fasting plasma glucose ≥ 5.6 mmol/L (100 mg/dL) (or previously diagnosed type 2 diabetes) |
| Foster et al., 2020 [47] | IDF criteria: • Central obesity (defined as a waist circumference > 95th percentile) and at least two of the following criteria • Triglycerides ≥ 150 mg/dL • HDL-C < 40 mg/dL in males or < 50 mg/dL in females • blood pressure: BP > 95th percentile based on height, age, and gender • Fasting plasma glucose >100 mg/dL |
| Kamal et al., 2012 [48] | National Cholesterol Education Program Adult Treatment Panel III: • BMI >85th percentile • Triglycerides ≥ 110 mg/dL • HDL-cholesterol: < 40 mg/dL • Systolic or diastolic blood pressure (>90th percentile) • Fasting plasma glucose ≥ 110 mg/dL |
| Zhao et al., 2019 [49] | Central obesity + 2 other conditions: • Central obesity as measured using the WHtR was adopted in this study (≥ 0.46 for girls and ≥ 0.48 for boys) • Triglycerides ≥ 110 mg/dL (>1.47 mmol/L) • HDL-cholesterol: < 40 mg/dL (1.03 mmol/L) • Systolic blood pressure ≥ 130 mmHg or diastolic blood pressure ≥ 85 mmHg • Fasting plasma glucose ≥ 100 mg/dL (5.6 mmol/L) |
| Bilinski et al., 2022 [50] | National Cholesterol Education Program Adult Treatment Panel III: • Waist circumference ≥ 90th percentile of WC by sex and age for European population • Triglycerides ≥ 110 mg/dL • HDL-cholesterol: <40 mg/dL • Systolic or diastolic blood pressure (>90th percentile) • Fasting plasma glucose ≥ 100 mg/dL |
| Makni et al., 2013 [51] | IDF criteria: • Waist circumference ≥ 90th percentile and at least two of the following criteria • Triglycerides ≥ 1.7 mmol/L (≥150 mg/dL) • HDL-cholesterol <1.03 mmol/L (<40 mg/dL) • Blood pressure: systolic BP ≥ 130 or diastolic BP ≥ 85 mmHg • Fasting plasma glucose ≥ 5.6 mmol/L (100 mg/dL) |
| Wani et al., 2023 [52] | Cook et. al.: • Elevated waist circumference: age-specific waist circumference of ≥90th percentile • Elevated blood pressure: age-specific systolic or diastolic blood pressure of ≥90th percentile • Elevated fasting glucose: fasting glucose level of ≥6.1 mmol/L • Elevated triglycerides: circulating triglyceride levels of ≥1.24 mmol/L for age 10–15 years and ≥1.7 mmol/L for age ≥16 years • Low HDL-cholesterol: circulating HDL-cholesterol level of ≤1.03 mmol/L |
| Zhang et al., 2020 [53] | IDF and AAP modified criteria (3 or more): • Obesity: waist ≥ 95th percentile of children of the same age and gender, or BMI ≥ 95th percentile of children of the same age and gender • Dyslipidemia: (a) reduced HDL-C (<1.03 mmol/L) or (b) elevated TG (≥1.47 mmol/L) • Hypertension: blood pressure ≥95th percentile of children of the same age and gender (fast identified: systolic BP ≥120 mmHg or diastolic BP ≥80 mmHg) • Hyperglycemia: fasting glucose ≥ 5.6 mmol/L |
| Invitti et al., 2006 [54] | WHO adult definition with modifications for children: • Glucose intolerance and 2 or more criteria • Triglycerides >95th percentile of controls • HDL-cholesterol < 5th percentile • Systolic or diastolic blood pressure > 95th percentile • Waist circumference or BMI >97th percentile of controls |
| Rigamonti et al., 2022 [55] | IDF criteria: • Waist circumference ≥ 90th percentile for ages <16 years and ≥94 cm for males and ≥80 cm for female for ages >16 years and at least two of the following criteria • Triglycerides ≥ 1.7 mmol/L (≥150 mg/dL) for ages < 16 years and the same cutoff or specific treatment for this lipid abnormality for ages > 16 years • HDL-cholesterol < 1.03 mmol/L (<40 mg/dL) for males and females for ages < 16 years and <40 mg/dL for males and <50 mg/dL (1.29 mmol/L) for females or specific treatment for this lipid abnormality for ages > 16 years • Blood pressure: systolic BP ≥ 130 or diastolic BP ≥ 85 mmHg for ages < 16 years and the same cutoff or treatment of previously diagnosed hypertension for ages > 16 years • Fasting plasma glucose ≥ 5.6 mmol/L (100 mg/dL) or previously diagnosed type 2 diabetes mellitus for all ages |
| Kelishadi et al., 2010 [56] | IDF criteria: • waist circumference ≥ 90th percentile and at least two of the following criteria • Triglycerides ≥ 1.7 mmol/L (≥150 mg/dL) • HDL-cholesterol < 1.03 mmol/L (<40 mg/dL) • Blood pressure: systolic BP ≥ 130 or diastolic BP ≥ 85 mmHg • Fasting plasma glucose ≥ 5.6 mmol/L (100 mg/dL) |
Disclaimer/Publisher’s Note: The statements, opinions and data contained in all publications are solely those of the individual author(s) and contributor(s) and not of MDPI and/or the editor(s). MDPI and/or the editor(s) disclaim responsibility for any injury to people or property resulting from any ideas, methods, instructions or products referred to in the content. |
© 2023 by the authors. Licensee MDPI, Basel, Switzerland. This article is an open access article distributed under the terms and conditions of the Creative Commons Attribution (CC BY) license (https://creativecommons.org/licenses/by/4.0/).
Share and Cite
Podeanu, M.-A.; Turcu-Stiolica, A.; Subțirelu, M.S.; Stepan, M.D.; Ionele, C.-M.; Gheonea, D.-I.; Vintilescu, B.Ș.; Sandu, R.E. C-Reactive Protein as a Marker of Inflammation in Children and Adolescents with Metabolic Syndrome: A Systematic Review and Meta-Analysis. Biomedicines 2023, 11, 2961. https://doi.org/10.3390/biomedicines11112961
Podeanu M-A, Turcu-Stiolica A, Subțirelu MS, Stepan MD, Ionele C-M, Gheonea D-I, Vintilescu BȘ, Sandu RE. C-Reactive Protein as a Marker of Inflammation in Children and Adolescents with Metabolic Syndrome: A Systematic Review and Meta-Analysis. Biomedicines. 2023; 11(11):2961. https://doi.org/10.3390/biomedicines11112961
Chicago/Turabian StylePodeanu, Mihaela-Andreea, Adina Turcu-Stiolica, Mihaela Simona Subțirelu, Mioara Desdemona Stepan, Claudiu-Marinel Ionele, Dan-Ionuț Gheonea, Bianca Ștefănița Vintilescu, and Raluca Elena Sandu. 2023. "C-Reactive Protein as a Marker of Inflammation in Children and Adolescents with Metabolic Syndrome: A Systematic Review and Meta-Analysis" Biomedicines 11, no. 11: 2961. https://doi.org/10.3390/biomedicines11112961