
Gene Signature Associated with Nervous System in an Experimental Radiation- and Estrogen-Induced Breast Cancer Model


Abstract
:
1. Introduction
2. Materials and Methods
2.1. Cell Lines
2.2. Irradiation
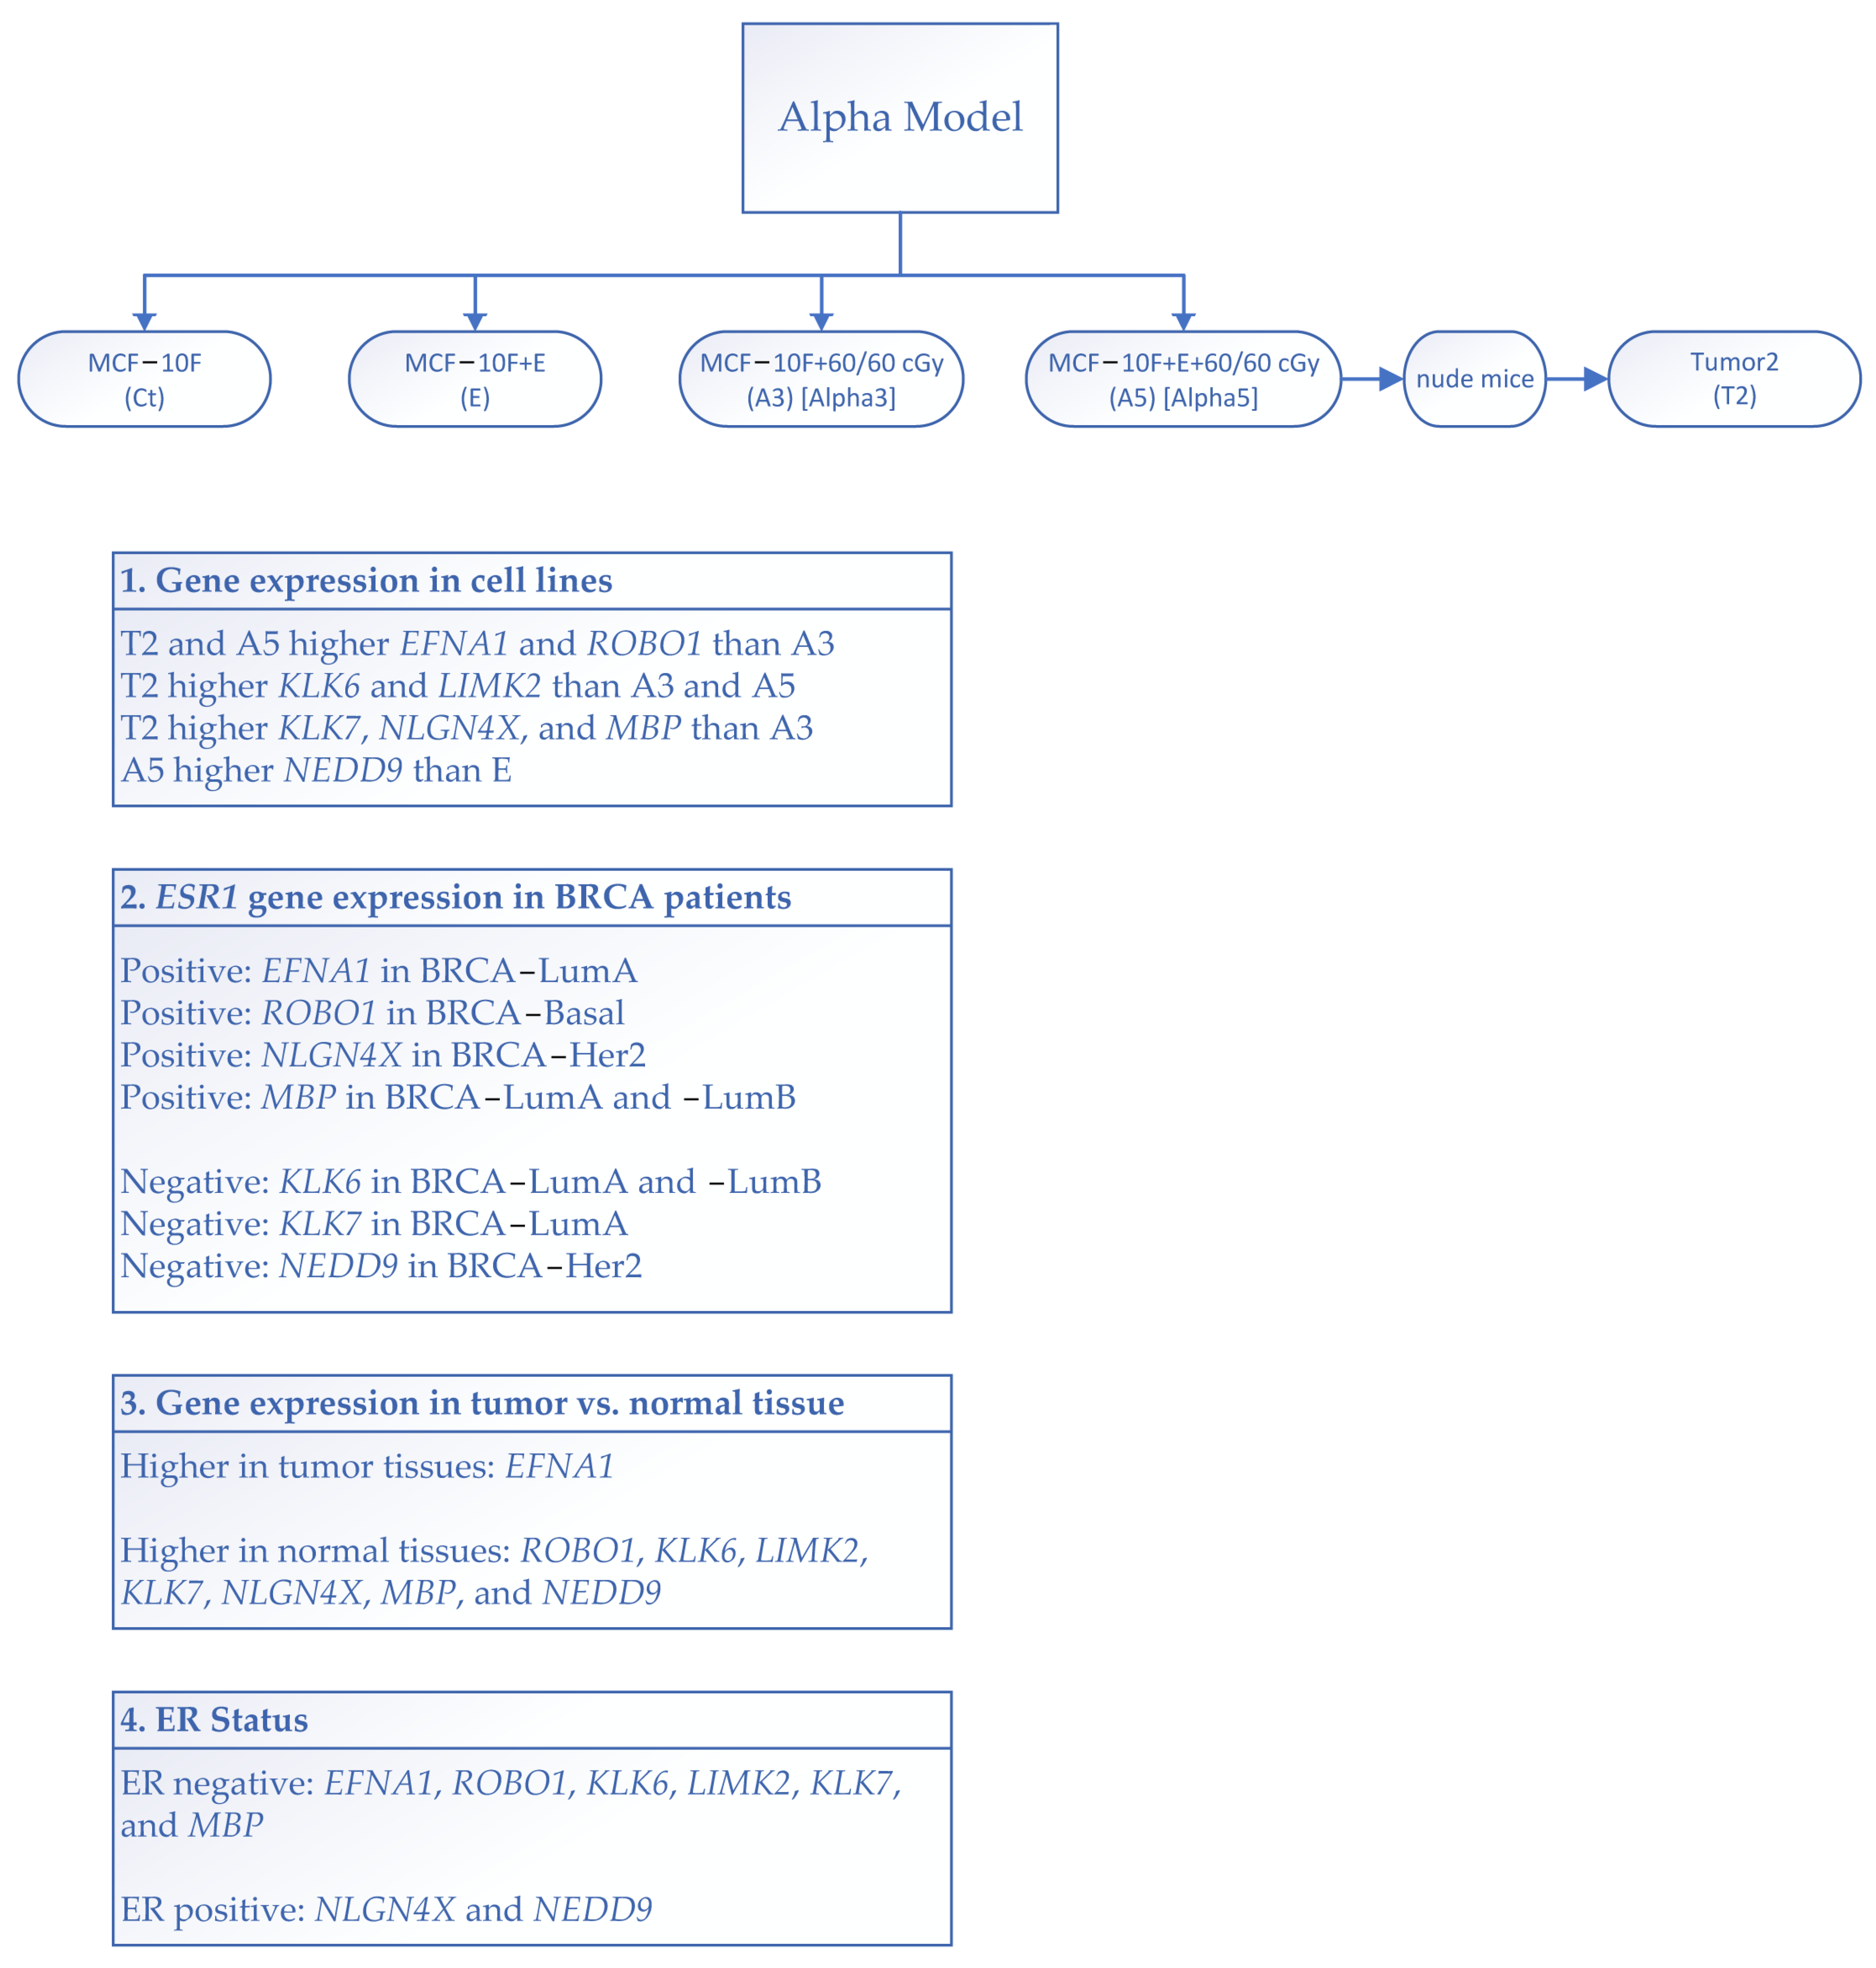
2.3. Alpha-Model
2.4. Preparation of Fluorescence-Labeled Probes for Microarray Analysis
2.5. Analysis of Microarray Gene Expression Using the Affymetrix HG-U133A Plus 2.0 GeneChip
2.6. Bioinformatic Gene Expression Analysis and Statistical Analysis
3. Results
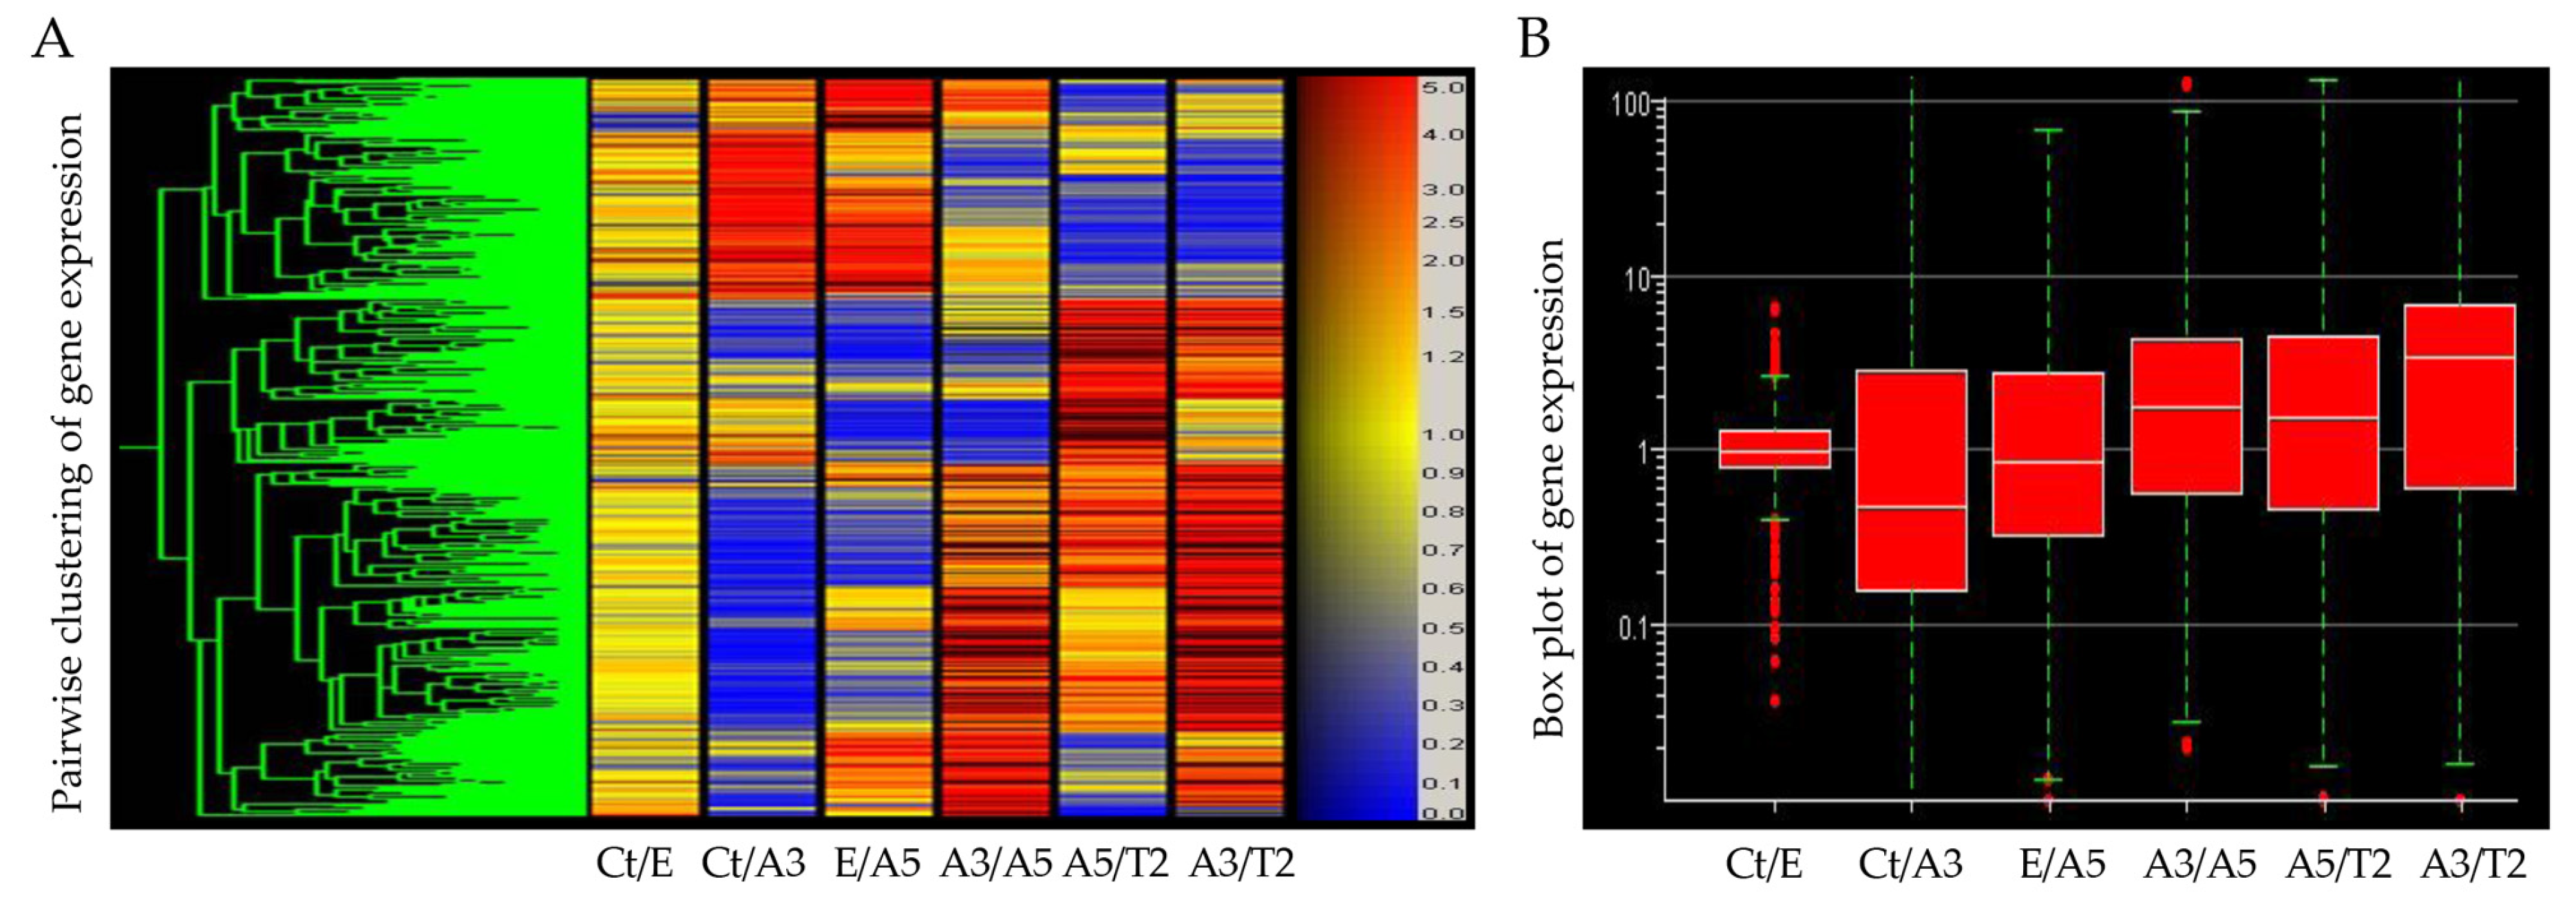
3.1. Gene Expression Induced via Radiation and Estrogen
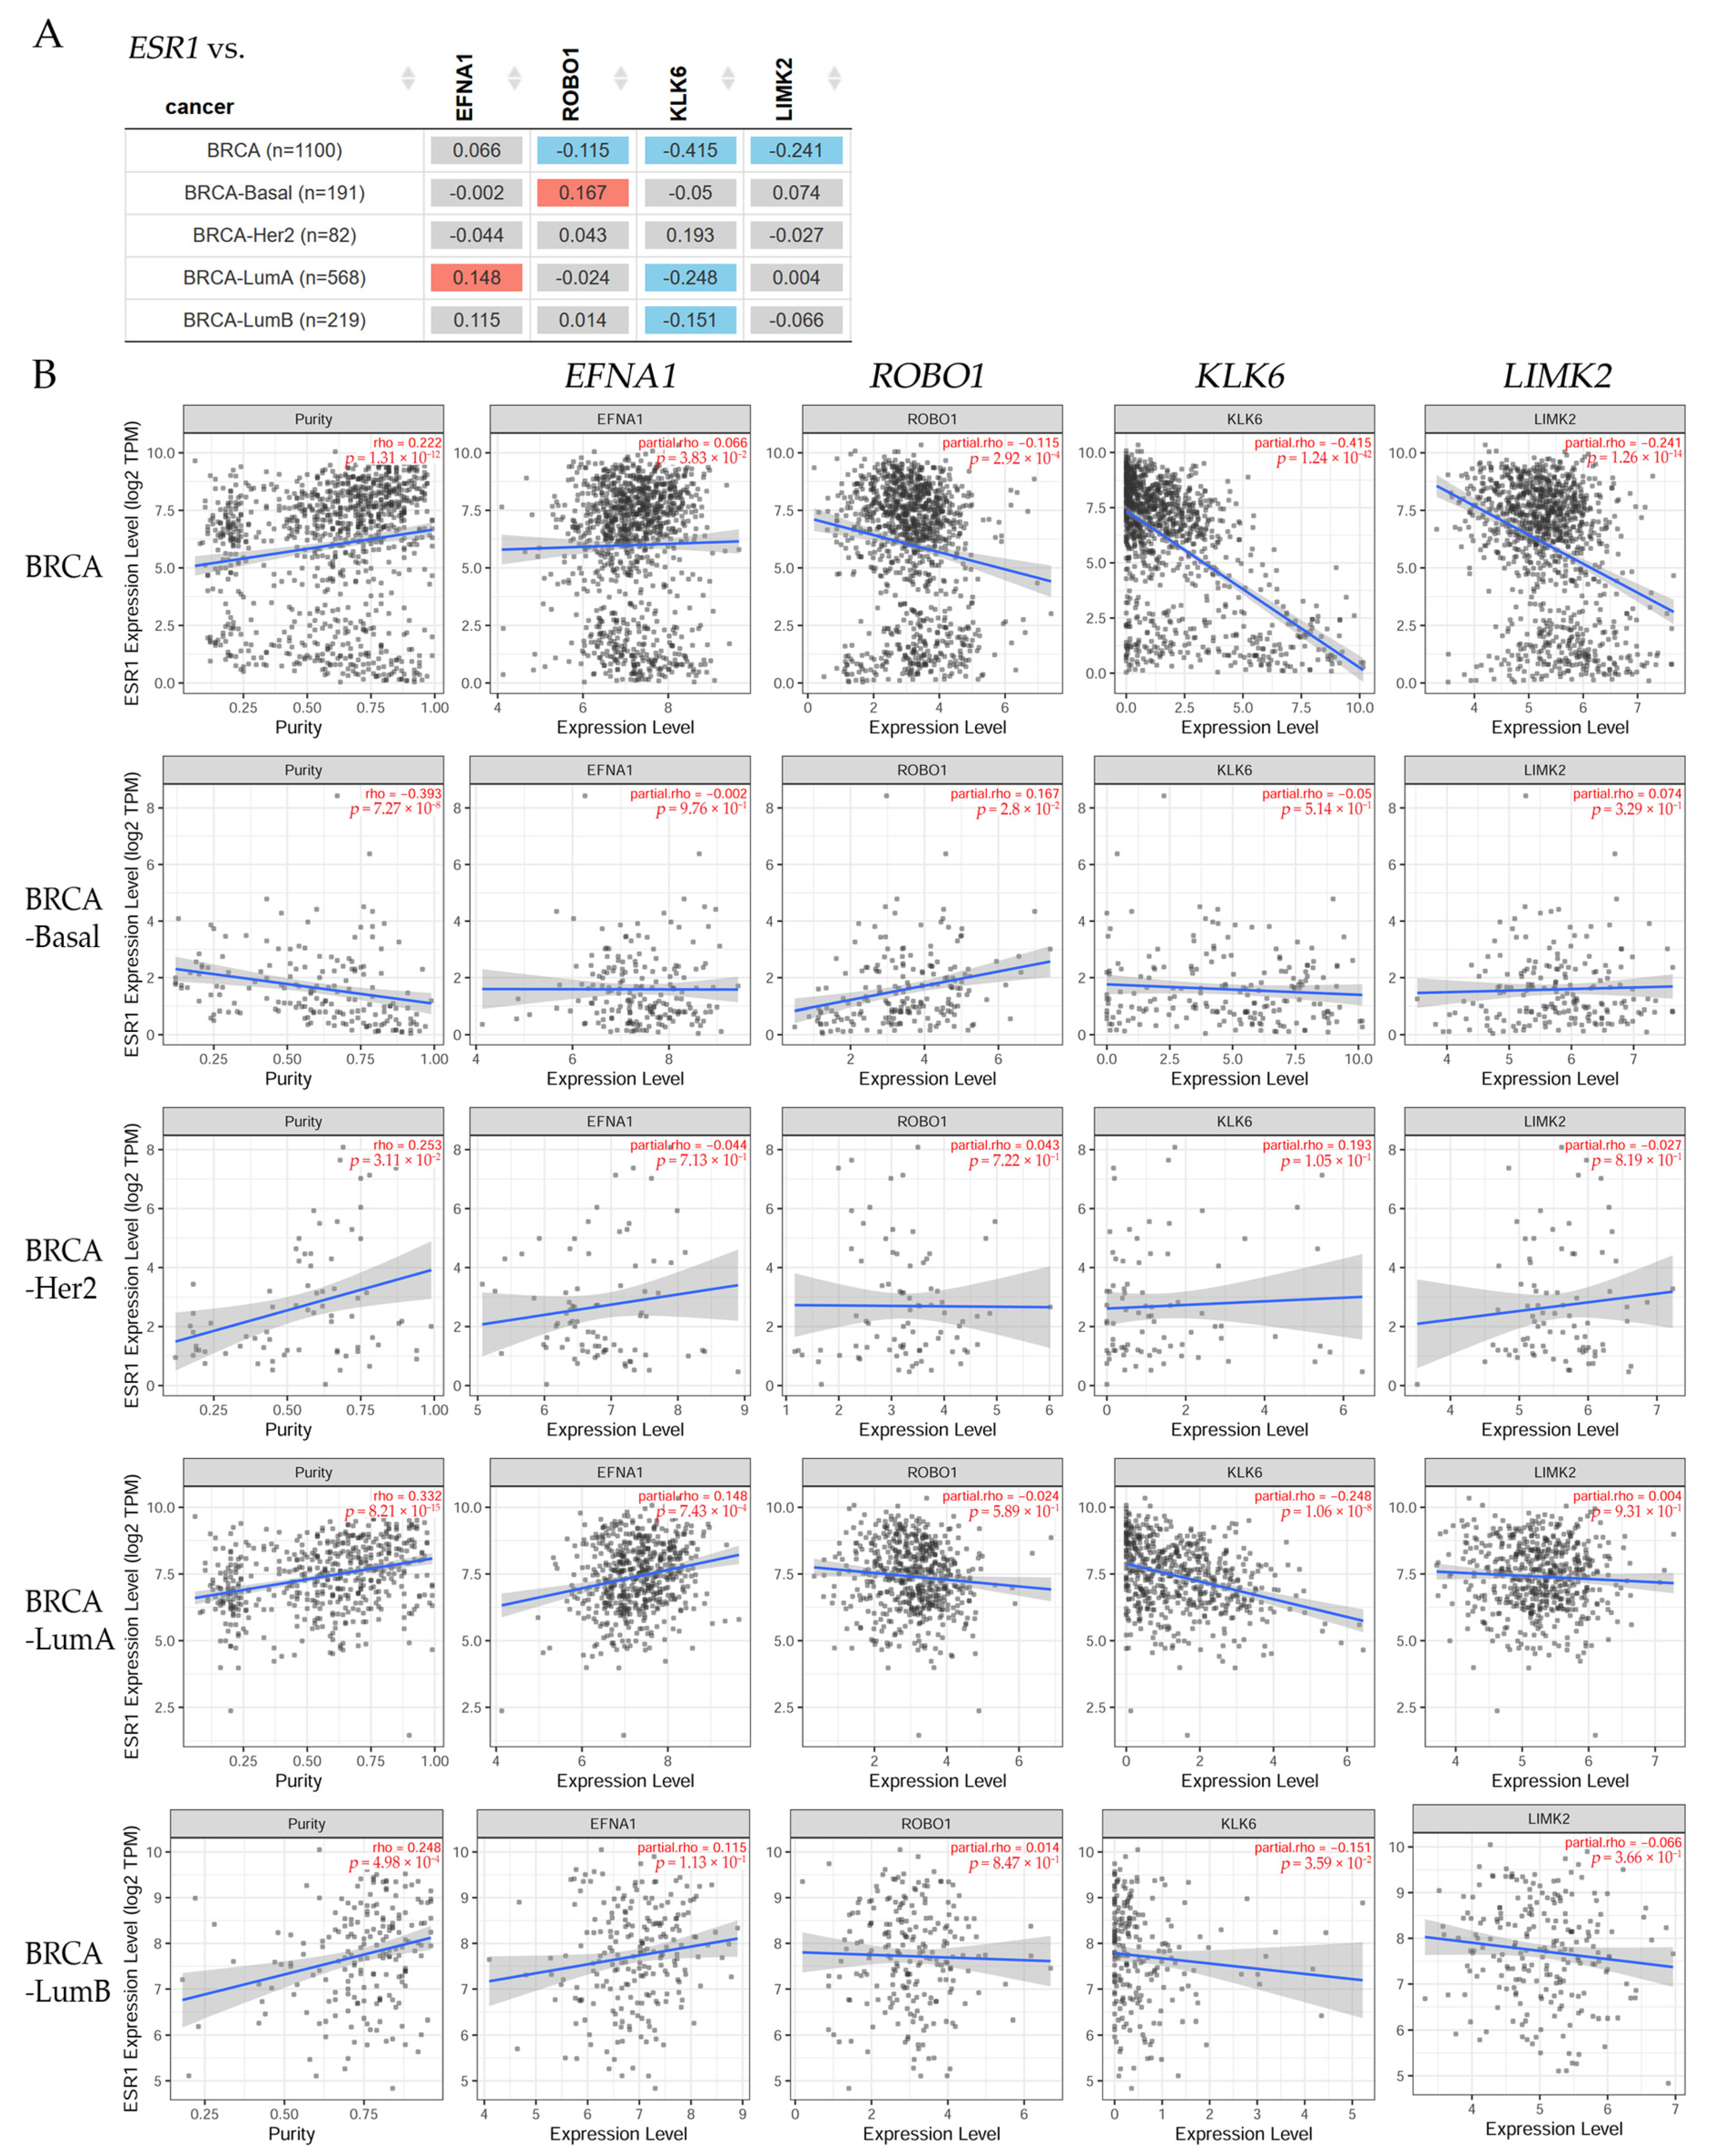
3.2. Correlation between ERα and Nervous System Genes in BRCA Patients
3.3. Differential Gene Expression Levels between Tumor and Normal Tissues across Various Cancer Types
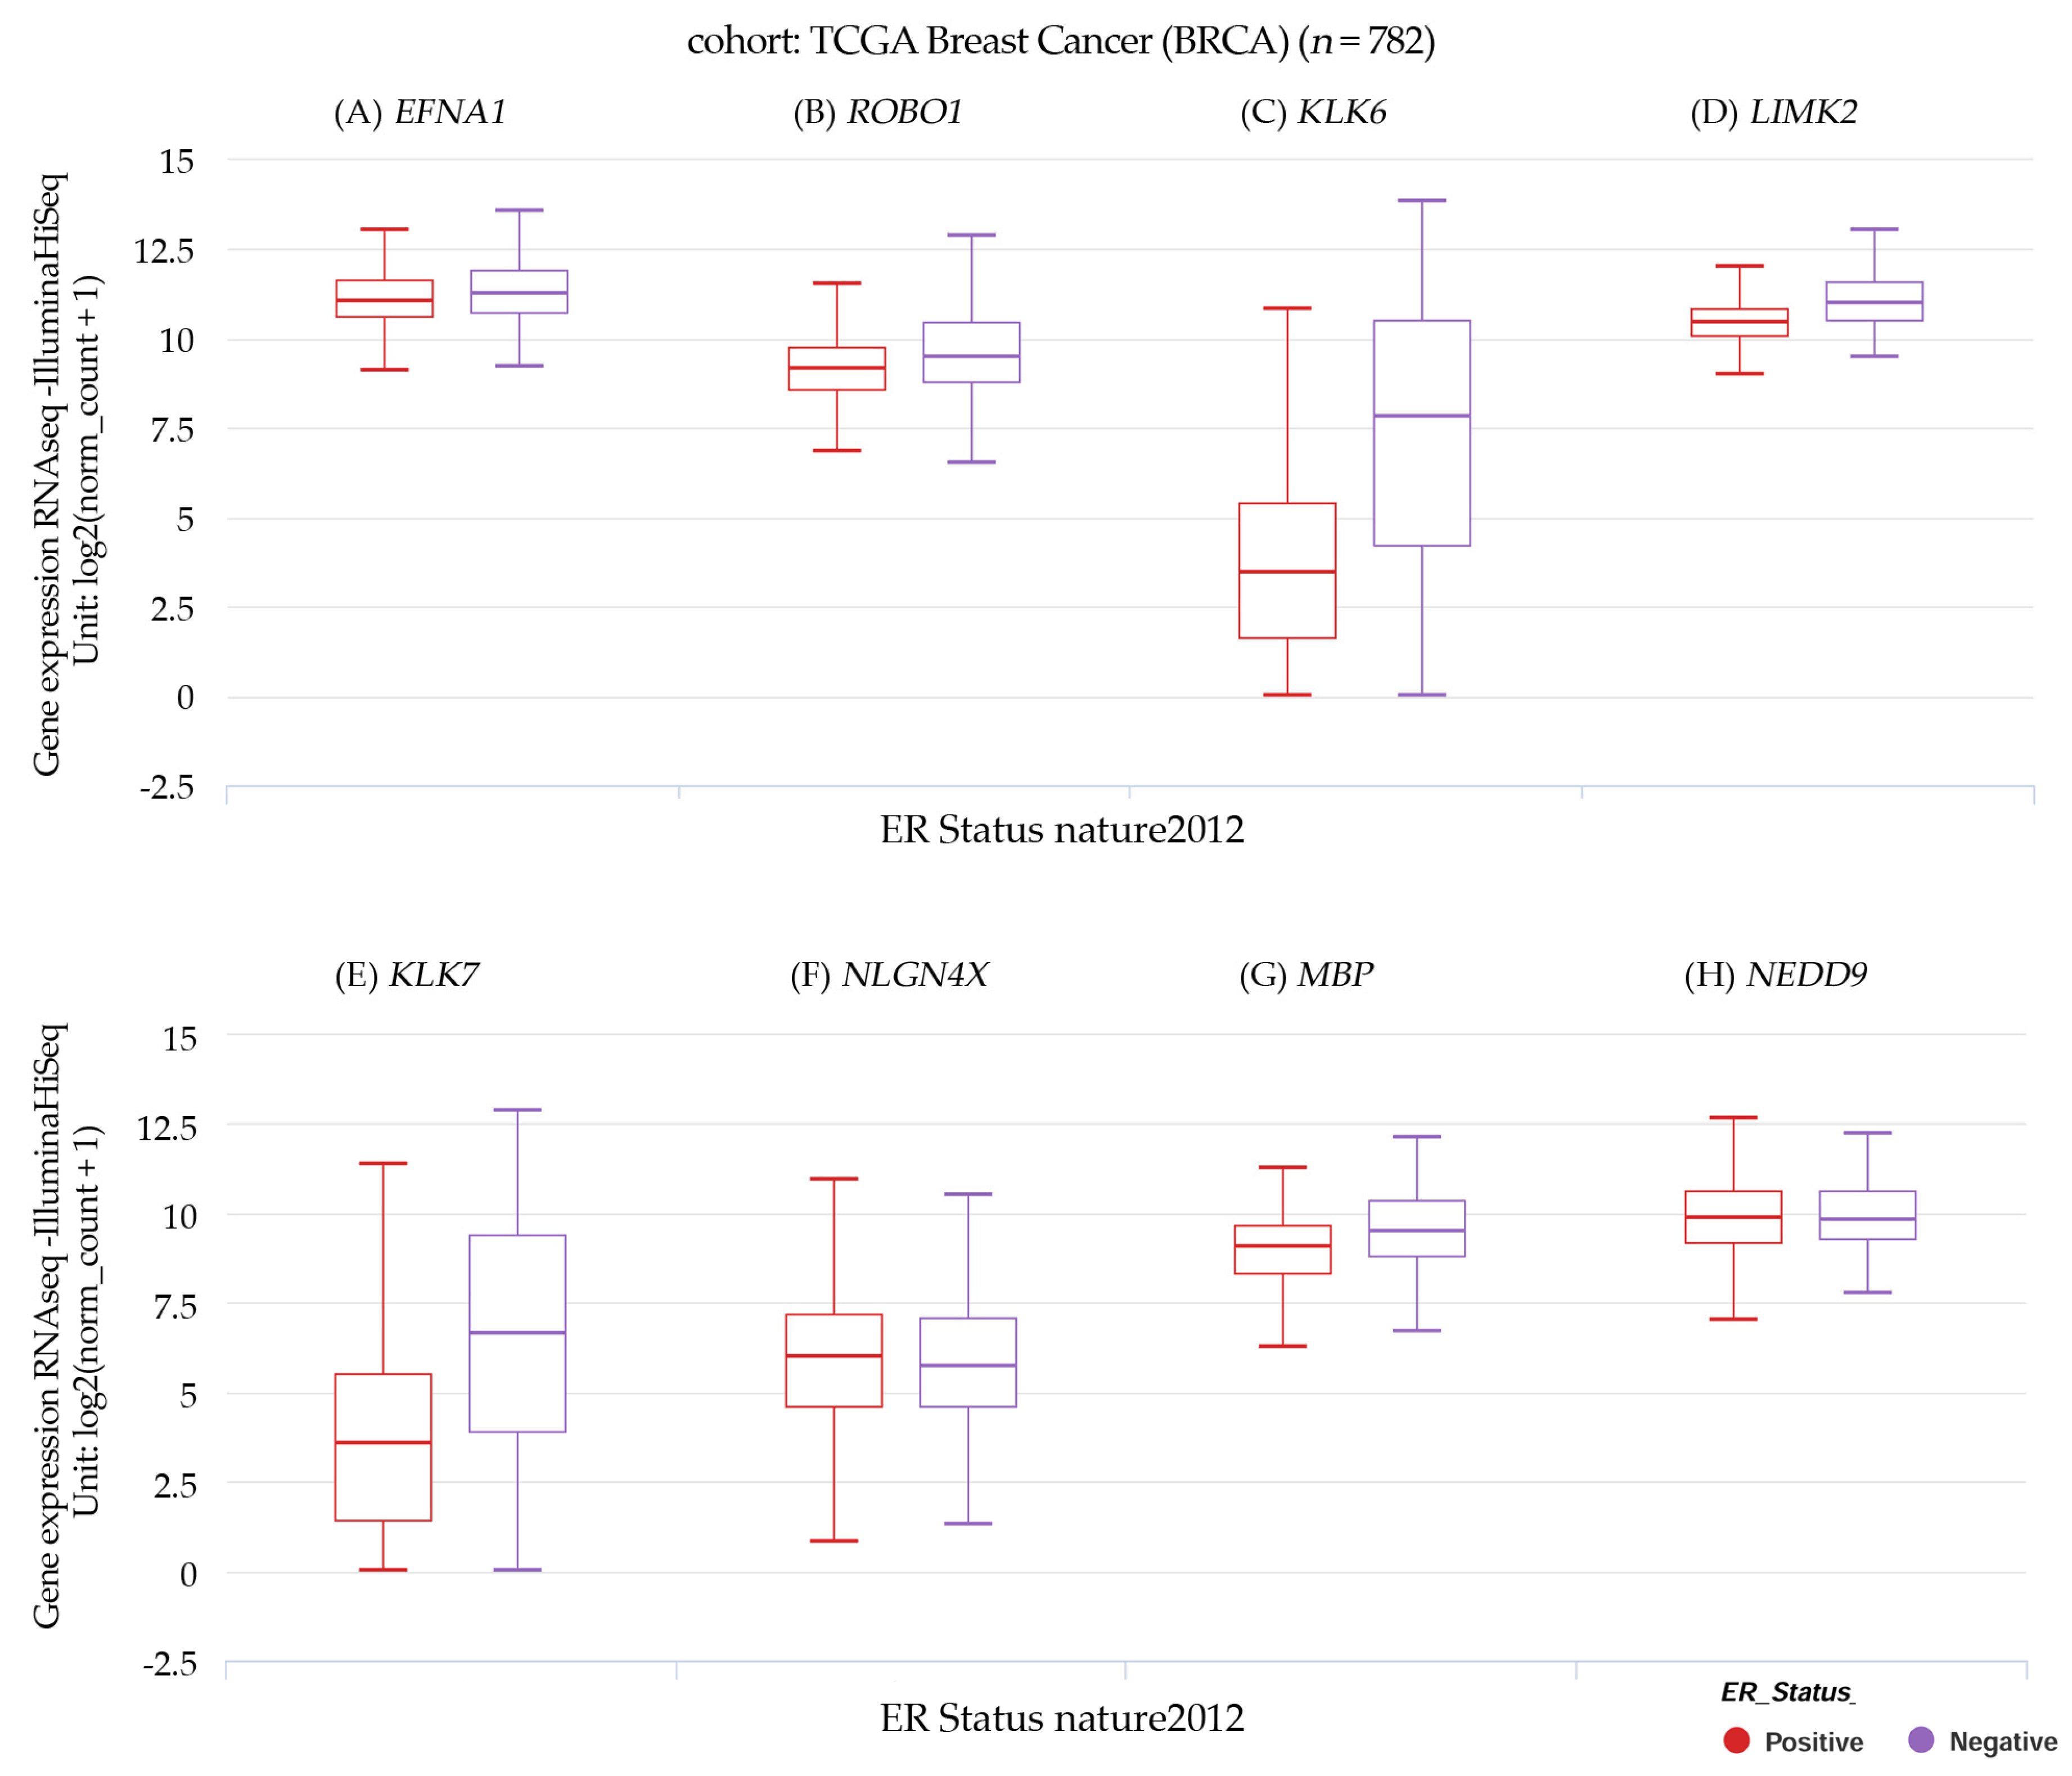
3.4. Gene Expression and Estrogen Receptor Status in TCGA Breast Cancer
3.5. Disease Stage Factor Analysis of Gene Expression across Various Breast Cancer Subtypes
4. Discussion
5. Conclusions
Author Contributions
Funding
Institutional Review Board Statement
Informed Consent Statement
Data Availability Statement
Acknowledgments
Conflicts of Interest
References
- Al-Khater, K.M.; Almofty, S.; Ravinayagam, V.; Alrushaid, N.; Rehman, S. Role of a metastatic suppressor gene KAI1/CD82 in the diagnosis and prognosis of breast cancer. Saudi J. Biol. Sci. 2021, 28, 3391–3398. [Google Scholar] [CrossRef]
- Lei, S.; Zheng, R.; Zhang, S.; Wang, S.; Chen, R.; Sun, K.; Zeng, H.; Zhou, J.; Wei, W. Global patterns of breast cancer incidence and mortality: A population-based cancer registry data analysis from 2000 to 2020. Cancer Commun. 2021, 41, 1183–1194. [Google Scholar] [CrossRef] [PubMed]
- Vasan, N.; Baselga, J.; Hyman, D.M. A view on drug resistance in cancer. Nature 2019, 575, 299–309. [Google Scholar] [CrossRef] [PubMed]
- Harbeck, N.; Penault-Llorca, F.; Cortes, J.; Gnant, M.; Houssami, N.; Poortmans, P.; Ruddy, K.; Tsang, J.; Cardoso, F. Breast cancer. Nat. Rev. Dis. Primers 2019, 5, 66. [Google Scholar] [CrossRef]
- Kuchenbaecker, K.B.; Hopper, J.L.; Barnes, D.R.; Phillips, K.A.; Mooij, T.M.; Roos-Blom, M.J.; Jervis, S.; van Leeuwen, F.E.; Milne, R.L.; Andrieu, N.; et al. Risks of Breast, Ovarian, and Contralateral Breast Cancer for BRCA1 and BRCA2 Mutation Carriers. JAMA 2017, 317, 2402–2416. [Google Scholar] [CrossRef] [PubMed]
- Korde, L.A.; Somerfield, M.R.; Carey, L.A.; Crews, J.R.; Denduluri, N.; Hwang, E.S.; Khan, S.A.; Loibl, S.; Morris, E.A.; Perez, A.; et al. Neoadjuvant Chemotherapy, Endocrine Therapy, and Targeted Therapy for Breast Cancer: ASCO Guideline. J. Clin. Oncol. 2021, 39, 1485–1505. [Google Scholar] [CrossRef]
- Robson, M.E.; Tung, N.; Conte, P.; Im, S.A.; Senkus, E.; Xu, B.; Masuda, N.; Delaloge, S.; Li, W.; Armstrong, A.; et al. OlympiAD final overall survival and tolerability results: Olaparib versus chemotherapy treatment of physician’s choice in patients with a germline BRCA mutation and HER2-negative metastatic breast cancer. Ann. Oncol. 2019, 30, 558–566. [Google Scholar] [CrossRef]
- Litton, J.K.; Hurvitz, S.A.; Mina, L.A.; Rugo, H.S.; Lee, K.H.; Goncalves, A.; Diab, S.; Woodward, N.; Goodwin, A.; Yerushalmi, R.; et al. Talazoparib versus chemotherapy in patients with germline BRCA1/2-mutated HER2-negative advanced breast cancer: Final overall survival results from the EMBRACA trial. Ann. Oncol. 2020, 31, 1526–1535. [Google Scholar] [CrossRef]
- Boilly, B.; Faulkner, S.; Jobling, P.; Hondermarck, H. Nerve Dependence: From Regeneration to Cancer. Cancer Cell 2017, 31, 342–354. [Google Scholar] [CrossRef]
- Faulkner, S.; Jobling, P.; March, B.; Jiang, C.C.; Hondermarck, H. Tumor Neurobiology and the War of Nerves in Cancer. Cancer Discov. 2019, 9, 702–710. [Google Scholar] [CrossRef]
- Harburg, G.C.; Hinck, L. Navigating breast cancer: Axon guidance molecules as breast cancer tumor suppressors and oncogenes. J. Mammary Gland. Biol. Neoplasia 2011, 16, 257–270. [Google Scholar] [CrossRef] [PubMed]
- Cramer, K.S.; Miko, I.J. Eph-ephrin signaling in nervous system development. F1000Research 2016, 5, 413. [Google Scholar] [CrossRef] [PubMed]
- Jiang, Z.; Liang, G.; Xiao, Y.; Qin, T.; Chen, X.; Wu, E.; Ma, Q.; Wang, Z. Targeting the SLIT/ROBO pathway in tumor progression: Molecular mechanisms and therapeutic perspectives. Ther. Adv. Med. Oncol. 2019, 11, 1758835919855238. [Google Scholar] [CrossRef] [PubMed]
- Pampalakis, G.; Kurlender, L.; Diamandis, E.P.; Sotiropoulou, G. Cloning and characterization of novel isoforms of the human kallikrein 6 gene. Biochem. Biophys. Res. Commun. 2004, 320, 54–61. [Google Scholar] [CrossRef] [PubMed]
- Henderson, H.J.; Karanam, B.; Samant, R.; Vig, K.; Singh, S.R.; Yates, C.; Bedi, D. Neuroligin 4X overexpression in human breast cancer is associated with poor relapse-free survival. PLoS ONE 2017, 12, e0189662. [Google Scholar] [CrossRef]
- Chen, J.Y.; Wang, X.M.; Liu, J.; Chen, J.X.; Wang, R.H.; Peng, W.Z.; Cheng, H.H.; Chen, J.J. Inhibitory effect of human brain myelin basic protein on H2O2-induced apoptosis of human lung cancer cell line YTLMC-90. Ai Zheng 2006, 25, 170–174. [Google Scholar]
- Grauzam, S.; Brock, A.M.; Holmes, C.O.; Tiedeken, J.A.; Boniface, S.G.; Pierson, B.N.; Patterson, D.G.; Coaxum, S.D.; Neskey, D.M.; Rosenzweig, S.A. NEDD9 stimulated MMP9 secretion is required for invadopodia formation in oral squamous cell carcinoma. Oncotarget 2018, 9, 25503–25516. [Google Scholar] [CrossRef]
- Arslan, E.; Aral, H.; Aksoy, T.; Afsar, C.U.; Karabulut, S.; Trabulus, F.D.C.; Gursu, R.U.; Cermik, T.F. Comparison of serum NEDD-9, CA 15-3, and CEA levels and PET metabolic parameters in breast cancer patients with 18 F-FDG PET/CT. Rev. Da Assoc. Medica Bras. 2020, 66, 673–679. [Google Scholar] [CrossRef] [PubMed]
- Wan, L.; Liu, T.; Hong, Z.; Pan, Y.; Sizemore, S.T.; Zhang, J.; Ma, Z. NEDD4 expression is associated with breast cancer progression and is predictive of a poor prognosis. Breast Cancer Res. BCR 2019, 21, 148. [Google Scholar] [CrossRef]
- Li, H.; Li, J.; Han, R.; Deng, X.; Shi, J.; Huang, H.; Hamad, N.; McCaughley, A.; Liu, J.; Wang, C.; et al. Deletion of tetraspanin CD151 alters the Wnt oncogene-induced mammary tumorigenesis: A cell type-linked function and signaling. Neoplasia 2019, 21, 1151–1163. [Google Scholar] [CrossRef]
- Lamouille, S.; Xu, J.; Derynck, R. Molecular mechanisms of epithelial-mesenchymal transition. Nat. Rev. Mol. Cell Biol. 2014, 15, 178–196. [Google Scholar] [CrossRef] [PubMed]
- Calaf, G.; Russo, J. Transformation of human breast epithelial cells by chemical carcinogens. Carcinogenesis 1993, 14, 483–492. [Google Scholar] [CrossRef]
- Calaf, G.M.; Hei, T.K. Establishment of a radiation- and estrogen-induced breast cancer model. Carcinogenesis 2000, 21, 769–776. [Google Scholar] [CrossRef] [PubMed]
- Soule, H.D.; Maloney, T.M.; Wolman, S.R.; Peterson, W.D., Jr.; Brenz, R.; McGrath, C.M.; Russo, J.; Pauley, R.J.; Jones, R.F.; Brooks, S.C. Isolation and characterization of a spontaneously immortalized human breast epithelial cell line, MCF-10. Cancer Res. 1990, 50, 6075–6086. [Google Scholar] [PubMed]
- Calaf, G.M.; Roy, D. Gene and protein expressions induced by 17beta-estradiol and parathion in cultured breast epithelial cells. Mol. Med. 2007, 13, 255–265. [Google Scholar] [CrossRef] [PubMed]
- Calaf, G.M.; Roy, D. Cell adhesion proteins altered by 17beta estradiol and parathion in breast epithelial cells. Oncol. Rep. 2008, 19, 165–169. [Google Scholar] [PubMed]
- Hei, T.K.; Piao, C.Q.; Willey, J.C.; Thomas, S.; Hall, E.J. Malignant transformation of human bronchial epithelial cells by radon-simulated alpha-particles. Carcinogenesis 1994, 15, 431–437. [Google Scholar] [CrossRef] [PubMed]
- Calaf, G.M.; Roy, D.; Narayan, G.; Balajee, A.S. Differential expression of cell adhesion molecules in an ionizing radiation-induced breast cancer model system. Oncol. Rep. 2013, 30, 285–291. [Google Scholar] [CrossRef] [PubMed]
- Calaf, G.M.; Crispin, L.A.; Munoz, J.P.; Aguayo, F.; Roy, D.; Narayan, G. Ionizing Radiation and Estrogen Affecting Growth Factor Genes in an Experimental Breast Cancer Model. Int. J. Mol. Sci. 2022, 23, 14284. [Google Scholar] [CrossRef]
- Li, T.; Fu, J.; Zeng, Z.; Cohen, D.; Li, J.; Chen, Q.; Li, B.; Liu, X.S. TIMER2.0 for analysis of tumor-infiltrating immune cells. Nucleic Acids Res. 2020, 48, W509–W514. [Google Scholar] [CrossRef]
- Goldman, M.; Craft, B.; Hastie, M.; Repecka, K.; McDade, F.; Kamath, A.; Banerjee, A.; Luo, Y.; Rogers, D.; Brooks, A.N.; et al. The UCSC Xena platform for public and private cancer genomics data visualization and interpretation. bioRxiv 2019, 326470, 1–16. [Google Scholar] [CrossRef]
- NIH. The Cancer Genome Atlas Program. National Cancer Institute. Available online: https://www.cancer.gov/about-nci/organization/ccg/research/structural-genomics/tcga (accessed on 17 June 2022).
- Toda, S.; Frankel, N.W.; Lim, W.A. Engineering cell-cell communication networks: Programming multicellular behaviors. Curr. Opin. Chem. Biol. 2019, 52, 31–38. [Google Scholar] [CrossRef] [PubMed]
- Testa, U.; Castelli, G.; Pelosi, E. Breast Cancer: A Molecularly Heterogenous Disease Needing Subtype-Specific Treatments. Med. Sci. 2020, 8, 18. [Google Scholar] [CrossRef] [PubMed]
- Cava, C.; Pisati, M.; Frasca, M.; Castiglioni, I. Identification of Breast Cancer Subtype-Specific Biomarkers by Integrating Copy Number Alterations and Gene Expression Profiles. Medicina 2021, 57, 261. [Google Scholar] [CrossRef]
- Malvi, P.; Janostiak, R.; Chava, S.; Manrai, P.; Yoon, E.; Singh, K.; Harigopal, M.; Gupta, R.; Wajapeyee, N. LIMK2 promotes the metastatic progression of triple-negative breast cancer by activating SRPK1. Oncogenesis 2020, 9, 77. [Google Scholar] [CrossRef] [PubMed]
- Xu, Y.; Li, W.L.; Fu, L.; Gu, F.; Ma, Y.J. Slit2/Robo1 signaling in glioma migration and invasion. Neurosci. Bull. 2010, 26, 474–478. [Google Scholar] [CrossRef]
- Osuka, S.; Van Meir, E.G. Overcoming therapeutic resistance in glioblastoma: The way forward. J. Clin. Investig. 2017, 127, 415–426. [Google Scholar] [CrossRef]
- Yiin, J.J.; Hu, B.; Jarzynka, M.J.; Feng, H.; Liu, K.W.; Wu, J.Y.; Ma, H.I.; Cheng, S.Y. Slit2 inhibits glioma cell invasion in the brain by suppression of Cdc42 activity. Neuro Oncol. 2009, 11, 779–789. [Google Scholar] [CrossRef]
- Li, X.; Liu, J.; Wang, Y.; Zhang, L.; Ning, L.; Feng, Y. Parallel underexpression of kallikrein 5 and kallikrein 7 mRNA in breast malignancies. Cancer Sci. 2009, 100, 601–607. [Google Scholar] [CrossRef]
- Yousef, G.M.; Kishi, T.; Diamandis, E.P. Role of kallikrein enzymes in the central nervous system. Clin. Chim. Acta 2003, 329, 1–8. [Google Scholar] [CrossRef]
- Yousef, G.M.; Luo, L.Y.; Scherer, S.W.; Sotiropoulou, G.; Diamandis, E.P. Molecular characterization of zyme/protease M/neurosin (PRSS9), a hormonally regulated kallikrein-like serine protease. Genomics 1999, 62, 251–259. [Google Scholar] [CrossRef] [PubMed]
- Pampalakis, G.; Prosnikli, E.; Agalioti, T.; Vlahou, A.; Zoumpourlis, V.; Sotiropoulou, G. A tumor-protective role for human kallikrein-related peptidase 6 in breast cancer mediated by inhibition of epithelial-to-mesenchymal transition. Cancer Res. 2009, 69, 3779–3787. [Google Scholar] [CrossRef] [PubMed]
- Ni, X.; Zhang, W.; Huang, K.C.; Wang, Y.; Ng, S.K.; Mok, S.C.; Berkowitz, R.S.; Ng, S.W. Characterisation of human kallikrein 6/protease M expression in ovarian cancer. Br. J. Cancer 2004, 91, 725–731. [Google Scholar] [CrossRef] [PubMed]
- Gouda, Z.; Thomson, D.M. Measurement by leukocyte adherence inhibition of autosensitization of cancer patients to myelin basic protein. Jpn. J. Cancer Res. 1988, 79, 529–537. [Google Scholar] [CrossRef]
- Basseville, A.; Cordier, C.; Ben Azzouz, F.; Gouraud, W.; Lasla, H.; Panloup, F.; Campone, M.; Jezequel, P. Brain Neural Progenitors are New Predictive Biomarkers for Breast Cancer Hormonotherapy. Cancer Res. Commun. 2022, 2, 857–869. [Google Scholar] [CrossRef]
- Cui, Q.; Jiang, D.; Zhang, Y.; Chen, C. The tumor-nerve circuit in breast cancer. Cancer Metastasis Rev. 2023, 42, 543–574. [Google Scholar] [CrossRef]
- Magnon, C.; Hall, S.J.; Lin, J.; Xue, X.; Gerber, L.; Freedland, S.J.; Frenette, P.S. Autonomic nerve development contributes to prostate cancer progression. Science 2013, 341, 1236361. [Google Scholar] [CrossRef]
- Ayala, G.E.; Dai, H.; Powell, M.; Li, R.; Ding, Y.; Wheeler, T.M.; Shine, D.; Kadmon, D.; Thompson, T.; Miles, B.J.; et al. Cancer-related axonogenesis and neurogenesis in prostate cancer. Clin. Cancer Res. 2008, 14, 7593–7603. [Google Scholar] [CrossRef]
- Hondermarck, H. Neurotrophins and their receptors in breast cancer. Cytokine Growth Factor. Rev. 2012, 23, 357–365. [Google Scholar] [CrossRef]
- Kamiya, A.; Hayama, Y.; Kato, S.; Shimomura, A.; Shimomura, T.; Irie, K.; Kaneko, R.; Yanagawa, Y.; Kobayashi, K.; Ochiya, T. Genetic manipulation of autonomic nerve fiber innervation and activity and its effect on breast cancer progression. Nat. Neurosci. 2019, 22, 1289–1305. [Google Scholar] [CrossRef]
- Jin, M.Z.; Jin, W.L. The updated landscape of tumor microenvironment and drug repurposing. Signal Transduct. Target. Ther. 2020, 5, 166. [Google Scholar] [CrossRef]
- Gruet, M.; Cotton, D.; Coveney, C.; Boocock, D.J.; Wagner, S.; Komorowski, L.; Rees, R.C.; Pockley, A.G.; Garner, A.C.; Wallis, J.D.; et al. beta2-Adrenergic Signalling Promotes Cell Migration by Upregulating Expression of the Metastasis-Associated Molecule LYPD3. Biology 2020, 9, 39. [Google Scholar] [CrossRef]
- Cole, S.W.; Nagaraja, A.S.; Lutgendorf, S.K.; Green, P.A.; Sood, A.K. Sympathetic nervous system regulation of the tumour microenvironment. Nat. Rev. Cancer 2015, 15, 563–572. [Google Scholar] [CrossRef] [PubMed]
- Basha, S.; Jin-Smith, B.; Sun, C.; Pi, L. The SLIT/ROBO Pathway in Liver Fibrosis and Cancer. Biomolecules 2023, 13, 785. [Google Scholar] [CrossRef] [PubMed]
- Zhang, L.; Qin, Y.; Wu, G.; Wang, J.; Cao, J.; Wang, Y.; Wu, D.; Yang, K.; Zhao, Z.; He, L.; et al. PRRG4 promotes breast cancer metastasis through the recruitment of NEDD4 and downregulation of Robo1. Oncogene 2020, 39, 7196–7208. [Google Scholar] [CrossRef] [PubMed]


| Probe ID | Ct/E | Ct/A3 | E/A5 | A3/A5 | A5/T2 | A3/T2 | Gene Symbol |
|---|---|---|---|---|---|---|---|
| 202023_at | 1.2 | −6.2 | −1.4 | 5.2 | −1.0 | 5.1 | EFNA1 |
| 213194_at | 1.2 | −30.7 | 1.1 | 10.9 | 1.1 | 44 | ROBO1 |
| 204733_at | −1.4 | −6.9 | −3.0 | 1.7 | 7.4 | 12.3 | KLK6 |
| 210582_s | −1.2 | −1.4 | −1.2 | −1.0 | 3.7 | 3.7 | LIMK2 |
| 205778_at | −2.0 | −59.4 | −4.8 | 6.2 | 11.3 | 69.5 | KLK7 |
| 221933_at | 2.4 | −21.8 | −11.8 | 4.5 | 29.6 | 134.1 | NLGN4X |
| 210136_at | 2.2 | −2.2 | −1.3 | 3.7 | 2.2 | 8.0 | MBP |
| 202150_s_at | 1.1 | −6.8 | 1.6 | 11.7 | −3.7 | 3.2 | NEDD9 |
| Breast Cancer | EFNA1 | ROBO1 | KLK6 | LIMK2 | KLK7 | NLGN4X | MBP | NEDD9 |
|---|---|---|---|---|---|---|---|---|
| BRCA (n = 1100) | 3, 4 *** | 3, 4 *** | 3, 4 *** | 3, 4 *** | 3, 4 *** | 3, 4 *** | 3, 4 *** | 3, 4 *** |
| BRCA-Basal (n = 191) | N.S. | N.S. | N.S. | N.S. | N.S. | N.S. | N.S. | N.S. |
| BRCA-Her2 (n = 82) | 4 * | 4 ** | 4 ** | 4 ** | 4 * | 4 ** | 4 * | 4 * |
| BRCA-LumA (n = 568) | 4 *** | 4 *** | 4 *** | 4 *** | 4 *** | 4 *** | 4 *** | 4 *** |
| BRCA-LumB (n = 219) | 4 ** | 4 ** | 4 ** | 4 ** | 4 ** | 4 * | 4 * | 4 ** |
Disclaimer/Publisher’s Note: The statements, opinions and data contained in all publications are solely those of the individual author(s) and contributor(s) and not of MDPI and/or the editor(s). MDPI and/or the editor(s) disclaim responsibility for any injury to people or property resulting from any ideas, methods, instructions or products referred to in the content. |
© 2023 by the authors. Licensee MDPI, Basel, Switzerland. This article is an open access article distributed under the terms and conditions of the Creative Commons Attribution (CC BY) license (https://creativecommons.org/licenses/by/4.0/).
Share and Cite
Calaf, G.M.; Roy, D.; Jara, L.; Aguayo, F.; Crispin, L.A. Gene Signature Associated with Nervous System in an Experimental Radiation- and Estrogen-Induced Breast Cancer Model. Biomedicines 2023, 11, 3111. https://doi.org/10.3390/biomedicines11123111
Calaf GM, Roy D, Jara L, Aguayo F, Crispin LA. Gene Signature Associated with Nervous System in an Experimental Radiation- and Estrogen-Induced Breast Cancer Model. Biomedicines. 2023; 11(12):3111. https://doi.org/10.3390/biomedicines11123111
Chicago/Turabian StyleCalaf, Gloria M., Debasish Roy, Lilian Jara, Francisco Aguayo, and Leodan A. Crispin. 2023. "Gene Signature Associated with Nervous System in an Experimental Radiation- and Estrogen-Induced Breast Cancer Model" Biomedicines 11, no. 12: 3111. https://doi.org/10.3390/biomedicines11123111
APA StyleCalaf, G. M., Roy, D., Jara, L., Aguayo, F., & Crispin, L. A. (2023). Gene Signature Associated with Nervous System in an Experimental Radiation- and Estrogen-Induced Breast Cancer Model. Biomedicines, 11(12), 3111. https://doi.org/10.3390/biomedicines11123111