
The Association of the Oral Microbiota with the Effects of Acid Stress Induced by an Increase of Brain Lactate in Schizophrenia Patients

 , , , , , , , ,
  , and
, and
Abstract
:1. Introduction
2. Materials and Methods
2.1. Participants of the Study
2.2. Clinical Evaluation
- Brain imaging studies
2.3. Preparation and Analysis of Blood Samples by Liquid Chromatography Coupled to Tandem Mass Spectrometry (LC-ESI-MS/MS)
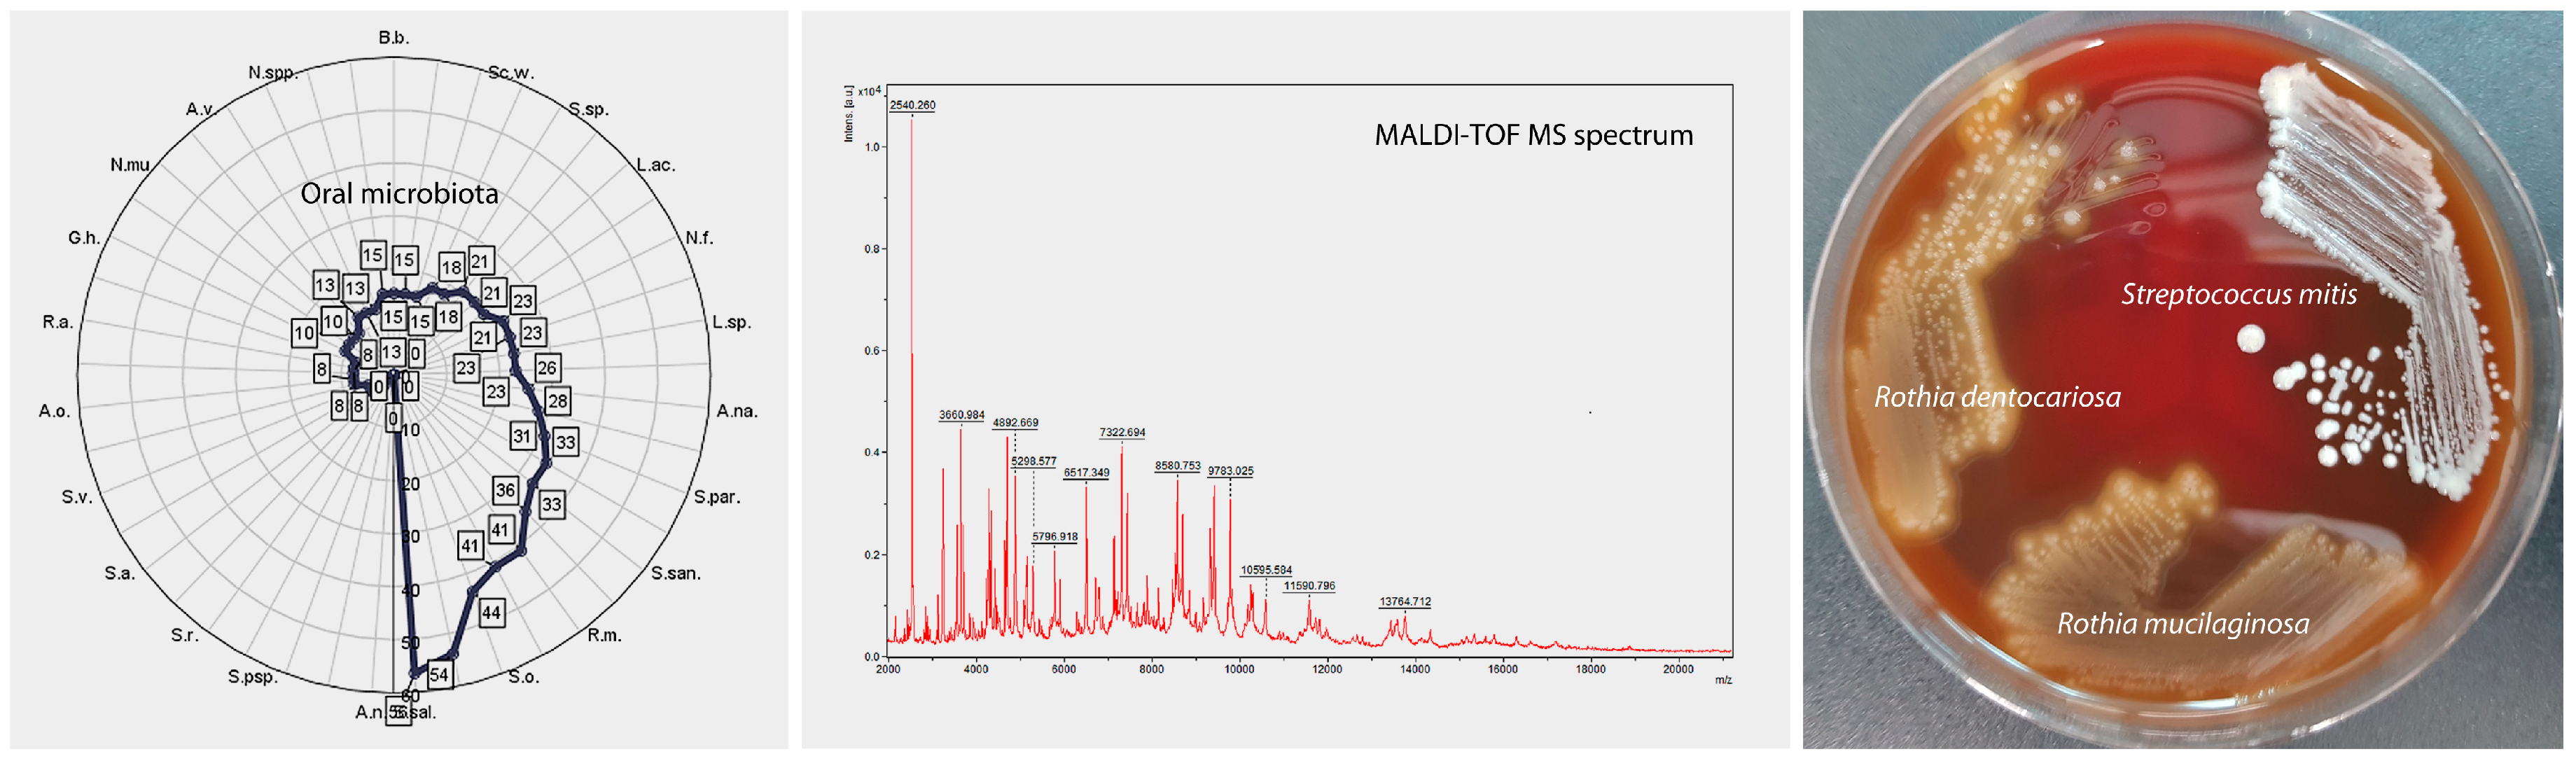
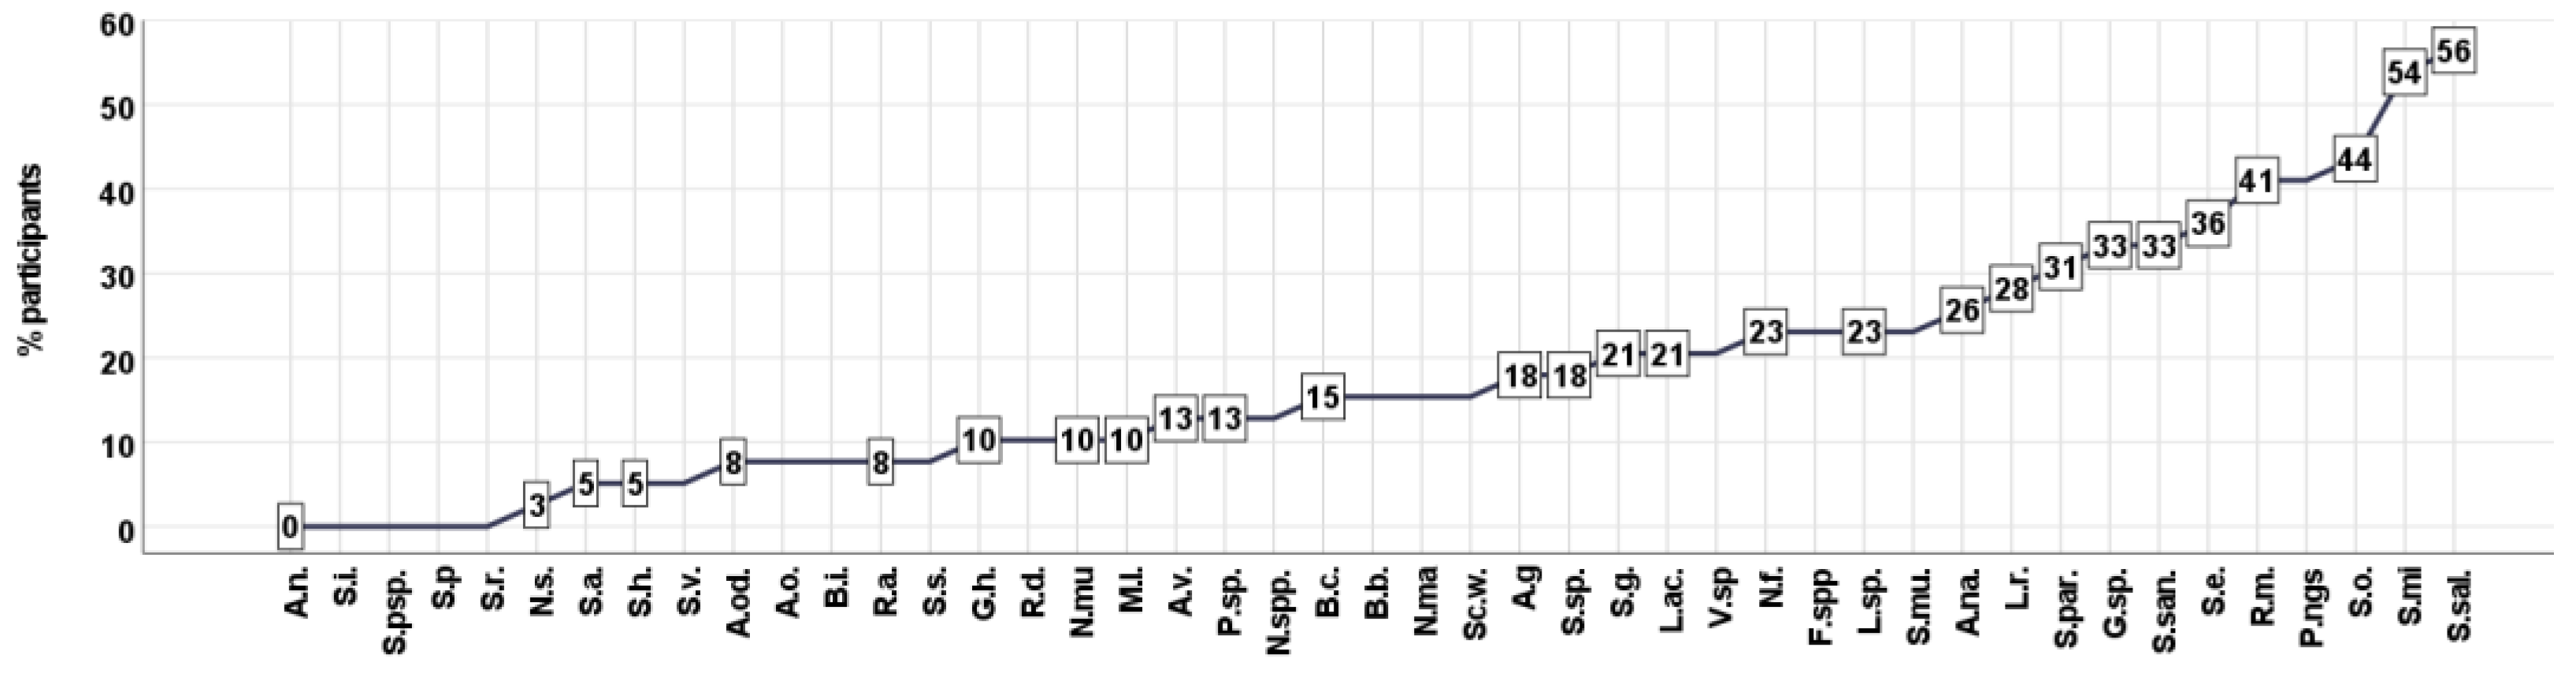
2.4. Isolation of Oral Microorganisms and Identification by Matrix-Assisted Laser Desorption Ionization (MALDI-TOF MS)
2.5. Statistical Analysis
3. Results
3.1. Cluster Analysis—Unsupervised Clustering
3.2. Evaluation of the Relationship between Oral Microbiota and Subjective Symptoms, Brain Metabolic Activity and Biochemical Markers of People with Schizophrenia
3.3. Assessment of the Association of Clinical Status with the Oral Microbiota of Patients with Schizophrenia
3.4. Evaluation of the Relationship between Oral Microbiota and Subjective Symptoms, Brain Metabolic Activity and Biochemical Markers of People with Schizophrenia
4. Discussion
4.1. Cluster Analysis—Unsupervised Clustering
4.2. Assessment of the Association of Oral Microbiota with Clinical Status and Other Biochemical Parameters in Patients with Schizophrenia
5. Conclusions
Supplementary Materials
Author Contributions
Funding
Institutional Review Board Statement
Informed Consent Statement
Data Availability Statement
Conflicts of Interest
References
- Schepanski, S.; Buss, C.; Hanganu-Opatz, I.L.; Arck, P.C. Prenatal Immune and Endocrine Modulators of Offspring’s Brain Development and Cognitive Functions Later in Life. Front. Immunol. 2018, 9, 2186. [Google Scholar] [CrossRef] [PubMed] [Green Version]
- Dogan, A.E.; Yuksel, C.; Du, F.; Chouinard, V.A.; Öngür, D. Brain lactate and pH in schizophrenia and bipolar disorder: A systematic review of findings from magnetic resonance studies. Neuropsychopharmacology 2018, 43, 1681–1690. [Google Scholar] [CrossRef] [PubMed] [Green Version]
- Association, A.P. Diagnostic and Statistical Manual of Mental Disorders (DSM-V); American Psychiatric Association Publishing: Arlington, DC, USA, 2013. [Google Scholar]
- Hagihara, H.; Catts, V.S.; Katayama, Y.; Shoji, H.; Takagi, T.; Huang, F.L.; Nakao, A.; Mori, Y.; Huang, K.P.; Ishii, S.; et al. Decreased Brain pH as a Shared Endophenotype of Psychiatric Disorders. Neuropsychopharmacology 2018, 43, 459–468. [Google Scholar] [CrossRef] [PubMed] [Green Version]
- Paster, B.J.; Olsen, I.; Aas, J.A.; Dewhirst, F.E. The breadth of bacterial diversity in the human periodontal pocket and other oral sites. Periodontol. 2000 2006, 42, 80–87. [Google Scholar] [CrossRef] [PubMed]
- Zheng, J.; Wittouck, S.; Salvetti, E.; Franz, C.; Harris, H.M.B.; Mattarelli, P.; O’Toole, P.W.; Pot, B.; Vandamme, P.; Walter, J.; et al. A taxonomic note on the genus Lactobacillus: Description of 23 novel genera, emended description of the genus Lactobacillus Beijerinck 1901, and union of Lactobacillaceae and Leuconostocaceae. Int. J. Syst. Evol. Microbiol. 2020, 70, 2782–2858. [Google Scholar] [CrossRef]
- Schächtle, M.A.; Rosshart, S.P. The Microbiota-Gut-Brain Axis in Health and Disease and Its Implications for Translational Research. Front. Cell Neurosci. 2021, 15, 698172. [Google Scholar] [CrossRef]
- Cryan, J.F.; O’Riordan, K.J.; Cowan, C.S.; Sandhu, K.V.; Bastiaanssen, T.F.; Boehme, M.; Codagnone, M.G.; Cussotto, S.; Fulling, C.; Golubeva, A.V. The microbiota-gut-brain axis. Physiol. Rev. 2019, 99, 1877–2013. [Google Scholar] [CrossRef]
- Miklossy, J.; Kraftsik, R.; Pillevuit, O.; Lepori, D.; Genton, C.; Bosman, F.T. Curly fiber and tangle-like inclusions in the ependyma and choroid plexus—A pathogenetic relationship with the cortical Alzheimer-type changes? J. Neuropathol. Exp. Neurol. 1998, 57, 1202–1212. [Google Scholar] [CrossRef]
- Miklossy, J. Alzheimer’s disease-a neurospirochetosis. Analysis of the evidence following Koch’s and Hill’s criteria. J. Neuroinflammation 2011, 8, 90. [Google Scholar] [CrossRef] [Green Version]
- Vighi, G.; Marcucci, F.; Sensi, L.; Di Cara, G.; Frati, F. Allergy and the gastrointestinal system. Clin. Exp. Immunol. 2008, 153, 3–6. [Google Scholar] [CrossRef]
- Clarke, G.; Grenham, S.; Scully, P.; Fitzgerald, P.; Moloney, R.; Shanahan, F.; Dinan, T.; Cryan, J. The microbiome-gut-brain axis during early life regulates the hippocampal serotonergic system in a sex-dependent manner. Mol. Psychiatry 2013, 18, 666–673. [Google Scholar] [CrossRef] [PubMed] [Green Version]
- Sun, M.-F.; Shen, Y.-Q. Dysbiosis of gut microbiota and microbial metabolites in Parkinson’s Disease. Ageing Res. Rev. 2018, 45, 53–61. [Google Scholar] [CrossRef] [PubMed]
- Gomaa, E.Z. Human gut microbiota/microbiome in health and diseases: A review. Antonie Van Leeuwenhoek 2020, 113, 2019–2040. [Google Scholar] [CrossRef] [PubMed]
- Walker, M.Y.; Pratap, S.; Southerland, J.H.; Farmer-Dixon, C.M.; Lakshmyya, K.; Gangula, P.R. Role of oral and gut microbiome in nitric oxide-mediated colon motility. Nitric. Oxide 2018, 73, 81–88. [Google Scholar] [CrossRef]
- Aguilar-Valles, A.; Rodrigue, B.; Matta-Camacho, E. Maternal immune activation and the development of dopaminergic neurotransmission of the offspring: Relevance for schizophrenia and other psychoses. Front. Psychiatry 2020, 11, 852. [Google Scholar] [CrossRef]
- Choudhury, Z.; Lennox, B. Maternal Immune Activation and Schizophrenia–Evidence for an Immune Priming Disorder. Front. Psychiatry 2021, 12, 585742. [Google Scholar] [CrossRef] [PubMed]
- Cheslack-Postava, K.; Brown, A.S. Prenatal infection and schizophrenia: A decade of further progress. Schizophr. Res. 2022, 247, 7–15. [Google Scholar] [CrossRef] [PubMed]
- Morais, L.H.; Schreiber, H.L.; Mazmanian, S.K. The gut microbiota–brain axis in behaviour and brain disorders. Nat. Rev. Microbiol. 2021, 19, 241–255. [Google Scholar] [CrossRef]
- Zhu, F.; Ju, Y.; Wang, W.; Wang, Q.; Guo, R.; Ma, Q.; Sun, Q.; Fan, Y.; Xie, Y.; Yang, Z. Metagenome-wide association of gut microbiome features for schizophrenia. Nat. Commun. 2020, 11, 1612. [Google Scholar] [CrossRef] [Green Version]
- Proia, P.; Di Liegro, C.M.; Schiera, G.; Fricano, A.; Di Liegro, I. Lactate as a Metabolite and a Regulator in the Central Nervous System. Int. J. Mol. Sci. 2016, 17, 1450. [Google Scholar] [CrossRef]
- Sobral-Monteiro-Junior, R.; Maillot, P.; Gatica-Rojas, V.; Ávila, W.R.M.; de Paula, A.M.B.; Guimarães, A.L.S.; Santos, S.H.S.; Pupe, C.C.B.; Deslandes, A.C. Is the “lactormone” a key-factor for exercise-related neuroplasticity? A hypothesis based on an alternative lactate neurobiological pathway. Med. Hypotheses 2019, 123, 63–66. [Google Scholar] [CrossRef] [PubMed]
- Bryll, A.; Krzyściak, W.; Karcz, P.; Pilecki, M.; Śmierciak, N.; Szwajca, M.; Skalniak, A.; Popiela, T.J. Determinants of schizophrenia endophenotypes based on neuroimaging and biochemical parameters. Biomedicines 2021, 9, 372. [Google Scholar] [CrossRef] [PubMed]
- Jauhar, S.; Johnstone, M.; McKenna, P.J. Schizophrenia. Lancet 2022, 399, 473–486. [Google Scholar] [CrossRef] [PubMed]
- Duarte, J.M.N.; Xin, L. Magnetic Resonance Spectroscopy in Schizophrenia: Evidence for Glutamatergic Dysfunction and Impaired Energy Metabolism. Neurochem. Res. 2019, 44, 102–116. [Google Scholar] [CrossRef] [PubMed] [Green Version]
- Barrier, L.; Barc, S.; Fauconneau, B.; Pontcharraud, R.; Kelani, A.; Bestel, E.; Page, G. Evidence that acidosis alters the high-affinity dopamine uptake in rat striatal slices and synaptosomes by different mechanisms partially related to oxidative damage. Neurochem. Int. 2003, 42, 27–34. [Google Scholar] [CrossRef]
- Fedorovich, S.V.; Kaler, G.V.; Konev, S.V. Effect of low pH on glutamate uptake and release in isolated presynaptic endings from rat brain. Neurochem. Res. 2003, 28, 715–721. [Google Scholar] [CrossRef]
- Zhou, Z.; Okamoto, K.; Onodera, J.; Hiragi, T.; Andoh, M.; Ikawa, M.; Tanaka, K.F.; Ikegaya, Y.; Koyama, R. Astrocytic cAMP modulates memory via synaptic plasticity. Proc. Natl. Acad. Sci. USA 2021, 118, e2016584118. [Google Scholar] [CrossRef]
- Mu, Y.; Bennett, D.V.; Rubinov, M.; Narayan, S.; Yang, C.T.; Tanimoto, M.; Mensh, B.D.; Looger, L.L.; Ahrens, M.B. Glia Accumulate Evidence that Actions Are Futile and Suppress Unsuccessful Behavior. Cell 2019, 178, 27–43.e19. [Google Scholar] [CrossRef] [Green Version]
- Yang, J.; Ruchti, E.; Petit, J.M.; Jourdain, P.; Grenningloh, G.; Allaman, I.; Magistretti, P.J. Lactate promotes plasticity gene expression by potentiating NMDA signaling in neurons. Proc. Natl. Acad. Sci. USA 2014, 111, 12228–12233. [Google Scholar] [CrossRef] [Green Version]
- Brooks, G.A.; Curl, C.C.; Leija, R.G.; Osmond, A.D.; Duong, J.J.; Arevalo, J.A. Tracing the lactate shuttle to the mitochondrial reticulum. Exp. Mol. Med. 2022, 54, 1332–1347. [Google Scholar] [CrossRef]
- Batinic, B. Cognitive models of positive and negative symptoms of schizophrenia and implications for treatment. Psychiatr. Danub. 2019, 31, 181–184. [Google Scholar]
- Kay, S.R.; Fiszbein, A.; Opler, L.A. The positive and negative syndrome scale (PANSS) for schizophrenia. Schizophr. Bull. 1987, 13, 261–276. [Google Scholar] [CrossRef]
- Kay, S.R.; Opler, L.A.; Lindenmayer, J.-P. Reliability and validity of the positive and negative syndrome scale for schizophrenics. Psychiatry Res. 1988, 23, 99–110. [Google Scholar] [CrossRef] [PubMed]
- Kay, S.R.; Opler, L.A.; Lindenmayer, J.-P. The positive and negative syndrome scale (PANSS): Rationale and standardisation. Br. J. Psychiatry 1989, 155, 59–65. [Google Scholar] [CrossRef]
- Lefort-Besnard, J.; Varoquaux, G.; Derntl, B.; Gruber, O.; Aleman, A.; Jardri, R.; Sommer, I.; Thirion, B.; Bzdok, D. Patterns of schizophrenia symptoms: Hidden structure in the PANSS questionnaire. Transl. Psychiatry 2018, 8, 1–10. [Google Scholar] [CrossRef] [Green Version]
- Beck, A.T.; Steer, R.A.; Brown, G. Manual for the Beck Depression Inventory-II; Psychological Corporation: San Antonio, TX, USA, 1996. [Google Scholar]
- Łojek, E.; Stańczak, J. Inwentarz Depresji Becka–Drugie Wydanie [Beck Depression Inventory–Second Edition; BDI-II]; Pracownia Testów Psychol: Warszawa, Polska, 2019. [Google Scholar]
- Lindenmayer, J.-P.; Kay, S.R.; Plutchik, R. Multivantaged assessment of depression in schizophrenia. Psychiatry Res. 1992, 42, 199–207. [Google Scholar] [CrossRef] [PubMed]
- Addington, D.; Addington, J.; Maticka-Tyndale, E. Assessing depression in schizophrenia: The Calgary Depression Scale. Br. J. Psychiatry 1993, 163, 39–44. [Google Scholar] [CrossRef]
- Möller, H.-J. Standardised rating scales in psychiatry: Methodological basis, their possibilities and limitations and descriptions of important rating scales. World J. Biol. Psychiatry 2009, 10, 6–26. [Google Scholar] [CrossRef]
- Hamilton, M. Development of a rating scale for primary depressive illness. Br. J. Soc. Clin. Psychol. 1967, 6, 278–296. [Google Scholar] [CrossRef]
- Hamilton, M. A rating scale for depression. J. Neurol. Neurosurg. Psychiatry 1960, 23, 56. [Google Scholar] [CrossRef] [PubMed] [Green Version]
- Lako, I.M.; Bruggeman, R.; Knegtering, H.; Wiersma, D.; Schoevers, R.; Slooff, C.; Taxis, K. A systematic review of instruments to measure depressive symptoms in patients with schizophrenia. J. Affect. Disord. 2012, 140, 38–47. [Google Scholar] [CrossRef] [PubMed]
- Zimmerman, M.; Martinez, J.H.; Young, D.; Chelminski, I.; Dalrymple, K. Severity classification on the Hamilton depression rating scale. J. Affect. Disord. 2013, 150, 384–388. [Google Scholar] [CrossRef] [PubMed]
- Wiglusz, M.S.; Landowski, J.; Michalak, L.; Cubała, W.J. Validation of the Polish Version of the Hamilton Rating Scale for Depression in patients with epilepsy. Epilepsy Behav. 2016, 62, 81–84. [Google Scholar] [CrossRef] [PubMed]
- Addington, D.; Addington, J.; Schissel, B. A depression rating scale for schizophrenics. Schizophr Res. 1990, 3, 247–251. [Google Scholar] [CrossRef]
- Szafrański, T. Skala Calgary do oceny depresji w schizofrenii [Calgary Depression Scale for Schizophrenia]. Post Psychiatr. Neurol. 1997, 6, 333–343. [Google Scholar]
- Addington, D.; Addington, J.; Maticka-Tyndale, E. Specificity of the Calgary Depression Scale for schizophrenics. Schizophr. Res. 1994, 11, 239–244. [Google Scholar] [CrossRef]
- Addington, D.; Addington, J.; Maticka-Tyndale, E.; Joyce, J. Reliability and validity of a depression rating scale for schizophrenics. Schizophr. Res. 1992, 6, 201–208. [Google Scholar] [CrossRef]
- Spielberger, C.; Gorsuch, R.; Lushene, R. STAI Manual for the State-Trait Anxiety Inventory; Consulting Psychologists’ Press. Inc.: Palo Alto, CA, USA, 1970. [Google Scholar]
- Wrześniewski, K.; Sosnowski, T.; Jaworowska, A.; Fecenec, D. Inwentarz Stanu i Cechy Lęku STAI. Podręcznik; Pracownia Testów Psychologicznych PTP: Warszawa, Polska, 2011. [Google Scholar]
- Bernstein, D.; Fink, L. Manual for the Childhood Trauma Questionnaire; The Psychological Corporation: New York, NY, USA, 1998. [Google Scholar]
- Bernstein, D.P.; Ahluvalia, T.; Pogge, D.; Handelsman, L. Validity of the Childhood Trauma Questionnaire in an adolescent psychiatric population. J. Am. Acad. Child Adolesc. Psychiatry 1997, 36, 340–348. [Google Scholar] [CrossRef]
- Bernstein, D.P.; Fink, L.; Handelsman, L.; Foote, J.; Lovejoy, M.; Wenzel, K.; Sapareto, E.; Ruggiero, J. Initial reliability and validity of a new retrospective measure of child abuse and neglect. Am. J. Psychiatry 1994, 151, 1132–1136. [Google Scholar] [CrossRef]
- Szwajca, K. Uwarunkowania Transgeneracyjnego Przekazu Traumy u Potomstwa Osób Ocalałych z Holocaustu. Ph.D. Thesis, Uniwersytet Jagielloński, Collegium Medicum, Wydział Lekarski, Kraków, Polska, 2009. [Google Scholar]
- Cannon-Spoor, H.; Potkin, G.; Wyatt, R. Premorbid Adjustment Scale (PAS). Schizophr. Bull 1982, 8, 480–484. [Google Scholar]
- Rabinowitz, J.; Levine, S.Z.; Brill, N.; Bromet, E.J. The premorbid adjustment scale structured interview (PAS-SI): Preliminary findings. Schizophr. Res. 2007, 90, 255–257. [Google Scholar] [CrossRef]
- Nasreddine, Z.S.; Phillips, N.A.; Bédirian, V.; Charbonneau, S.; Whitehead, V.; Collin, I.; Cummings, J.L.; Chertkow, H. The Montreal Cognitive Assessment, MoCA: A brief screening tool for mild cognitive impairment. J. Am. Geriatr. Soc. 2005, 53, 695–699. [Google Scholar] [CrossRef] [PubMed]
- Green, M.F. What are the functional consequences of neurocognitive deficits in schizophrenia? Am. J. Psychiatry 1996, 153, 321–330. [Google Scholar] [CrossRef] [PubMed]
- Fisekovic, S.; Memic, A.; Pasalic, A. Correlation between moca and mmse for the assessment of cognition in schizophrenia. Acta Inform. Med. 2012, 20, 186–189. [Google Scholar] [CrossRef] [Green Version]
- Gil-Berrozpe, G.J.; Sánchez-Torres, A.M.; García de Jalón, E.; Moreno-Izco, L.; Fañanás, L.; Peralta, V.; Cuesta, M.J. Utility of the MoCA for cognitive impairment screening in long-term psychosis patients. Schizophr. Res. 2020, 216, 429–434. [Google Scholar] [CrossRef] [PubMed]
- Yang, Z.; Abdul Rashid, N.A.; Quek, Y.F.; Lam, M.; See, Y.M.; Maniam, Y.; Dauwels, J.; Tan, B.L.; Lee, J. Montreal Cognitive Assessment as a screening instrument for cognitive impairments in schizophrenia. Schizophr. Res. 2018, 199, 58–63. [Google Scholar] [CrossRef]
- Mandal, P.K.; Guha Roy, R.; Samkaria, A.; Maroon, J.C.; Arora, Y. In Vivo (13)C Magnetic Resonance Spectroscopy for Assessing Brain Biochemistry in Health and Disease. Neurochem. Res. 2022, 47, 1183–1201. [Google Scholar] [CrossRef]
- Pruett, B.S.; Meador-Woodruff, J.H. Evidence for altered energy metabolism, increased lactate, and decreased pH in schizophrenia brain: A focused review and meta-analysis of human postmortem and magnetic resonance spectroscopy studies. Schizophr. Res. 2020, 223, 29–42. [Google Scholar] [CrossRef]
- Haase, A.; Frahm, J.; Hanicke, W.; Matthaei, D. 1H NMR chemical shift selective (CHESS) imaging. Phys. Med. Biol. 1985, 30, 341. [Google Scholar] [CrossRef]
- Mao, J.; Mareci, T.; Andrew, E. Experimental study of optimal selective 180 radiofrequency pulses. J. Magn. Reson. 1969 1988, 79, 1–10. [Google Scholar] [CrossRef]
- Mescher, M.; Merkle, H.; Kirsch, J.; Garwood, M.; Gruetter, R. Simultaneous in vivo spectral editing and water suppression. NMR Biomed. Int. J. Devoted Dev. Appl. Magn. Reson. Vivo 1998, 11, 266–272. [Google Scholar] [CrossRef]
- Li, Z.; Xing, Y.; Guo, X.; Cui, Y. Development of an UPLC-MS/MS method for simultaneous quantitation of 11 d-amino acids in different regions of rat brain: Application to a study on the associations of d-amino acid concentration changes and Alzheimer’s disease. J. Chromatogr. B Analyt. Technol. Biomed Life Sci. 2017, 1058, 40–46. [Google Scholar] [CrossRef]
- Darczuk, D.; Krzyściak, W.; Bystrowska, B.; Kęsek, B.; Kościelniak, D.; Chomyszyn-Gajewska, M.; Kaczmarzyk, T. The relationship between the concentration of salivary tyrosine and antioxidants in patients with oral lichen planus. Oxidative Med. Cell. Longev. 2019, 29, 5801570. [Google Scholar] [CrossRef] [PubMed]
- Szczeklik, K.; Krzyściak, W.; Cibor, D.; Domagała-Rodacka, R.; Pytko-Polończyk, J.; Mach, T.; Owczarek, D. Markers of lipid peroxidation and antioxidant status in the serum and saliva of patients with active Crohn disease. Pol. Arch. Med. Wewnętrznej= Pol. Arch. Intern. Med. 2018, 128, 362–370. [Google Scholar]
- Szczeklik, K.; Owczarek, D.; Cibor, D.; Cześnikiewicz-Guzik, M.; Krzyściak, P.; Krawczyk, A.; Mach, T.; Karczewska, E.; Krzyściak, W. Relative homogeneity of oral bacterial flora in Crohn’s disease compared to ulcerative colitis and its connections with antioxidant defense—Preliminary report. Folia Med. Crac. 2019, 59, 15–35. [Google Scholar]
- Darczuk, D.; Krzysciak, W.; Vyhouskaya, P.; Kesek, B.; Galecka-Wanatowicz, D.; Lipska, W.; Kaczmarzyk, T.; Gluch-Lutwin, M.; Mordyl, B.; Chomyszyn-Gajewska, M. Salivary oxidative status in patients with oral lichen planus. J. Physiol. Pharmacol. Off. J. Pol. Physiol. Soc. 2016, 67, 885–894. [Google Scholar]
- Gordon, D., Jr.; Gibbons, R. Studies of the predominant cultivable micro-organisms from the human tongue. Arch. Oral Biol. 1966, 11, 627–632. [Google Scholar] [CrossRef] [PubMed]
- Matsushita, K.; Yamada-Furukawa, M.; Kurosawa, M.; Shikama, Y. Periodontal disease and periodontal disease-related bacteria involved in the pathogenesis of Alzheimer’s disease. J. Inflamm. Res. 2020, 13, 275. [Google Scholar] [CrossRef] [PubMed]
- Dickerson, F.; Dilmore, A.H.; Godoy-Vitorino, F.; Nguyen, T.T.; Paulus, M.; Pinto-Tomas, A.A.; Moya-Roman, C.; Zuniga-Chaves, I.; Severance, E.G.; Jeste, D.V. The Microbiome and Mental Health across the Lifespan; Springer: Berlin/Heidelberg, Germany, 2022. [Google Scholar]
- Ren, D.; Fu, Y.; Wang, L.; Liu, J.; Zhong, X.; Yuan, J.; Jiang, C.; Wang, H.; Li, Z. Tetrandrine ameliorated Alzheimer’s disease through suppressing microglial inflammatory activation and neurotoxicity in the 5XFAD mouse. Phytomedicine 2021, 90, 153627. [Google Scholar] [CrossRef]
- Olsen, I.; Hicks, S.D. Oral microbiota and autism spectrum disorder (ASD). J. Oral Microbiol. 2020, 12, 1702806. [Google Scholar] [CrossRef] [Green Version]
- Singhal, N.; Kumar, M.; Kanaujia, P.K.; Virdi, J.S. MALDI-TOF mass spectrometry: An emerging technology for microbial identification and diagnosis. Front. Microbiol. 2015, 6, 791. [Google Scholar] [CrossRef] [PubMed] [Green Version]
- Weis, C.; Cuénod, A.; Rieck, B.; Dubuis, O.; Graf, S.; Lang, C.; Oberle, M.; Brackmann, M.; Søgaard, K.K.; Osthoff, M.; et al. Direct antimicrobial resistance prediction from clinical MALDI-TOF mass spectra using machine learning. Nat. Med. 2022, 1, 164–174. [Google Scholar] [CrossRef]
- Elbehiry, A.; Aldubaib, M.; Abalkhail, A.; Marzouk, E.; ALbeloushi, A.; Moussa, I.; Ibrahem, M.; Albazie, H.; Alqarni, A.; Anagreyyah, S.; et al. How MALDI-TOF Mass Spectrometry Technology Contributes to Microbial Infection Control in Healthcare Settings. Vaccines 2022, 11, 1881. [Google Scholar] [CrossRef] [PubMed]
- Oviaño MRodríguez-Sánchez, B. MALDI-TOF mass spectrometry in the 21st century clinical microbiology laboratory. Enferm. Infecc. Microbiol. Clin. 2021, 4, 192–200. [Google Scholar] [CrossRef] [PubMed]
- Alizadeh, M.; Yousefi, L.; Pakdel, F.; Ghotaslou, R.; Rezaee, M.A.; Khodadadi, E.; Oskouei, M.A.; Soroush Barhaghi, M.H.; Kafil, H.S. MALDI-TOF Mass Spectroscopy Applications in Clinical Microbiology. Adv. Pharmacol. Pharm. Sci. 2021, 7, 9928238. [Google Scholar] [CrossRef]
- Sung, J.Y.; Hwang, Y.; Shin, M.H.; Park, M.S.; Lee, S.H.; Yong, D.; Lee, K. Utility of Conventional Culture and MALDI-TOF MS for Identification of Microbial Communities in Bronchoalveolar Lavage Fluid in Comparison with the GS Junior Next Generation Sequencing System. Ann. Lab. Med. 2018, 38, 110–118. [Google Scholar] [CrossRef]
- Jussiaux, F.; Miot-Sertier, C.; Nguyen-Lopez, D.; Badet, C.; Samot, J. Reliability of MALDI-TOF mass spectrometry to identify oral isolates of Streptococcus salivarius and Lactobacillus spp. Arch. Oral Biol. 2021, 121, 104983. [Google Scholar] [CrossRef]
- Lisman, J.E.; Coyle, J.T.; Green, R.W.; Javitt, D.C.; Benes, F.M.; Heckers, S.; Grace, A.A. Circuit-based framework for understanding neurotransmitter and risk gene interactions in schizophrenia. Trends Neurosci. 2008, 31, 234–242. [Google Scholar] [CrossRef] [Green Version]
- Buck, S.A.; Quincy Erickson-Oberg, M.; Logan, R.W.; Freyberg, Z. Relevance of interactions between dopamine and glutamate neurotransmission in schizophrenia. Mol. Psychiatry 2022, 27, 3583–3591. [Google Scholar] [CrossRef]
- Sesack SRCarr DBOmelchenko NPinto, A. Anatomical substrates for glutamate-dopamine interactions: Evidence for specificity of connections and extrasynaptic actions. Ann. N Y Acad. Sci. 2003, 1003, 36–52. [Google Scholar]
- Amat-Foraster, M.; Celada, P.; Richter, U.; Jensen, A.A.; Plath, N.; Artigas, F.; Herrik, K.F. Modulation of thalamo-cortical activity by the NMDA receptor antagonists ketamine and phencyclidine in the awake freely-moving rat. Neuropharmacology 2019, 158, 107745. [Google Scholar] [CrossRef] [PubMed]
- Halim, N.D.; Lipska, B.K.; Hyde, T.M.; Deep-Soboslay, A.; Saylor, E.M.; Herman, M.M.; Thakar, J.; Verma, A.; Kleinman, J.E. Increased lactate levels and reduced pH in postmortem brains of schizophrenics: Medication confounds. J. Neurosci. Methods 2008, 169, 208–213. [Google Scholar] [CrossRef] [PubMed] [Green Version]
- Pinacho, R.; Vila, E.; Prades, R.; Tarragó, T.; Castro, E.; Ferrer, I.; Ramos, B. The glial phosphorylase of glycogen isoform is reduced in the dorsolateral prefrontal cortex in chronic schizophrenia. Schizophr. Res. 2016, 177, 37–43. [Google Scholar] [CrossRef]
- Henkel, N.D.; Wu, X.; O’Donovan, S.M.; Devine, E.A.; Jiron, J.M.; Rowland, L.M.; Sarnyai, Z.; Ramsey, A.J.; Wen, Z.; Hahn, M.K.; et al. Schizophrenia: A disorder of broken brain bioenergetics. Mol. Psychiatry 2022, 27, 2393–2404. [Google Scholar] [CrossRef] [PubMed]
- Waagepetersen, H.S.; Sonnewald, U.; Larsson, O.M.; Schousboe, A. A possible role of alanine for ammonia transfer between astrocytes and glutamatergic neurons. J. Neurochem. 2000, 75, 471–479. [Google Scholar] [CrossRef] [Green Version]
- Bak, L.K.; Waagepetersen, H.S.; Schousboe, A. Role of Astrocytes in Depolarization-Coupled Release of Glutamate in Cerebellar Cultures. Neurochem. Res. 2004, 29, 257–265. [Google Scholar] [CrossRef]
- Berl, S.; Clarke, D. The metabolic compartmentation concept. In Glutamine, Glutamate and GABA in the Central Nervous System; Hertz, L., Kvamme, E., McGeer, E.G., Schousboe, A., Eds.; Alan R Liss. Inc.: New York, NY, USA, 1983. [Google Scholar]
- Yudkoff, M.; Zaleska, M.M.; Nissim, I.; Nelson, D.; ErecinAska, M. Neuronal Glutamine Utilization: Pathways of Nitrogen Transfer tudied with [15N] Glutamine. J. Neurochem. 1989, 53, 632–640. [Google Scholar] [CrossRef]
- Erecińska, M.; Zaleska, M.M.; Nelson, D.; Nissim, I.; Yudkoff, M. Neuronal glutamine utilization: Glutamine/glutamate homeostasis in synaptosomes. J. Neurochem. 1990, 54, 2057–2069. [Google Scholar] [CrossRef]
- Alijevic, O.; Peng, Z.; Kellenberger, S. Changes in H+, K+, and Ca2+ Concentrations, as Observed in Seizures, Induce Action Potential Signaling in Cortical Neurons by a Mechanism That Depends Partially on Acid-Sensing Ion Channels. Front. Cell. Neurosci. 2021, 423. [Google Scholar] [CrossRef]
- Wang, Y.-Z.; Xu, T.-L. Acidosis, acid-sensing ion channels, and neuronal cell death. Mol. Neurobiol. 2011, 44, 350–358. [Google Scholar] [CrossRef]
- MacDonald, J.F.; Xiong, Z.-G.; Jackson, M.F. Paradox of Ca2+ signaling, cell death and stroke. Trends Neurosci. 2006, 29, 75–81. [Google Scholar] [CrossRef] [PubMed]
- Pignataro, G.; Simon, R.P.; Xiong, Z.-G. Prolonged activation of ASIC1a and the time window for neuroprotection in cerebral ischaemia. Brain 2007, 130, 151–158. [Google Scholar] [CrossRef] [PubMed]
- Simon, R.P. Acidotoxicity trumps excitotoxicity in ischemic brain. Arch. Neurol. 2006, 63, 1368–1371. [Google Scholar] [CrossRef] [Green Version]
- Harmata, G.I.; Chan, A.C.; Merfeld, M.J.; Taugher-Hebl, R.J.; Harijan, A.K.; Hardie, J.B.; Fan, R.; Long, J.D.; Wang, G.Z.; Dlouhy, B.J. Intoxicating effects of alcohol depend on acid-sensing ion channels. Neuropsychopharmacology. [CrossRef]
- Trubetskoy, V.; Pardiñas, A.; Qi, T. PsychENCODE; Psychosis Endophenotypes International Consortium; SynGO Consortium; Schizophrenia Working Group of the Psychiatric Genomics Consortium. Mapping genomic loci implicates genes and synaptic biology in schizophrenia. Nature 2022, 604, 502–508. [Google Scholar] [CrossRef]
- Kraguljac, N.V.; McDonald, W.M.; Widge, A.S.; Rodriguez, C.I.; Tohen, M.; Nemeroff, C.B. Neuroimaging biomarkers in schizophrenia. Am. J. Psychiatry 2021, 178, 509–521. [Google Scholar] [CrossRef] [PubMed]
- Harrison, P.J.; Law, A.J.; Eastwood, S.L. Glutamate receptors and transporters in the hippocampus in schizophrenia. Ann. New York Acad. Sci. 2003, 1003, 94–101. [Google Scholar] [CrossRef] [PubMed]
- Shan, B.; Ai, Z.; Zeng, S.; Song, Y.; Song, J.; Zeng, Q.; Liao, Z.; Wang, T.; Huang, C.; Su, D. Gut microbiome-derived lactate promotes to anxiety-like behaviors through GPR81 receptor-mediated lipid metabolism pathway. Psychoneuroendocrinology 2020, 117, 104699. [Google Scholar] [CrossRef]
- Nguyen, T.T.; Kosciolek, T.; Daly, R.E.; Vázquez-Baeza, Y.; Swafford, A.; Knight, R.; Jeste, D.V. Gut microbiome in Schizophrenia: Altered functional pathways related to immune modulation and atherosclerotic risk. Brain Behav. Immun. 2021, 91, 245–256. [Google Scholar] [CrossRef]
- Li, S.; Zhuo, M.; Huang, X.; Huang, Y.; Zhou, J.; Xiong, D.; Li, J.; Liu, Y.; Pan, Z.; Li, H. Altered gut microbiota associated with symptom severity in schizophrenia. PeerJ 2020, 8, e9574. [Google Scholar] [CrossRef]
- Yolken, R.; Prandovszky, E.; Severance, E.G.; Hatfield, G.; Dickerson, F. The oropharyngeal microbiome is altered in individuals with schizophrenia and mania. Schizophr. Res. 2021, 234, 51–57. [Google Scholar] [CrossRef]
- Dave, M.; Higgins, P.D.; Middha, S.; Rioux, K.P. The human gut microbiome: Current knowledge, challenges, and future directions. Transl. Res. 2012, 160, 246–257. [Google Scholar] [CrossRef]
- D’Aiuto, F.; Parkar, M.; Andreou, G.; Suvan, J.; Brett, P.M.; Ready, D.; Tonetti, M.S. Periodontitis and systemic inflammation: Control of the local infection is associated with a reduction in serum inflammatory markers. J. Dent. Res. 2004, 83, 156–160. [Google Scholar] [CrossRef] [PubMed]
- Pietropaoli, D.; Ortu, E.; Severino, M.; Ciarrocchi, I.; Gatto, R.; Monaco, A. Glycation and oxidative stress in the failure of dental implants: A case series. BMC Res. Notes 2013, 6, 296. [Google Scholar] [CrossRef] [Green Version]
- Matsha, T.E.; Prince, Y.; Davids, S.; Chikte, U.; Erasmus, R.T.; Kengne, A.; Davison, G. Oral microbiome signatures in diabetes mellitus and periodontal disease. J. Dent. Res. 2020, 99, 658–665. [Google Scholar] [CrossRef] [PubMed]
- Mishima, E.; Abe, T. Role of the microbiota in hypertension and antihypertensive drug metabolism. Hypertens. Res. 2022, 45, 246–253. [Google Scholar] [CrossRef] [PubMed]
- Koren, O.; Spor, A.; Felin, J.; Fåk, F.; Stombaugh, J.; Tremaroli, V.; Behre, C.J.; Knight, R.; Fagerberg, B.; Ley, R.E. Human oral, gut, and plaque microbiota in patients with atherosclerosis. Proc. Natl. Acad. Sci. USA 2011, 108, 4592–4598. [Google Scholar] [CrossRef] [PubMed]
- Benahmed, A.G.; Gasmi, A.; Doşa, A.; Chirumbolo, S.; Mujawdiya, P.K.; Aaseth, J.; Dadar, M.; Bjørklund, G. Association between the gut and oral microbiome with obesity. Anaerobe 2021, 70, 102248. [Google Scholar] [CrossRef] [PubMed]
- Cirstea, M.S.; Kliger, D.; MacLellan, A.D.; Yu, A.C.; Langlois, J.; Fan, M.; Boroomand, S.; Kharazyan, F.; Hsiung, R.G.; MacVicar, B.A. The Oral and Fecal Microbiota in a Canadian Cohort of Alzheimer’s Disease. J. Alzheimer’s Dis. 2022, 87, 247–258. [Google Scholar] [CrossRef]
- Moutsopoulos, N.M.; Madianos, P.N. Low-grade inflammation in chronic infectious diseases: Paradigm of periodontal infections. Ann. New York Acad. Sci. 2006, 1088, 251–264. [Google Scholar] [CrossRef]
- Yolken, R.H.; Severance, E.G.; Sabunciyan, S.; Gressitt, K.L.; Chen, O.; Stallings, C.; Origoni, A.; Katsafanas, E.; Schweinfurth, L.A.; Savage, C.L. Metagenomic sequencing indicates that the oropharyngeal phageome of individuals with schizophrenia differs from that of controls. Schizophr. Bull. 2015, 41, 1153–1161. [Google Scholar] [CrossRef] [PubMed] [Green Version]
- Intengan, H.D.; Schiffrin, E.L. Vascular remodeling in hypertension: Roles of apoptosis, inflammation, and fibrosis. Hypertension 2001, 38, 581–587. [Google Scholar] [CrossRef] [PubMed] [Green Version]
- Śmierciak, N.; Krzyściak, W.; Szwajca, M.; Bryll, A.; Popiela, T.; Karcz, P.; Pilecki, M. Relationship of metabolic parameters with the course of the first episode of psychosis–preliminary research. Psychiatr. Pol. 2021, 55, 525–540. [Google Scholar] [CrossRef] [PubMed]
- Müller, N. Inflammation in schizophrenia: Pathogenetic aspects and therapeutic considerations. Schizophr. Bull. 2018, 44, 973–982. [Google Scholar] [CrossRef] [PubMed] [Green Version]
- Śmierciak, N.; Krzyściak, W.; Szwajca, M.; Szczęsny-Malysiak, E.; Kij, A.; Chłopicki, S.; Pilecki, M. Improvement in clinical symptoms in patients with the first episode of psychosis is associated with a decrease in systemic nitric oxide availability. A pilot study. Psychiatr. Pol. 2021, 55, 541–554. [Google Scholar] [CrossRef]
- Śmierciak, N.; Szwajca, M.; Popiela, T.J.; Bryll, A.; Karcz, P.; Donicz, P.; Turek, A.; Krzyściak, W.; Pilecki, M. Redefining the Cut-Off Ranges for TSH Based on the Clinical Picture, Results of Neuroimaging and Laboratory Tests in Unsupervised Cluster Analysis as Individualized Diagnosis of Early Schizophrenia. J. Pers. Med. 2022, 12, 247. [Google Scholar] [CrossRef]
- Erny, D. Hrabě de Angelis AL, Prinz M. Communicating systems in the body: How microbiota and microglia cooperate. Immunology 2017, 150, 7–15. [Google Scholar] [CrossRef]
- Hyland, N.P.; Cryan, J.F. Microbe-host interactions: Influence of the gut microbiota on the enteric nervous system. Dev. Biol. 2016, 417, 182–187. [Google Scholar] [CrossRef]
- Sherwin, E.; Sandhu, K.V.; Dinan, T.G.; Cryan, J.F. May the force be with you: The light and dark sides of the microbiota–gut–brain axis in neuropsychiatry. CNS Drugs 2016, 30, 1019–1041. [Google Scholar] [CrossRef] [Green Version]
- Dalile, B.; Van Oudenhove, L.; Vervliet, B.; Verbeke, K. The role of short-chain fatty acids in microbiota–gut–brain communication. Nat. Rev. Gastroenterol. Hepatol. 2019, 16, 461–478. [Google Scholar] [CrossRef]
- Fröhlich, E.E.; Farzi, A.; Mayerhofer, R.; Reichmann, F.; Jačan, A.; Wagner, B.; Zinser, E.; Bordag, N.; Magnes, C.; Fröhlich, E. Cognitive impairment by antibiotic-induced gut dysbiosis: Analysis of gut microbiota-brain communication. Brain Behav. Immun. 2016, 56, 140–155. [Google Scholar] [CrossRef] [Green Version]
- Chen, X.; Xu, J.; Wang, H.; Luo, J.; Wang, Z.; Chen, G.; Jiang, D.; Cao, R.; Huang, H.; Luo, D. Profiling the differences of gut microbial structure between schizophrenia patients with and without violent behaviors based on 16S rRNA gene sequencing. Int. J. Leg. Med. 2021, 135, 131–141. [Google Scholar] [CrossRef] [PubMed]
- Gareau, M. Cognitive function and the microbiome. Int. Rev. Neurobiol. 2016, 131, 227–246. [Google Scholar]
- Kelly, J.R.; Minuto, C.; Cryan, J.F.; Clarke, G.; Dinan, T.G. The role of the gut microbiome in the development of schizophrenia. Schizophr. Res. 2021, 234, 4–23. [Google Scholar] [CrossRef]
- Zheng, P.; Zeng, B.; Liu, M.; Chen, J.; Pan, J.; Han, Y.; Liu, Y.; Cheng, K.; Zhou, C.; Wang, H. The gut microbiome from patients with schizophrenia modulates the glutamate-glutamine-GABA cycle and schizophrenia-relevant behaviors in mice. Sci. Adv. 2019, 5, eaau8317. [Google Scholar] [CrossRef] [Green Version]
- Fan, Y.; Gao, Y.; Ma, Q.; Yang, Z.; Zhao, B.; He, X.; Yang, J.; Yan, B.; Gao, F.; Qian, L. Multi-omics analysis reveals aberrant gut-metabolome-immune network in schizophrenia. Front. Immunol. 2022, 3, 812293. [Google Scholar] [CrossRef] [PubMed]
- Castro-Nallar, E.; Bendall, M.L.; Pérez-Losada, M.; Sabuncyan, S.; Severance, E.G.; Dickerson, F.B.; Schroeder, J.R.; Yolken, R.H.; Crandall, K.A. Composition, taxonomy and functional diversity of the oropharynx microbiome in individuals with schizophrenia and controls. PeerJ 2015, 3, e1140. [Google Scholar] [CrossRef] [PubMed]
- Shiga, Y.; Aoki, S.; Hosomi, N.; Nomura, R.; Nakamori, M.; Nezu, T.; Tachiyama, K.; Kamimura, T.; Kinoshita, N.; Shimomura, R. cnm-Positive Streptococcus mutans and diffusion-weighted imaging hyperintensities in acute intracerebral hemorrhage. Eur. J. Neurol. 2021, 28, 1581–1589. [Google Scholar] [CrossRef] [PubMed]
- Tavana, A. Porphyromonas gingivalis and Porphyromonas endodontalis and their roles in systematic diseases: True or false. Indian J. Dent. Res. 2009, 20, 248. [Google Scholar] [CrossRef] [PubMed]
- Hallikainen, J.; Pyysalo, M.; Keränen, S.; Kellokoski, J.; Koivisto, T.; Suominen, A.L.; Pussinen, P.; Pessi, T.; Frösen, J. Systemic immune response against the oral pathogens Porphyromonas gingivalis and Aggregatibacter actinomycetemcomitans is associated with the formation and rupture of intracranial aneurysms. Eur. J. Neurol. 2021, 28, 3089–3099. [Google Scholar] [CrossRef]
- McGuinness, A.; Davis, J.; Dawson, S.; Loughman, A.; Collier, F.; O’Hely, M.; Simpson, C.; Green, J.; Marx, W.; Hair, C. A systematic review of gut microbiota composition in observational studies of major depressive disorder, bipolar disorder and schizophrenia. Mol. Psychiatry 2022, 27, 1920–1935. [Google Scholar] [CrossRef]
- Neis, E.P.; Dejong, C.H.; Rensen, S.S. The role of microbial amino acid metabolism in host metabolism. Nutrients 2015, 7, 2930–2946. [Google Scholar] [CrossRef] [Green Version]
- Ng, S.K.; Hamilton, I.R. Carbon dioxide fixation by Veillonella parvula M4 and its relation to propionic acid formation. Can. J. Microbiol. 1973, 19, 715–723. [Google Scholar] [CrossRef] [PubMed]
- Hao, C.; Gao, Z.; Liu, X.; Rong, Z.; Jia, J.; Kang, K.; Guo, W.; Li, J. Intravenous administration of sodium propionate induces antidepressant or prodepressant effect in a dose dependent manner. Sci. Rep. 2020, 10, 19917. [Google Scholar] [CrossRef] [PubMed]
- Smith, N.W.; Shorten, P.R.; Altermann, E.H.; Roy, N.C.; McNabb, W.C. Hydrogen cross-feeders of the human gastrointestinal tract. Gut Microbes 2019, 10, 270–288. [Google Scholar] [CrossRef] [Green Version]
- Bravo, J.A.; Julio-Pieper, M.; Forsythe, P.; Kunze, W.; Dinan, T.G.; Bienenstock, J.; Cryan, J.F. Communication between gastrointestinal bacteria and the nervous system. Curr. Opin. Pharmacol. 2012, 12, 667–672. [Google Scholar] [CrossRef]
- Butler, M.I.; Long-Smith, C.; Moloney, G.M.; Morkl, S.; O’Mahony, S.M.; Cryan, J.F.; Clarke, G.; Dinan, T.G. The immune-kynurenine pathway in social anxiety disorder. Brain Behav. Immun. 2022, 99, 317–326. [Google Scholar] [CrossRef]
- Alkhalaf, L.M.; Ryan, K.S. Biosynthetic manipulation of tryptophan in bacteria: Pathways and mechanisms. Chem. Biol. 2015, 22, 317–328. [Google Scholar] [CrossRef] [PubMed]
- Fujigaki, H.; Mouri, A.; Yamamoto, Y.; Nabeshima, T.; Saito, K. Linking phencyclidine intoxication to the tryptophan-kynurenine pathway: Therapeutic implications for schizophrenia. Neurochem. Int. 2019, 125, 1–6. [Google Scholar] [CrossRef]
- Gao, K.; Mu, C.-l.; Farzi, A.; Zhu, W.-y. Tryptophan metabolism: A link between the gut microbiota and brain. Adv. Nutr. 2020, 11, 709–723. [Google Scholar] [CrossRef] [PubMed]
- Roager, H.; Licht, T. Microbial tryptophan catabolites in health and disease. Nat. Commun. 2018, 9, 3294. [Google Scholar] [CrossRef] [PubMed] [Green Version]
- Krishnan, S.; Ding, Y.; Saedi, N.; Choi, M.; Sridharan, G.V.; Sherr, D.H.; Yarmush, M.L.; Alaniz, R.C.; Jayaraman, A.; Lee, K. Gut Microbiota-Derived Tryptophan Metabolites Modulate Inflammatory Response in Hepatocytes and Macrophages. Cell Rep. 2018, 23, 1099–1111. [Google Scholar] [CrossRef] [PubMed]
- Haukvik, U.K.; Westlye, L.T.; Mørch-Johnsen, L.; Jørgensen, K.N.; Lange, E.H.; Dale, A.M.; Melle, I.; Andreassen, O.A.; Agartz, I. In vivo hippocampal subfield volumes in schizophrenia and bipolar disorder. Biol. Psychiatry 2015, 77, 581–588. [Google Scholar] [CrossRef] [PubMed] [Green Version]
- Janiri, D.; Sani, G.; De Rossi, P.; Piras, F.; Banaj, N.; Ciullo, V.; Simonetti, A.; Arciniegas, D.B.; Spalletta, G. Hippocampal subfield volumes and childhood trauma in bipolar disorders. J. Affect. Disord. 2019, 253, 35–43. [Google Scholar] [CrossRef] [PubMed]
- Ramdas, D.L.; Sbrilli, M.D.; Laurent, H.K. Impact of maternal trauma-related psychopathology and life stress on HPA axis stress response. Arch. Women’s Ment. Health 2022, 25, 121–128. [Google Scholar] [CrossRef] [PubMed]
- Chang, W.C.; Tang, J.Y.M.; Hui, C.L.M.; Wong, G.H.Y.; Chan, S.K.W.; Lee, E.H.M.; Chen, E.Y.H. The relationship of early premorbid adjustment with negative symptoms and cognitive functions in first-episode schizophrenia: A prospective three-year follow-up study. Psychiatry Res. 2013, 209, 353–360. [Google Scholar] [CrossRef]
- Stefanatou, P.; Karatosidi, C.-S.; Tsompanaki, E.; Kattoulas, E.; Stefanis, N.C.; Smyrnis, N. Premorbid adjustment predictors of cognitive dysfunction in schizophrenia. Psychiatry Res. 2018, 267, 249–255. [Google Scholar] [CrossRef]
- Akkasheh, G.; Kashani-Poor, Z.; Tajabadi-Ebrahimi, M.; Jafari, P.; Akbari, H.; Taghizadeh, M.; Memarzadeh, M.R.; Asemi, Z.; Esmaillzadeh, A. Clinical and metabolic response to probiotic administration in patients with major depressive disorder: A randomized, double-blind, placebo-controlled trial. Nutrition 2016, 32, 315–320. [Google Scholar] [CrossRef]
- Dickerson, F.B.; Stallings, C.; Origoni, A.; Katsafanas, E.; Savage, C.L.; Schweinfurth, L.A.; Goga, J.; Khushalani, S.; Yolken, R.H. Effect of probiotic supplementation on schizophrenia symptoms and association with gastrointestinal functioning: A randomized, placebo-controlled trial. Prim. Care Companion CNS Disord. 2014, 16, 26294. [Google Scholar] [CrossRef] [Green Version]
- Siqueira, J.F.; Rôças, I.N., Jr.; Rôças, I.N. Present status and future directions: Microbiology of endodontic infections. Int. Endod. J. 2022, 55, 512–530. [Google Scholar] [CrossRef]


| Concentration | M | Me | SD | Min | Max | Q1 | Q3 | Statistical Test Result * |
|---|---|---|---|---|---|---|---|---|
| No. 1 | 124.7 | 126 | 8.24 | 110 | 141 | 116.5 | 130 | U = 0; p < 0.001; eta2 = 0.74 |
| No. 2 | 87.95 | 89.5 | 9.29 | 69 | 100 | 81.5 | 95.75 |
| rho Spearmana | Parameter | Correlation Coefficient | Bilateral Relevance |
|---|---|---|---|
| Prevotella nigrescens | |||
| Hamilton scale | rs = 0.422 | p = 0.007 | |
| Duration of the disease | rs = 0.343 | p = 0.033 | |
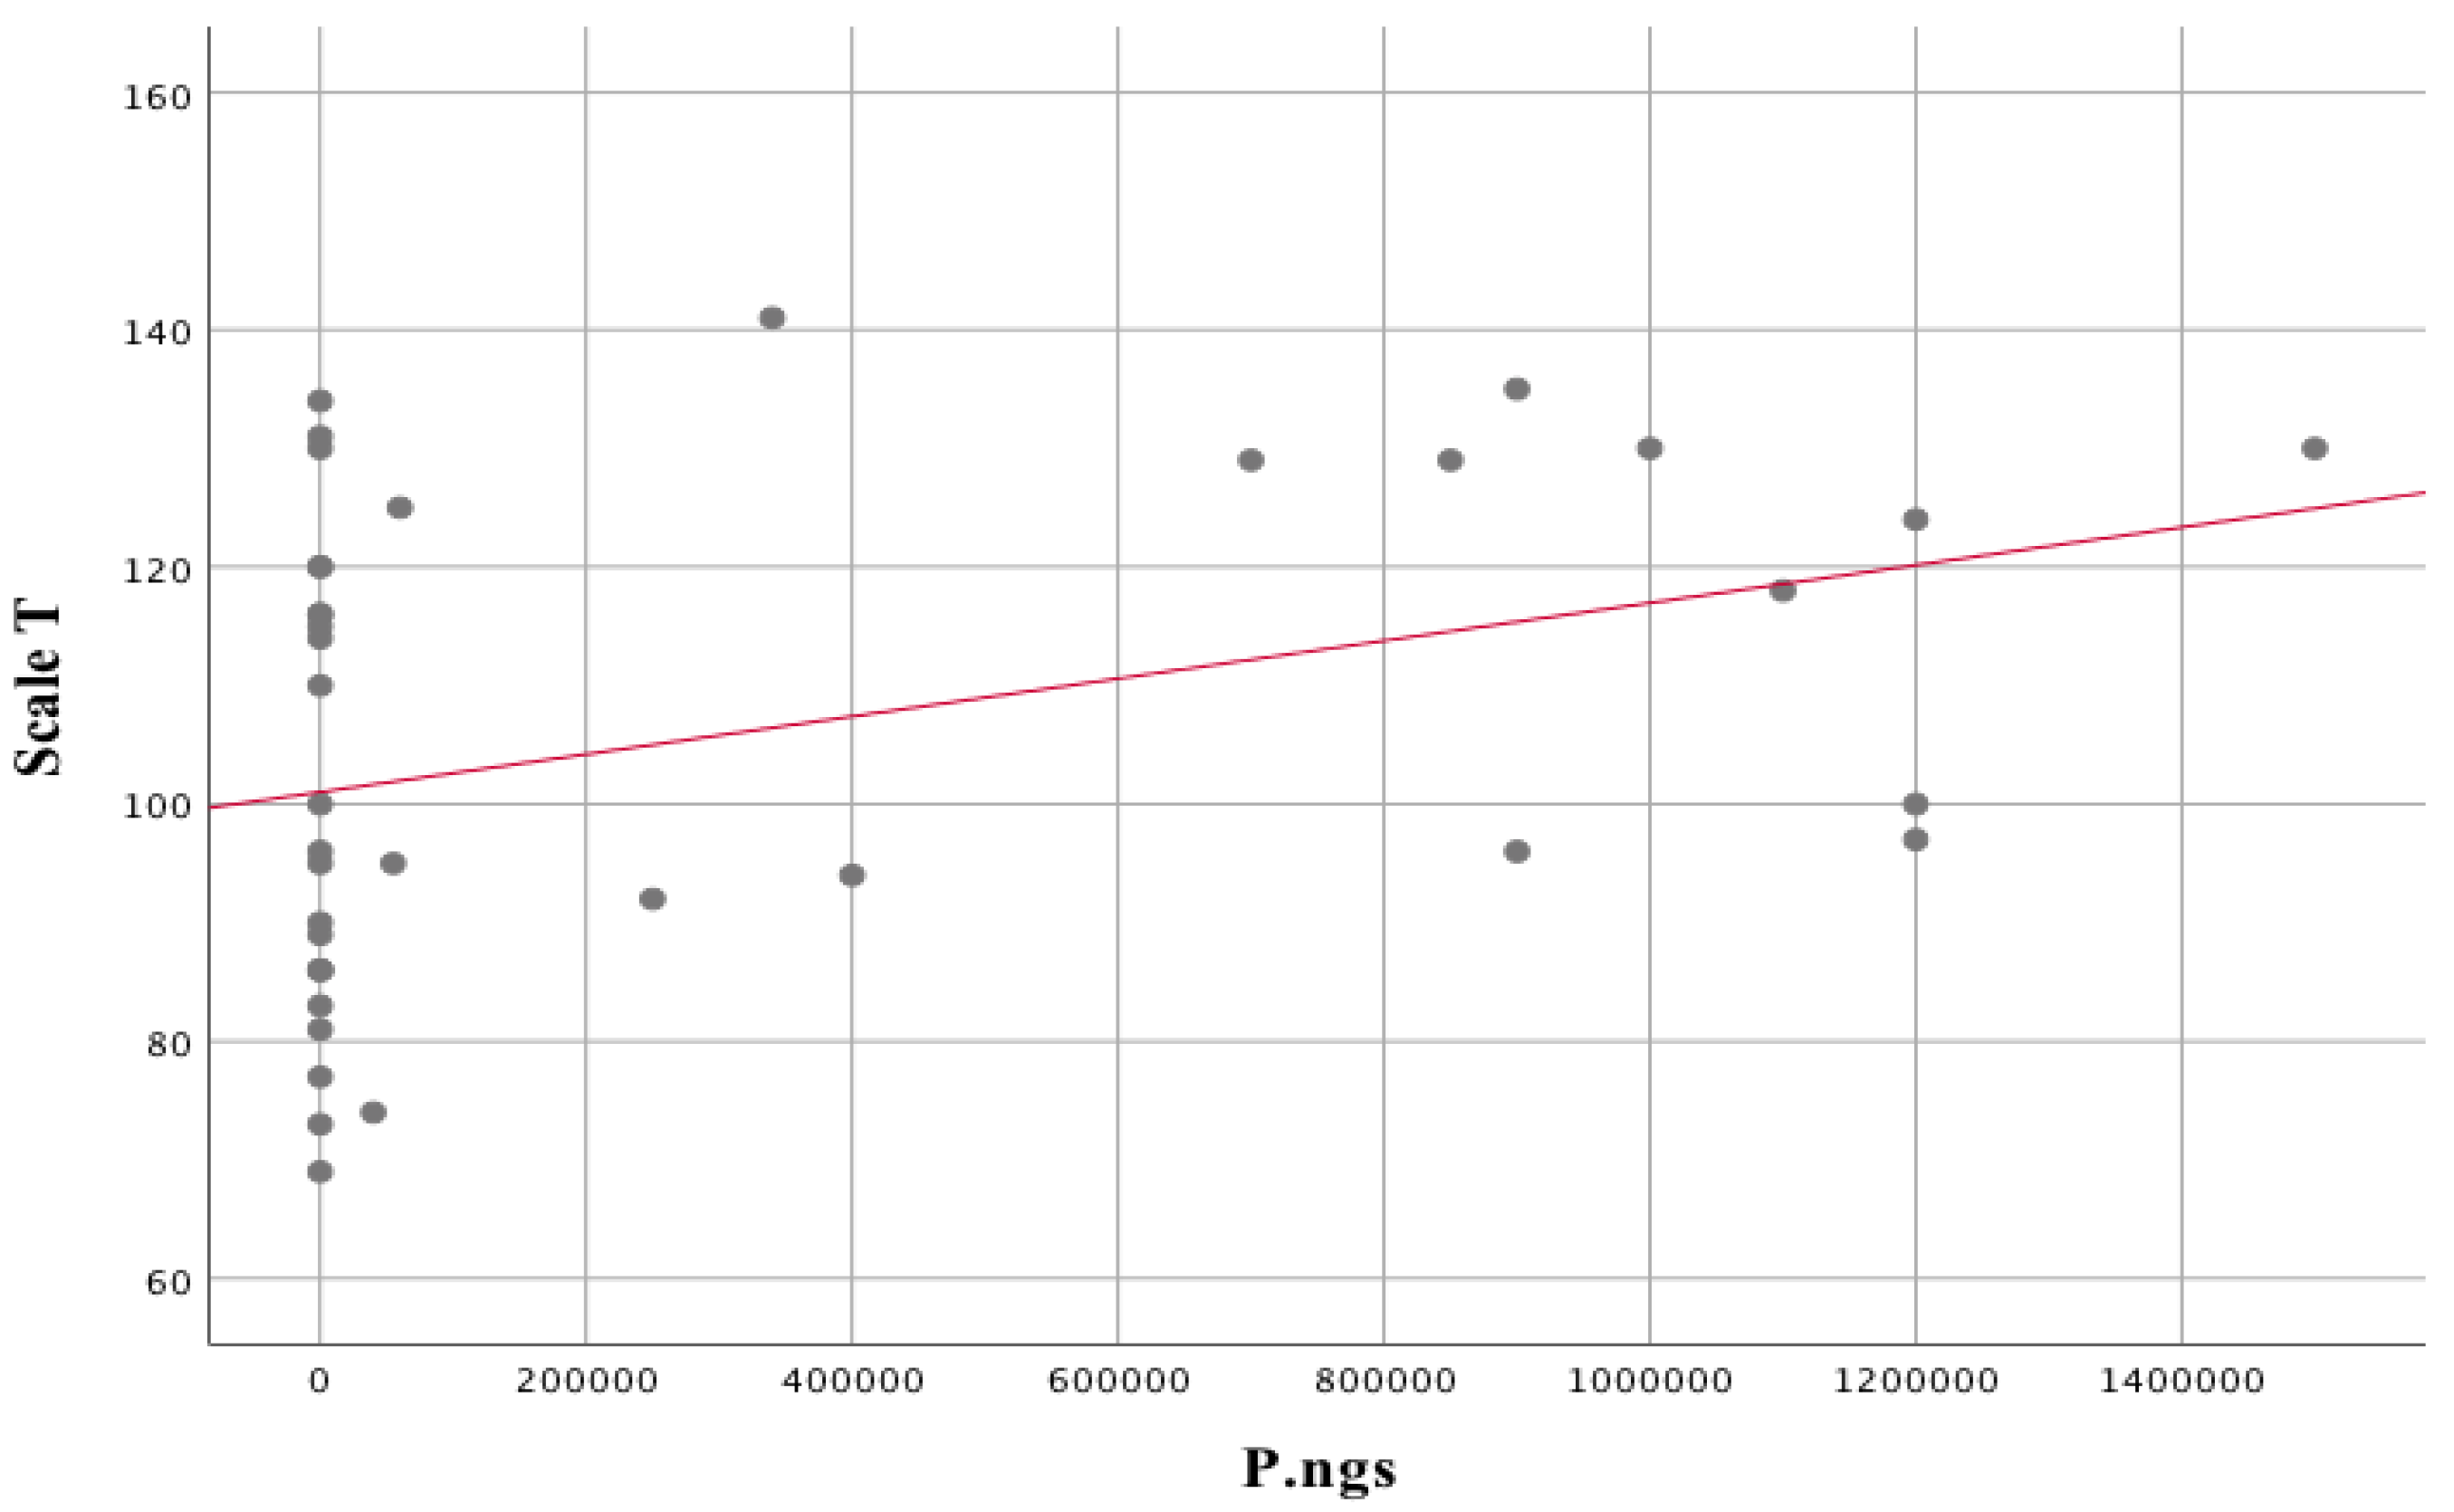
| Scale T | rs = 0.372 | p = 0.020 | |
| CTQ EN | rs = −0.392 | p = 0.013 | |
| CTQ EA | rs = −0.390 | p = 0.014 | |
| CTQ M | rs = −0.378 | p = 0.018 | |
| 5-HT [ng/mL] | rs = −0.374 | p = 0.019 | |
| TRP [ug/mL] | rs = −0.509 | p = 0.001 | |
| ALA [mM] | rs = 0.496 | p = 0.001 | |
| Veilonella spp. | |||
| Hamilton scale | rs = 0.453 | p = 0.004 | |
| 5-HT [ng/mL] | rs = −0.386 | p = 0.015 | |
| LAC [mM] | rs = 0.344 | p = 0.032 | |
| ALA [mM] | rs = 0.409 | p = 0.010 | |
| Actinomyces graevenitzii | |||
| Veilonella spp. | rs = 0.371 | p = 0.020 | |
| Strepptococcus gordonii | rs = 0.438 | p = 0.005 | |
| Staphylococcus epidermidis | rs = 0.331 | p = 0.039 | |
| Rothia mucilaginosa | rs = 0.419 | p = 0.009 | |
| Prevotella spp. | rs = 0.511 | p = 0.001 | |
| Neisseria macacae | rs = 0.509 | p = 0.001 | |
| Lactobacillus rhamnosus | rs = 0.385 | p = 0.016 | |
| Leptotrichia sp. | rs = 0.327 | p = 0.042 | |
| Gemella spp. | rs = 0.393 | p = 0.013 | |
| Actinomyces odontolyticus | rs = 0.414 | p = 0.009 | |
| Actinomyces naeslundii | rs = 0.777 | p = 0.001 | |
| ACC_LAC | rs = 0.360 | p = 0.024 | |
| Neisseria spp. | |||
| CTQ SA | rs = 0.327 | p = 0.042 | |
| PAS_LA | rs = −0.437 | p = 0.014 | |
| 5-HT [ng/mL] | rs = 0.413 | p = 0.009 | |
| TRP [ug/mL] | rs = 0.487 | p = 0.002 | |
| ALA [mM] | rs = −0.350 | p = 0.029 | |
| Fusobacterium spp. | |||
| New_N | rs = −0.337 | p = 0.036 | |
| neg_1 | rs = −0.328 | p = 0.041 | |
| Lactobacillus rhamnosus | |||
| Hamilton scale | rs = −0.466 | p = 0.003 | |
| STAI_Cecha1 | rs = −0.324 | p = 0.044 | |
| 5-HT [ng/mL] | rs = −0.713 | p = 0.001 | |
| TRP [ug/mL] | rs = −0.486 | p = 0.002 | |
| ALA [mM] | rs = −0.392 | p = 0.013 | |
| Actinomyces graevenitzii | rs = 0.385 | p = 0.016 | |
| Actinomyces viscosus | rs = 0.323 | p = 0.045 | |
| Prevotella sp. | rs = 0.679 | p = 0.001 | |
| Streptococcus parasanguinis | rs = 0.404 | p = 0.011 | |
| Streptococcus salivarius | rs = 0.389 | p = 0.014 | |
| Lactobacillus acidophilus | |||
| Hamilton scale | rs = −0.617 | p = 0.001 | |
| Number of episodes | rs = 0.356 | p = 0.026 | |
| MoCa | rs = −0.394 | p = 0.013 | |
| PASGB | rs = −0.429 | p = 0.016 | |
| 5-HT [ng/mL] | rs = 0.428 | p = 0.007 | |
| TRP [ug/mL] | rs = 0.394 | p = 0.013 | |
| ALA [mM] | rs = −0.614 | p = 0.001 | |
| Bacillus circulans | rs = 0.534 | p = 0.001 | |
| Staphylococcus epidermidis | rs = −0.365 | p = 0.022 | |
| Streptococcus parasanguinis | rs = 0.506 | p = 0.001 | |
| Gemella haemolysans | |||
| DUP | rs = 0.335 | p = 0.037 | |
| T scale | rs = 0.339 | p = 0.035 | |
| exc_1 | rs = 0.328 | p = 0.041 | |
| STAIcecha_1 | rs = −0.365 | p = 0.022 | |
| STAIstan_1 | rs = 0.348 | p = 0.030 | |
| STAIcecha_1 | rs = 0.365 | p = 0.022 | |
| CTQ_SA | rs = 0.438 | p = 0.005 | |
| Streptococcus vestibularis | rs = 0.333 | p = 0.038 | |
| Leptotrichia sp. | |||
| Hamilton scale | rs = −0.466 | p = 0.003 | |
| T scale | rs = 0.317 | p = 0.049 | |
| Calgary | rs = −0.332 | p = 0.039 | |
| LAC [mM] | rs = 0.665 | p < 0.001 | |
| ALA [mM] | rs = 0.340 | p = 0.034 | |
| ACC Glutamate | rs = 0.406 | p = 0.013 | |
| Actinomyces graevenitzii | rs = 0.327 | p = 0.042 | |
| Actinomyces naeslundi | rs = 0.654 | p < 0.001 | |
| Gemella sp. | rs = 0.658 | p < 0.001 | |
| Neisseria flavescens | rs = 0.466 | p < 0.001 | |
| Neisseria macacae | rs = 0.603 | p < 0.001 | |
| Rothia dentocariosa | rs = 0.416 | p = 0.008 | |
| Rothia mucilaginosa | rs = 0.554 | p < 0.001 | |
| Scardovia wiggsiae | rs = 0.591 | p < 0.001 | |
| Staphylococcus epidermidis | rs = 0.492 | p = 0.001 | |
| Staphylococcus haemolyticus | rs = 0.434 | p = 0.006 | |
| Streptococcus mutans | rs = 0.380 | p = 0.017 | |
| Streptococcus oralis | rs = 0.403 | p = 0.011 | |
| Streptococcus sobrinus | |||
| Scale T | rs = 0.339 | p = 0.035 | |
| CTQ_M | rs = −0.334 | p = 0.038 | |
| Streptococcus sp. | rs = 0.404 | p = 0.011 | |
| Prevotella nigrescens | rs = 0.423 | p = 0.007 | |
| Streptococcus salivarius | |||
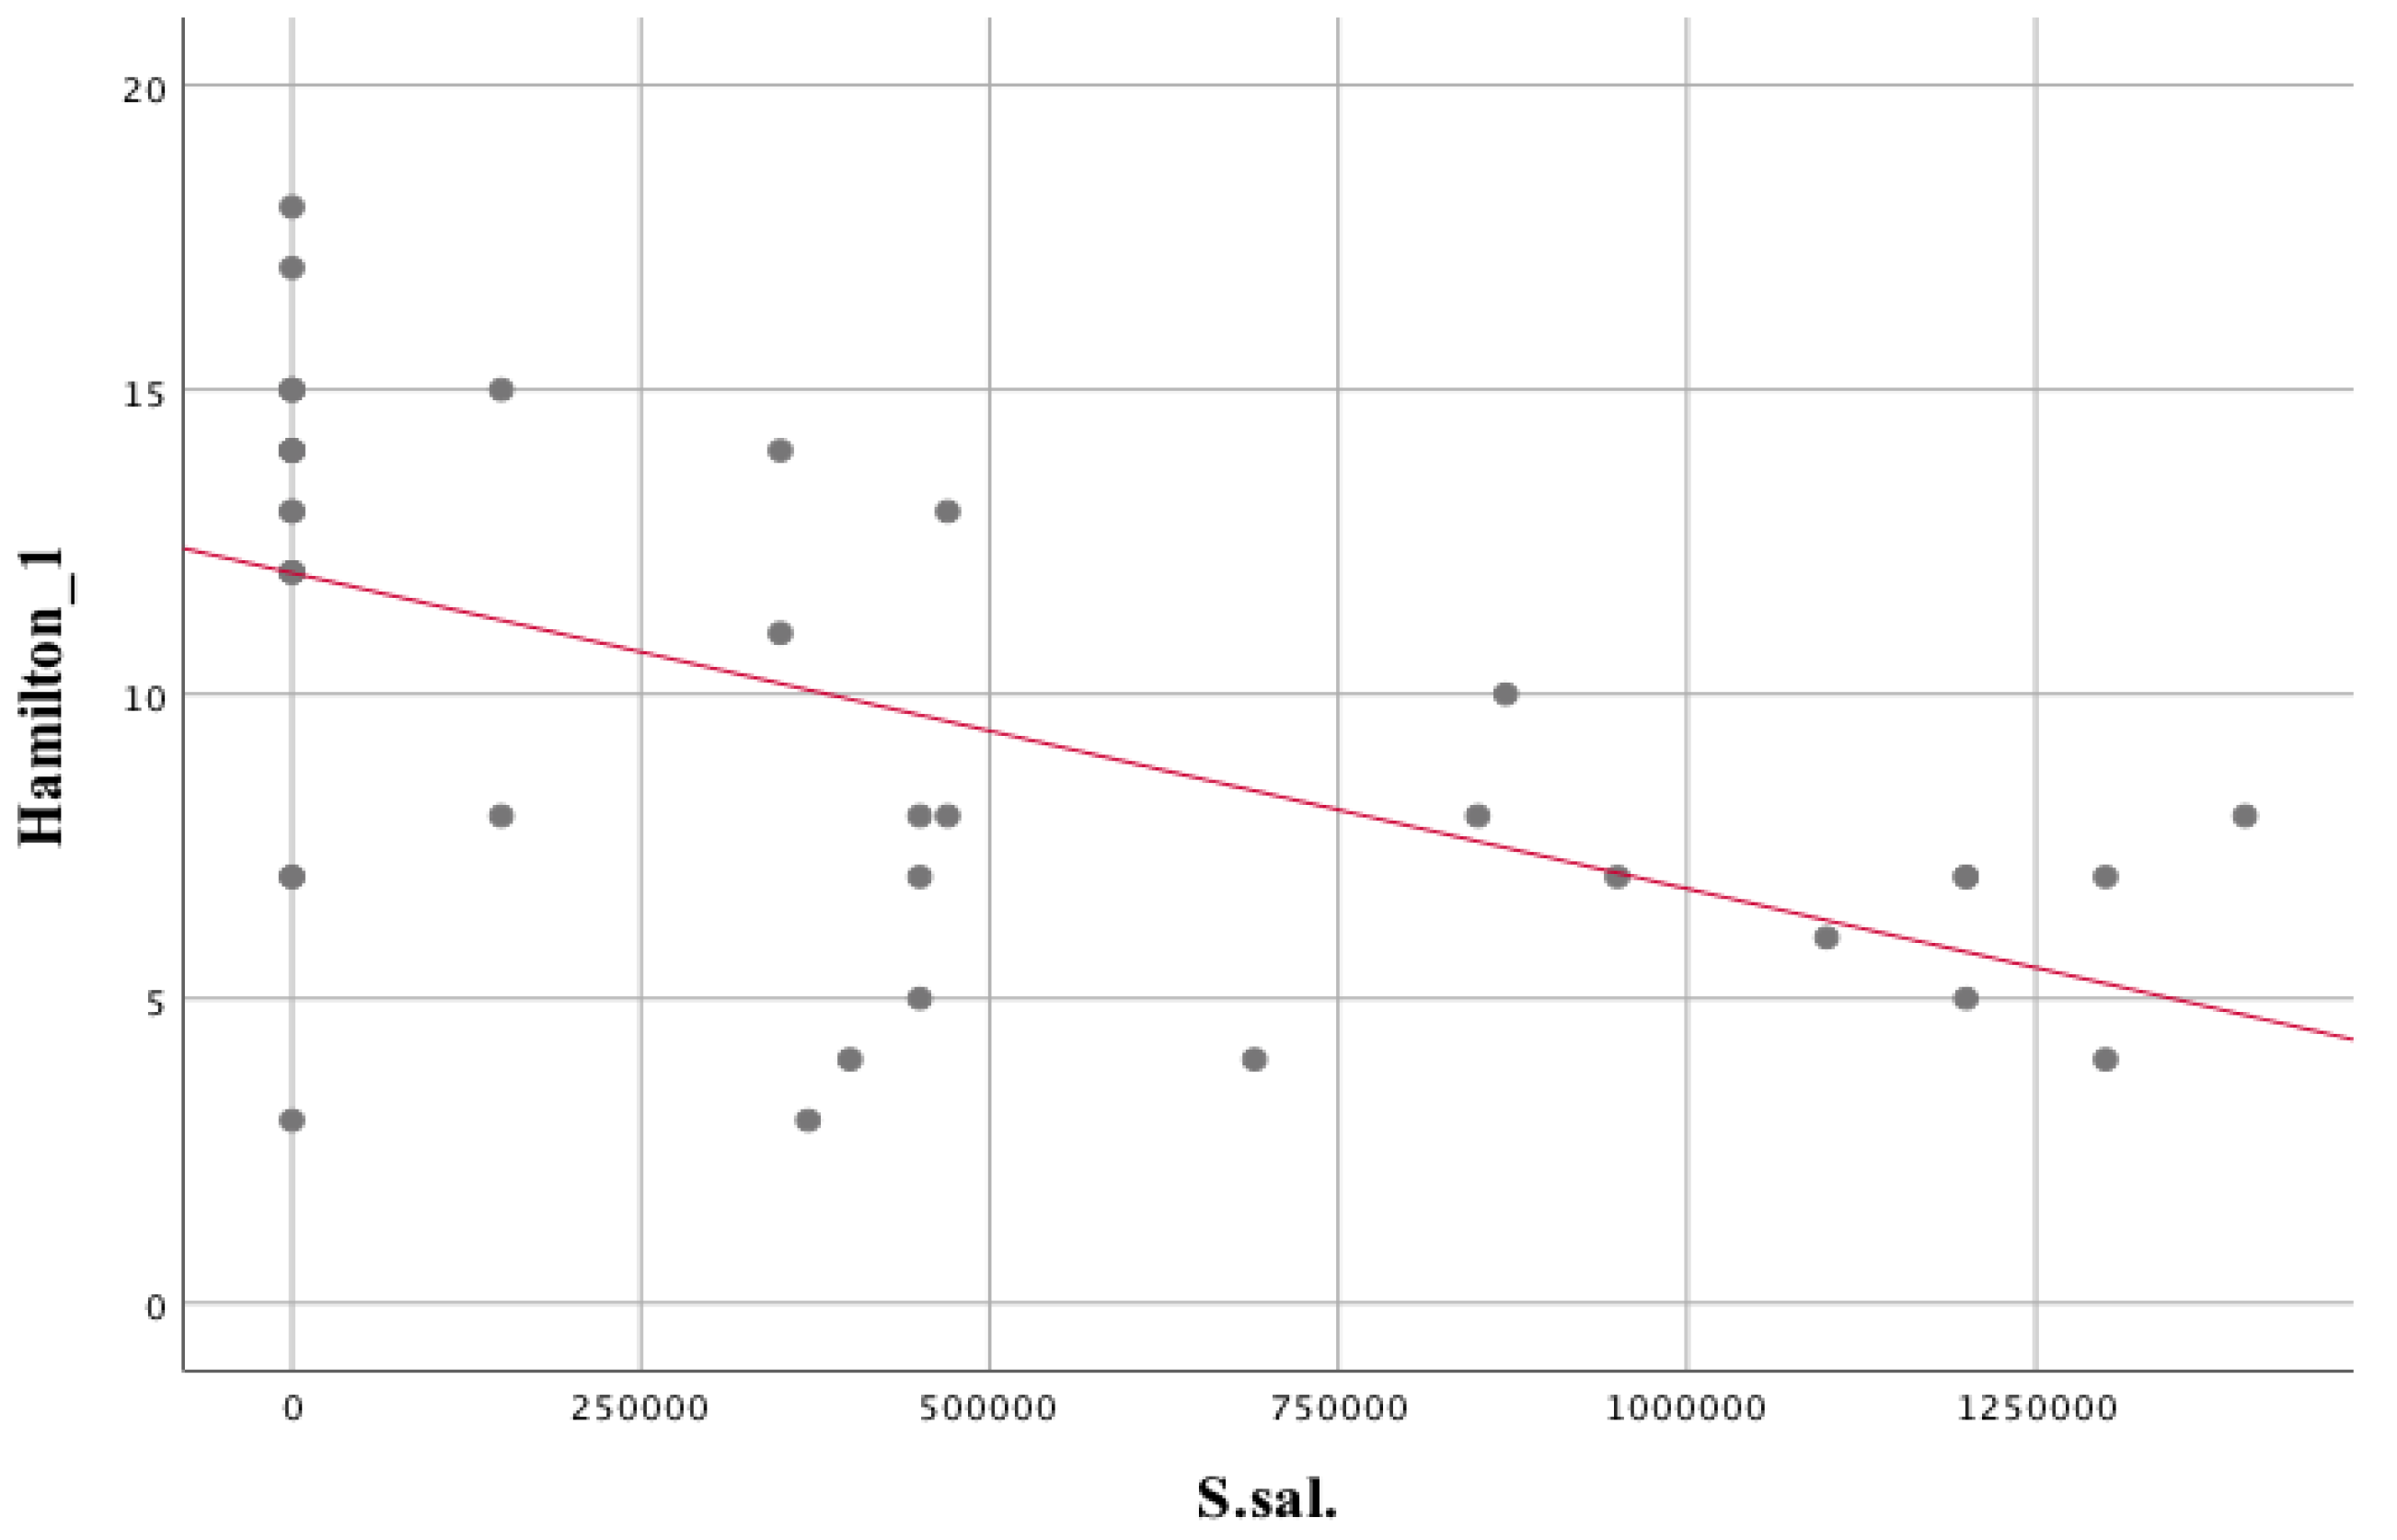
| Hamilton scale | rs = −0.594 | p = 0.000 | |
| exc_1 | rs = −0.399 | p = 0.012 | |
| PASG_B | rs = 0.401 | p = 0.026 | |
| 5-HT [ng/mL] | rs = 0.506 | p = 0.001 | |
| TRP [ug/mL] | rs = 0.353 | p = 0.027 | |
| ALA [mM] | rs = −0.541 | p = 0.000 | |
| Leptotrichia sp. | rs = −0.365 | p = 0.022 | |
| Lactobacillus rhamnosus | rs = 0.389 | p = 0.014 | |
| Rothia mucilaginosa | rs = −0.408 | p = 0.011 | |
| Staphylococcus epidermidis | rs = −0.361 | p = 0.024 | |
| Streptococcus mutans | rs = −0.339 | p = 0.035 | |
| Streptococcus oralis | rs = −0.371 | p = 0.020 | |
| Streptococcus parasanguinis | rs = 0.456 | p = 0.004 | |
| Streptococcus sp. | rs = 0.321 | p = 0.046 | |
| Streptococcus parasanguinis | |||
| Hamilton scale | rs = −0.746 | p = 0.000 | |
| 5-HT [ng/mL] | rs = 0.450 | p = 0.003 | |
| TRP [ug/mL] | rs = 0.404 | p = 0.011 | |
| LAC [mM] | rs = −0.334 | p = 0.038 | |
| ALA [mM] | rs = −0.610 | p = 0.000 | |
| Bacillus circulans | rs = 0.432 | p = 0.006 | |
| Leptotrichia sp. | rs = −0.353 | p = 0.027 | |
| Lactobacillus rhamnosus | rs = 0.404 | p = 0.011 | |
| Lactobacillus acidophilus | rs = 0.506 | p = 0.001 | |
| Staphylococcus epidermidis | rs = −0.403 | p = 0.011 | |
| Streptococcus salivarius | rs = 0.456 | p = 0.004 | |
| Streptococcus mitis | |||
| CTQ_SA | rs = −0.347 | p = 0.031 | |
| PAST_B | rs = −0.390 | p = 0.030 | |
| GLUT [µg/mL] | rs = 0.320 | p = 0.047 | |
| Streptococcus mutans | rs = 0.352 | p = 0.028 | |
| Streptococcus sanguinis | rs = 0.465 | p = 0.003 | |
| Rothia mucilaginosa | |||
| Hamilton scale | rs = 0.446 | p = 0.005 | |
| PAS_A | rs = −0.362 | p = 0.049 | |
| GLUT [µg/mL] | rs = 0.337 | p = 0.038 | |
| ALA [mM] | rs = 0.452 | p = 0.004 | |
| Actinomyces graevenitzii | rs = 0.419 | p = 0.009 | |
| Actinomyces naeslundi | rs = 0.489 | p = 0.002 | |
| Gemella sp. | rs = 0.418 | p = 0.009 | |
| Leptotrichia sp. | rs = 0.554 | p = 0.000 | |
| Neisseria macacae | rs = 0.486 | p = 0.002 | |
| Rothia dentocariosa | rs = 0.341 | p = 0.036 | |
| Scardovia wiggsiae | rs = 0.502 | p = 0.001 | |
| Staphylococcus epidermidis | rs = 0.608 | p = 0.000 | |
| Streptococcus mutans | rs = 0.343 | p = 0.035 | |
| Variable | M | Sd | Min | Max | Q1 | Me | Q3 | |
|---|---|---|---|---|---|---|---|---|
| S.sal. | No depression | 688,750 | 466,060 | 0 | 1,300,000 | 377,500 | 570,000 | 1,175,000 |
| Mild depression | 567,058 | 513,344 | 0 | 1,400,000 | 0 | 450,000 | 1,075,000 | |
| Moderate depression | 69,286 | 151,579 | 0 | 470,000 | 0 | 0 | 37,500 | |
| S.par. | No depression | 127,500 | 55,485 | 30,000 | 180,000 | 72,500 | 150,000 | 160,000 |
| Mild depression | 28,823 | 52,715 | 0 | 170,000 | 0 | 0 | 30,000 | |
| Moderate depression | 0 | 0 | 0 | 0 | 0 | 0 | 0 | |
| S.e. | No depression | 0 | 0 | 0 | 0 | 0 | 0 | 0 |
| Mild depression | 219,412 | 426,856 | 0 | 1,200,000 | 0 | 0 | 270,000 | |
| Moderate depression | 634,286 | 592,618 | 0 | 1,800,000 | 0 | 775,000 | 1,125,000 | |
Disclaimer/Publisher’s Note: The statements, opinions and data contained in all publications are solely those of the individual author(s) and contributor(s) and not of MDPI and/or the editor(s). MDPI and/or the editor(s) disclaim responsibility for any injury to people or property resulting from any ideas, methods, instructions or products referred to in the content. |
© 2023 by the authors. Licensee MDPI, Basel, Switzerland. This article is an open access article distributed under the terms and conditions of the Creative Commons Attribution (CC BY) license (https://creativecommons.org/licenses/by/4.0/).
Share and Cite
Krzyściak, W.; Karcz, P.; Bystrowska, B.; Szwajca, M.; Bryll, A.; Śmierciak, N.; Ligęzka, A.; Turek, A.; Kozicz, T.; Skalniak, A.E.; et al. The Association of the Oral Microbiota with the Effects of Acid Stress Induced by an Increase of Brain Lactate in Schizophrenia Patients. Biomedicines 2023, 11, 240. https://doi.org/10.3390/biomedicines11020240
Krzyściak W, Karcz P, Bystrowska B, Szwajca M, Bryll A, Śmierciak N, Ligęzka A, Turek A, Kozicz T, Skalniak AE, et al. The Association of the Oral Microbiota with the Effects of Acid Stress Induced by an Increase of Brain Lactate in Schizophrenia Patients. Biomedicines. 2023; 11(2):240. https://doi.org/10.3390/biomedicines11020240
Chicago/Turabian StyleKrzyściak, Wirginia, Paulina Karcz, Beata Bystrowska, Marta Szwajca, Amira Bryll, Natalia Śmierciak, Anna Ligęzka, Aleksander Turek, Tamas Kozicz, Anna E. Skalniak, and et al. 2023. "The Association of the Oral Microbiota with the Effects of Acid Stress Induced by an Increase of Brain Lactate in Schizophrenia Patients" Biomedicines 11, no. 2: 240. https://doi.org/10.3390/biomedicines11020240