In this section, the dataset is briefly described, followed by the description of different methods used to precisely regress the output.
2.1. Dataset Description
The research is based on a publicly available dataset entitled “COVID-19 Drug Discovery Data”, provided by the Indian Government. The dataset was released in 2020, for the purpose of analysis of drugs that were considered as possible treatments for alleviating symptoms of COVID-19, based on the medicines that were being provided to the patients at the time as well as the medicines discussed as possible treatments at a governing level [
15]. The dataset was provided as a list of the compounds, with their SMILE notation, and was further expanded with molecular properties based on the PubChem library of chemical compounds [
16]. The dataset is publicly available from [
17], while the additional chemical details of the compound can be looked up in the aforementioned PubChem database. Observing the chemicals, it can be noticed that all of the compounds describe organic molecules of a relatively large size. The dataset in question consists of a SMILE notation of the compound, chemical descriptors/properties of the molecule (to be referred to as molecular properties-MP, in the rest of the paper), and the
value of the individual molecule. The goal of the dataset is to provide data for the development of the models which approximate the
of the compound based on the existing data. A total of 104 compounds that have been used to treat COVID-19 patients are contained in the dataset.
Simple data preparation is performed before the data is used in further research, for machine-learning model training. Some of the data points do not have a numerical value for
, instead replacing it with the term “BLINDED”. Due to these data points not being usable, they are removed from the dataset, yielding a dataset with 94 data points. Some of the data points are missing certain molecular properties within the data. To avoid losing additional data points in an already relatively small dataset, a sentinel value of
is used to fill the empty cells [
18]. As no original data has the value of −1, meaning that the sentinel value directly indicates the non-existent data in the data vector. In addition to row removal, some of the columns are removed, such as compound identifying information (name or PubChem compound ID), or other non-numerical data such as alternative molecule descriptors that cannot be generally processed within the dataset. The descriptive statistics of the values that have been kept within the dataset are given in
Table A1, within
Appendix A.1. As the table shows, after the described dataset preparation process the following molecular descriptors are kept within the dataset, in addition to the SMILES molecule description and
value of the compound: molecular weight, XLogP [
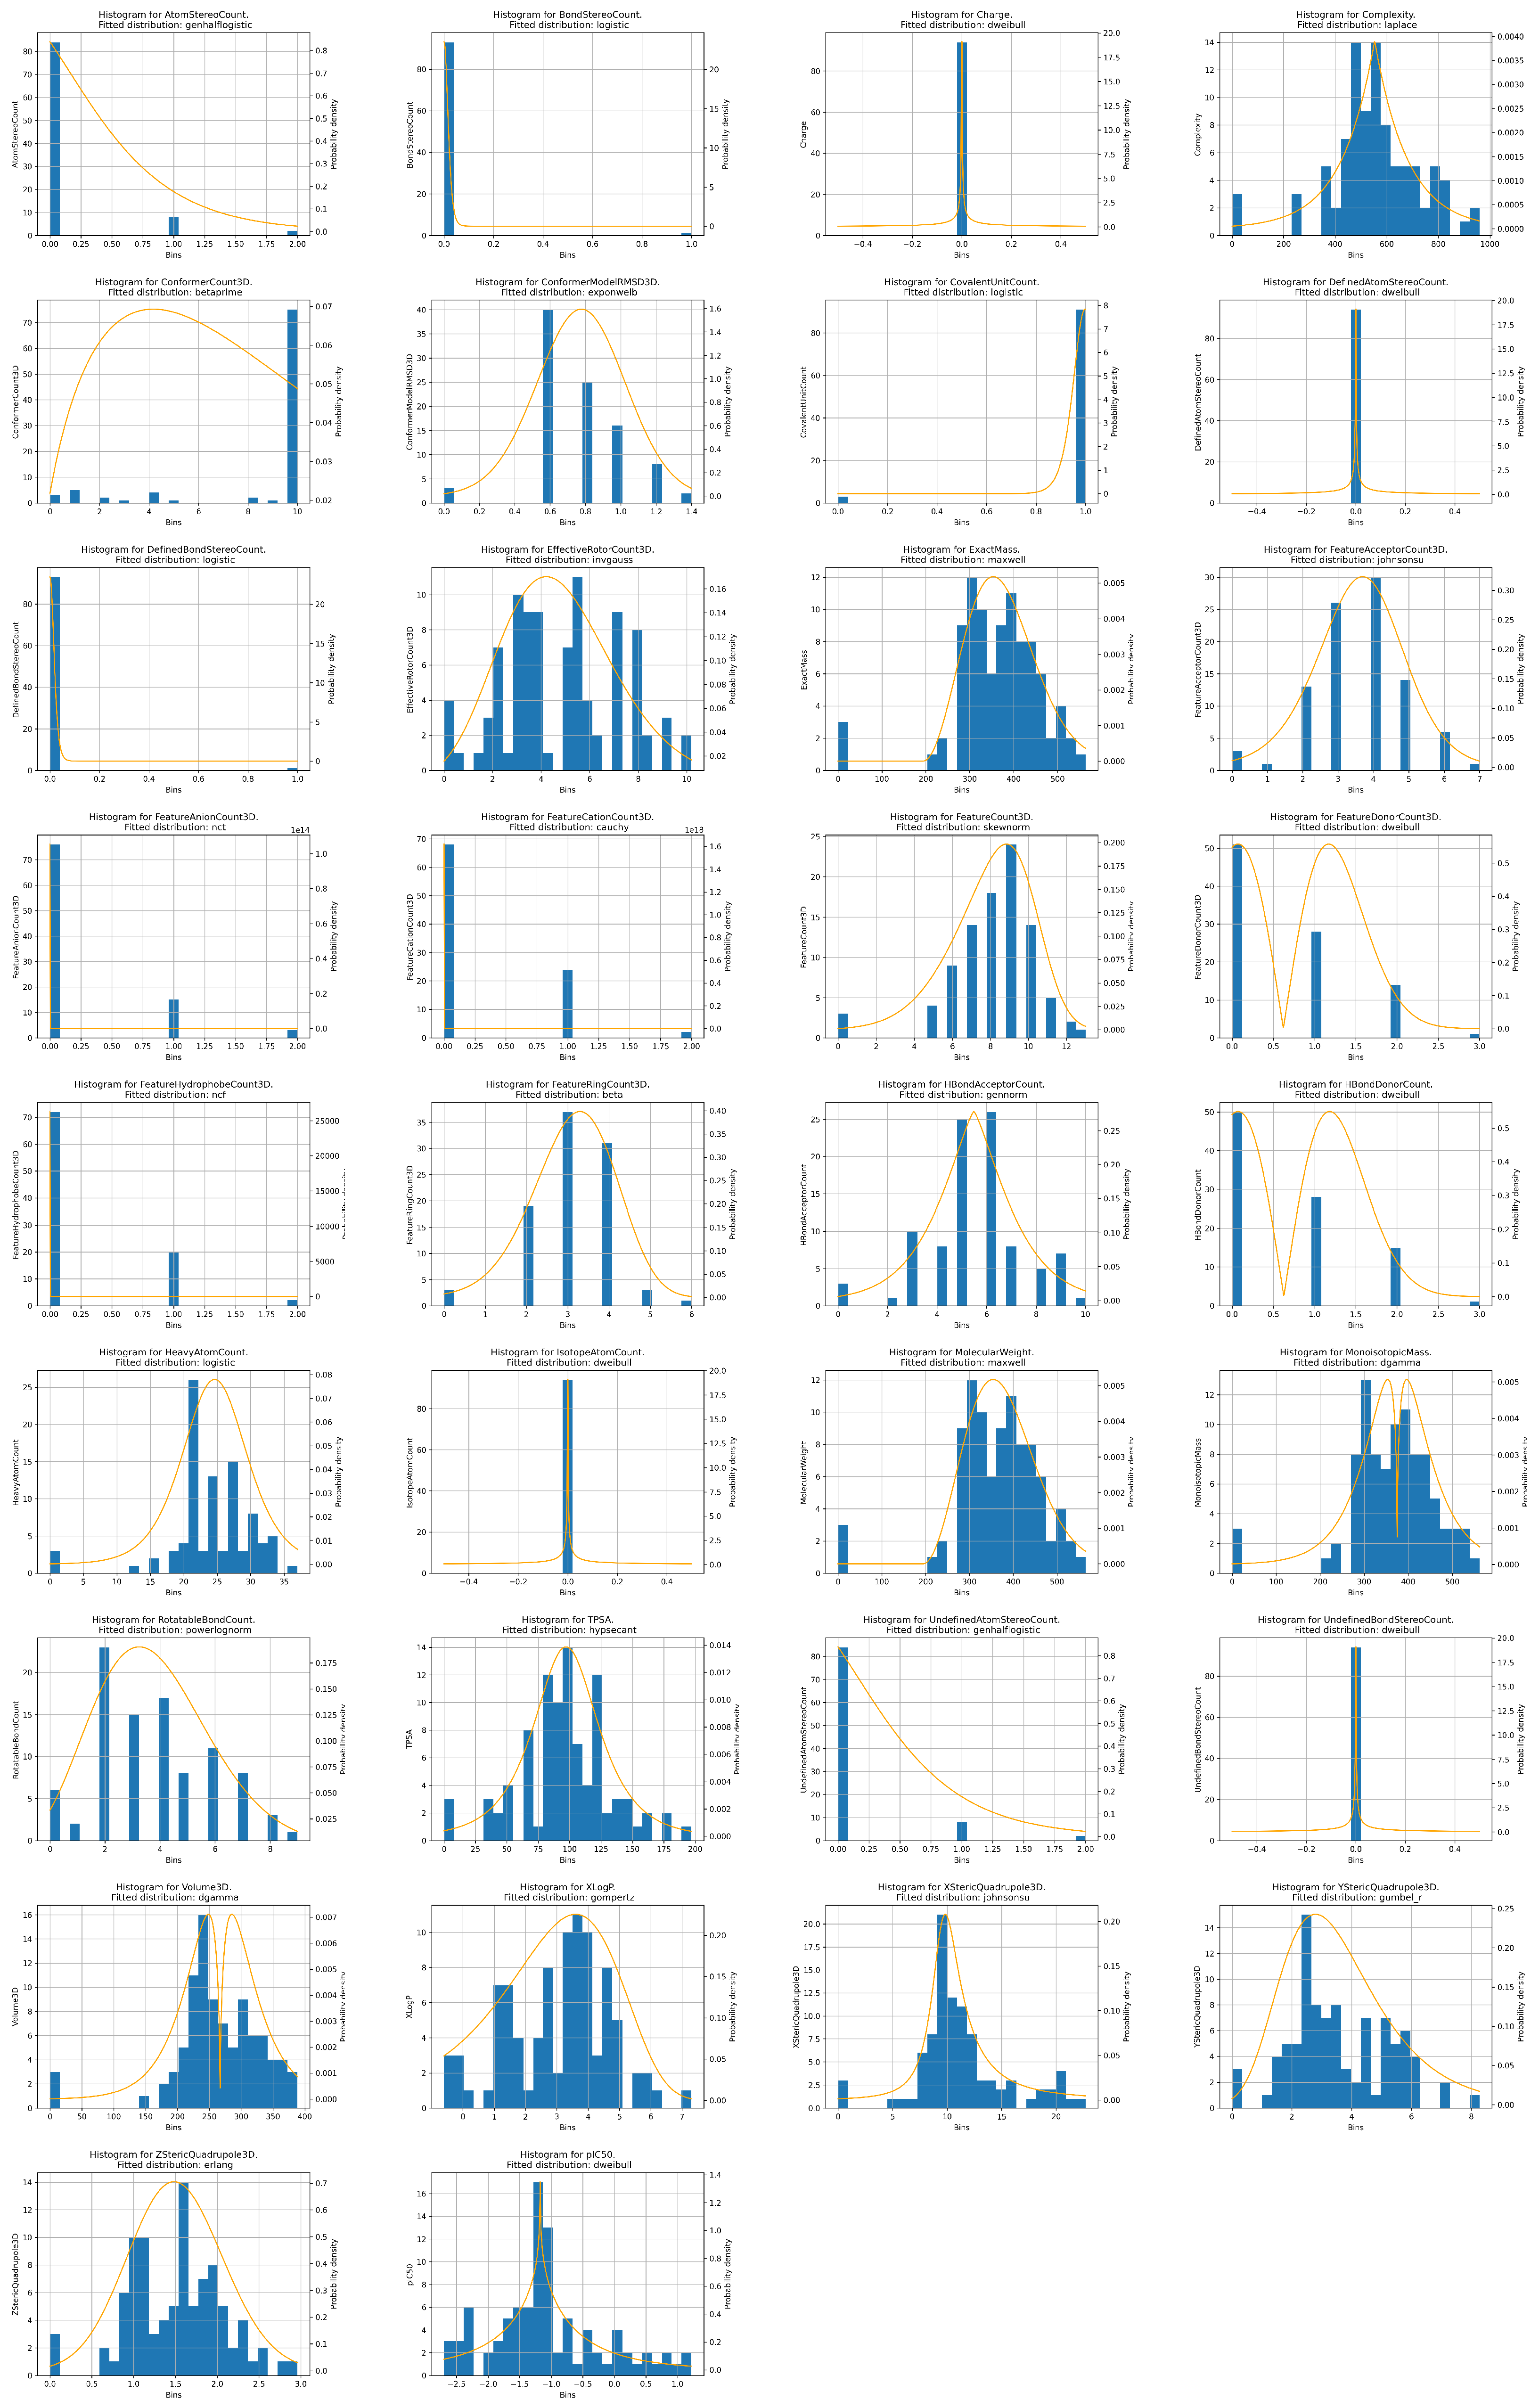
19], exact mass, monoisotopic mass, topological polar surface area, complexity, charge, H-bond donor count, H-bond acceptor count, rotatable bond count, heavy atom count, isotope atom count, atom stereo count, defined atom stereo count, undefined atom stereo count, bond stereo count, defined bond stereo count, undefined bond stereo count, covalent unit count, 3D volume, 3D X-steric quadrupole value, 3D Y-steric quadrupole value, 3D Z-steric quadrupole value, 3D feature count, 3D feature acceptor count, 3D feature donor count, 3D feature anion count, 3D feature cation count, 3D feature ring count, 3D feature hydrophobe count, 3D conformer model RMSD, 3D effective rotor count, and 3D conformer count. The distributions of all the used numerical data points are given in
Figure A1, within
Appendix A.2, with the best fitting distribution to each given in the subfigure. What can be noted is that none of the data vectors follow the normal or uniform distribution. This fact, in addition to the relatively low number of data points, points to the fact that additional validation, such as k-fold cross-validation, will be necessary to properly validate the obtained data-driven models [
20]. In addition to that need, the descriptive statistics show that certain inputs are constant (isotope atom count, charge, undefined bond stereo count, defined atom stereo count). Due to the inputs being constant through the entire dataset, they should have no influence on the output [
21]. Observing the median and standard deviation values of the variables, it can be seen that other variables have a large value spread, which is confirmed by the data distribution histograms. Observing the correlation of the individual properties to the
output, it can be noted that all of the correlation values of the inputs are relatively low, with none having an absolute value of the correlation higher than 0.5. Covariance is also generally low, except for certain variables such as complexity (−44.903), and exact and monoisotopic masses (−16.863 and −16.883, respectively).
In addition to the above-discussed variables, a SMILES notation [
22] of each compound is provided. This allows the research to utilize the molecular makeup of the compound itself as one of the inputs in the modeling. However, to achieve this, the SMILES notation needs to be transformed in a manner that allows its use as an input for an ANN. To achieve this, a system is developed which will allow for the transformation of the SMILES string into a one-hot encoded matrix [
23]. One-hot encoded matrices are given a commonly used way of transforming a string of symbols into a matrix format [
24].
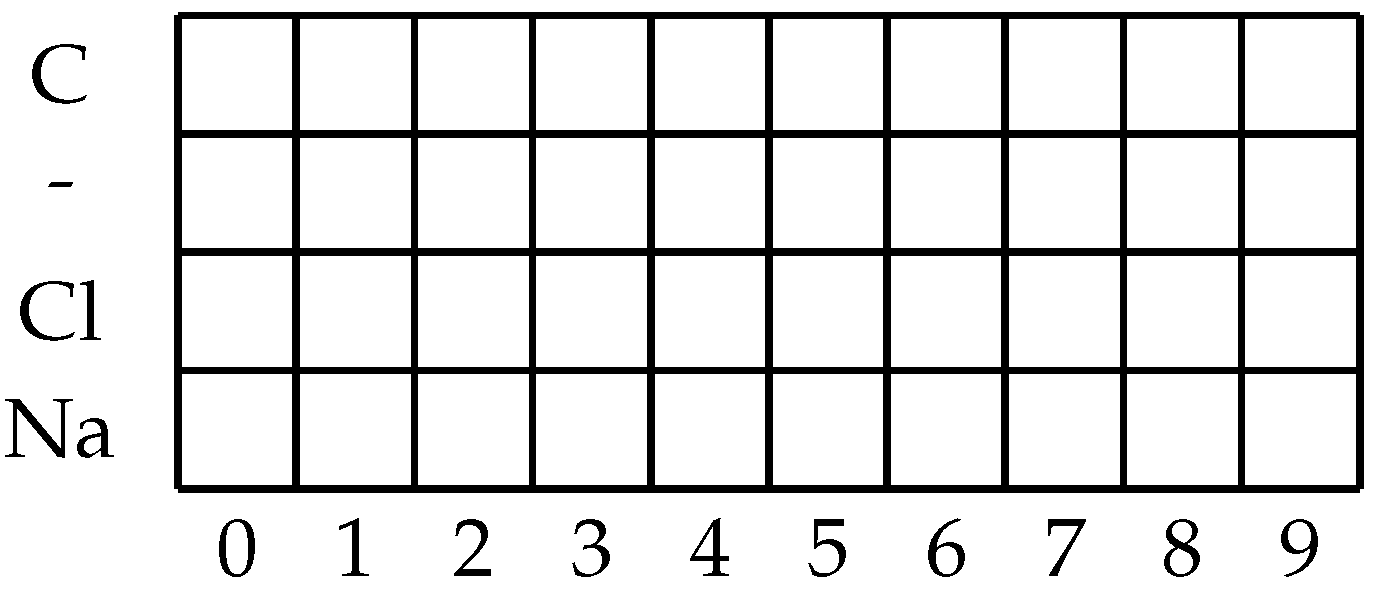
To transform the SMILES string into the desired format, the algorithm will go through the entire dataset and split SMILES strings into individual symbols. While doing this, each unique symbol will be noted and stored in the memory. This first iteration will serve to determine which SMILES symbols exist in the dataset. An additional element that will be noted is the maximum symbol length of the SMILES notation string (which is not necessarily equal to the number of characters, due to elements such as “Br” representing a single symbol consisting of two characters [
25]). The number of unique symbols and the maximal SMILES length will allow us to determine the size of the one-hot matrix to be used. The matrix will have the number of rows equal to the number of unique symbols and the number of columns equal to the maximum SMILES length. An example of such a matrix is given in
Figure 1. In the illustrated example, the dataset would consist of molecules that consist of the following symbols “C”, “-”, “Cl”, and “Na”, with the maximum SMILES symbol length of 10. When applied to a realistic set of molecules, such as the dataset that is being observed in the presented research, the individual matrix will be larger. When the first step of the conversion has been performed a total of 21 unique symbols are found in the dataset (in order of appearance: “Cl”, “C”,“1”, “=”, “(”, “N”, “O”, “)”, “S”, “2”, “F”, “#”, “3”, “[”, “+”, “]”, “-”,“4”, “Br”, “I”, “\\”), with the maximal SMILES symbol length of 78. This approach of adjusting the input matrix size has the benefit of avoiding unnecessary padding by making the matrix size large enough to fit all the possible SMILES symbols. In addition to the previous concern, using a fixed-size matrix introduces the issue of needing to determine the maximum possible size of the molecule. As the generation of SMILES one-hot encoded matrices are relatively fast [
26] and a changed matrix size only requires a minor adjustment to the input layer of the neural network, the authors suggest that generating new one-hot encoded SMILES matrices for new datasets is a more practical approach.
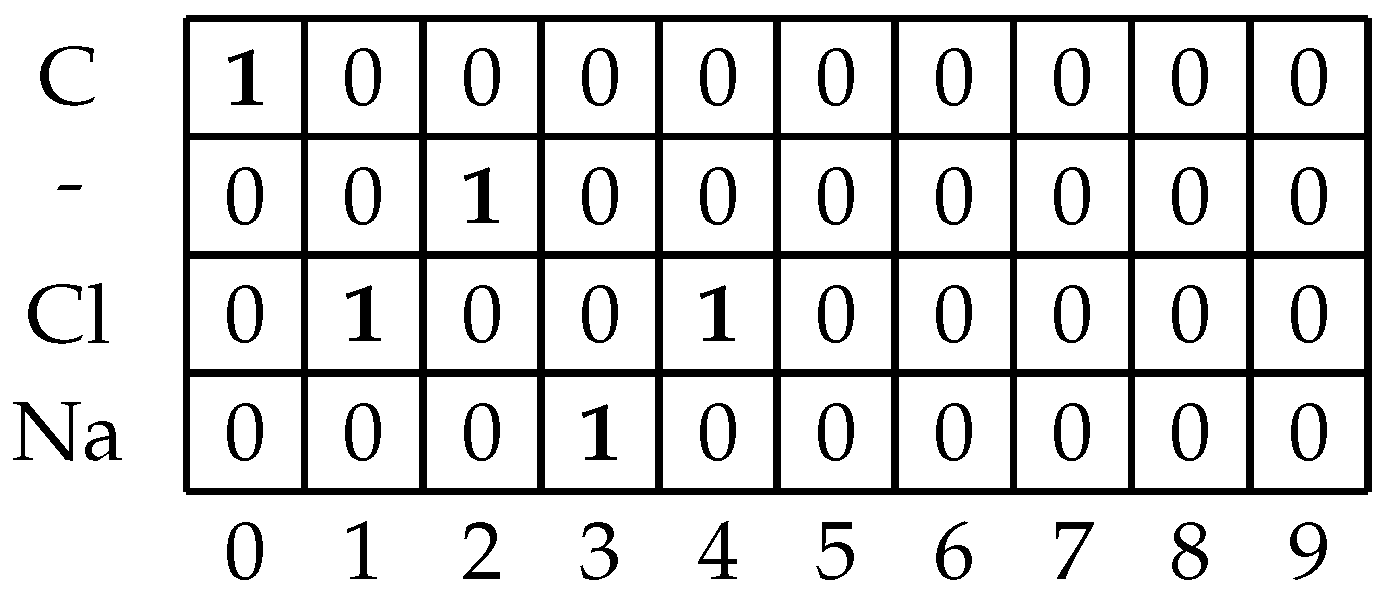
Once the algorithm has passed through the entire dataset and determined all possible unique symbols and maximal symbol length in the dataset, the proto-matrix which was created in the previous step needs to be filled and stored for later use. The developed algorithm will once more iterate over all of the SMILES strings. The algorithm will then iterate over each symbol in the string. It will place a value of 1 in the column that is equal to the position of the symbol in the string, in that row whose value is equal to the symbol. The rest of the rows in the column will be filled with zeroes. This process will repeat for each symbol until there are no more symbols left in the SMILES string. If there are columns left in the matrix they are filled with zeros [
27]. An example of the filled matrix is given in
Figure 2. The reason for this padding is that ANNs which are to be used in the later modeling steps require all of the inputs to have uniform dimensions [
28].
The prepared matrix is then appended with the parameters and the output value in the general shape of
, with the total dataset being given in the tensor of the shape
, where
N is the number of elements [
29]. For our case, the dimension of the whole dataset is as follows:
. The dataset in question is then stored in the appropriate NPY format for further use in the regression modeling process. The full algorithm, as just described, is also provided in pseudocode using the set notation in Algorithm 1.
| Algorithm 1 The algorithm for transformation of SMILES strings into SMILES matrices |
| Require: |
▹ SMILES dataset |
| | ▹ Unique symbols |
| | ▹ Maximal symbol length |
| | ▹ Empty symbol |
| for each do | |
| for each do | |
| if then | |
| | |
| end if | |
| if then | |
| | |
| end if | |
| end for | |
| end for | |
| | ▹ One-hot matrix to be filled |
| | ▹ Transformed dataset |
| | ▹ MP values from dataset |
| | ▹ Output value |
| for each do | |
| | ▹ For tracking vector columns |
| for each do | |
| | |
| | |
| if then | |
| | |
| | |
| | |
| else | |
| for each do | |
| | |
| end for | |
| end if | |
| | |
| | |
| end for | |
| end for | |
2.2. Neural Network Regression
There are three approaches tested with neural networks, depending on the data that is used in each separate case. Each of the three neural network architectures used corresponds to one of the three data configurations. The architectures used are:
Only SMILES encoded as a one-hot matrix;
Only molecule parameters;
The combination of both SMILES encoded as a one-hot matrix and molecule parameters.
The individual architectures will be discussed in further subsections. All of the architectures are custom to the problem at hand due to the input matrix size. For each architecture, three different hyperparameters are adjusted—the number of epochs the model is trained for [
30], the batch size of the data used for the training [
31], and the solver algorithm used for the model training [
32]. The hyperparameter values are adjusted using the grid search (GS) method, which means that each possible combination of the three hyperparameters is tested. The tested hyperparameter values are given in
Table 1.
The data is split into training and testing sets in an 80:20 ratio. The ratio is selected due to the application of the five-fold cross-validation process, as mentioned in the previous section [
33]. Each of the ANNs is trained in the same manner with the forward and backward propagation process. In this process, each individual data point is brought to the input of the ANN. Then, the matrix containing the input data
I is multiplied with the individual weight matrices [
34], or convoluted with the weight filters in the case of the convolutional neural network (CNN) [
35]. The values in these matrices/filters are initially set to random values. This will lead to a predicted output at the end of the ANN. If we denote this output with
, then the entire vector of all predictions for each of the inputs in the dataset can be expressed with
. The corresponding vector of real values, in this case, the
values of the dataset, can then be expressed as
. This allows us to calculate the vector of errors
according to the root mean square error (RMSE) formula which was used for the model training in this research [
36]:
The mean value of the error represents the general error of the dataset in the given epoch. The loss function is then calculated as the mean of the dataset errors
, where
N is the number of the data points in the training set (75 or 76 depending on the dataset fold used for evaluation), and
is the set of the weights [
37]. This loss is then backpropagated through the dataset where the values of the weights
are then adjusted depending on the value of the loss function, as [
38]:
where
e is the current training epoch, and
is the learning rate, which is set as the default value for each of the used solvers [
39].
The code in this paper is implemented in Python 3.9.12 programming language. The tensor manipulation that was previously described for transforming the dataset with one-hot encoding was performed using the NumPy library version 1.23.0. The ANNs were designed and trained in Tensorflow version 2.9.1. The score evaluation is performed using the Scikit-Learn library, metrics submodule, version 1.1.1.
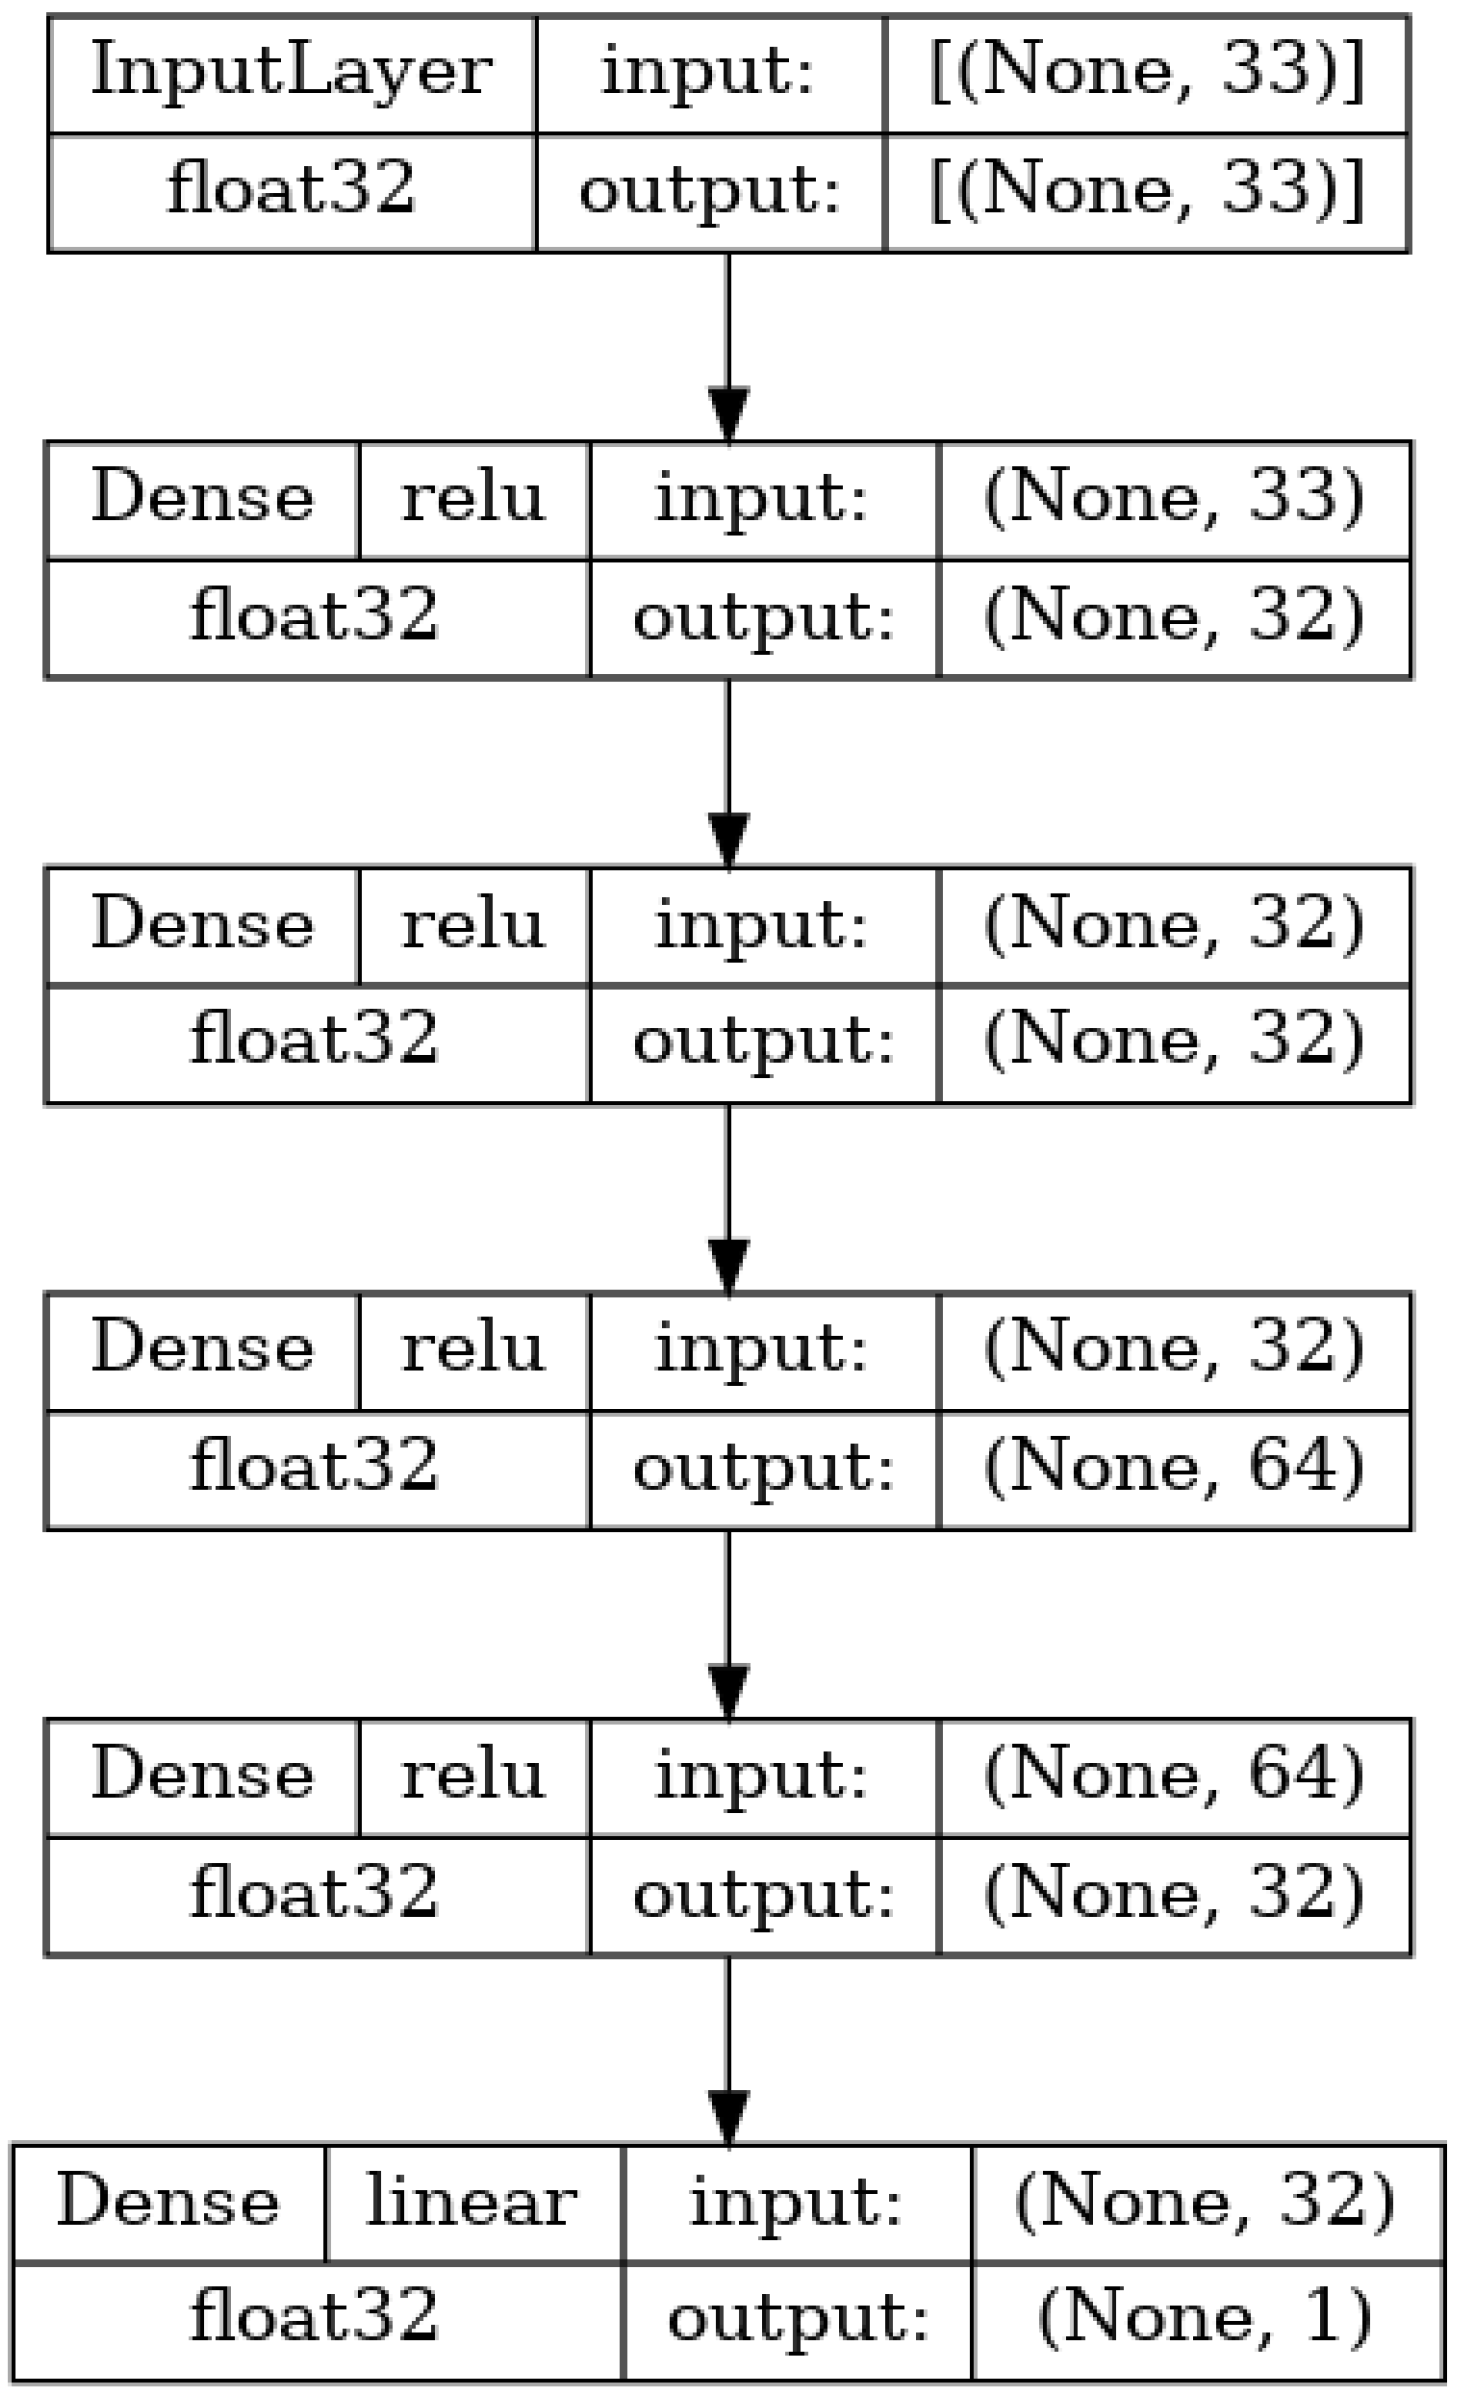
2.2.1. ANN for Regression Based on Molecule Properties
The first ANN used in the research is shown in
Figure 3. It utilizes only the 33 MPs as an input and is constructed as a standard multilayer perceptron (MLP) [
40]. This means that the network consists of the first layer (which has a size equal to the number of inputs-33), one or more hidden layers, and an output layer consisting of a single neuron whose value is equal to the value of the ANN output [
38]. The base architecture (layer configuration) of this and the following networks have been based on the conclusions of existing research in the field [
23,
41,
42,
43,
44,
45]. The used network has a total of four hidden layers consisting of 32 neurons for the first and second hidden layers, 64 neurons total for the third hidden layer, and 32 neurons in the last hidden layer. All of the layers are densely connected, meaning that each neuron in a given layer has a weighted connection to all neurons in the subsequent layer. All of the layers use the rectified linear unit (ReLU) [
46,
47] activation function, given as
.
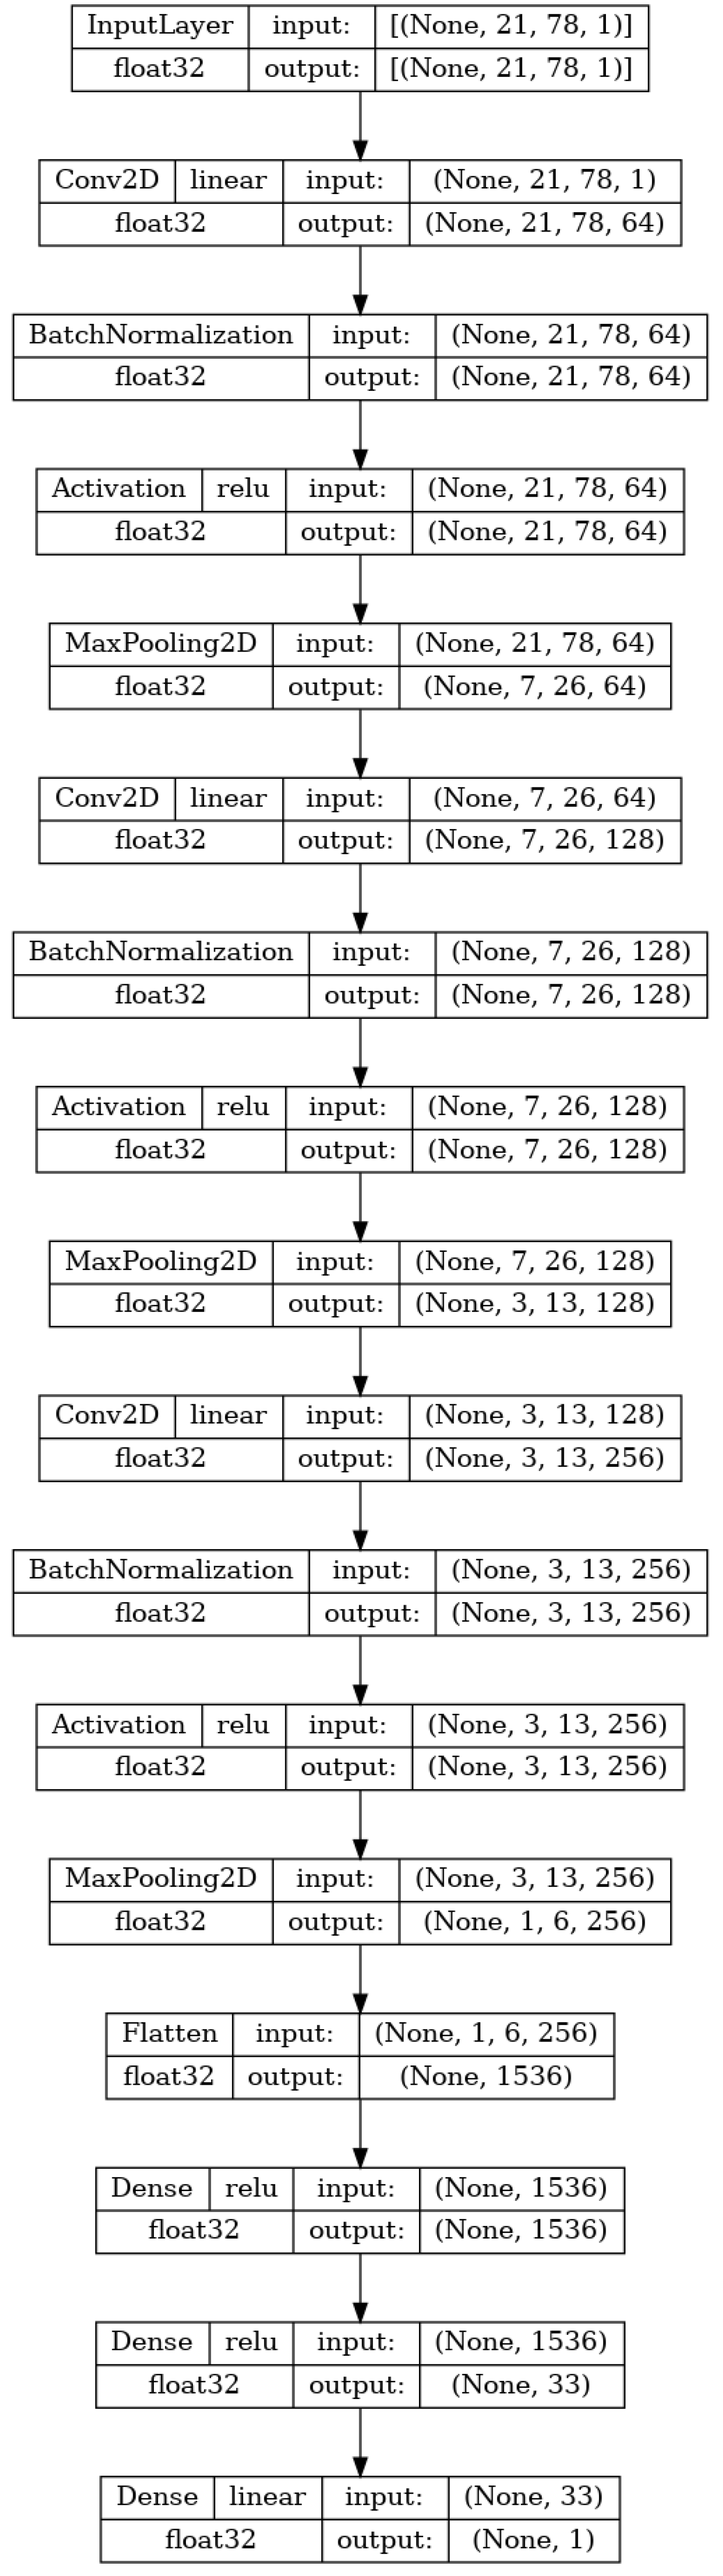
2.2.2. CNN for Regression Based on SMILES
The second type of the neural network applied is a CNN that is meant to create a model that regresses the
model based solely on the SMILES one-hot encoded matrix. The reasoning is that the ANN should be capable of determining the information derived from the SMILES in the shape of MPs themselves. Such an approach would save the time needed to generate and storage space needed to store the extra info for the MP. The CNN was shown to be a high-performing algorithm on tensor-shaped data [
48].
The input to the network is the same as the previously stated image size (
). Then, a series of three stacks of layers is repeated. Each stack consists of a two-dimensional convolutional layer, batch normalization, activation, and a two-dimensional maximum pooling layer. The two-dimensional convolutional layer performs the convolution operation between the input of the layer (for the first layer this is the input matrix) and a filter tensor [
49]. The sizes of the filters in the used CNN are
,
, and
, respectively. The values within the filter tensors are originally set to random values and then adjusted according to the previously described training process [
50]. The second element of each of the three stacks is batch normalization. This layer normalizes its input for each of the training batches. This allows for faster training due to the easier reparametrization of the model [
51]. The next layer in each of the stacks is the activation layer, which applies the activation function ReLU to the entirety of the previous layer output [
52]. Finally, max pooling is applied. This technique takes the value of tensor elements in the
grid and converts them to a single element which is equal to the maximal value of the elements [
53]. This lowers the computational cost of the training and introduces a basic invariance to the internal (detailed) representation of the data in the model [
54]. The sizes of the max pooling filters used in the research are
,
, and
, in order of the application. After the three stacks, the flatten layer is applied, which takes the final tensor (shaped
) and transforms it into a vector [
55]. This vector is then used in the same manner as the input used in the MLP described in the previous section. This layer is then densely connected to a single hidden layer of 33 neurons, which is in turn connected to the layer with a single neuron that will serve as the output of the CNN. The CNN model is fully shown in
Figure 4.
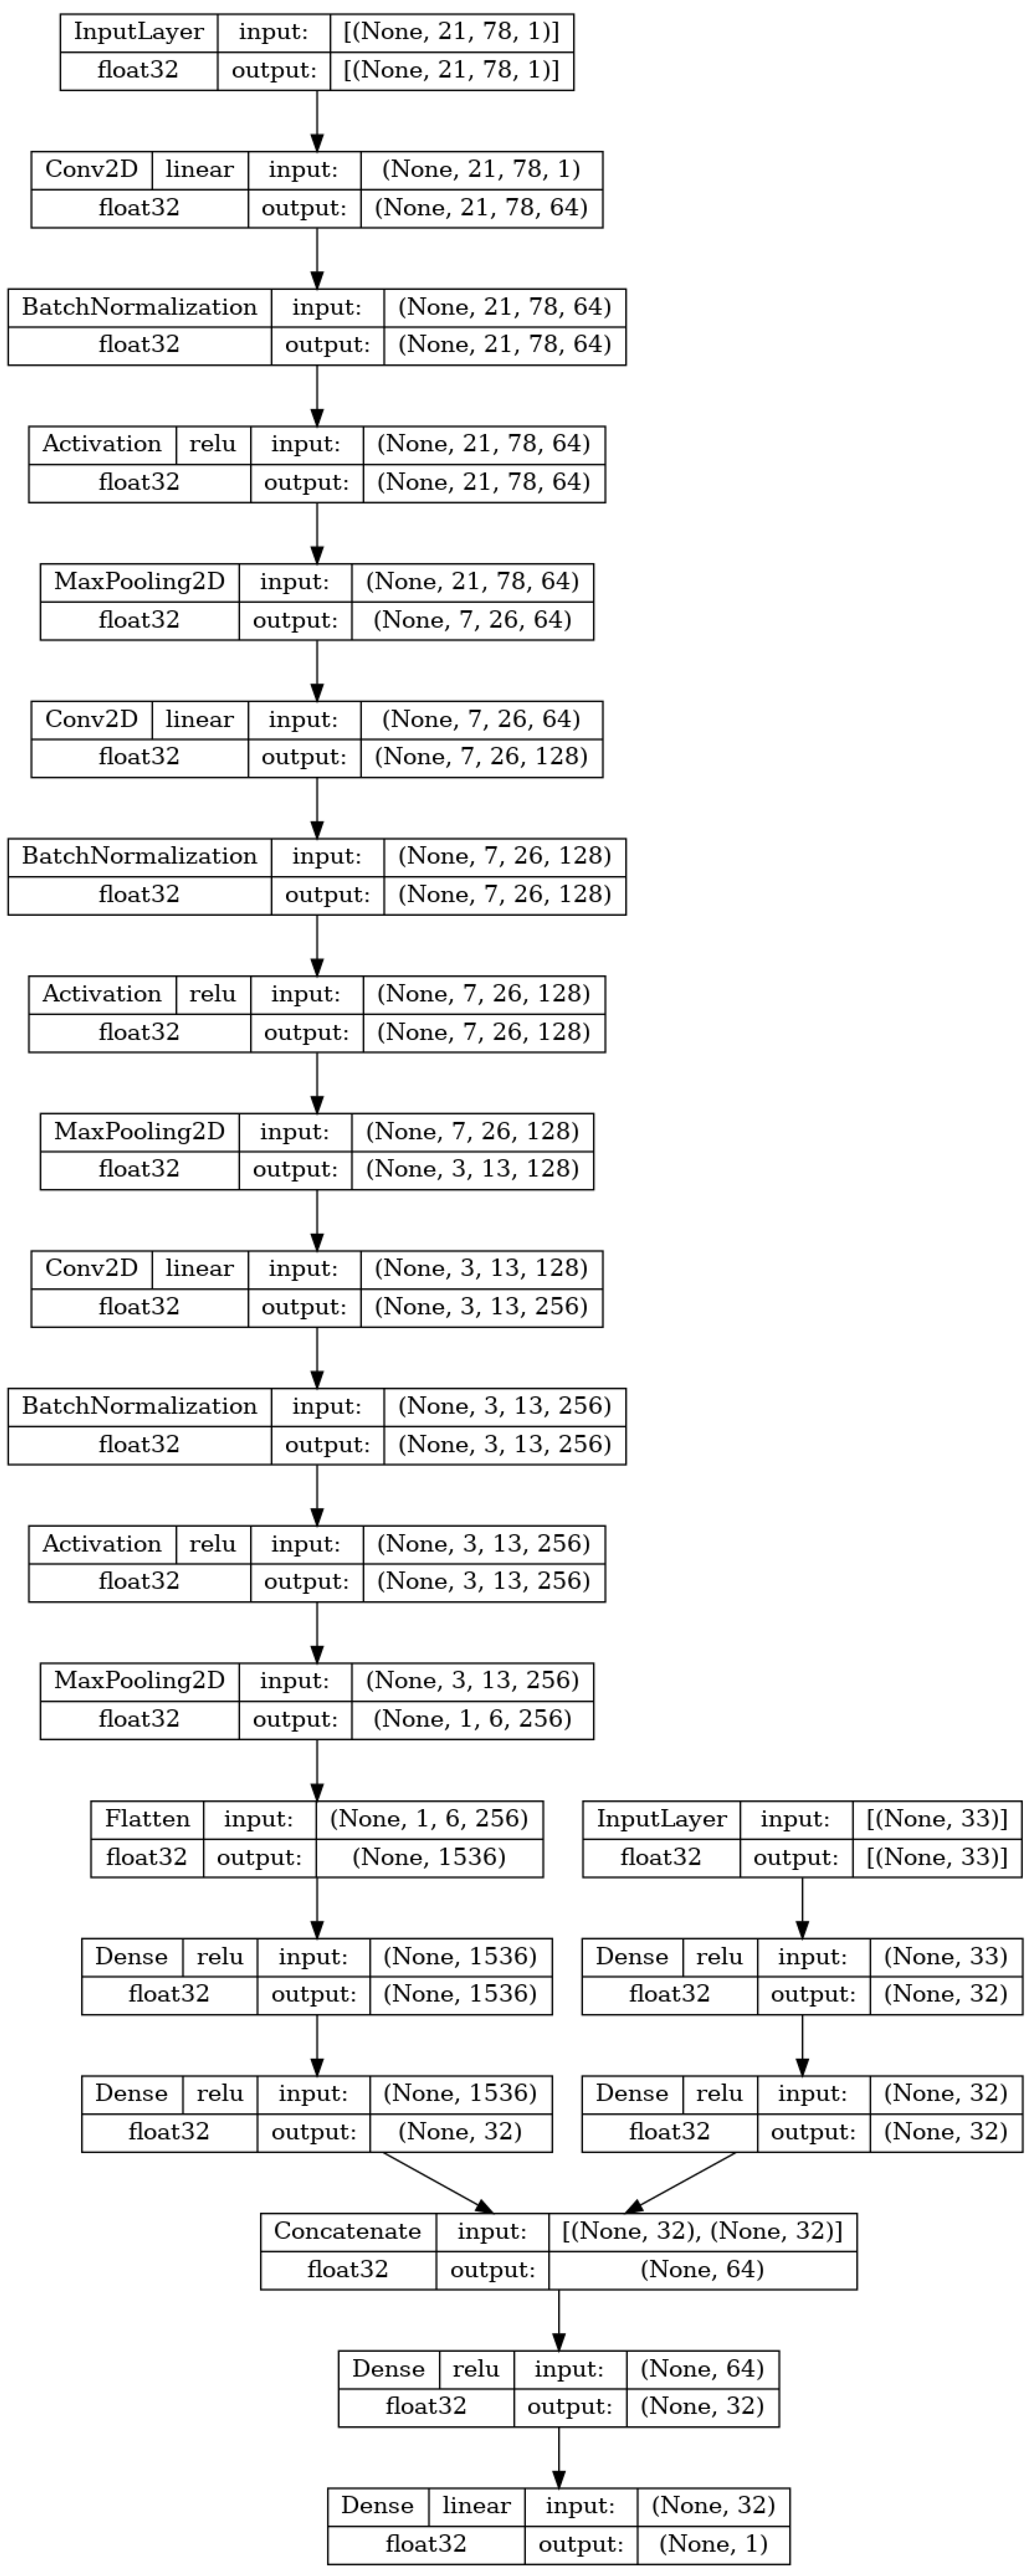
2.2.3. CNN for Regression Based on SMILES and Molecule Properties
The final variant of the ANN the research applies to the data is a hybrid CNN model combining both of the previously described ANNs, the MLP and CNN. This combination will allow for the processing of both the SMILES matrices and numerical MP data. The idea behind this application is to combine both the input types and in doing that provide more information to the learning framework of the ANN, in the hopes of increasing the regression quality.
As shown in
Figure 5, the first part of the network, up to the last three hidden layers are equal to the ones described in the two previous subsections. The last layer of the two architectures does not end in a single neuron but instead ends with a densely connected layer of 32 neurons. Then, a concatenate layer [
56] is utilized to stack both of the 32-element vectors into a single 64-element vector. The combined outputs of two neural networks are then densely connected to a pre-final layer of 32 neurons. This layer is finally densely connected to the final output layer of a single neuron, the value of which will represent the output of the hybrid ANN, as was the case with the two previously described ANNs.
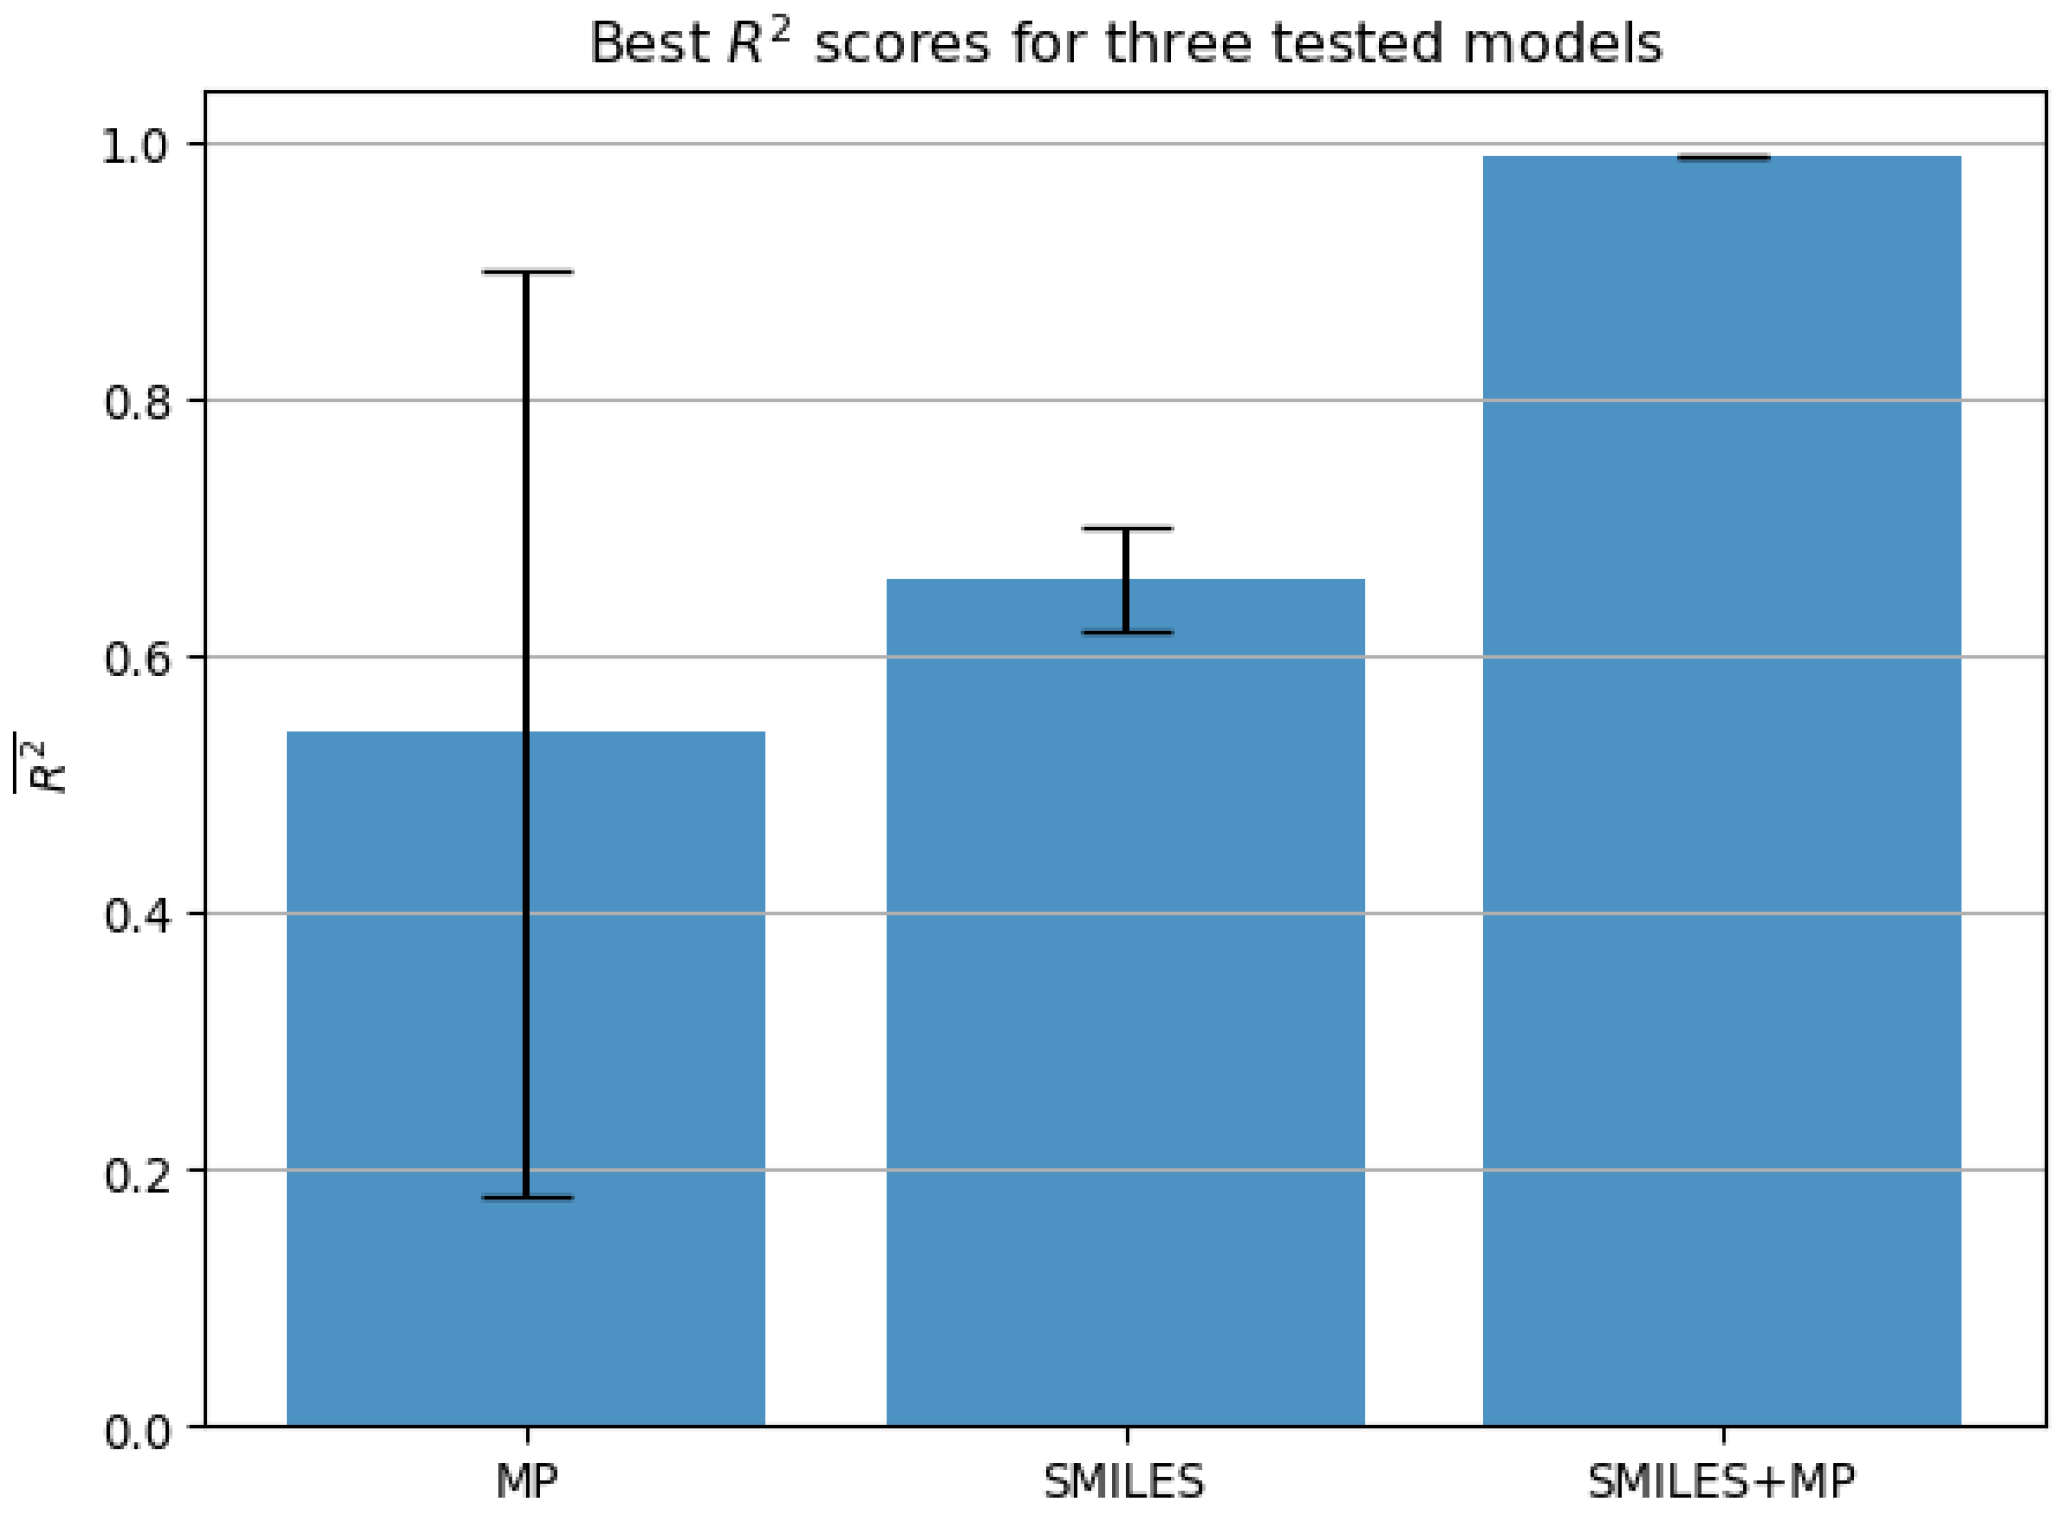
2.3. Result Evaluation
The results are evaluated using two metrics—the coefficient of determination (
) and mean absolute percentage error (
).
is a metric that has a range from
and shows the amount of variance explained between the real output set
and the predicted output set
, where
n is the number of the elements in the output vectors [
57]. The higher the
values are, the more of the variance is explained, meaning a higher quality regression model [
58].
is calculated according to [
59]:
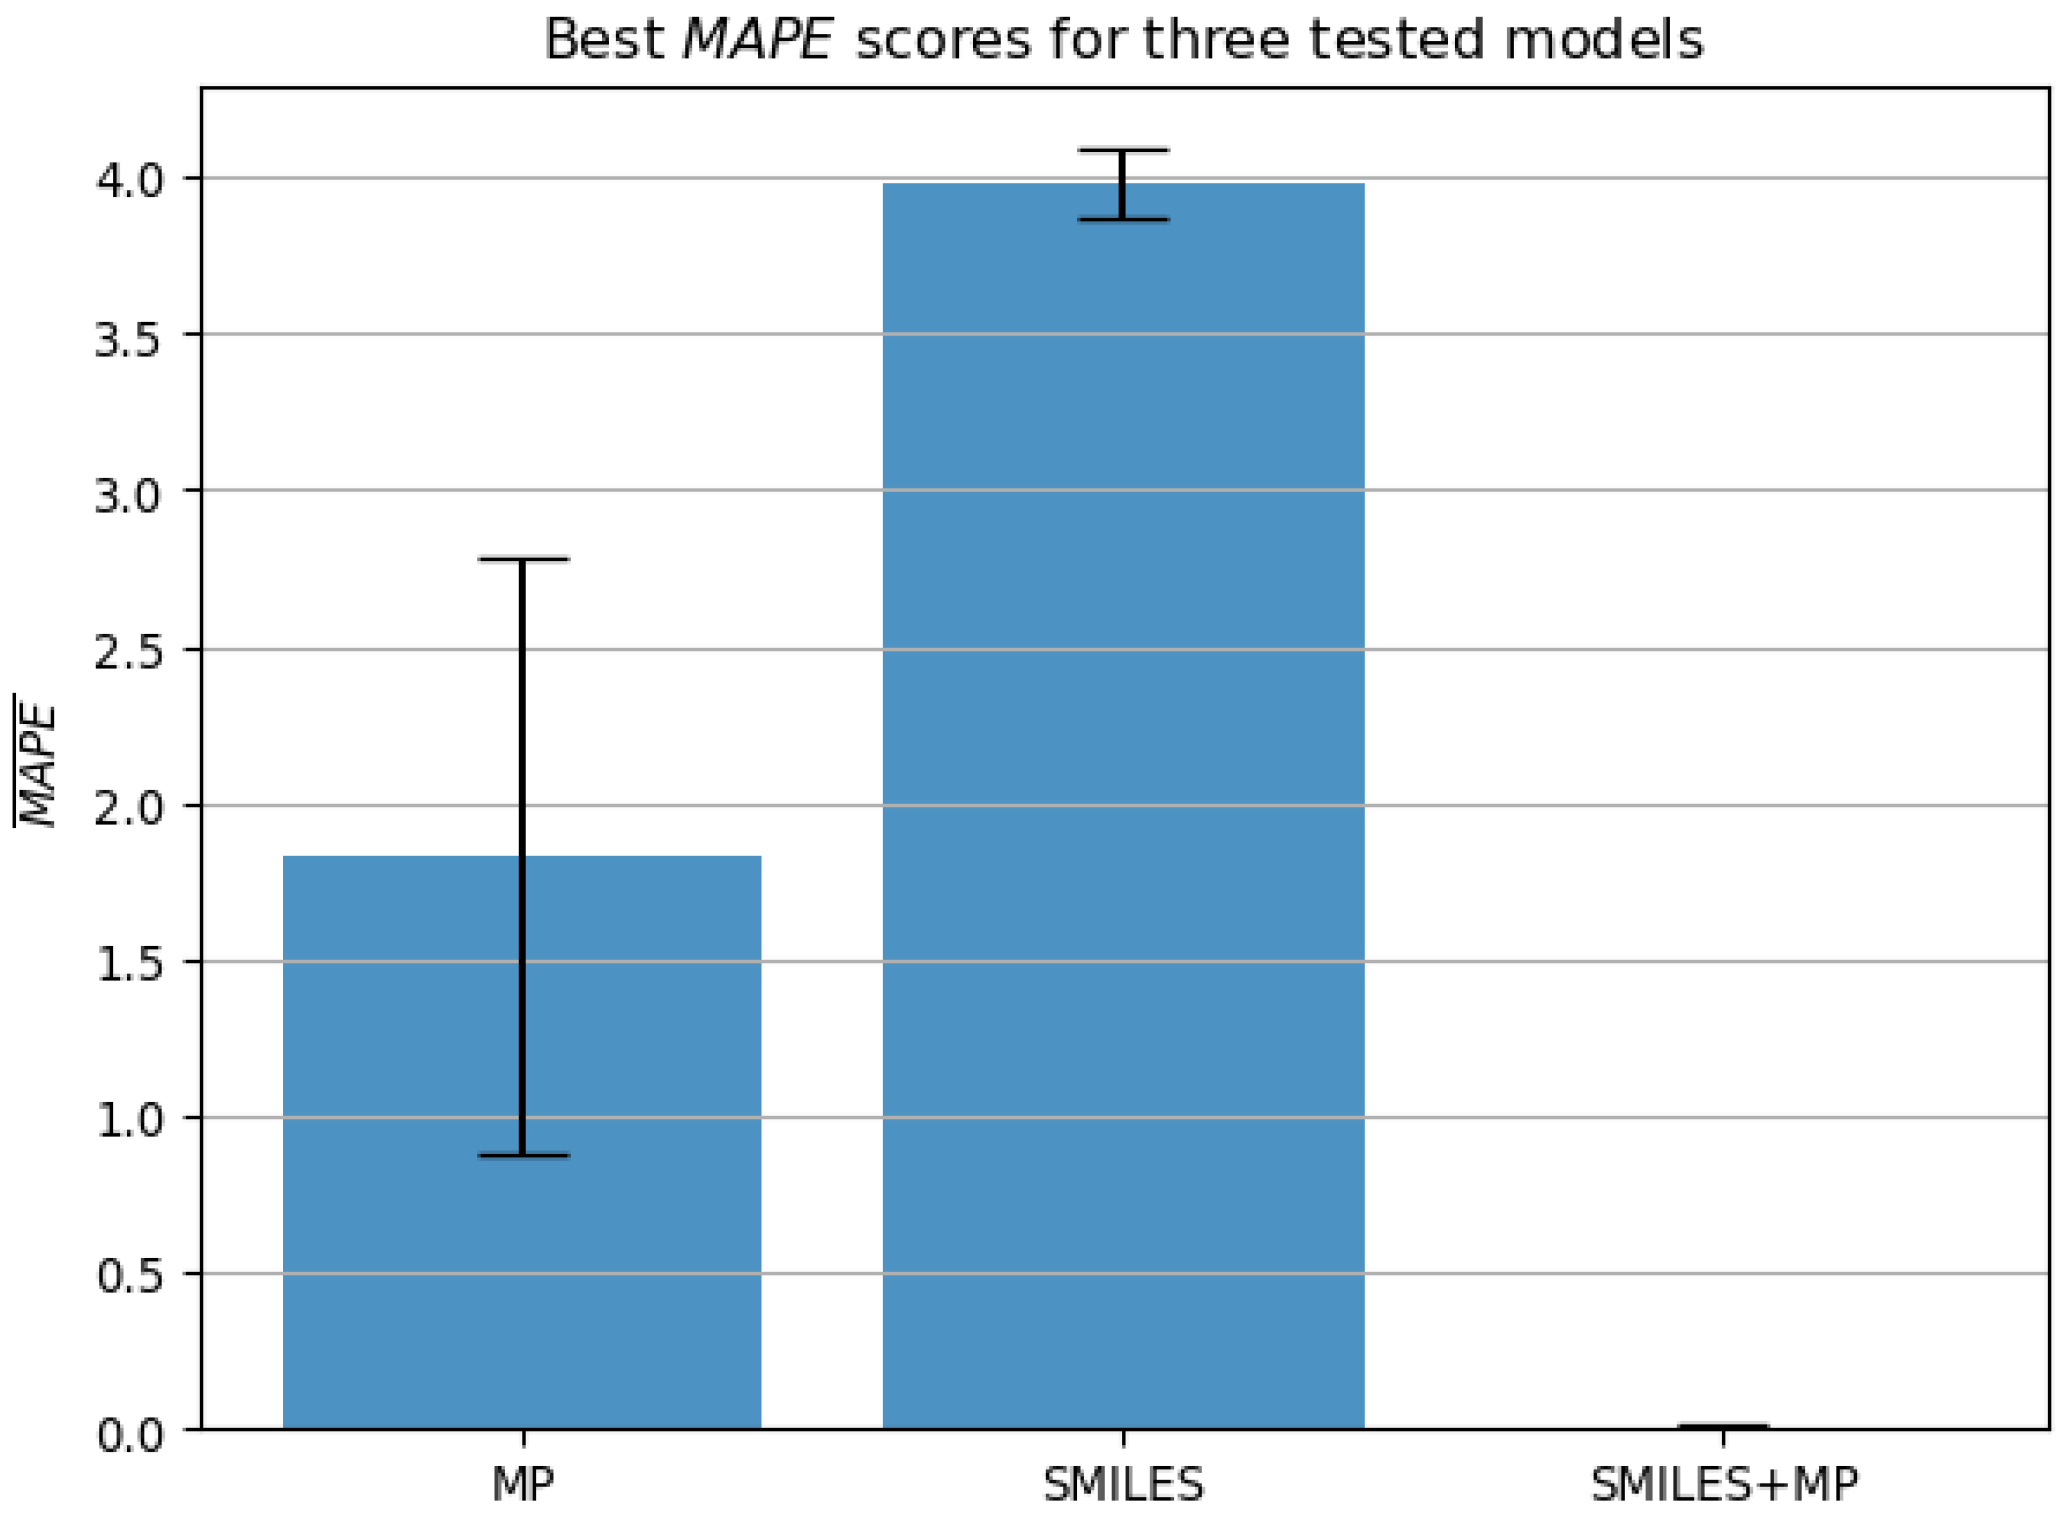
The other metric used is
, which is the mean of absolute differences between corresponding elements of the output sets
Y and
, expressed as a percentage [
60]. Due to it being expressed as a percentage, it can easily be used to compare the precision of different models. This metric is calculated as [
61]:
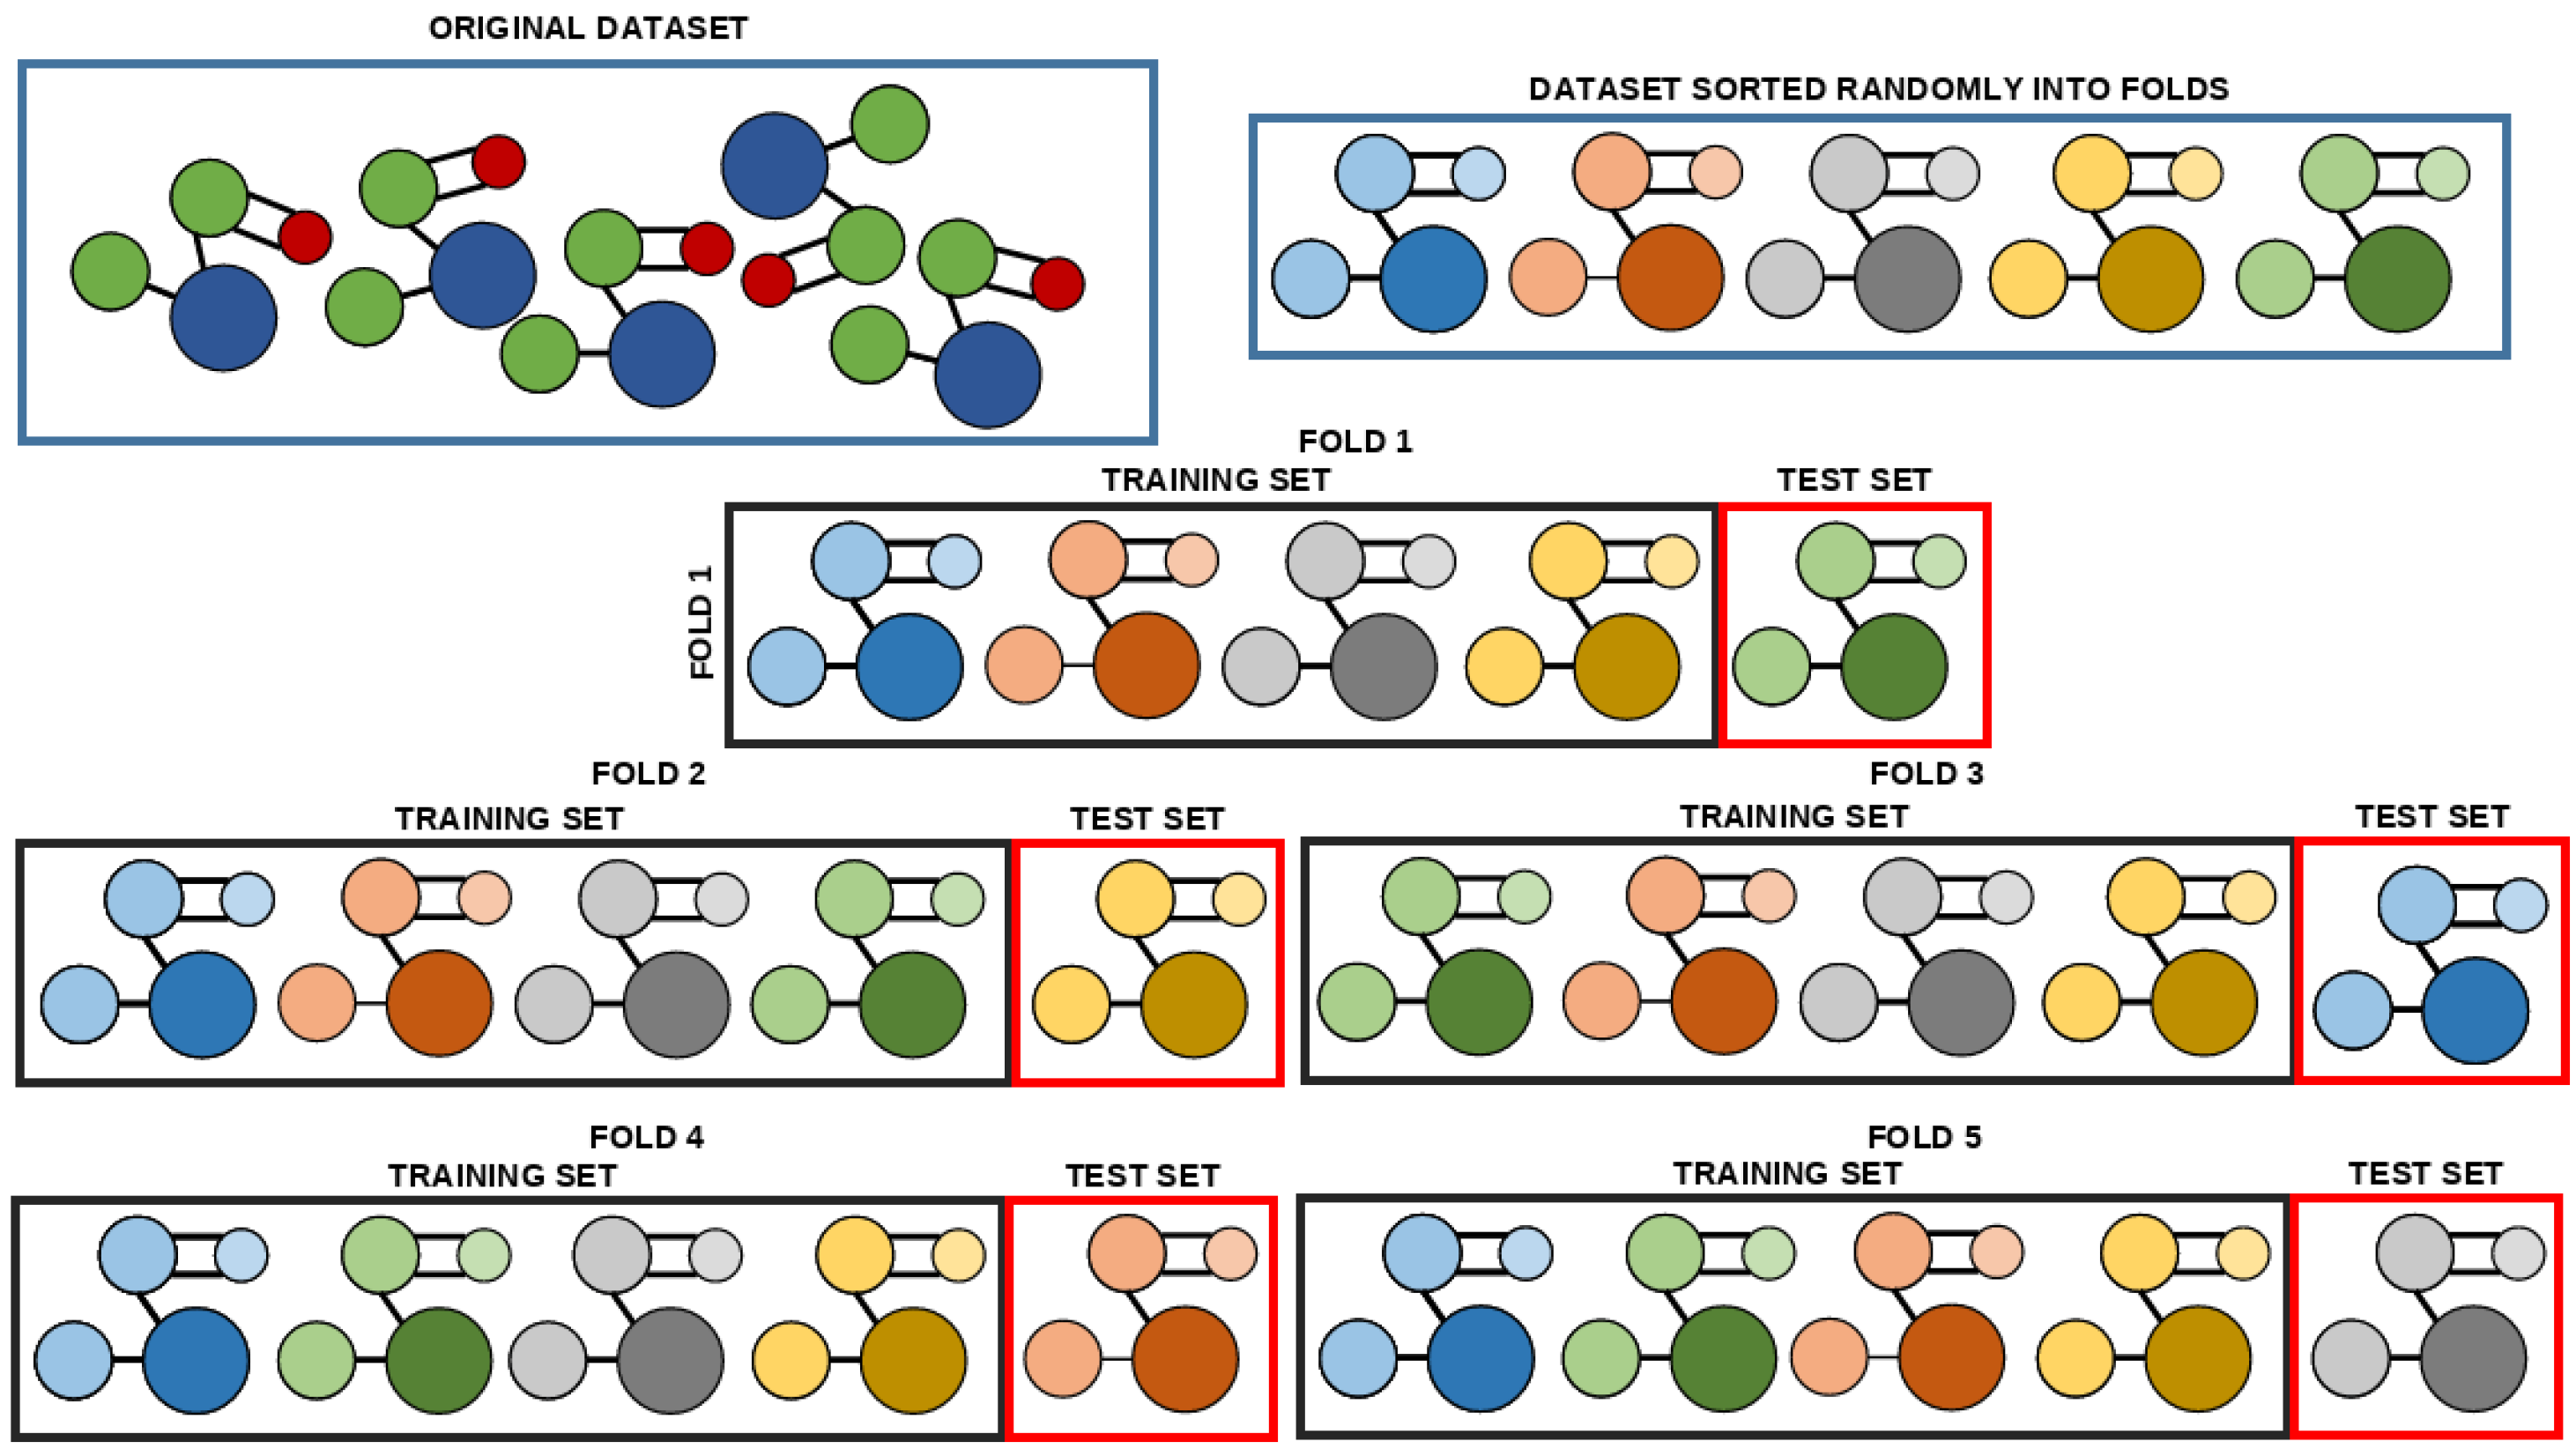
Because the dataset is relatively small, five-fold cross-validation has been applied. As seen in
Figure 6, the original dataset is split into the dataset uniformly randomly without repetition, with each of the subsets containing an equal number of data points [
62]. With the five subsets, the process of training can be started. In each of the five repetitions, a different subset is used as the testing set, while the remaining four subsets are mixed to create the training set [
63]. Each of these recombined training-testing datasets are referred to as a fold. A prediction score is calculated on each of the training folds. These five scores are then used to calculate the average of the scores across each of the folds, with the standard error. The goal of this procedure is to avoid models that will overfit on individual data points, as a well-generalizing model will have good scores on each of the subsets [
64].
For the purposes of this research, the model is considered to have satisfying performance if it fulfills the following two criteria, which have been determined depending on the review of the previous research in the field (
Table 2):
Condition 1. achieves the score higher than 0.99 when accounting for the lower bound of scores according to the standard error across all five testing folds;
Condition 2. achieves the error lower than 1.0% when accounting for the higher bound of errors according to the standard error across all five testing folds.


