Abstract
Amyotrophic lateral sclerosis (ALS) is a progressive neurodegenerative disease characterized by the loss of upper and lower motor neurons, which eventually may lead to death. Critical to the mission of developing effective therapies for ALS is the discovery of biomarkers that can illuminate mechanisms of neurodegeneration and have diagnostic, prognostic, or pharmacodynamic value. Here, we merged unbiased discovery-based approaches and targeted quantitative comparative analyses to identify proteins that are altered in cerebrospinal fluid (CSF) from patients with ALS. Mass spectrometry (MS)-based proteomic approaches employing tandem mass tag (TMT) quantification methods from 40 CSF samples comprising 20 patients with ALS and 20 healthy control (HC) individuals identified 53 proteins that are differential between the two groups after CSF fractionation. Notably, these proteins included both previously identified ones, validating our approach, and novel ones that have the potential for expanding biomarker repertoire. The identified proteins were subsequently examined using parallel reaction monitoring (PRM) MS methods on 61 unfractionated CSF samples comprising 30 patients with ALS and 31 HC individuals. Fifteen proteins (APOB, APP, CAMK2A, CHI3L1, CHIT1, CLSTN3, ERAP2, FSTL4, GPNMB, JCHAIN, L1CAM, NPTX2, SERPINA1, SERPINA3, and UCHL1) showed significant differences between ALS and the control. Taken together, this study identified multiple novel proteins that are altered in ALS, providing the foundation for developing new biomarkers for ALS.
1. Introduction
Amyotrophic lateral sclerosis (ALS) is a progressive neurodegenerative disease characterized by the loss of upper and lower motor neurons, eventually leading to death [1,2,3,4,5]. An average of 5.5 people per 100,000 population are annually diagnosed with ALS in the United States [6,7,8]. ALS patients die within 2–5 years after the first diagnosis [1,9]. Clinical hallmarks of ALS have significant heterogeneity, including behavioral changes for ≈60% of the cases and co-occurrence of frontotemporal dementia for ≈15% of the cases [10]. The etiology of ALS is still elusive. Although 5–10% of ALS cases are familial, most cases are sporadic [11]. The commonly known genetic risk factors of ALS include changes in C9ORF72, SOD1, TARDBP, and FUS [9]. Genetic changes in C9ORF72, which is the most frequently observed in ALS, are autosomal dominant and manifested by several hundred to thousands of hexanucleotide repeats of GGGGCC in the promotor or intron1 of the gene [12]. More than 170 genetic alterations are observed in SOD1 in ALS, and these are also autosomal dominant. Because most of the mutations in SOD1 are observed in exons, it is widely accepted that SOD1 protein dysfunction is linked to ALS pathogenesis [11,13]. TARDBP encodes TDP43, a DNA- and RNA-binding protein involved in the splicing, transcription, stability, and transport of mRNAs. TDP-43 is implicated in ALS through gain-of-function mechanisms in which mutant TDP-43 disrupts stress granules or via loss-of-function in which TDP-43 is depleted from the nucleus [11,14]. FUS encodes a nucleoprotein that colocalizes with TDP-43 and is considered to have similar RNA editing deficiencies as TDP-43 in ALS [15].
Since there is no cure for ALS, current treatment options are focused on slowing progression and managing symptoms. For instance, riluzole is employed to inhibit glutamate release from pre-synaptic terminals, while edaravone acts as a free radical scavenger, thus slowing the disease’s progression [16]. On the other hand, baclofen is utilized to alleviate spasticity, while nuedexta is utilized to alleviate both spasticity and difficulties with swallowing [16,17]. Therefore, the development of biomarkers that can be used for elucidating disease mechanisms and for the diagnosis, prognosis, and estimation of pharmacodynamics is imperative. Recently, there have been major efforts dedicated to identifying biomarkers for ALS, and chief among these are quantitative methods to measure proteins in patient biofluids such as blood, urine, saliva, and cerebrospinal fluid (CSF). Mass spectrometry (MS)-based proteomic approaches are considered the gold standard for protein discovery, and there have been multiple attempts to develop protein biomarkers for ALS using proteomics technology [5,6,18,19,20,21,22]. So far, multiple proteins, including CHIT1, CHI3L1, CHI3L2, UCHL1, MAP2, GPNMB, and neurofilament proteins, have been reported as candidate ALS biomarkers [23,24,25,26]. Many of these proteins await rigorous validation [27]. Clearly, the discovery of additional novel biomarkers is needed, but one major barrier is that many key regulatory proteins are of relatively low abundance and fail to be detected [28]. Accordingly, the identification of useful biomarkers for ALS requires the application of innovative, highly sensitive, and accurate methodologies. Herein, we report findings from an initial unbiased proteomics discovery study on CSF from 20 patients with ALS and 20 healthy controls (HC). We employed tandem-mass-tag (TMT)-based multiplexing technology for the accurate and sensitive quantification of CSF proteins, with subsequent analysis of TMT-labeled peptides via an Orbitrap Fusion Lumos ETD MS. From the discovery phase, we identified several new candidate ALS biomarker proteins as well as several previously reported ones, validating our approach. Using proteins identified from the discovery phase, we subsequently performed a validation experiment using parallel reaction monitoring (PRM) targeted MS in 61 CSF samples from 30 patients with ALS and 31 HC individuals. Through these approaches, we identified novel biomarkers for ALS that can be used for the diagnosis, prognosis, and estimation of pharmacodynamics, which will contribute to a better understanding of ALS pathogenesis mechanisms. Further, this work highlights that our innovative MS approach has iterative potential in other neurodegenerative diseases.
2. Methods
2.1. Collection of CSF Samples
CSF samples from 11 HC individuals and 30 patients with ALS were obtained from the Northeast Amyotrophic Lateral Sclerosis (NEALS) consortium. Nineteen additional CSF samples from HC individuals were provided by the Advancing Research and Treatment for Frontotemporal Lobar Degeneration Research Consortium (ARTFL) at the University of California San Francisco (UCSF). Lumbar punctures were performed using the atraumatic technique and collected in a polypropylene tube before transferring to a 50 mL conical polypropylene tube at room temperature (RT), which was mixed gently by inverting 3–4 times. Within 15 min of collection, CSF was centrifuged at 2000× g for 10 min at RT and aliquoted directly into pre-cooled polypropylene cryovials. Within 60 min of CSF collection, aliquots were frozen on dry ice and then stored at −80 °C, until further analysis. For samples collected prior to 2015, the protocol used is described by Scherling CS et al. [29]. Study participants provided written informed consent, and all procedures were approved by the relevant Institutional Review Boards (IRB). The demographics of CSF samples used in this study are provided in Table 1.

Table 1.
The demographics of CSF samples used in this study.
2.2. Sample Preparation and Trypsin Digestion for Discovery Experiments
Sample preparation was conducted as described previously with minor modifications [30,31]. To analyze 40 CSF samples using an 11-plex TMT, the 40 CSF samples were divided into 4 batches of 10 samples each, and a master pool (MP) sample was included in each batch for normalization between 4 batches. The MP was prepared by combining an equal volume from all 40 CSF samples including HC and ALS (Figure 1A). To denature proteins in CSF, we mixed each CSF sample with one volume of lysis buffer composed of 10 M urea, 100 mM triethylammonium bicarbonate (TEAB), 20 mM tris (2-carboxyethyl) phosphine hydrochloride (TCEP), and 80 mM chloroacetamide (CAA), followed by incubating the samples at RT for 1 h for reduction and alkylation to be completed. Subsequently, the protein digestion was carried out with LysC (lysyl endopeptidase MS grade, Fujifilm Wako Pure Chemical Industries Co., Ltd., Osaka, Japan) at a one-to-fifty ratio for 3 h at 37 °C, followed by trypsin (sequencing grade modified trypsin, Promega, Fitchburg, WI, USA) digestion overnight at 37 °C after diluting urea from 5 M to 2 M with 50 mM TEAB. After acidifying digested peptides with 1% trifluoroacetic acid (TFA) to the final concentration, they were desalted using C18 StageTips (3M Empore™, St. Paul, MN, USA). The desalted peptides were dried with a Savant SPD121P SpeedVac concentrator (Thermo Fisher Scientific, Waltham, MA, USA). To perform TMT-based quantitative MS, the digested peptides from CSF samples were labeled using 11-plex TMT reagents following the manufacturer’s instructions (Thermo Fisher Scientific). The MP samples were labeled with 131C, while CSFs from ALS patients and HC individuals were labeled with the rest of the TMT tags at RT for 1 h. Labeling reactions were carried out at RT for 1 h after mixing each peptide sample in 100 mM TEAB with TMT reagent in acetonitrile (ACN). After this, the reaction was quenched by adding 1/10 volume of 1 M Tris-HCl (pH 8.0). The TMT-labeled peptides were pooled and pre-fractionated by basic pH reversed-phase liquid chromatography (bRPLC) with an Agilent 1260 offline HPLC system (Agilent Technologies, Santa Clara, CA, USA) as follows. The peptides were reconstituted in solvent A (10 mM TEAB in water, pH 8.5); loaded onto an Agilent 300 Extend-C18 column (5 m, 4.6 mm × 250 mm, Agilent Technologies); and resolved over 90 min of a gradient of solvent B (10 mM TEAB in 90% ACN and 10% water, pH 8.5) at 0.3 mL/min, collecting 96 fractions. After this, the 96 fractions were concatenated into 24 fractions and dried in a SpeedVac.
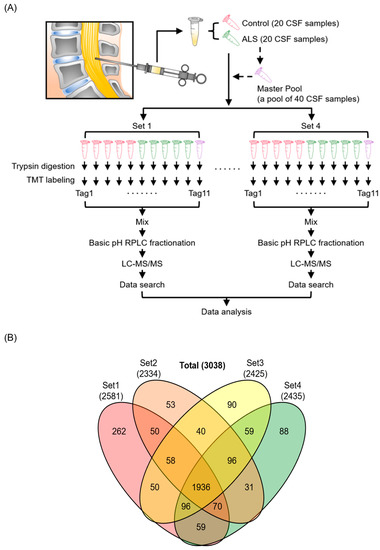
Figure 1.
Experimental strategy and identified proteins from the discovery experiment for ALS biomarker candidate proteins. Human CSF samples from 20 patients with ALS and 20 HC individuals were analyzed with four 11-plex TMT experimental batches. MP was prepared by pooling all 40 CSF samples and was added to each TMT experiment to normalize between batches. CSF proteins were digested with trypsin and labeled with TMT reagents, followed by pre-fractionation into 24 fractions prior to mass spectrometry analysis. Proteins were subsequently identified by conducting a database search of the acquired mass spectra (A). The numbers of identified proteins from 4 batches of TMT-based proteomics experiments are shown in the Venn diagram (B).
2.3. LC-MS/MS Analysis for the Discovery of Biomarker Candidates
LC-MS/MS analysis was conducted as described previously with minor modifications [30,31]. The dried peptides were reconstituted in 0.5% formic acid (FA) and analyzed using an Orbitrap Fusion Lumos Tribrid MS coupled with an Ultimate 3000 RS Autosampler nanoflow liquid chromatography system (Thermo Fisher Scientific). The peptides were loaded into trap columns (Acclaim™ PepMap™ 100 LC C18, 5 μm, 100 μm × 2 cm, Thermo Fisher Scientific) at a flow rate of 8 μL/min and separated on an analytical column (Easy-Spray™ PepMap™ RSLC C18, 2 μm, 75 μm × 50 cm, Thermo Fisher Scientific) at a flow rate of 0.3 μL/min with mobile phases consisting of 0.1% FA in water and 0.1% FA in 95% ACN and 5% water. The overall run time was 120 min. The MS data were acquired in a data-dependent acquisition mode. The MS1 scan range for precursor ions was set to m/z 300–1800 in the top-speed mode. The resolutions for MS1 and MS2 were set to 120,000 and 50,000, respectively, at an m/z of 200. The automatic gain controls for MS1 and MS2 were set to 1 × 10⁶ and 5 × 10⁴, respectively. The maximum ion injection times for MS1 and MS2 were set to 50 ms and 100 ms, respectively. The charges for MS2 isolation were set to 2 to 5, and the most intense ions were fragmented using higher-energy collisional dissociation (HCD) fragmentation with 35% normalized collision energy. The precursor isolation window was set to m/z 1.6 with a m/z 0.4 offset and the dynamic exclusion was set to 30 s. The internal calibration was performed using the lock mass option (m/z 445.1200025) from ambient air.
2.4. Database Searches for Peptide and Protein Identification
The database search and quantification were conducted as described previously with minor modifications [30,31]. A database search of the acquired tandem MS data was conducted against the human UniProt database (released in May 2018, containing protein entries with common contaminants) with the SEQUEST search algorithm embedded in the Thermo Proteome Discoverer platform (version 2.2.0.388, Thermo Fisher Scientific). The top ten peaks within each m/z 100 window were selected for database searches during MS/MS preprocessing. The database search parameters were as follows. Two missed cleavages by trypsin were allowed. Carbamidomethylation (+57.02146 Da) at cysteine and TMT modification (+229.162932 Da) at the N-terminus of peptides and lysine residues were set for fixed modifications, while oxidation (+15.99492 Da) of methionine was set for variable modifications. The MS1 error tolerance was set to 10 ppm, and the MS/MS error tolerance was set to 0.02 Da. The minimum peptide length was set to 6 amino acids. False discovery rates (FDRs) were set at 1% for both peptides and proteins. The protein quantification was performed with the parameters as follows. A centroid-based integration mode was used, a tolerance of 20 ppm was set for reporter ions, MS order was set to MS2, and the activation type was set to HCD. The quantification value correction was disabled. Peptide quantification was performed using both unique and razor peptides. Peptide uniqueness was determined at the level of protein groups. Missing intensity values were replaced with the minimum value. The signal-to-noise ratio was used to compute reporter ion abundance. The quantification value corrections for isobaric tags were disabled. A threshold of 50% was set for co-isolation. The average signal-to-noise threshold for reporters was set to 50. Data normalization was disabled. Protein groups were created by applying the strict parsimony principle as follows: (1) all proteins that share the same set or subset of identified peptides were grouped; (2) protein groups without any unique peptides were filtered out; and (3) Proteome Discoverer iterated through all spectra and chose which peptide-spectrum match (PSM) to use in ambiguous cases to create a protein group with the greatest number of unambiguous and unique peptides. The Proteome Discoverer summed all the reporter ion abundances of PSMs for the corresponding proteins in a TMT run.
2.5. Preparation of CSF Samples for the PRM Experiments
The isotopically labeled peptides (SpikeTides L, JPT Peptide Technologies GmbH, Berlin, Germany) were synthesized with 13C- and 15N-labeled lysine and arginine at their C-termini and were used for the PRM analysis. The CSF samples were mixed with 1 volume of the lysis buffer, composed of 8 M urea, 20 mM TCEP, 80 mM CAA, 100 mM TEAB, and synthetic peptides with known amounts. The CSF and lysis buffer mixture were incubated for 1 h at RT for reduction and alkylation. Protein digestion was carried out using LysC (Wako Chemicals Industries Co., Ltd., Osaka, Japan) at a one-to-fifty ratio at 37 °C for 3 h and then using trypsin (sequencing grade modified trypsin, Promega, Fitchburg, WI, USA) at a one-to-fifty ratio at 37 °C overnight after diluting the concentration of urea from 4 M to 2 M by adding 50 mM TEAB. Peptides were purified using C18 StageTips (3M Empore™, St. Paul, MN, USA) after acidifying with TFA. The peptide eluents were dried in a SpeedVac (Thermo Fisher Scientific) and then stored at −80 °C until use.
2.6. LC-MS/MS Analysis for Validation Experiments Using the PRM Method
LC-MS/MS analyses were conducted as described previously with minor modifications [30,31]. The peptide samples were analyzed on an Orbitrap Fusion Lumos Tribrid mass spectrometer interfaced with an Ultimate 3000 RSLCnano nanoflow liquid chromatography system (Thermo Fisher Scientific). The peptides reconstituted in 15 μL of 0.1% FA were loaded on Acclaim PepMap100 Nano-Trap column (100 μm × 2 cm, Thermo Fisher Scientific) packed with 5 μm C18 particles at a flow rate of 5 μL per min. The flow rate employed was 250 nL/min using a linear gradient of 6% to 28% solvent B (0.1% FA in 95% ACN and 5% water) over 55 min on an EASY-Spray column (50 cm × 75 µm, Thermo Fisher Scientific) packed with 2 µm C18 particles (Thermo Fisher Scientific), which was fitted with an EASY-Spray ion source operated at a voltage of 2.0 kV. Mass spectrometry analysis was conducted in the targeted MS2 mode. The MS1 scan range for a full survey scan was acquired from m/z 300 to 1600 with a resolution of 120,000 at an m/z of 200. The mass resolution for MS2 was set to 30,000 at an m/z of 200. Automatic gain control was set to 500,000 and 100,000 ions for MS1 and MS2, respectively. The maximum ion injection time and HCD fragmentation energy for each peptide are listed in Table S1.
2.7. Experimental Design and Statistical Rationale
The sample size determination was conducted in a similar way to the one described previously with minor modifications [30,31]. The total number of CSF samples used in the discovery study was 40, composed of 20 ALS patients and 20 HC individuals. We conducted sample size analysis using the pwr package in R. When we wanted to detect proteins with 1.5-fold differences between groups, the required minimum sample size was 11.299 when the significance level was 0.0001, power was 0.8, sigma was 0.24, and delta was 0.585 (=log21.5). This sigma value of 0.24 was derived from our in-house TMT proteomics experiments conducted with human CSF samples. The significance level of 0.0001 was determined on the basis of our in-house data. When we identified several thousands of proteins, the majority of the proteins with p value < 0.0001 showed q-value < 0.05. On the basis of this sample size analysis, we decided to use 20 samples per group. The statistical analysis of the mass spectrometry data was performed with the Perseus (version 1.6.0.7) software package. The intensity values of each protein were divided by the one of the MP included in each batch, followed by dividing the values of each sample by the sample median. The relative abundance values for each sample were log2-transformed, followed by z-score transformation [32,33]. The fold changes between the comparison groups were calculated by dividing the average abundance values of each protein from one group by the values from another group. According to our normality test using the Shapiro–Wilk test in the dplyr package in R, the majority of the proteins showed normal distribution. Thus, p values between the comparison groups were calculated by Student’s two-sample t-test. Since we were conducting multiple comparisons, we calculated an FDR by comparing data with and without permutations between groups. The q-values for the volcano plots were calculated by a permutation-based FDR estimation in the significance analysis of microarrays (SAM) method, in which p values and fold-changes were calculated before and after the permutation of samples from two groups [34]. Protein–protein association network analysis was conducted using the STRING database [35].
Skyline software (version 21.2) was used for the analysis of PRM data [36]. The quantification was conducted by summing the area under the curves (AUC) of the third-to-last fragment y ions of the selected peptides. Statistical analysis was performed using GraphPad Prism (version 9, GraphPad Software Inc., San Diego, CA, USA). Student’s unpaired, two-tailed t-test was used for the comparison between HC with ALS. A probability value of p < 0.05 was considered statistically significant. To evaluate the performance of biomarker candidates, univariate and multivariate receiver operating characteristic (ROC) curve analysis was performed in Metaboanalyst (version 5.0) [37]. For the univariate ROC analysis, bootstrapping was conducted by resampling 500 times to generate an AUC mean value with a 95% confidence interval. For multivariate ROC analysis, the partial least squares discriminant analysis (PLS-DA) classification method with the feature ranking method built in PLS-DA was selected. The number of latent variables was set to 2. To begin multivariate analysis using PLS-DA, ROC curves were generated using balanced subsampling by Monte Carlo cross-validation (MCCV). In each MCCV, 2/3 of the samples were used to evaluate feature importance, and the remaining 1/3 were used to validate the models created with the first step. The top-ranking features in terms of importance were used to build the biomarker classification models. This was repeated several times to calculate the performance and confidence intervals of each model.
2.8. Disclosure of Previously Published Data
Out of ≈3000 proteins identified in the TMT-based discovery experiment of this study, the data for 78 glycosylphosphatidylinositol-anchored proteins (GPI-APs) were published previously to show the differential release of GPI-APs by differential glycerophosphodiester phosphodiesterase 2 activity in ALS patients compared to control individuals [38].
3. Results
3.1. Quantitative Proteome Analysis of CSF Samples
We first implemented an unbiased discovery-based approach to identify proteins that are differentially expressed in the CSF of patients with ALS compared with HC individuals. We performed a quantitative proteome analysis of 40 CSF samples comprising 20 patients with ALS and 20 HC individuals using TMT labeling-based mass spectrometry (Figure 1A, Table 1). The 40 samples were split into 4 batches of 10 and were labeled with an 11-plex TMT reagent. The MP, which is a reference sample prepared by pooling equal volumes of all 40 CSF samples, was placed at the 11th channel of each 11-plex TMT experimental set for the purpose of normalization between batches. After enzyme digestion and TMT labeling, the peptides were pre-fractionated using a bRPLC system. The fractions were analyzed by LC-MS/MS. In total, 3,828,053 MS/MS spectra were acquired, and 402,387 MS/MS spectra were assigned to peptides leading to the identification of 26,726 peptides and 3038 proteins. Out of 3038 proteins, 1936 proteins were identified in all four TMT experimental batches (Figure 1B, Supplementary Data S1).
3.2. Selection of Candidate Biomarkers for ALS
To quantify protein abundances measured by the four TMT experimental batches, we normalized the intensity values of each protein to the intensities of the MP samples in each TMT experiment. The normalized data were subsequently subjected to statistical analyses to identify proteins that were differentially expressed between the two groups. Nineteen proteins were found to have differential expression between ALS and HC on the basis of q-value < 0.05 (Table 2, Figure 2A,B). Out of 19 differentially expressed proteins, 15 proteins were upregulated in ALS, while only 4 proteins were downregulated in ALS. Twelve proteins (SERPINA3, GPNMB, MEGF8, GOT2, CENPF, NPTX2, CAMK2A, APP, L1CAM, CHI3L1, PF4, and LYZ) were novel, and seven proteins (CHI3L2, CHIT1, NEFL, NEFM, NEFH, UCHL1, and APOB) were reported previously [23,24,25,26,39,40]. Protein–protein association network analysis showed that NEFL and APP were the most connected proteins within the panel of proteins identified (Figure 2C). Taken together, this discovery-based approach successfully identified potential biomarkers for ALS.
Table 2.
Differentially expressed proteins in CSFs from ALS patients compared to the ones from HC individuals identified in the discovery experiment.
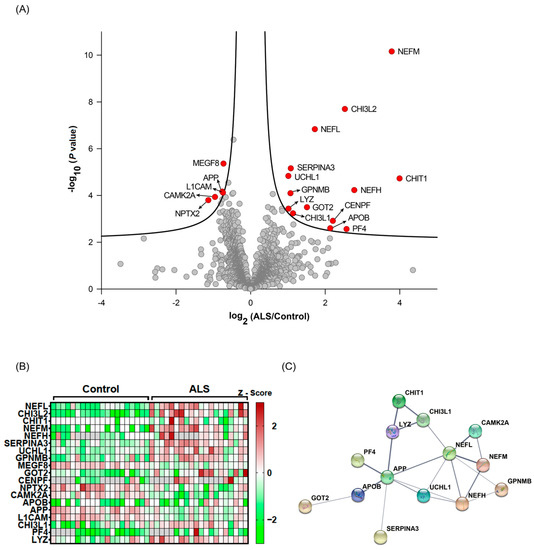
Figure 2.
Statistical and bioinformatic analyses of the identified CSF proteins. The quantified CSF proteins from 20 patients with ALS and 20 HC individuals were plotted on a volcano plot. The curved lines are the boundaries for a q-value of 0.05. The proteins with q-value < 0.05 are colored in red (A). The differentially expressed proteins (q-value < 0.05) are shown on a heatmap (B). Protein–protein association network analysis (C) for differentially expressed proteins (q-value < 0.05) using STRING.
3.3. Detectability of Candidate Biomarker Proteins in Targeted PRM Analysis
To validate the potential of the proteins identified in the discovery experiments as biomarkers for ALS, we opted to use PRM analysis of unfractionated CSF. PRM is a targeted mass spectrometry analysis that does not utilize the chemical modification of peptides. Instead, known quantities of standard isotope labeled (SIL) tryptic peptides that have identical sequences to the tryptic peptides of the target proteins were spiked into the sample for accurate quantitation of the relevant endogenous target peptides. We first determined whether peptides of the target proteins were detectable by PRM analysis in unfractionated CSF samples. CSF samples were pooled from 20 patients with ALS and 20 HC individuals, and 200 fmol of SIL peptides corresponding to the endogenous target peptides were added prior to trypsin digestion to enable subsequent monitoring of relevant peptides. We evaluated 53 proteins with q-value < 0.1 (Table 2), and 31 of the 53 proteins were detectable by PRM (Table 2). A total of 15 of the 31 proteins were detected by two or more peptides, while 18 proteins were detected by one peptide (Table S1).
3.4. Response Curve Test of Candidate Biomarker Proteins in PRM Analysis
Prior to beginning the PRM analysis, we examined the response curve of the target peptides to determine the proper range for accurate quantification of the 16 target proteins. We added varying amounts of SIL peptides (0.01, 0.1, 1, 10, 100, 1000, and 10,000 fmol) corresponding to the target tryptic peptides from the pooled CSF samples, and the SIL peptides were quantified by PRM analysis. The majority of the peptides showed linear responses in the range from 0.1 fmol to 10 pmol (Figure S1). Five peptides, namely, APOB (WNFYYSPQSSPDK), CAMK2A (FYFENLWSR), CAMK2A (ITQYLDAGGIPR), CAMK2A (VTEQLIEAISNGDFESYTK), and CHIT1 (DNQWVGFDDVESFK), showed linear responses at the range from 0.01 fmol to 10 pmol (Figure S1A). Twenty-nine peptides, namely, IGLV3-19 (ITCQGDSLR), JCHAIN (FVYHLSDLCK), LTA4H (WEDAIPLALK), NFASC (LTVSWLK), PPBP (ICLDPDAPR), UCHL1 (FSAVALCK), CHIT1 (YPLIQTLR), ERAP2 (ILAVTDFEPTQAR), FSTL4 (FDDYNSDSSLTLR), APP (THPHFVIPYR), APP (VESLEQEAANER), APP (WYFDVTEGK), CHI3L1 (ILGQQVPYATK), CNTNAP2 (FSFSTTK), MEGF8 (LFPLPGR), MFAP4 (GFYYSLK), NELL2 (SALAYVDGK), NPTX2 (AAVLQLR), NPTX2 (TESTLNALLQR), RTN4RL2 (LFLQNNLIR), SERPINA3 (LINDYVK), CHI3L1 (QLLLSAALSAGK), NPTX1 (LENLEQYSR), NPTX1 (LPFVINDGK), RTN4RL2 (SLEPDTFQGLER), SERPINA1 (LSSWVLLMK), SERPINA1 (SVLGQLGITK), TPI1 (QSLGELIGTLNAAK), and MFAP4 (ADGEYWLGLQNMHLLTLK), showed linear responses at the range from 0.1 fmol to 10 pmol (Figure S1B–D). Sixteen peptides, namely, GPNMB (AYVPIAQVK), JCHAIN (IVLVDNK), L1CAM (YDIEFEDK), ST8SIA5 (EINSADFVFR), APOB (LPYTIITTPPLK), CHI3L1 (FPLTNAIK), CLSTN1 (YISNEFK), CSPG5 (EAGSAVEAEELVK), LINGO1 (HLNINAIR), MEGF8 (HVWTTLK), NCAN (ELGGEVFYVGPAR), NCAN (LSSAIIAAPR), NCAN (QDLPILVAK), NELL2 (AFLFQDTPR), NELL2 (ASTATAEQFFQK), and NELL2 (FTGSSWIK), showed linear responses at the range from 1 fmol to 10 pmol (Figure S1E,F). Four peptides, namely, CHIT1 (SSFYSCAAGR), CHIT1 (FTDMVATANNR), CLSTN3 (FTVTAYDCGK), and FSTL4 (LLVESLFR), showed linear responses at the range from 10 fmol to 10 pmol (Figure S1G). Two peptides, namely, SERPINA3 (AVLDVFEEGTEASAATAVK) and SERPINA1 (LYHSEAFTVNFGDTEEAK), showed linear responses at the range from 100 fmol to 10 pmol (Figure S1G). In summary, almost all target peptides showed a linear response curve in the detectable range, enabling us to quantify target peptides accurately.
3.5. Targeted Quantification of Candidate ALS Biomarker Peptides in CSF from ALS and HC Individuals
To validate whether the selected candidate peptides show differential expression levels in CSF from ALS patients without TMT labeling, we quantified the target peptides using PRM in unfractionated 61 CSF samples from 20 ALS patients and 20 HC individuals that were from our original cohort used in the discovery experiments and from an additional 10 ALS patients and 11 HC individuals that were from an independent cohort (Table 1). To accurately quantify the target peptides using PRM in CSF samples from ALS patients and HC individuals, SIL peptides were added to the CSF samples at the beginning of the experiment. We added similar concentrations of the SIL peptides to the endogenous peptides, but when the concentrations of the endogenous peptides were lower than 5 pmol/mL, we added 5 pmol/mL of SIL peptides to avoid ambiguous detection. After the digestion of the CSF proteins with trypsin, the endogenous and SIL peptides were monitored by PRM assay (Figure 3). In total, 56 peptides from 31 proteins were validated by PRM assay. The expression of APOB1 (two peptides), CHI3L1 (three peptides), CHIT1 (four peptides), GPNMB (one peptide), ERAP2 (one peptide), JCHAIN (one of two quantified peptides), SERPINA1 (three peptides), SERPINA3 (two peptides), and UCHL1 (one peptide) were upregulated in ALS patients (Figure 4A), while the expression of APP (three peptides), CAMK2A (three peptides), CLSTN3 (one peptide), FSTL4 (one of two quantified peptides), L1CAM (one peptide), and NPTX2 (two peptides) were downregulated (Figure 4B). The rest of the peptides did not show statistically significant differences (Figure S2). Interestingly, we did not find notable differences between the groups with ALSFRS scores ≥ 40 and the groups with ALSFRS scores < 39. To estimate the consistency of the discovery data with the validation data, we conducted a correlation analysis of the ALS candidate biomarker proteins that showed statistical significance in both the discovery and validation experiments. All the ALS candidate biomarkers showed a positive correlation between discovery and validation data (Figure 4C). We also conducted ROC analysis to evaluate the performance of 29 peptides with statistically significant differences in discriminating ALS from HC. CHIT1 (FTDMVATANNR with AUC 0.868, DNQWVGFDDVESFK with AUC 0.858, SSFYSCAAGR with AUC 0.869, and YPLIQTLR with AUC 0.843), APOB (LPYTIITTPPLK with AUC 0.837 and WNFYYSPQSSPDK with 0.792), CAMK2A (VTEQLIEAISNGDFESYTK with AUC 0.839, ITQYLDAGGIPR with AUC 0.829, and FYFENLWSR with AUC 0.789), and SERPINA3 (AVLDVFEEGTEASAATAVK with AUC 0.816 and LINDYVK with AUC 0.774) showed the top four highest average areas under the ROC curves among the measured candidate biomarkers (Figure 5 and Figure S3). The ROC analysis results for the remaining candidates are shown in Figure S3 and Table S2. To further improve the discriminability of the candidate biomarkers, we employed multivariate analysis using MCCV and PLS-DA methods. When all 56 features were used, the AUC was 0.906 (Figure 6A). CHIT1 (SSFYSCAAGR, FTDMVATANNR, and DNQWVGFDDVESFK) was the most contributing protein, followed by CAMK2A (VTEQLIEAISNGDFESYTK and ITQYLDAGGIPR) and APOB (LPYTIITTPPLK) (Figure 6B). The predictive accuracy reached 84% when 56 features were used (Figure 6C). These results showed that the proteins that we have identified hold promise as candidate biomarkers for ALS, and when multiple biomarkers are used, the discriminative power can be further improved.
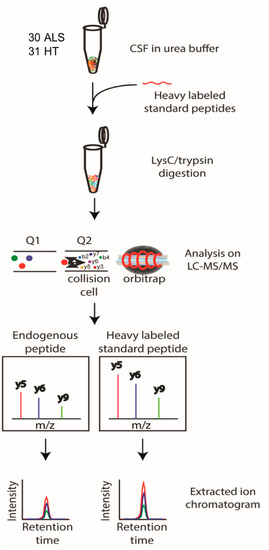
Figure 3.
Schematic workflow of the PRM analysis. The selected candidate ALS biomarker proteins were validated by PRM analysis of CSF samples from 30 ALS patients and 31 HC individuals. SIL peptides were added to the CSF samples for the accurate quantification of the target peptides, followed by trypsin digestion and PRM analysis. The peptide abundance was calculated by extracting the AUC of light endogenous and heavy SIL peptides.
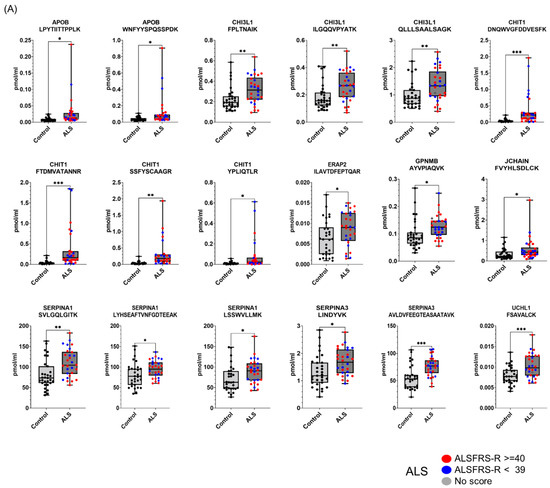
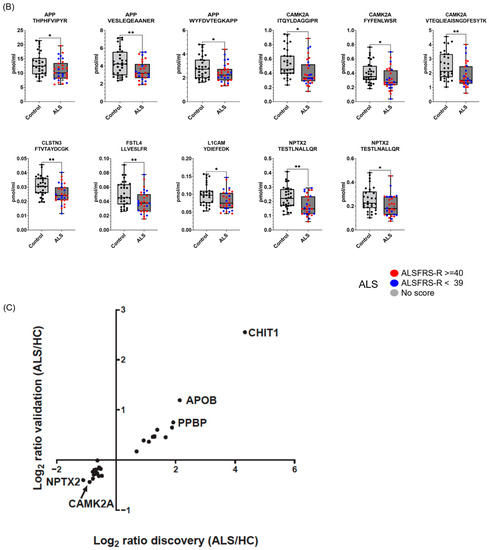
Figure 4.
Proteins differentially expressed in ALS CSFs in the validation experiment. The selected candidate ALS biomarker proteins were validated by PRM analysis using 30 ALS patients and 31 HC individuals. SIL peptides were added to the CSF samples for the accurate quantification of the target peptides for the PRM analysis. The peptide abundance was calculated by extracting the AUC of light endogenous and heavy SIL peptides. Eighteen peptides were upregulated in ALS (A), and eleven peptides were downregulated in ALS (B). Patients with ALSFRS scores < 39 are shown as blue dots, and patients with ALSFRS scores ≥ 40 are shown as red dots. Since one ALS patient had no score, the patient is shown as a gray dot. All PRM-MS analyses were performed in 3 technical replicates. Student’s unpaired, two-tailed t-test was conducted for statistical analysis between groups (* p < 0.05; ** p < 0.01; *** p < 0.0001). The correlation of candidate biomarkers measured in the discovery and validation experiment is shown (C).
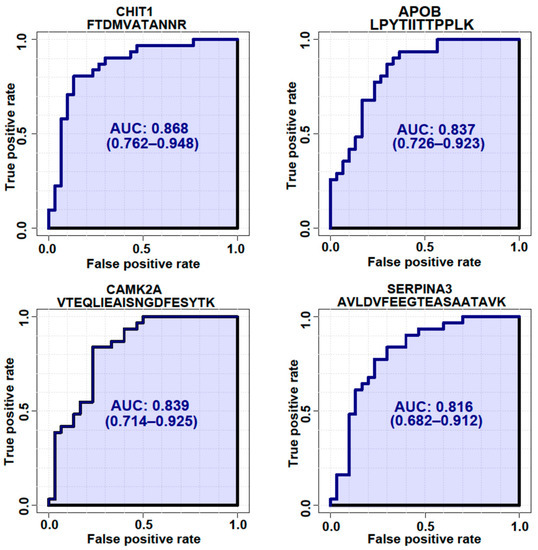
Figure 5.
ROC analysis of 4 representative proteins with the highest AUCs. ROC analysis was generated by bootstrapping. The values in parentheses show the lower and upper AUC values of the 95% confidence interval.
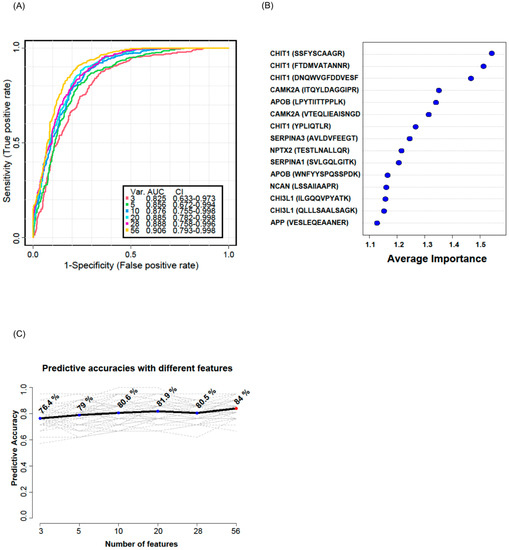
Figure 6.
Multivariate ROC analysis and predictive accuracy. Multivariate ROC analyses were conducted using different numbers of features ranging from 3 to 56. Var. indicates the number of features used. CI indicates confidence interval (A). The top 15 significant features affecting the discrimination of ALS from HC are shown with their average importance (B). The accuracy for predicting ALS as the number of features increased is shown (C).
4. Discussion
In this study, we used an unbiased quantitative discovery approach to identify proteins that are differentially present in ALS CSF compared with HC CSF and validated these differences using a targeted quantitative approach. Towards this end, we performed discovery-based studies on pre-fractionated CSF from 20 patients with ALS and 20 HC individuals using an 11-plex TMT platform and discovered 53 candidate ALS biomarker proteins (19 candidates with q < 0.05 and 34 candidates with q < 0.1). Among the 53 candidate ALS biomarker proteins, 44 proteins are novel, and 9 proteins were identified previously as being differentially expressed in ALS, and these include neurofilament proteins (NEFL, NEFM, and NEFH), CHIT1, CHI3L1, CHI3L2, APOB, GPNMB, and UCHL1 [20,41,42]. Neurofilament proteins are intermediate filament proteins that are elevated in response to neuronal damage [25,43], while CHIT1, CHI3L1, and CHI3L2 are members of the human chitinase family that are implicated in inflammation [24]. UCHL1 is a ubiquitin-protein hydrolase important for protein homeostasis that is expressed in neurons and neuroendocrine cells, whereas APOB is associated with metabolic changes in ALS [40,44]. Consistent with previous studies, we found that all these candidate proteins were elevated in CSF samples from patients with ALS [20,25,26,45,46,47,48]. This observation independently strengthens the potential of novel candidate biomarker for ALS identified in our study.
After the discovery phase, we utilized PRM analysis of unfractionated CSF without TMT labeling to validate the candidates that we had identified in the discovery phase of our study. Unfortunately, proteins that showed the largest differential expression in our discovery studies, such as neurofilament proteins, were not detectable by PRM, suggesting that these proteins are expressed at relatively lower levels in CSF. Since we used unfractionated CSF peptides in the validation phase while we used fractionated CSF peptides in the discovery phase, some candidate ALS biomarker proteins with low abundance were not detected, even though PRM analysis is more sensitive than TMT. Further validation of these candidates is needed to determine their utility as biomarkers for ALS.
Our PRM analyses successfully detected 31 proteins discovered from our discovery experiments. APOB, which was increased in ALS in our study, is a lipoprotein responsible for carrying fat molecules in the human body [49]. Mariosa et al. [40] reported that the higher APOB level in serum is associated with an increased ALS risk and may serve as prodromal symptoms decades before ALS diagnosis. Picard et al. [49] reported that APOB is a biomarker for early tau pathology in Alzheimer’s disease. APP, which was decreased in ALS in our study, has been proposed to be involved in several human neurodegenerative diseases such as AD, autism, fragile X syndrome (FXS), ALS, multiple sclerosis (MS), and Lesch–Nyhan disease (LND) [50]. Since β-amyloid accumulation in the brain of ALS patients has been reported [51], the β-amyloid accumulation in the brain of ALS can result in the decrease in β-amyloid in CSF. However, considering the APP peptides quantified in the PRM-MS analysis is not β-amyloid region, the decreased APP in ALS is less likely to be related to the β-amyloid accumulation. CAMK2A, which was decreased in ALS in our study, is a kinase crucial for neural plasticity and memory and is expressed in both excitatory and inhibitory neurons [51]. The expression of CAMK2A is decreased in inhibitory neurons at the initial stage of nerve injury [52]. Moreover, CAMK2A is reported to be dysregulated in the AD hippocampus [53]. CHI3L1 and CHIT1, which were increased in ALS in our study, are members of the human chitinase family proteins. Varghese et al. [26] reported that CSF levels of CHIT1, CHI3L1, and CHI3L2 were significantly elevated in ALS patients relative to HC individuals. CLSTN3, which was decreased in ALS in our study, is a calsyntenin member protein that plays an evolutionarily conserved role in memory and learning, promoting the development of synapses [54]. To the best of our knowledge, the current study is the first to characterize decreased CLSTN3 levels in human CSF from ALS patients. However, since studies on the involvement of CLSTN3 in ALS are still lacking, further mechanistic studies are needed. ERAP2, which was increased in ALS in our study, is a protein associated with immune-mediated diseases [55]. However, little is known about the relationship between ERAP2 and ALS. Ziff et al. [56] reported that human-induced pluripotent-stem-cell-derived astrocytes carrying ALS-causing mutations showed increased ERAP2 mRNA expressed with reduced intron retention (IR), which is required for the activation of astrocytes. The increased ERAP2 in ALS CSF could be potentially involved in the activation of astrocytes. FSTL4, which was decreased in ALS in our study, is known as a negative regulator of BDNF maturation [57]. Collins et al. [6] conducted mass-spectrometry-based biomarker discovery using ALS CSF and reported that FSTL4 was decreased in ALS CSF in consistency with our result. JCHAIN, which was increased in ALS in our study, is a protein component of immunoglobulins A and M working as a glue for the formation of multimeric immunoglobulins [58]. However, its relationship with ALS is not known yet. GPNMB, which was increased in ALS in our study, is a protein involved in inflammatory processes [59], and the absence of UCHL1 leads to the degeneration of motor axons [60]. Both GPNMB and UCHL1 have been reported as ALS candidate biomarkers recently, with increased expression levels in ALS consistent with our study [23]. L1CAM, which was decreased in ALS in our study, is involved in diverse processes at different stages during the development of the nervous system and is expressed on the surface of nerve cells [61,62]. Our data showing the decreased expression level of L1CAM in ALS CSF could be reflecting the death of neuronal cells. NPTX2, which was decreased in ALS in our study, is involved in mediating excitatory neurotransmission and has been reported to be involved in various diseases such as Parkinson’s disease (PD), ischemia, Alzheimer’s disease (AD), and frontotemporal dementia [63]. Xiao et al. [64] also reported that NPTX2 is involved in the adaptative control of the pyramidal neuron-fast-spiking parvalbumin circuit, and failure of this adaptive control could be involved in the cognitive decline of AD patients. The decreased NPTX2 in CSF in our data suggests that the adaptative control of the pyramidal neuron-fast-spiking parvalbumin circuit could be damaged in the ALS patient’s brain. SERPINA1, which was increased in ALS in our study, is an acute inflammatory protein, and the overexpression of this protein has been observed in AD and FTLD [65,66]. The increased level of SERPINA1 was also observed in Creutzfeldt–Jakob disease (CJD) and frontotemporal lobar degeneration (FTLD) [67]. The increased SERPINA1 level in our data suggests that the acute inflammatory response mediated by SERPINA1 could be involved in ALS as well. SERPINA3, which was increased in ALS in our study, is a glycoprotein involved in various physiological processes such as complement cascade, inflammation, and wound healing, and this protein is reported to be involved in various neurodegenerative diseases [68]. Fissolo et al. reported an increased level of SERPINA3 in CSF from progressive multiple sclerosis [69].
In this study, we were able to validate a substantial number of candidate ALS biomarker proteins identified in the discovery phase. However, there were still some proteins that could not be validated as they were not detectable in the PRM analysis, likely due to their abundance falling below the detection limit of the PRM method. Consequently, further studies will be necessary to validate these proteins.
5. Conclusions
Our data showed that the candidate biomarkers, such as CHIT1, APOB, CAMK2A, and SERPIN3, had AUC > 0.8 in the ROC curve analysis. Furthermore, the multivariate analysis using all the candidate biomarkers identified in this study showed even im-proved AUC > 0.9, suggesting that combining the ALS biomarker candidate proteins identified in our study with ALS biomarkers from other studies can potentially further improve the discriminatory power between ALS and control. In summary, our mass-spectrometry-based approach identified fifteen ALS candidate biomarker proteins. Further validation across a larger number of cohorts across ALS and other neurodegenerative diseases will be needed to evaluate their utility as ALS biomarkers.
Supplementary Materials
The following supporting information can be downloaded at: https://www.mdpi.com/article/10.3390/biomedicines11051250/s1, Figure S1: The response curve of candidate biomarker peptides in the PRM analysis; Figure S2: The peptides that did not show statistically different differences between ALS and HC in the PRM-MS assay; Figure S3: ROC analyses of peptides from the candidate ALS biomarker proteins from the discovery experiment; Table S1: The list of peptides detected in the PRM-MS analysis; Table S2: Average abundance of each peptide quantified by PRM-MS and their statistical analysis results. Supplementary Data S1: The list of identified proteins by the TMT-based proteomics experiment.
Author Contributions
C.H.N. designed the research; S.O. and Y.J. performed mass spectrometry analysis; S.O., Y.J. and C.H.N. analyzed the data; S.O., Y.J. and C.H.N. wrote the manuscript; and C.H.N. supervised the research. All authors have read and agreed to the published version of the manuscript.
Funding
This research received no external funding.
Institutional Review Board Statement
Samples were obtained from the NEALS Biofluid Repository and the UCSF Memory and Aging Center. Procedures were approved by IRBs of participating sites.
Informed Consent Statement
Informed consent was obtained from all subjects involved in the study.
Data Availability Statement
All mass spectrometry data and search results have been deposited in the ProteomeXchange Consortium via the PRIDE partner repository with the dataset identifierPXD038846 and project name ‘Discovery of biomarkers for amyotrophic lateral sclerosis from human cerebrospinal fluid using mass spectrometry-based proteomics’ [70].
Acknowledgments
We acknowledge the support of the shared instrumentation grant (S10OD021844). Data collection and dissemination of the data presented in this manuscript were supported by the NIH through the 4R-tau Neuroimaging Initiative (4RTNI, R01AG038791), the ALLFTD Consortium (U19AG063911), the former ARTFL and LEFFTDS Consortia (ARTFL: U54NS092089; LEFFTDS: U01AG045390), and the UCSF Alzheimer’s Disease Research Center and Program Project Grant (ADRC P50AG023501, PPG P01AG019724), as well as the Rainwater Charitable Foundation. We thank Shanthini Sockanathan for her help in acquiring samples and for discussions. The authors acknowledge the invaluable contributions of the study participants and families, as well as the assistance of the support staff at each of the participating sites.
Conflicts of Interest
The authors declare no conflict of interest.
Abbreviations
ACN, acetonitrile; AGC, automatic gain control; AUC, area under the curve; ALS, amyotrophic lateral sclerosis; ALSFRS, Amyotrophic Lateral Sclerosis Functional Rating Scale; bRPLC, basic pH reversed-phase liquid chromatography; CAA, chloroacetamide; CSF, cerebrospinal fluids; CV, coefficient variation; DDA, data-dependent acquisition; FA, formic acid; FDR, false-discovery rate; HC, healthy control; MS, mass spectrometry; MS/MS, fragment ion; MS1, precursor ion; MCCV, Monte Carlo cross-validation; MP, master pool; PLS-DA, partial least squares discriminant analysis; PSM, peptide-spectrum match; PRM, parallel reaction monitoring; ROC, receiver operating characteristic; RT, room temperature; SAM, significance analysis of microarrays; SIL, standard isotope labeled; TEAB, triethylammonium bicarbonate; TECP, tris (2-carboxyethyl) phosphine hydrochloride; TFA, trifluoroacetic acid; TMT, tandem mass tag.
References
- Rowland, L.P.; Shneider, N.A. Amyotrophic lateral sclerosis. N. Engl. J. Med. 2001, 344, 1688–1700. [Google Scholar] [CrossRef]
- Mitchell, J.D.; Borasio, G.D. Amyotrophic lateral sclerosis. Lancet 2007, 369, 2031–2041. [Google Scholar] [CrossRef] [PubMed]
- Wijesekera, L.C.; Leigh, P.N. Amyotrophic lateral sclerosis. Orphanet. J. Rare Dis. 2009, 4, 3. [Google Scholar] [CrossRef]
- Kiernan, M.C.; Vucic, S.; Cheah, B.C.; Turner, M.R.; Eisen, A.; Hardiman, O.; Burrell, J.R.; Zoing, M.C. Amyotrophic lateral sclerosis. Lancet 2011, 377, 942–955. [Google Scholar] [CrossRef] [PubMed]
- Vu, L.T.; Bowser, R. Fluid-Based Biomarkers for Amyotrophic Lateral Sclerosis. Neurotherapeutics 2017, 14, 119–134. [Google Scholar] [CrossRef]
- Collins, M.A.; An, J.; Hood, B.L.; Conrads, T.P.; Bowser, R.P. Label-Free LC-MS/MS Proteomic Analysis of Cerebrospinal Fluid Identifies Protein/Pathway Alterations and Candidate Biomarkers for Amyotrophic Lateral Sclerosis. J. Proteome Res. 2015, 14, 4486–4501. [Google Scholar] [CrossRef]
- Cruz, M.P. Edaravone (Radicava): A Novel Neuroprotective Agent for the Treatment of Amyotrophic Lateral Sclerosis. Pharm. Ther. 2018, 43, 25–28. [Google Scholar]
- Mehta, P.; Kaye, W.; Raymond, J.; Punjani, R.; Larson, T.; Cohen, J.; Muravov, O.; Horton, K. Prevalence of Amyotrophic Lateral Sclerosis—United States, 2015. MMWR Morb. Mortal. Wkly. Rep. 2018, 67, 1285–1289. [Google Scholar] [CrossRef] [PubMed]
- Morgan, S.; Orrell, R.W. Pathogenesis of amyotrophic lateral sclerosis. Br. Med. Bull. 2016, 119, 87–98. [Google Scholar] [CrossRef]
- Goutman, S.A.; Hardiman, O.; Al-Chalabi, A.; Chio, A.; Savelieff, M.G.; Kiernan, M.C.; Feldman, E.L. Emerging insights into the complex genetics and pathophysiology of amyotrophic lateral sclerosis. Lancet Neurol. 2022, 21, 465–479. [Google Scholar] [CrossRef] [PubMed]
- Mehta, P.; Raymond, J.; Punjani, R.; Han, M.; Larson, T.; Kaye, W.; Nelson, L.M.; Topol, B.; Muravov, O.; Genson, C.; et al. Prevalence of amyotrophic lateral sclerosis in the United States using established and novel methodologies, 2017. Amyotroph. Lateral Scler. Frontotemporal. Degener. 2022, 24, 108–116. [Google Scholar] [CrossRef] [PubMed]
- Balendra, R.; Isaacs, A.M. C9orf72-mediated ALS and FTD: Multiple pathways to disease. Nat. Rev. Neurol. 2018, 14, 544–558. [Google Scholar] [CrossRef] [PubMed]
- Pansarasa, O.; Bordoni, M.; Diamanti, L.; Sproviero, D.; Gagliardi, S.; Cereda, C. SOD1 in Amyotrophic Lateral Sclerosis: “Ambivalent” Behavior Connected to the Disease. Int. J. Mol. Sci. 2018, 19, 1345. [Google Scholar] [CrossRef] [PubMed]
- Suk, T.R.; Rousseaux, M.W.C. The role of TDP-43 mislocalization in amyotrophic lateral sclerosis. Mol. Neurodegener. 2020, 15, 45. [Google Scholar] [CrossRef] [PubMed]
- Shang, Y.; Huang, E.J. Mechanisms of FUS mutations in familial amyotrophic lateral sclerosis. Brain. Res. 2016, 1647, 65–78. [Google Scholar] [CrossRef] [PubMed]
- Mead, R.J.; Shan, N.; Reiser, H.J.; Marshall, F.; Shaw, P.J. Amyotrophic lateral sclerosis: A neurodegenerative disorder poised for successful therapeutic translation. Nat. Rev. Drug Discov. 2023, 22, 185–212. [Google Scholar] [CrossRef]
- Chang, E.; Ghosh, N.; Yanni, D.; Lee, S.; Alexandru, D.; Mozaffar, T. A Review of Spasticity Treatments: Pharmacological and Interventional Approaches. Crit. Rev. Phys. Rehabil. Med. 2013, 25, 11–22. [Google Scholar] [CrossRef]
- Barschke, P.; Oeckl, P.; Steinacker, P.; Ludolph, A.; Otto, M. Proteomic studies in the discovery of cerebrospinal fluid biomarkers for amyotrophic lateral sclerosis. Expert Rev. Proteom. 2017, 14, 769–777. [Google Scholar] [CrossRef]
- Chen, Y.; Liu, X.H.; Wu, J.J.; Ren, H.M.; Wang, J.; Ding, Z.T.; Jiang, Y.P. Proteomic analysis of cerebrospinal fluid in amyotrophic lateral sclerosis. Exp. Ther. Med. 2016, 11, 2095–2106. [Google Scholar] [CrossRef]
- Thompson, A.G.; Gray, E.; Thezenas, M.L.; Charles, P.D.; Evetts, S.; Hu, M.T.; Talbot, K.; Fischer, R.; Kessler, B.M.; Turner, M.R. Cerebrospinal fluid macrophage biomarkers in amyotrophic lateral sclerosis. Ann. Neurol. 2018, 83, 258–268. [Google Scholar] [CrossRef]
- Kruger, T.; Lautenschlager, J.; Grosskreutz, J.; Rhode, H. Proteome analysis of body fluids for amyotrophic lateral sclerosis biomarker discovery. Proteom. Clin. Appl. 2013, 7, 123–135. [Google Scholar] [CrossRef] [PubMed]
- Bowser, R.; Turner, M.R.; Shefner, J. Biomarkers in amyotrophic lateral sclerosis: Opportunities and limitations. Nat. Rev. Neurol. 2011, 7, 631–638. [Google Scholar] [CrossRef] [PubMed]
- Oeckl, P.; Weydt, P.; Thal, D.R.; Weishaupt, J.H.; Ludolph, A.C.; Otto, M. Proteomics in cerebrospinal fluid and spinal cord suggests UCHL1, MAP2 and GPNMB as biomarkers and underpins importance of transcriptional pathways in amyotrophic lateral sclerosis. Acta Neuropathol. 2020, 139, 119–134. [Google Scholar] [CrossRef] [PubMed]
- Gaur, N.; Perner, C.; Witte, O.W.; Grosskreutz, J. The Chitinases as Biomarkers for Amyotrophic Lateral Sclerosis: Signals From the CNS and Beyond. Front. Neurol. 2020, 11, 377. [Google Scholar] [CrossRef] [PubMed]
- Gagliardi, D.; Meneri, M.; Saccomanno, D.; Bresolin, N.; Comi, G.P.; Corti, S. Diagnostic and Prognostic Role of Blood and Cerebrospinal Fluid and Blood Neurofilaments in Amyotrophic Lateral Sclerosis: A Review of the Literature. Int. J. Mol. Sci. 2019, 20, 4152. [Google Scholar] [CrossRef] [PubMed]
- Varghese, A.M.; Sharma, A.; Mishra, P.; Vijayalakshmi, K.; Harsha, H.C.; Sathyaprabha, T.N.; Bharath, S.M.; Nalini, A.; Alladi, P.A.; Raju, T.R. Chitotriosidase—A putative biomarker for sporadic amyotrophic lateral sclerosis. Clin. Proteom. 2013, 10, 19. [Google Scholar] [CrossRef]
- Meeter, L.H.H.; Vijverberg, E.G.; Del Campo, M.; Rozemuller, A.J.M.; Donker Kaat, L.; de Jong, F.J.; van der Flier, W.M.; Teunissen, C.E.; van Swieten, J.C.; Pijnenburg, Y.A.L. Clinical value of neurofilament and phospho-tau/tau ratio in the frontotemporal dementia spectrum. Neurology 2018, 90, e1231–e1239. [Google Scholar] [CrossRef]
- Smaczniak, C.; Li, N.; Boeren, S.; America, T.; van Dongen, W.; Goerdayal, S.S.; de Vries, S.; Angenent, G.C.; Kaufmann, K. Proteomics-based identification of low-abundance signaling and regulatory protein complexes in native plant tissues. Nat. Protoc. 2012, 7, 2144–2158. [Google Scholar] [CrossRef]
- Scherling, C.S.; Hall, T.; Berisha, F.; Klepac, K.; Karydas, A.; Coppola, G.; Kramer, J.H.; Rabinovici, G.; Ahlijanian, M.; Miller, B.L.; et al. Cerebrospinal fluid neurofilament concentration reflects disease severity in frontotemporal degeneration. Ann. Neurol. 2014, 75, 116–126. [Google Scholar] [CrossRef]
- Jang, Y.; Pletnikova, O.; Troncoso, J.C.; Pantelyat, A.Y.; Dawson, T.M.; Rosenthal, L.S.; Na, C.H. Mass Spectrometry-Based Proteomics Analysis of Human Substantia Nigra From Parkinson’s Disease Patients Identifies Multiple Pathways Potentially Involved in the Disease. Mol. Cell Proteom. 2023, 22, 100452. [Google Scholar] [CrossRef]
- Jang, Y.; Thuraisamy, T.; Redding-Ochoa, J.; Pletnikova, O.; Troncoso, J.C.; Rosenthal, L.S.; Dawson, T.M.; Pantelyat, A.Y.; Na, C.H. Mass spectrometry-based proteomics analysis of human globus pallidus from progressive supranuclear palsy patients discovers multiple disease pathways. Clin. Transl. Med. 2022, 12, e1076. [Google Scholar] [CrossRef]
- Wang, H.; Dey, K.K.; Chen, P.C.; Li, Y.; Niu, M.; Cho, J.H.; Wang, X.; Bai, B.; Jiao, Y.; Chepyala, S.R.; et al. Integrated analysis of ultra-deep proteomes in cortex, cerebrospinal fluid and serum reveals a mitochondrial signature in Alzheimer’s disease. Mol. Neurodegener. 2020, 15, 43. [Google Scholar] [CrossRef]
- Yang, G.; Xu, Z.; Lu, W.; Li, X.; Sun, C.; Guo, J.; Xue, P.; Guan, F. Quantitative Analysis of Differential Proteome Expression in Bladder Cancer vs. Normal Bladder Cells Using SILAC Method. PLoS ONE 2015, 10, e0134727. [Google Scholar] [CrossRef] [PubMed]
- Tusher, V.G.; Tibshirani, R.; Chu, G. Significance analysis of microarrays applied to the ionizing radiation response. Proc. Natl. Acad. Sci. USA 2001, 98, 5116–5121. [Google Scholar] [CrossRef]
- Szklarczyk, D.; Gable, A.L.; Lyon, D.; Junge, A.; Wyder, S.; Huerta-Cepas, J.; Simonovic, M.; Doncheva, N.T.; Morris, J.H.; Bork, P.; et al. STRING v11: Protein-protein association networks with increased coverage, supporting functional discovery in genome-wide experimental datasets. Nucleic Acids Res. 2019, 47, D607–D613. [Google Scholar] [CrossRef] [PubMed]
- MacLean, B.; Tomazela, D.M.; Shulman, N.; Chambers, M.; Finney, G.L.; Frewen, B.; Kern, R.; Tabb, D.L.; Liebler, D.C.; MacCoss, M.J. Skyline: An open source document editor for creating and analyzing targeted proteomics experiments. Bioinformatics 2010, 26, 966–968. [Google Scholar] [CrossRef] [PubMed]
- Pang, Z.; Zhou, G.; Ewald, J.; Chang, L.; Hacariz, O.; Basu, N.; Xia, J. Using MetaboAnalyst 5.0 for LC-HRMS spectra processing, multi-omics integration and covariate adjustment of global metabolomics data. Nat. Protoc. 2022, 17, 1735–1761. [Google Scholar] [CrossRef]
- Westerhaus, A.; Joseph, T.; Meyers, A.J.; Jang, Y.; Na, C.H.; Cave, C.; Sockanathan, S. The distribution and function of GDE2, a regulator of spinal motor neuron survival, are disrupted in Amyotrophic Lateral Sclerosis. Acta Neuropathol. Commun. 2022, 10, 73. [Google Scholar] [CrossRef]
- Gaiani, A.; Martinelli, I.; Bello, L.; Querin, G.; Puthenparampil, M.; Ruggero, S.; Toffanin, E.; Cagnin, A.; Briani, C.; Pegoraro, E.; et al. Diagnostic and Prognostic Biomarkers in Amyotrophic Lateral Sclerosis: Neurofilament Light Chain Levels in Definite Subtypes of Disease. JAMA Neurol. 2017, 74, 525–532. [Google Scholar] [CrossRef]
- Mariosa, D.; Hammar, N.; Malmstrom, H.; Ingre, C.; Jungner, I.; Ye, W.; Fang, F.; Walldius, G. Blood biomarkers of carbohydrate, lipid, and apolipoprotein metabolisms and risk of amyotrophic lateral sclerosis: A more than 20-year follow-up of the Swedish AMORIS cohort. Ann. Neurol. 2017, 81, 718–728. [Google Scholar] [CrossRef]
- Barschke, P.; Oeckl, P.; Steinacker, P.; Al Shweiki, M.R.; Weishaupt, J.H.; Landwehrmeyer, G.B.; Anderl-Straub, S.; Weydt, P.; Diehl-Schmid, J.; Danek, A.; et al. Different CSF protein profiles in amyotrophic lateral sclerosis and frontotemporal dementia with C9orf72 hexanucleotide repeat expansion. J. Neurol. Neurosurg. Psychiatry 2020, 91, 503–511. [Google Scholar] [CrossRef] [PubMed]
- Raghunathan, R.; Turajane, K.; Wong, L.C. Biomarkers in Neurodegenerative Diseases: Proteomics Spotlight on ALS and Parkinson’s Disease. Int. J. Mol. Sci. 2022, 23, 9299. [Google Scholar] [CrossRef]
- Yuan, A.; Nixon, R.A. Specialized roles of neurofilament proteins in synapses: Relevance to neuropsychiatric disorders. Brain Res. Bull. 2016, 126, 334–346. [Google Scholar] [CrossRef] [PubMed]
- Day, I.N.; Thompson, R.J. UCHL1 (PGP 9.5): Neuronal biomarker and ubiquitin system protein. Prog. Neurobiol. 2010, 90, 327–362. [Google Scholar] [CrossRef] [PubMed]
- Zhu, S.; Wuolikainen, A.; Wu, J.; Ohman, A.; Wingsle, G.; Moritz, T.; Andersen, P.M.; Forsgren, L.; Trupp, M. Targeted Multiple Reaction Monitoring Analysis of CSF Identifies UCHL1 and GPNMB as Candidate Biomarkers for ALS. J. Mol. Neurosci. 2019, 69, 643–657. [Google Scholar] [CrossRef]
- Gille, B.; De Schaepdryver, M.; Dedeene, L.; Goossens, J.; Claeys, K.G.; Van Den Bosch, L.; Tournoy, J.; Van Damme, P.; Poesen, K. Inflammatory markers in cerebrospinal fluid: Independent prognostic biomarkers in amyotrophic lateral sclerosis? J. Neurol. Neurosurg. Psychiatry 2019, 90, 1338–1346. [Google Scholar] [CrossRef] [PubMed]
- Thompson, A.G.; Gray, E.; Bampton, A.; Raciborska, D.; Talbot, K.; Turner, M.R. CSF chitinase proteins in amyotrophic lateral sclerosis. J. Neurol. Neurosurg. Psychiatry 2019, 90, 1215–1220. [Google Scholar] [CrossRef]
- Steinacker, P.; Verde, F.; Fang, L.; Feneberg, E.; Oeckl, P.; Roeber, S.; Anderl-Straub, S.; Danek, A.; Diehl-Schmid, J.; Fassbender, K.; et al. Chitotriosidase (CHIT1) is increased in microglia and macrophages in spinal cord of amyotrophic lateral sclerosis and cerebrospinal fluid levels correlate with disease severity and progression. J. Neurol. Neurosurg. Psychiatry 2018, 89, 239–247. [Google Scholar] [CrossRef]
- Picard, C.; Nilsson, N.; Labonte, A.; Auld, D.; Rosa-Neto, P.; Alzheimer’s Disease Neuroimaging, I.; Ashton, N.J.; Zetterberg, H.; Blennow, K.; Breitner, J.C.B.; et al. Apolipoprotein B is a novel marker for early tau pathology in Alzheimer’s disease. Alzheimers Dement. 2022, 18, 875–887. [Google Scholar] [CrossRef]
- Nguyen, K.V. beta-Amyloid precursor protein (APP) and the human diseases. AIMS Neurosci. 2019, 6, 273–281. [Google Scholar] [CrossRef]
- Calingasan, N.Y.; Chen, J.; Kiaei, M.; Beal, M.F. Beta-amyloid 42 accumulation in the lumbar spinal cord motor neurons of amyotrophic lateral sclerosis patients. Neurobiol. Dis. 2005, 19, 340–347. [Google Scholar] [CrossRef] [PubMed]
- Zhang, Y.Y.; Liu, F.; Lin, J.; Li, Y.L.; Fang, Z.H.; Zhou, C.; Li, C.J.; Shen, J.F. Activation of the N-methyl-D-aspartate receptor contributes to orofacial neuropathic and inflammatory allodynia by facilitating calcium-calmodulin-dependent protein kinase II phosphorylation in mice. Brain Res. Bull. 2022, 185, 174–192. [Google Scholar] [CrossRef] [PubMed]
- Ghosh, A.; Giese, K.P. Calcium/calmodulin-dependent kinase II and Alzheimer’s disease. Mol. Brain 2015, 8, 78. [Google Scholar] [CrossRef]
- Lu, Z.; Wang, Y.; Chen, F.; Tong, H.; Reddy, M.V.; Luo, L.; Seshadrinathan, S.; Zhang, L.; Holthauzen, L.M.; Craig, A.M.; et al. Calsyntenin-3 molecular architecture and interaction with neurexin 1alpha. J. Biol. Chem. 2014, 289, 34530–34542. [Google Scholar] [CrossRef]
- Paladini, F.; Fiorillo, M.T.; Tedeschi, V.; Mattorre, B.; Sorrentino, R. The Multifaceted Nature of Aminopeptidases ERAP1, ERAP2, and LNPEP: From Evolution to Disease. Front. Immunol. 2020, 11, 1576. [Google Scholar] [CrossRef]
- Ziff, O.J.; Taha, D.M.; Crerar, H.; Clarke, B.E.; Chakrabarti, A.M.; Kelly, G.; Neeves, J.; Tyzack, G.E.; Luscombe, N.M.; Patani, R. Reactive astrocytes in ALS display diminished intron retention. Nucleic Acids Res. 2021, 49, 3168–3184. [Google Scholar] [CrossRef] [PubMed]
- Suzuki, R.; Fujikawa, A.; Komatsu, Y.; Kuboyama, K.; Tanga, N.; Noda, M. Enhanced extinction of aversive memories in mice lacking SPARC-related protein containing immunoglobulin domains 1 (SPIG1/FSTL4). Neurobiol. Learn Mem. 2018, 152, 61–70. [Google Scholar] [CrossRef]
- Bhown, A.S.; Mole, J.E.; Bennett, J.C. Primary structure of human J chain: Isolation and characterization of tryptic and chymotryptic peptides of human J chain. Biochemistry 1977, 16, 3501–3507. [Google Scholar] [CrossRef]
- van der Lienden, M.J.C.; Gaspar, P.; Boot, R.; Aerts, J.; van Eijk, M. Glycoprotein Non-Metastatic Protein B: An Emerging Biomarker for Lysosomal Dysfunction in Macrophages. Int. J. Mol. Sci. 2018, 20, 66. [Google Scholar] [CrossRef]
- Genc, B.; Jara, J.H.; Schultz, M.C.; Manuel, M.; Stanford, M.J.; Gautam, M.; Klessner, J.L.; Sekerkova, G.; Heller, D.B.; Cox, G.A.; et al. Absence of UCHL 1 function leads to selective motor neuropathy. Ann. Clin. Transl. Neurol. 2016, 3, 331–345. [Google Scholar] [CrossRef]
- Dahme, M.; Bartsch, U.; Martini, R.; Anliker, B.; Schachner, M.; Mantei, N. Disruption of the mouse L1 gene leads to malformations of the nervous system. Nat. Genet. 1997, 17, 346–349. [Google Scholar] [CrossRef]
- Linneberg, C.; Toft, C.L.F.; Kjaer-Sorensen, K.; Laursen, L.S. L1cam-mediated developmental processes of the nervous system are differentially regulated by proteolytic processing. Sci. Rep. 2019, 9, 3716. [Google Scholar] [CrossRef] [PubMed]
- Chapman, G.; Shanmugalingam, U.; Smith, P.D. The Role of Neuronal Pentraxin 2 (NP2) in Regulating Glutamatergic Signaling and Neuropathology. Front. Cell Neurosci. 2019, 13, 575. [Google Scholar] [CrossRef] [PubMed]
- Xiao, M.F.; Xu, D.; Craig, M.T.; Pelkey, K.A.; Chien, C.C.; Shi, Y.; Zhang, J.; Resnick, S.; Pletnikova, O.; Salmon, D.; et al. NPTX2 and cognitive dysfunction in Alzheimer’s Disease. eLife 2017, 6, e23798. [Google Scholar] [CrossRef] [PubMed]
- Ebbert, M.T.W.; Ross, C.A.; Pregent, L.J.; Lank, R.J.; Zhang, C.; Katzman, R.B.; Jansen-West, K.; Song, Y.; da Rocha, E.L.; Palmucci, C.; et al. Conserved DNA methylation combined with differential frontal cortex and cerebellar expression distinguishes C9orf72-associated and sporadic ALS, and implicates SERPINA1 in disease. Acta Neuropathol. 2017, 134, 715–728. [Google Scholar] [CrossRef]
- Gollin, P.A.; Kalaria, R.N.; Eikelenboom, P.; Rozemuller, A.; Perry, G. Alpha 1-antitrypsin and alpha 1-antichymotrypsin are in the lesions of Alzheimer’s disease. Neuroreport 1992, 3, 201–203. [Google Scholar] [CrossRef]
- Abu-Rumeileh, S.; Halbgebauer, S.; Steinacker, P.; Anderl-Straub, S.; Polischi, B.; Ludolph, A.C.; Capellari, S.; Parchi, P.; Otto, M. CSF SerpinA1 in Creutzfeldt-Jakob disease and frontotemporal lobar degeneration. Ann. Clin. Transl. Neurol. 2020, 7, 191–199. [Google Scholar] [CrossRef]
- Zattoni, M.; Mearelli, M.; Vanni, S.; Colini Baldeschi, A.; Tran, T.H.; Ferracin, C.; Catania, M.; Moda, F.; Di Fede, G.; Giaccone, G.; et al. Serpin Signatures in Prion and Alzheimer’s Diseases. Mol. Neurobiol. 2022, 59, 3778–3799. [Google Scholar] [CrossRef]
- Fissolo, N.; Matute-Blanch, C.; Osman, M.; Costa, C.; Pinteac, R.; Miro, B.; Sanchez, A.; Brito, V.; Dujmovic, I.; Voortman, M.; et al. CSF SERPINA3 Levels Are Elevated in Patients With Progressive MS. Neurol. Neuroimmunol. Neuroinflamm. 2021, 8, e941. [Google Scholar] [CrossRef]
- Vizcaino, J.A.; Csordas, A.; del-Toro, N.; Dianes, J.A.; Griss, J.; Lavidas, I.; Mayer, G.; Perez-Riverol, Y.; Reisinger, F.; Ternent, T.; et al. 2016 update of the PRIDE database and its related tools. Nucleic Acids Res. 2016, 44, D447–D456. [Google Scholar] [CrossRef]


Disclaimer/Publisher’s Note: The statements, opinions and data contained in all publications are solely those of the individual author(s) and contributor(s) and not of MDPI and/or the editor(s). MDPI and/or the editor(s) disclaim responsibility for any injury to people or property resulting from any ideas, methods, instructions or products referred to in the content. |
© 2023 by the authors. Licensee MDPI, Basel, Switzerland. This article is an open access article distributed under the terms and conditions of the Creative Commons Attribution (CC BY) license (https://creativecommons.org/licenses/by/4.0/).