Abstract
Serotonin signaling plays an important role in regulating development and functions of the placenta. We hypothesized that metabolic disturbances associated with maternal obesity and/or gestational diabetes mellitus (GDM) affect placental serotonin homeostasis. Therefore, we examined the effects of high glucose (25 mM) and insulin (10 nM)—two hallmarks of maternal obesity and GDM—on mRNA expression of key regulators of serotonin homeostasis, including serotonin transporter (SERT), tryptophan hydroxylase 1 (TPH1), and monoamine oxidase A (MAOA), in the first-trimester trophoblast cell line ACH-3P, focusing on oxygen levels characteristic of early human placental development. Glucose downregulated expression of SERT and MAOA independently of oxygen level and upregulated expression of TPH1 at 6.5% oxygen but not at 2.5% oxygen. Compared to 6.5% oxygen, 2.5% oxygen upregulated SERT and downregulated TPH1 expression, with no effect on MAOA expression. Insulin upregulated SERT only at 2.5% oxygen but had no effect on TPH1 and MAOA expression. These results suggest that maternal metabolic alterations in early pregnancy may be a driving force for changes in placental serotonin homeostasis.
1. Introduction
Serotonin (5-hydroxytryptamine, 5-HT) is a biogenic monoamine that plays a key role in regulating a wide range of physiological functions [1]. Disturbed serotonin homeostasis has been implicated in the pathogenesis of many complex diseases, including metabolic disorders such as obesity [2]. During pregnancy, serotonin plays a role in regulating maternal pancreatic beta-cell mass [3] and insulin secretion [4]. These physiological mechanisms, if dysfunctional, can contribute to the development of gestational diabetes mellitus (GDM).
Maternal obesity and GDM are characterized by a spectrum of metabolic, endocrine, inflammatory, and oxidative stress abnormalities, as evidenced by changes in the levels of the respective markers in blood plasma and extracellular fluids of different organs, including the placenta [5]. GDM, which is defined as glucose tolerance impairment first recognized during pregnancy [6], is primarily characterized by maternal hyperglycemia. In fact, GDM is the most common cause of hyperglycemia during pregnancy. Maternal obesity, on the other hand, is often associated with hyperinsulinemia [7]. Both hyperglycemia and hyperinsulinemia have been independently linked to impaired development of the placenta during early pregnancy, such as reduced trophoblast proliferation [8] or increased placental growth [9]. Furthermore, both GDM [10] and obesity [11] have been associated with placental hypoxia, which can negatively impact the development and function of the placenta, further contributing to adverse pregnancy outcomes [8,10].
The placenta is a fetal organ that begins to develop within the first few days after conception and continues to grow rapidly until the end of the first trimester/beginning of the second trimester of the pregnancy [12]. During this period, the placenta is also exposed to a progressive increase in oxygen tension from severely hypoxic (2–3% O2) to physiologically normoxic (about 6–10% O2) levels [13]. This change, which occurs due to the establishment of the blood flow in the intervillous space, is associated with increased shear and oxidative stress and induces cellular signals crucial for the placental function [14,15]. During this critical period of development, the placenta is most vulnerable to changes and disturbances in its surroundings [16]. Trophoblasts, which include villous cytotrophoblasts and the syncytiotrophoblast, are in direct contact with maternal blood and are therefore most susceptible to maternal influences. The placenta is capable of adapting to changes in the maternal environment, particularly in response to altered maternal metabolism, in order to protect the developing embryo/fetus from potential harm [17]. However, if the adaptive capacity of the placenta is overwhelmed, the altered maternal environment can lead to adverse outcomes for fetal growth and development, as well as for the long-term health of the child.
In addition to various other physiological processes, serotonin contributes to regulating placental development and function [18]. Specifically, studies in experimental models of the human placenta have shown that the placental serotonin system is involved in molecular pathways that regulate cellular processes such as trophoblast proliferation, differentiation, and survival [19], as well as placental-umbilical blood flow [20] and endocrine functions of the placenta [21]. In addition, studies in animal models have implicated the placental serotonin system in the regulation of embryonic/fetal development, particularly neurodevelopment [22,23], as well as in nutrient transport across the placenta [24]. Accordingly, altered homeostasis of the placental serotonin system has been associated with placental structure abnormalities and neurobehavioral changes in the offspring [25].
The human placenta expresses several classes of proteins involved in the regulation of serotonin signaling, including transmembrane carriers, metabolic enzymes, and receptors for serotonin [18]. Of these, serotonin transporter (SERT; high-affinity serotonin transmembrane carrier), tryptophan hydroxylase 1 (TPH1; synthetic enzyme for serotonin), and monoamine oxidase A (MAOA; catabolic enzyme for serotonin) are key contributors for maintaining optimal serotonin levels and regulating placental serotonin activity.
Despite the demonstrated role of the placental serotonin system in mechanisms regulating developmental processes and placental functions, very little is known about the potential impact of GDM and maternal obesity on placental serotonin homeostasis. Therefore, the aim of this study was to investigate possible effects of the main components of the GDM/obesity-associated environment, i.e., increased glucose and insulin concentrations, on the expression of genes encoding key regulators of serotonin levels, namely SERT, TPH1 and MAOA. For that purpose, we used an established cell model of human first-trimester trophoblasts (ACH-3P) [26] and performed the experiments under the oxygen levels characteristic of the early placental environment (2.5% and 6.5% O2).
2. Materials and Methods
2.1. Cell Culture
All experiments were performed with the human first-trimester trophoblast cell line ACH-3P, established by fusion of human primary first-trimester trophoblasts (12th week of gestation) and the human choriocarcinoma cell line AC1-1. They have been thoroughly characterized in our laboratory at the Department of Obstetrics and Gynecology, Medical University of Graz, Graz, Austria, as previously described [26]. Cells were cultured in 75 cm2 flasks in Dulbecco’s modified Eagle’s medium (DMEM) containing low D-glucose and sodium pyruvate, or Ham’s F-12 medium, both containing L-glutamine (all from Thermo Fisher Scientific Inc., Foster City, CA, USA) and supplemented with 10% fetal bovine serum (FBS, GE Healthcare Life Science, Chicago, IL, USA) and 1% penicillin/streptomycin (Thermo Fisher Scientific Inc., Foster City, CA, USA). The cells were kept at 37 °C, in a humidified atmosphere containing 5% CO2 and 21% O2 in a standard cell culture incubator, or 5% CO2 and 2.5% or 6.5% O2 in the XVIVO incubation system (BioSpherix, Ltd., Parish, NY, USA).
2.2. Glucose and Insulin Treatments
For glucose and insulin treatment experiments, ACH-3P cells were seeded on 6-well plates and cultured under low-serum conditions (2% FBS). This approach aimed to provide more controlled and standardized experimental conditions by mitigating potential interference from insulin, glucose, and serotonin present in serum. The time points for treatments were selected based on published studies on the effects of glucose and insulin in trophoblast cellular models [27,28] and the results of our preliminary experiments.
For the glucose treatment experiments, the ACH-3P cells were cultured for 4 days prior to treatment under low-serum conditions (2% FBS) in DMEM at 37 °C in a humidified atmosphere containing 5% CO2 and 2.5%, 6.5% or 21% O2. The cells were then incubated for 24 h or 72 h in DMEM containing D-glucose at a concentration of 5.5 mmol/L (control, normoglycemia) or 25 mmol/L (hyperglycemia). For osmotic control, 19.5 mmol/L L-glucose (Sigma-Aldrich, St. Louis, MO, USA) was added to DMEM containing 5.5 mmol/L D-glucose. Glucose concentrations used to mimic normoglycemia and hyperglycemia are common in studies on the role of diabetic glucose levels in different cellular models (e.g., [29]) and were also used in our previous studies with the ACH-3P cell line [8].
For the insulin treatment experiments, the ACH-3P cells were cultured for 2 days before treatment under low-serum conditions (2% FBS) in Ham’s F-12 medium, and subsequently incubated in the absence (control) or presence of 10 nM insulin (Calbiochem, EMD Chemicals, San Diego, CA, USA) at 2.5% and 6.5% O2 for 24 and 48 h. Insulin concentration was chosen based on our previous dose-response experiments on ACH-3P cells, showing that the respective concentration mimicked hyperinsulinemia in our experimental setup [27]. This concentration also corresponds to the physiologically relevant postprandial concentration of insulin [30].
2.3. RNA Extraction and Gene Expression Analysis
Total RNA from ACH-3P cells was extracted using the AllPrep DNA/RNA/miRNA Universal Kit (Qiagen, Hilden, Germany) according to the manufacturer’s protocol, including an optional on-column DNase treatment step. RNA was reverse-transcribed using the LunaScript RT SuperMix Kit (New England BioLabs, Ipswich, MA, USA) following the manufacturer’s instructions.
Real-time quantitative PCR (RT-qPCR) assays were performed on the CFX384 Touch Real-Time PCR Detection System (Bio-Rad Laboratories, Hercules, CA, USA) using the SsoAdvanced Universal SYBR Green Supermix (Bio-Rad Laboratories, Hercules, CA, USA), according to the manufacturer’s recommendations. qPCR reactions for the genes of interest were prepared with 40 ng of cDNA, while the reactions for the reference genes included 10 ng cDNA per reaction. Primer sequences (Table A1) were obtained from the literature [31,32,33,34,35] and purchased from Metabion (Planegg, Germany). RT-qPCR assays were run in duplicate or triplicate. Specificity of qPCR amplicons was verified by melting curve analysis. The stability of genes analyzed was evaluated using the RefFinder [36]. Among three potential reference genes tested (listed in Table A1), tyrosine 3-monooxygenase/tryptophan 5-monooxygenase activation protein zeta (YWHAZ) was the most stable one and was, therefore, used for normalization. Relative expression levels were calculated using the comparative Cq (ΔΔCq) method.
2.4. Analysis of SERT Methylation by Bisulfite Pyrosequencing
We additionally examined whether high glucose affects methylation of CpG sites in regulatory regions of SERT, as suggested by our previous clinical study [37]. DNA methylation was quantified at 9 CpG sites in the promoter and 14 CpG sites in intron 1 of SERT (Table A2) by bisulfite pyrosequencing. Cellular DNA was isolated from ACH-3P cells using AllPrep DNA/RNA/miRNA Universal Kit (Qiagen, Hilden, Germany) according to the manufacturer’s protocol. Bisulfite conversion was performed with 800 ng DNA per sample, using the EZ DNA Methylation-Gold Kit (Zymo Research, Irvine, CA, USA). Regions of interest were amplified using PyroMark PCR Kit (Qiagen, Hilden, Germany), and pyrosequencing was conducted on the PyroMark Q24 Advanced Pyrosequencing System with PyroMark Q24 Advanced CpG Reagents (both from Qiagen, Hilden, Germany), all following the manufactures’ recommendations. Primers used in the analysis are listed in Table A3. All assays included a negative control and a reference sample. Pyrosequencing quality control was performed using PyroMark Q24 Advanced Software (version 3.0.0, Qiagen, Hilden, Germany). The methylation levels of the CpG sites in each region were positively correlated, so the average methylation for the promoter and intron 1 region was used in the analyses.
2.5. Statistics
Statistical analyses were performed with GraphPad Prism 8 (GraphPad Software Inc., San Diego, CA, USA) and IBM SPSS Statistics 23.0 for Windows (SPSS Statistics, Chicago, IL, USA). Normal distribution of data was tested using the D’Agostino–Pearson normality test. Data were transformed using reciprocal square root (glucose experiment) or square root (insulin experiment) to achieve a normal distribution for statistical analysis and re-transformed for the presentation of the results. Outliers were screened for using the robust regression and outlier removal (ROUT) method with maximum false discovery rate (Q) set to 1% [37].
Analysis of covariance (ANCOVA) with passage number included as a covariate was performed to determine the effect of glucose/insulin treatment and oxygen level and their interactions. Sidak’s post hoc test was used to adjust for multiple comparisons. When there was a significant interaction, a subsequent ANCOVA was conducted for comparisons between groups; p < 0.05 was considered statistically significant.
3. Results
3.1. Effect of Glucose on the Expression of Serotonin-Regulating Genes
Expression levels of SERT, TPH1, and MAOA mRNAs were compared between ACH-3P cells incubated (for 24 or 72 h) in the presence of 25 mM D-glucose (hyperglycemia) and (1) 5.5 mM D-glucose supplemented with 19.5 mM L-glucose (osmotic control; Figure 1) or (2) 5.5 mM D-glucose (control; Figure A1 in Appendix A). Both comparisons, using ANCOVA adjusted for cell passage, yielded similar results as described below.
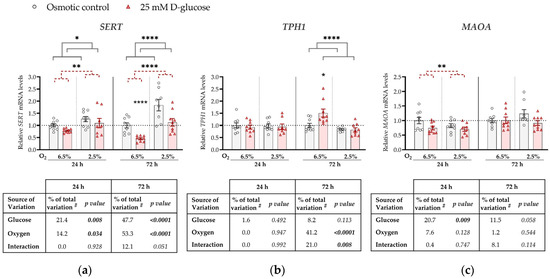
Figure 1.
Effect of glucose and oxygen on mRNA expression of serotonin-regulating genes in ACH-3P cells. Cells were cultured in the presence of 5.5 mM D-glucose + 19.5 mM L-glucose (osmotic control, grey bars) or 25 mM D-glucose (hyperglycemia, red bars), at 6.5% O2 or 2.5% O2 for 24 h or 72 h. Relative mRNA expression levels of (a) SERT, (b) TPH1 and (c) MAOA were determined by RT-qPCR and normalized to YWHAZ mRNA level. Results of three independent experiments, each run in triplicate, are shown. For each gene, data at each time point are presented relative to the mean of the osmotic control at 6.5% O2, which was arbitrarily set to 1.0; bars represent mean ± SEM. Statistical analysis used ANCOVA with cell passage as covariate and Sidak’s post hoc test to adjust for multiple comparisons. * p < 0.05, ** p < 0.01, **** p < 0.0001, red dashed line—main effect of glucose, gray line—main effect of oxygen. # proportion of total variance after controlling for the effect of the cell passage (partial η2).
Specifically, at both time points, SERT expression was significantly downregulated by the high glucose concentration (p = 0.008 and p < 0.0001, respectively) and upregulated by low oxygen level (2.5% O2) (p = 0.034 and p < 0.0001, respectively; Figure 1a). At 72 h, we observed a borderline significant (p = 0.051) interaction between glucose and oxygen on SERT expression. This trend might be driven by the more pronounced decrease in SERT expression by high glucose at 6.5% O2 (by 50%, p < 0.0001) than at 2.5% O2 (p = 0.186).
TPH1 expression was not significantly affected at 24 h by either high glucose levels or low oxygen tension, nor did they significantly interact (Figure 1b). However, at 72 h, TPH1 expression was downregulated by low oxygen tension (p < 0.0001). In addition, we observed a significant interaction between oxygen and glucose on TPH1 expression at 72 h (p = 0.008). At this time point, high glucose increased TPH1 expression at 6.5% O2 (by 17%, p = 0.019), while it had no effect at 2.5% O2.
MAOA expression was downregulated by high glucose concentrations, independently of oxygen, at 24 h (by 20%, p = 0.009; Figure 1c), while the effect of glucose was not significant at 72 h. While we observed an effect of oxygen on both SERT and TPH1 expression, no effect of oxygen on MAOA expression was detected at either 24 h or 72 h.
3.2. Effect of Insulin on the Expression of Serotonin-Regulating Genes
To investigate the effect of insulin on mRNA expression of SERT, TPH1 and MAOA, ACH-3P cells were cultured in the absence (control) or presence of 10 nM insulin (hyperinsulinemia) in conditions of 6.5% O2 or 2.5% O2, for 24 or 48 h (Figure 2).
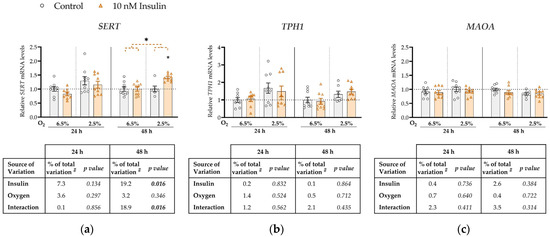
Figure 2.
Effect of insulin and oxygen on mRNA expression of serotonin-regulating genes in ACH-3P cells. Cells were cultured in the absence (control, grey bars) or presence of 10 nM insulin (hyperinsulinemia, orange bars) at 6.5% O2 or 2.5% O2 for 24 h or 48 h. Relative mRNA expression levels of (a) SERT, (b) TPH1 and (c) MAOA were determined by RT-qPCR and normalized to YWHAZ mRNA level. Results of three independent experiments, each done in duplicate or triplicate, are shown. For each gene, data are presented relative to the mean of the control sample at 6.5% O2, which was arbitrarily set to 1.0; bars represent mean ± SEM. Statistical analysis used ANCOVA with cell passage as covariate and Sidak’s test to adjust for multiple comparisons. * p < 0.05, orange dashed line—main effect of insulin. # proportion of total variance after controlling for the effect of the cell passage (partial η2).
SERT expression was not significantly affected by either insulin, oxygen or their interaction at 24 h (Figure 2a). However, at 48 h we observed a significant main effect of insulin on SERT mRNA levels (increase by 19%, p = 0.016). Furthermore, at 48 h there was a significant interaction between insulin and oxygen (p = 0.016; Figure 2a) such that insulin concentration significantly increased SERT expression only at 2.5% O2 (by 8%, p = 0.011). Neither oxygen, insulin, or their interaction had any effect on TPH1 (Figure 2b) or MAOA (Figure 2c) expression at either 24 h or 48 h.
4. Discussion
This is the first study on the effects of glucose, insulin and oxygen, and their interaction, on expression levels of the key serotonin-regulating genes SERT, TPH1 and MAOA using an established cellular model of first-trimester trophoblasts with emphasis on oxygen levels that are characteristic of early human placental development.
Our findings show that high glucose downregulates SERT expression (Figure 1a), while low oxygen (Figure 1a) or high insulin (Figure 2a) upregulate its expression. The downregulation of SERT expression by high glucose was evident at both oxygen levels, as evidenced by the statistically significant main effect of oxygen, although at a later time point, it might be more pronounced at 6.5% O2, as suggested by borderline significant interaction (p = 0.051) and results of the post hoc test. On the other hand, insulin upregulated SERT expression only at 2.5% O2. This suggests that early in pregnancy the trophoblast is already sensitive to maternal metabolic changes.
A previous study investigated the effect of high glucose on the function of SERT in the Caco-2 cell line derived from human colon adenocarcinoma [38]. Consistent with our results in ACH-3P cells, short-term exposure to high glucose (30–40 mM) decreased SERT-mediated serotonin uptake in Caco-2 cells [38]. However, long-term exposure (21–24 weeks) of Caco-2 cells to high glucose (30 mM) increased SERT-mediated serotonin uptake in Caco-2 cells [38]. This result is consistent with our previous clinical study, in which we found a positive correlation between the expression of SERT in human term placental tissue and glucose concentration in maternal fasting plasma during the second trimester of pregnancy [39]. Taken together, these findings suggest that the effects of high glucose on SERT expression depends on the duration of exposure, with short-term exposure resulting in downregulation and long-term exposure resulting in upregulation.
Insulin has been reported to regulate SERT trafficking from the endoplasmic reticulum to the cell membrane, but to have no effect on SERT mRNA expression in primary human trophoblasts at the end of pregnancy [40]. The respective expression results, obtained after 24 h of treatment at atmospheric oxygen tension (21%), are in agreement with our results showing no effect of insulin on SERT expression at the same time point regardless of oxygen tension. However, our results differed when treatment duration was extended to 48 h, when insulin increased SERT expression at 2.5% oxygen but had no effect at 6.5% oxygen. Accordingly, both duration of insulin exposure and oxygen tension clearly play a role in determining the effect of insulin on SERT expression. An additional possible explanation for the discrepancy between our results and those on primary term trophoblasts [40] is that the effect of insulin on SERT expression may vary depending on the period of pregnancy. In line with our finding of increased SERT expression at the 2.5% compared to the 6.5% oxygen level, SERT expression in the BeWo placental cell line was increased at 3% compared to 8% oxygen [41]. Hypoxia also increased SERT expression in pulmonary vascular smooth muscle cells [42]. In contrast, SERT expression in term placental explants was not affected by oxygen levels [41]. Importantly, placental explants were cultured at controlled oxygen levels for 24 h [41], whereas in our glucose treatment experiment, culture at controlled oxygen levels lasted for 5 or 7 days (including the pre-treatment period), which may have contributed to the different results. Potential mechanisms underlying sensitivity of the human SERT gene to oxygen tension may be explained by its promoter harboring motifs for binding of oxygen-sensitive transcription factors, e.g., hypoxia-inducible factor AP-1 [42,43].
In contrast to SERT, TPH1 expression was increased by glucose treatment under conditions of 6.5% O2 (Figure 1b). While there are no studies examining the effects of glucose on TPH1 expression in placental cellular models, high glucose profoundly induced Tph1 expression in rat pancreatic islets, both in vitro and in vivo [44]. That study implicated the role of TPH1 enzyme in glucose-induced potentiation of β-cell function [44].
A previous study found TPH1 expression to be upregulated by hypoxia in human pulmonary endothelial cells [45]. This result is in line with the finding that the murine Tph1 promoter contains hypoxia-responsive elements (HRE) and a binding site for hypoxia-inducible factor AP-1 [45]. However, in our experiments, TPH1 expression was decreased at 2.5% oxygen compared to 6.5% oxygen (Figure 1b). This suggests that the low-oxygen placental environment in early human pregnancy regulates TPH1 expression by a mechanism different from the hypoxia-inducible response, i.e., that an alternative mechanism dominates over the hypoxia-inducible response at relatively subtle oxygen changes from 6.5% to 2.5%. Considering that the expression of SERT, which encodes a protein accounting for serotonin uptake into cells, increases at 2.5% compared to 6.5% oxygen, a possible mechanism responsible for the downregulation of the serotonin-synthesizing enzyme TPH1 under such conditions could involve feedback regulation by increased intracellular serotonin levels. This speculation remains to be tested.
Like SERT, MAOA expression in ACH-3P cells was also downregulated in the presence of high glucose (Figure 1c). Outside pregnancy, short-term exposure to high glucose upregulates MAOA expression in the vascular rings of mammary arteries [46]. In addition to different experimental models, these effects were observed at ambient, i.e., 21%, oxygen levels, and cannot be directly compared to our results obtained at low oxygen levels.
Our results showed that MAOA expression was not affected by oxygen (Figure 1c). Based on the observations made on term placental tissues from pregnancies complicated by pre-eclampsia, a condition characterized by severe placental hypoxia, oxygen may affect the activity of placental MAOA rather than its expression [47,48]. Specifically, clinical studies found reduced MAOA activity [47,48], but no change in MAOA mRNA expression [47], in term placental tissue from pregnancies complicated with pre-eclampsia compared to normotensive pregnancies.
We showed no effect of insulin on MAOA (Figure 2b) or TPH1 (Figure 2c) expression. To date, there are no studies on potential effects of insulin on MAOA or TPH1 expression in trophoblasts or other cell types.
Collectively, our findings on the opposing effects of glucose as well as of oxygen on SERT and TPH1 expression, together with the concordant effects of glucose on SERT and MAOA expression (summarized in Figure 3), may suggest possible (patho)physiological implications. Specifically, as a speculation, glucose-induced downregulation of SERT, which mediates serotonin uptake into cells and is abundant at the syncytiotrophoblast surface facing maternal blood [49,50], may lead to increased levels of serotonin in the extracellular space and consequently to hyperactivation of serotonin receptors. Depending on receptor location, this may cause vasoactive effects on the maternal blood vessels or alter trophoblast proliferation, differentiation or migration processes [18]. On the other hand, SERT upregulation by hyperinsulinemia and hypoxia could lead to increased intracellular levels of serotonin with potential implications for biological effects via serotonylation of intracellular proteins [51,52]. The only effect observed on MAOA was its downregulation by glucose. MAOA activity is a major source of reactive oxygen species (ROS) in cells [53]. As shown previously in a rat bladder tumor cell line, reduced ROS production by MAOA inhibition reduced expression of proteins involved in glucose transport, such as GLUT1 [54]. Hence, one may speculate that MAOA downregulation in response to high glucose is an adaptive mechanism to reduce oxidative stress and/or glucose transport through the placenta.
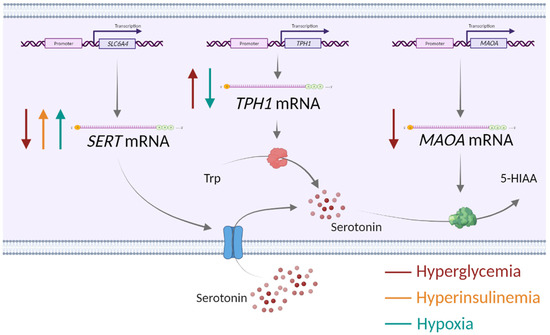
Figure 3.
Impact of alterations in the placental environment associated with obesity and gestational diabetes mellitus—hyperglycemia, hyperinsulinemia and low oxygen—on the expression of serotonin-regulating genes in human first-trimester trophoblasts. SERT—serotonin transporter, TPH1—tryptophan hydroxylase 1, MAOA—monoamine oxidase A, Trp—tryptophan, 5-HIAA—5-hydroxyindolacetic acid, ↑ upregulation, ↓ downregulation. Created with Biorender.com.
To further strengthen the significance of our results, we investigated the effect of hyperglycemia on the expression of SERT, TPH1 and MAOA genes at ambient (21%) oxygen levels (Figure 4). At ambient oxygen, high glucose had more profound effects on SERT, TPH1, and MAOA expression than at physiological oxygen levels, markedly increasing (by 1.5–2 times) expression of all three genes at 72 h (all p < 0.05). These results show that oxygen is clearly a major determinant of placental serotonin homeostasis to be considered in future in vitro studies.
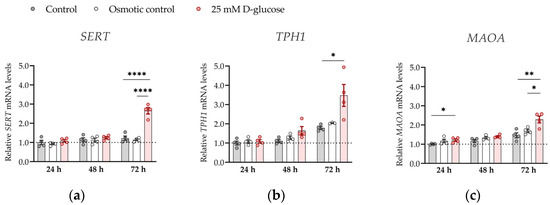
Figure 4.
Effect of glucose on mRNA expression of serotonin-regulating genes in conditions of 21% O2. ACH-3P cells were cultured in the presence of 5.5 mM D-glucose (control, gray bars), 5.5 mM D-glucose + 19.5 mM L-glucose (osmotic control, white bars) or 25 mM D-glucose (hyperglycemia, red bars) for 24 h, 48 or 72 h at ambient oxygen. Relative expression levels of (a) SERT, (b) TPH1 and (c) MAOA mRNA were determined by RT-qPCR and normalized to YWHAZ mRNA level. Results of two independent experiments, each done in duplicate, are shown. For each gene, data are presented relative to the mean of the control samples after 24 h, which was arbitrarily set to 1.00: bars represent mean ± SEM. Statistical analysis used ANCOVA with cell passage as covariate and Sidak’s post hoc test to adjust for multiple comparisons. * p < 0.05, ** p < 0.01 **** p < 0.0001.
While oxygen effects on SERT expression may be mediated by binding of oxygen-sensitive transcription factors, i.e., hypoxia-inducible factor AP-1, to the SERT promoter region [42,43], the molecular mechanisms by which glucose and insulin modulate expression of SERT are not known. In our previous clinical study on human term placental tissue, we found that maternal plasma glucose concentrations in the second trimester of pregnancy were negatively correlated with DNA methylation of the SERT promoter region, which in turn was negatively correlated with SERT expression [39]. This suggests that DNA methylation, an epigenetic mechanism sensitive to environmental cues [55], mediates the effect of long-term glucose exposure on SERT expression in the human placenta. To investigate whether the same mechanism also accounted for the effect of short-term glucose exposure on SERT expression in ACH-3P cells at the ambient oxygen level, where SERT expression was potently upregulated by glucose treatment for 72 h (Figure 4), we analyzed the methylation of the SERT promoter and intron 1 regions in representative cells. However, we did not detect any changes in DNA methylation between control and glucose-treated cells (Figure 5). This suggests that DNA methylation does not play a role in the effects of short-term glucose exposure on SERT expression in trophoblast cells.
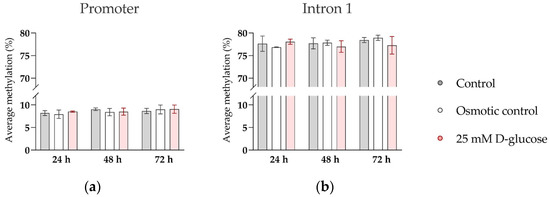
Figure 5.
Effect of glucose on DNA methylation of SERT promoter and intron 1 region in ACH-3P cells. Cells were cultured in the presence of 5.5 mM D-glucose (control, gray bars), 5.5 mM D-glucose + 19.5 mM L-glucose (osmotic control, white bars), or 25 mM D-glucose (hyperglycemia, red bars) for 24 h, 48 h, or 72 h, at ambient oxygen level. Average DNA methylation across (a) 9 CpG sites in the promoter region and (b) 14 CpG sites in the intron 1 region, determined by bisulfite pyrosequencing, is shown (Mean ± SEM; n = 3–4).
Importantly, the proliferation of ACH-3P cells [56] as well as of several other trophoblast cell lines [57] was shown to be affected by hyperosmolarity. Our results show similar effects of hyperglycemia when compared to either osmotic control (Figure 1) or normoglycemic control (Figure A1), suggesting that the expression of SERT, TPH1 and MAOA was directly affected by high glucose, and not elevated osmotic pressure. We have to point out that in our insulin treatment experiments, we have not observed a statistically significant effect of oxygen on the expression of any gene analyzed. This may be due to the different experimental set-up, mostly the shorter incubation time, i.e., 3 and 4 days in insulin treatment experiments compared to 5 and 7 days in glucose treatment experiments (including the pre-treatment periods).
Our study has several strengths. Firstly, while most studies of placental pathologies focus on term placentas, some of these pathologies originate due to placental dysfunction occurring in the early-pregnancy period. Thus, from a developmental standpoint, it is important to study early-pregnancy placentas using placental tissue or models. We chose to use first-trimester trophoblast-derived cell line ACH-3P, which is particularly suitable for in vitro experiments because it closely resembles primary human first-trimester trophoblasts, but compared to the primary trophoblasts, has proliferative properties [26]. It also expresses insulin receptors, essential for the present study [27].
Another advantage of our study is that we studied the effects of glucose and insulin in conditions of low oxygen tension, since early placental development takes place in a hypoxic environment [13], and SERT and TPH1 expression were shown to respond differently in physiological, pathological or ambient oxygen levels [42,45]. Lastly, cellular properties in cell culture are dependent on the number of cell passages [58]. This is why including cell passage number as a covariate in statistical analyses adds strength to the observed effects.
A weakness of our study is that we analyzed only mRNA levels and did not examine protein levels or function. However, it needs to be noted that previous clinical studies in human placental tissue have reported consistent results for SERT mRNA and SERT protein levels in GDM [59] and for MAOA mRNA and MAOA protein levels in pre-eclampsia [47]. Furthermore, we used only one cell line, which may limit generalizability of the findings. Due to ACH-3P cells representing a male cell line, caution is needed when interpreting the current data, as the placental response to the altered environment varies between male and female fetuses [5] and the serotonin system generally exhibits sex-specific differences [18].
Therefore, future research should include protein levels/activity and additional genes and cell lines for more in-depth studies on functional consequences of the observed effects. This would contribute to a more comprehensive understanding of serotonin regulation in early human pregnancy but was beyond the scope of the present study.
It also remains to be elucidated whether the changes in expression of serotonin-related genes affected by the GDM/obesity-like environment are an adaptive response of the placenta to protect the embryo/fetus, or are the consequence of placental inability to adapt to the environmental changes. The latter could lead to some of the adverse outcomes for fetal growth and development associated with GDM/obesity. In the case of placental maladaptation, serotonin-regulating components in the placenta could become a potential target for prevention of the negative consequences of GDM and maternal obesity for the health of the child.
In conclusion, the results suggest that metabolic alterations linked to GDM and/or maternal obesity (hyperglycemia and hyperinsulinemia), together with oxygen changes, may be a driving force for changes in placental serotonin homeostasis occurring in the first trimester of pregnancy.
Author Contributions
Conceptualization, J.Š. and G.D.; methodology, A.M.-M.; formal analysis, M.P.; investigation, M.P., M.H., I.B. and V.T.; resources, G.D. and J.Š.; writing—original draft preparation, M.P.; writing—review and editing, J.Š., G.D. and A.M.-M.; visualization, M.P.; supervision, J.Š., G.D. and A.M.-M.; project administration, J.Š. All authors have read and agreed to the published version of the manuscript.
Funding
This research was funded by the Croatian Science Foundation (grant number: IP 2018-01-6547, to J.Š.). M.P. is supported by the Croatian Science Foundation (grant number: DOK-2018-09-7794). G.D. and A.M.-M. are supported by funds of the Oesterreichische Nationalbank (Anniversary Fund, project number: 17950). M.P. and M.H. received mobility grants from Ruđer Bošković Institute, Zagreb.
Institutional Review Board Statement
Not applicable.
Informed Consent Statement
Not applicable.
Data Availability Statement
The data presented in the study are available from the corresponding author upon reasonable request.
Conflicts of Interest
The authors declare no conflict of interest. The funders had no role in the design of the study, in the collection, analyses, or interpretation of data, in the writing of the manuscript, or in the decision to publish the results.
Appendix A

Figure A1.
Effect of glucose and oxygen on mRNA expression of serotonin-regulating genes in ACH-3P cells. Cells were cultured in the absence (control, grey bars) or presence of 25 mM D-glucose (hyperglycemia, red bars) at 6.5% O2 or 2.5% O2 for 24 h or 72 h. Relative mRNA expression levels of (a) SERT, (b) TPH1 and (c) MAOA were determined by RT-qPCR and normalized to YWHAZ mRNA level. Results of three independent experiments, each done in triplicate, are shown. For each gene, data at each time point are presented relative to the mean of the control samples at 6.5% O2, which was arbitrarily set to 1.0; bars represent mean ± SEM. Statistical analysis used ANCOVA with cell passage as covariate and Sidak’s post hoc test to adjust for multiple comparisons. * p < 0.05, ** p < 0.01, *** p < 0.001, **** p < 0.0001, red dashed line—main effect of glucose, gray line—main effect of oxygen. # proportion of total variance after controlling for the effect of the cell passage (partial η2).

Appendix B

Table A1.
Sequences of gene-specific primers used in quantitative real-time PCR (RT-qPCR). f—forward, r—reverse.
Table A1.
Sequences of gene-specific primers used in quantitative real-time PCR (RT-qPCR). f—forward, r—reverse.
| Gene Symbol | Gene Name | Primer Sequence (5′–3′) | Amplicon (bp) | Source |
|---|---|---|---|---|
| SERT/ SLC6A4 | serotonin transporter | f: AGATCCTGAGACGCATTGCT r: AACAGAGCGAAACTCCGAAA | 504 | [33] |
| TPH1 | tryptophan hydroxylase 1 | f: TGCAAAGGAGAAGATGAGAGAATTTAC r: CTGGTTATGCTCTTGGTGTCTTTC | 114 | [33] |
| MAOA | monoamine oxidase A | f: GAGCGGCTACATGGAAGGG r: TCACCTTCCCGAGACCATTTA | 77 | [31] |
| YWHAZ | tyrosine 3-monooxygenase/tryptophan 5-monooxygenase activation protein zeta | f: CCGTTACTTGGCTGAGGTTG r: AGTTAAGGGCCAGACCCAGT | 143 | [32] |
| ACTB | actin beta | f: TCCCTGGAGAAGAGCTACG r: GTAGTTTCGTGG ATGCCACA | 131 | [34] |
| CK7 | cytokeratin 7 | f: CCGTGCGCTCTGCCTATGGGG r: GCTCCAGAAACCGCACCTTGTCGAT | 192 | [35] |
Table A2.
Sequences of gene-specific primers used in SERT (SLC6A4) gene methylation analyses. f—forward, r—reverse, s—sequencing.
Table A2.
Sequences of gene-specific primers used in SERT (SLC6A4) gene methylation analyses. f—forward, r—reverse, s—sequencing.
| Region | Primer Sequence (5′–3′) | Amplicon (bp) | Source |
|---|---|---|---|
| promoter | f *: GGTTTTTAGGAGAGTAGGGAGTATATAGTT r: AAAAATCCTAACTTTCCTACTCTTTAACTT s: AAACTACACAAAAAAACAAAT | 203 | [60] |
| intron 1 | f: GGGGAGGGGGATAGAAT r *: ACAACACTTTACTCAAAACCCTCTTTA s: GGGGAGGGGGATAGAAT | 273 | / |
| Intron 1 | f: TTTTAAAGAGGGTTTTGAGTAAAGTG r *: TTTATATCAACCAAAACTCTCCCTTTACAT s: GGGTTTTGAGTAAAGTGT | 150 | / |
* biotinylated primer.
Table A3.
Coordinates of the analyzed CpG sites in SERT (SLC6A4) gene.
Table A3.
Coordinates of the analyzed CpG sites in SERT (SLC6A4) gene.
| CpG Site | Location | GRCh38 Coordinates | NG_011747.2 Coordinates |
|---|---|---|---|
| 1 | promoter | 30236157 | 4780 |
| 2 | promoter | 30236142 | 4795 |
| 3 | promoter | 30236126 | 4811 |
| 4 | promoter | 30236121 | 4816 |
| 5 | promoter | 30236102 | 4835 |
| 6 | promoter | 30236091 | 4846 |
| 7 | promoter | 30236089 | 4848 |
| 8 | promoter | 30236084 | 4853 |
| 9 | promoter | 30236072 | 4865 |
| 10 | intron 1 | 30235532 | 5405 |
| 11 | intron 1 | 30235527 | 5410 |
| 12 | intron 1 | 30235519 | 5418 |
| 13 | intron 1 | 30235512 | 5425 |
| 14 | intron 1 | 30235504 | 5433 |
| 15 | intron 1 | 30235490 | 5447 |
| 16 | intron 1 | 30235482 | 5455 |
| 17 | intron 1 | 30235475 | 5462 |
| 18 | intron 1 | 30235472 | 5465 |
| 19 | intron 1 | 30235457 | 5480 |
| 20 | intron 1 | 30235272 | 5665 |
| 21 | intron 1 | 30235247 | 5690 |
| 22 | intron 1 | 30235203 | 5734 |
| 23 | intron 1 | 30235201 | 5736 |
References
- Berger, M.; Gray, J.A.; Roth, B.L. The Expanded Biology of Serotonin. Annu. Rev. Med. 2009, 60, 355–366. [Google Scholar] [CrossRef] [PubMed]
- van Galen, K.A.; Ter Horst, K.W.; Serlie, M.J. Serotonin, Food Intake, and Obesity. Obes. Rev. Off. J. Int. Assoc. Study Obes. 2021, 22, e13210. [Google Scholar] [CrossRef]
- Kim, H.; Toyofuku, Y.; Lynn, F.C.; Chak, E.; Uchida, T.; Mizukami, H.; Fujitani, Y.; Kawamori, R.; Miyatsuka, T.; Kosaka, Y.; et al. Serotonin Regulates Pancreatic β-Cell Mass during Pregnancy. Nat. Med. 2010, 16, 804–808. [Google Scholar] [CrossRef] [PubMed]
- Ohara-Imaizumi, M.; Kim, H.; Yoshida, M.; Fujiwara, T.; Aoyagi, K.; Toyofuku, Y.; Nakamichi, Y.; Nishiwaki, C.; Okamura, T.; Uchida, T.; et al. Serotonin Regulates Glucose-Stimulated Insulin Secretion from Pancreatic β Cells during Pregnancy. Proc. Natl. Acad. Sci. USA 2013, 110, 19420–19425. [Google Scholar] [CrossRef]
- McIntyre, H.D.; Catalano, P.; Zhang, C.; Desoye, G.; Mathiesen, E.R.; Damm, P. Gestational Diabetes Mellitus. Nat. Rev. Dis. Primer 2019, 5, 47. [Google Scholar] [CrossRef]
- Metzger, B.E.; Gabbe, S.G.; Persson, B.; Lowe, L.P.; Dyer, A.R.; Oats, J.J.N.; Buchanan, T.A. International Association of Diabetes and Pregnancy Study Groups Recommendations on the Diagnosis and Classification of Hyperglycemia in Pregnancy: Response to Weinert. Diabetes Care 2010, 33, e98. [Google Scholar] [CrossRef]
- Bandres-Meriz, J.; Dieberger, A.M.; Hoch, D.; Pöchlauer, C.; Bachbauer, M.; Glasner, A.; Niedrist, T.; van Poppel, M.N.M.; Desoye, G. Maternal Obesity Affects the Glucose-Insulin Axis During the First Trimester of Human Pregnancy. Front. Endocrinol. 2020, 11, 566673. [Google Scholar] [CrossRef] [PubMed]
- Fröhlich, J.D.; Huppertz, B.; Abuja, P.M.; König, J.; Desoye, G. Oxygen Modulates the Response of First-Trimester Trophoblasts to Hyperglycemia. Am. J. Pathol. 2012, 180, 153–164. [Google Scholar] [CrossRef]
- O’Tierney-Ginn, P.; Presley, L.; Myers, S.; Catalano, P. Placental Growth Response to Maternal Insulin in Early Pregnancy. J. Clin. Endocrinol. Metab. 2015, 100, 159–165. [Google Scholar] [CrossRef]
- Li, H.-P.; Chen, X.; Li, M.-Q. Gestational Diabetes Induces Chronic Hypoxia Stress and Excessive Inflammatory Response in Murine Placenta. Int. J. Clin. Exp. Pathol. 2013, 6, 650–659. [Google Scholar]
- Fernandez-Twinn, D.S.; Gascoin, G.; Musial, B.; Carr, S.; Duque-Guimaraes, D.; Blackmore, H.L.; Alfaradhi, M.Z.; Loche, E.; Sferruzzi-Perri, A.N.; Fowden, A.L.; et al. Exercise Rescues Obese Mothers’ Insulin Sensitivity, Placental Hypoxia and Male Offspring Insulin Sensitivity. Sci. Rep. 2017, 7, 44650. [Google Scholar] [CrossRef] [PubMed]
- Burton, G.J.; Fowden, A.L. The Placenta: A Multifaceted, Transient Organ. Philos. Trans. R. Soc. B Biol. Sci. 2015, 370, 20140066. [Google Scholar] [CrossRef] [PubMed]
- Rodesch, F.; Simon, P.; Donner, C.; Jauniaux, E. Oxygen Measurements in Endometrial and Trophoblastic Tissues during Early Pregnancy. Obstet. Gynecol. 1992, 80, 283–285. [Google Scholar] [PubMed]
- Jauniaux, E.; Watson, A.L.; Hempstock, J.; Bao, Y.-P.; Skepper, J.N.; Burton, G.J. Onset of Maternal Arterial Blood Flow and Placental Oxidative Stress: A Possible Factor in Human Early Pregnancy Failure. Am. J. Pathol. 2000, 157, 2111–2122. [Google Scholar] [CrossRef]
- Genbacev, O.; Joslin, R.; Damsky, C.H.; Polliotti, B.M.; Fisher, S.J. Hypoxia Alters Early Gestation Human Cytotrophoblast Differentiation/Invasion in Vitro and Models the Placental Defects That Occur in Preeclampsia. J. Clin. Investig. 1996, 97, 540–550. [Google Scholar] [CrossRef]
- Desoye, G. The Human Placenta in Diabetes and Obesity: Friend or Foe? The 2017 Norbert Freinkel Award Lecture. Diabetes Care 2018, 41, 1362–1369. [Google Scholar] [CrossRef] [PubMed]
- Desoye, G.; Wells, J.C.K. Pregnancies in Diabetes and Obesity: The Capacity-Load Model of Placental Adaptation. Diabetes 2021, 70, 823–830. [Google Scholar] [CrossRef]
- Perić, M.; Bečeheli, I.; Čičin-Šain, L.; Desoye, G.; Štefulj, J. Serotonin System in the Human Placenta—The Knowns and Unknowns. Front. Endocrinol. 2022, 13, 1061317. [Google Scholar] [CrossRef]
- Oufkir, T.; Arseneault, M.; Sanderson, J.T.; Vaillancourt, C. The 5-HT2A Serotonin Receptor Enhances Cell Viability, Affects Cell Cycle Progression and Activates MEK–ERK1/2 and JAK2–STAT3 Signalling Pathways in Human Choriocarcinoma Cell Lines. Placenta 2010, 31, 439–447. [Google Scholar] [CrossRef]
- Bertrand, C.; St-Louis, J. Reactivities to Serotonin and Histamine in Umbilical and Placental Vessels during the Third Trimester after Normotensive Pregnancies and Pregnancies Complicated by Preeclampsia. Am. J. Obstet. Gynecol. 1999, 180, 650–659. [Google Scholar] [CrossRef]
- Klempan, T.; Hudon-Thibeault, A.-A.; Oufkir, T.; Vaillancourt, C.; Sanderson, J.T. Stimulation of Serotonergic 5-HT2A Receptor Signaling Increases Placental Aromatase (CYP19) Activity and Expression in BeWo and JEG-3 Human Choriocarcinoma Cells. Placenta 2011, 32, 651–656. [Google Scholar] [CrossRef]
- Bonnin, A.; Levitt, P. Fetal, Maternal and Placental Sources of Serotonin and New Implications for Developmental Programming of the Brain. Neuroscience 2011, 197, 1–7. [Google Scholar] [CrossRef]
- Côté, F.; Fligny, C.; Bayard, E.; Launay, J.-M.; Gershon, M.D.; Mallet, J.; Vodjdani, G. Maternal Serotonin Is Crucial for Murine Embryonic Development. Proc. Natl. Acad. Sci. USA 2007, 104, 329–334. [Google Scholar] [CrossRef]
- Mao, J.; Kinkade, J.A.; Bivens, N.J.; Roberts, R.M.; Rosenfeld, C.S. Placental Changes in the Serotonin Transporter (Slc6a4) Knockout Mouse Suggest a Role for Serotonin in Controlling Nutrient Acquisition. Placenta 2021, 115, 158–168. [Google Scholar] [CrossRef] [PubMed]
- Rosenfeld, C.S. Placental Serotonin Signaling, Pregnancy Outcomes, and Regulation of Fetal Brain Development†. Biol. Reprod. 2020, 102, 532–538. [Google Scholar] [CrossRef] [PubMed]
- Hiden, U.; Wadsack, C.; Prutsch, N.; Gauster, M.; Weiss, U.; Frank, H.-G.; Schmitz, U.; Fast-Hirsch, C.; Hengstschläger, M.; Pötgens, A.; et al. The First Trimester Human Trophoblast Cell Line ACH-3P: A Novel Tool to Study Autocrine/Paracrine Regulatory Loops of Human Trophoblast Subpopulations—TNF-α Stimulates MMP15 Expression. BMC Dev. Biol. 2007, 7, 137. [Google Scholar] [CrossRef]
- Tandl, V.; Hoch, D.; Bandres-Meriz, J.; Nikodijevic, S.; Desoye, G.; Majali-Martinez, A. Different Regulation of IRE1α and EIF2α Pathways by Oxygen and Insulin in ACH-3P Trophoblast Model. Reproduction 2021, 162, 1–10. [Google Scholar] [CrossRef] [PubMed]
- Easton, Z.J.W.; Luo, X.; Li, L.; Regnault, T.R.H. The Impact of Hyperglycemia upon BeWo Trophoblast Cell Metabolic Function: A Multi-OMICS and Functional Metabolic Analysis. PLoS ONE 2023, 18, e0283118. [Google Scholar] [CrossRef]
- Wang, Z.; Wang, D.; Chen, J.; Long, T.; Zhong, C.; Li, Y. Effects of Glucose and Osmotic Pressure on the Proliferation and Cell Cycle of Human Chorionic Trophoblast Cells. Open Life Sci. 2022, 17, 1418–1428. [Google Scholar] [CrossRef]
- Song, S.H.; McIntyre, S.S.; Shah, H.; Veldhuis, J.D.; Hayes, P.C.; Butler, P.C. Direct Measurement of Pulsatile Insulin Secretion from the Portal Vein in Human Subjects. J. Clin. Endocrinol. Metab. 2000, 85, 4491–4499. [Google Scholar] [CrossRef]
- Sun, Y.; Zhang, J.; Yuan, Y.; Yu, X.; Shen, Y.; Xu, Q. Study of a Possible Role of the Monoamine Oxidase A (MAOA) Gene in Paranoid Schizophrenia among a Chinese Population. Am. J. Med. Genet. Part B Neuropsychiatr. Genet. Off. Publ. Int. Soc. Psychiatr. Genet. 2012, 159B, 104–111. [Google Scholar] [CrossRef] [PubMed]
- Baumann, M.; Körner, M.; Huang, X.; Wenger, F.; Surbek, D.; Albrecht, C. Placental ABCA1 and ABCG1 Expression in Gestational Disease: Pre-Eclampsia Affects ABCA1 Levels in Syncytiotrophoblasts. Placenta 2013, 34, 1079–1086. [Google Scholar] [CrossRef] [PubMed]
- Van Lelyveld, N.; Ter Linde, J.; Schipper, M.E.I.; Samsom, M. Regional Differences in Expression of TPH-1, SERT, 5-HT3 and 5-HT4 Receptors in the Human Stomach and Duodenum. Neurogastroenterol. Motil. 2007, 19, 342–348. [Google Scholar] [CrossRef]
- Métayé, T.; Menet, E.; Guilhot, J.; Kraimps, J.-L. Expression and Activity of g Protein-Coupled Receptor Kinases in Differentiated Thyroid Carcinoma. J. Clin. Endocrinol. Metab. 2002, 87, 3279–3286. [Google Scholar] [CrossRef] [PubMed]
- Barrett, H.L.; Kubala, M.H.; Romero, K.S.; Denny, K.J.; Woodruff, T.M.; McIntyre, H.D.; Callaway, L.K.; Nitert, M.D. Placental Lipases in Pregnancies Complicated by Gestational Diabetes Mellitus (GDM). PLoS ONE 2014, 9, e104826. [Google Scholar] [CrossRef] [PubMed]
- Xie, F.; Xiao, P.; Chen, D.; Xu, L.; Zhang, B. MiRDeepFinder: A MiRNA Analysis Tool for Deep Sequencing of Plant Small RNAs. Plant Mol. Biol. 2012, 80, 75–84. [Google Scholar] [CrossRef]
- Blazevic, S.; Horvaticek, M.; Kesic, M.; Zill, P.; Hranilovic, D.; Ivanisevic, M.; Desoye, G.; Stefulj, J. Epigenetic Adaptation of the Placental Serotonin Transporter Gene (SLC6A4) to Gestational Diabetes Mellitus. PLoS ONE 2017, 12, e0179934. [Google Scholar] [CrossRef]
- Motulsky, H.J.; Brown, R.E. Detecting Outliers When Fitting Data with Nonlinear Regression—A New Method Based on Robust Nonlinear Regression and the False Discovery Rate. BMC Bioinform. 2006, 7, 123. [Google Scholar] [CrossRef]
- Gonçalves, P.; Araújo, J.R.; Martel, F. The Effect of High Glucose on SERT, the Human Plasmalemmal Serotonin Transporter. Nutr. Neurosci. 2008, 11, 244–250. [Google Scholar] [CrossRef]
- Li, Y.; Hadden, C.; Singh, P.; Mercado, C.P.; Murphy, P.; Dajani, N.K.; Lowery, C.L.; Roberts, D.J.; Maroteaux, L.; Kilic, F. GDM-Associated Insulin Deficiency Hinders the Dissociation of SERT from ERp44 and down-Regulates Placental 5-HT Uptake. Proc. Natl. Acad. Sci. USA 2014, 111, E5697–E5705. [Google Scholar] [CrossRef]
- Gorczyca, L.; Du, J.; Bircsak, K.M.; Wen, X.; Vetrano, A.M.; Aleksunes, L.M. Low Oxygen Tension Differentially Regulates the Expression of Placental Solute Carriers and ABC Transporters. FEBS Lett. 2021, 595, 811–827. [Google Scholar] [CrossRef] [PubMed]
- Eddahibi, S.; Fabre, V.; Boni, C.; Martres, M.P.; Raffestin, B.; Hamon, M.; Adnot, S. Induction of Serotonin Transporter by Hypoxia in Pulmonary Vascular Smooth Muscle Cells. Circ. Res. 1999, 84, 329–336. [Google Scholar] [CrossRef] [PubMed]
- Bengel, D.; Heils, A.; Petri, S.; Seemann, M.; Glatz, K.; Andrews, A.; Murphy, D.L.; Lesch, K.P. Gene Structure and 5’-Flanking Regulatory Region of the Murine Serotonin Transporter. Brain Res. Mol. Brain Res. 1997, 44, 286–292. [Google Scholar] [CrossRef] [PubMed]
- Zhang, Y.; Deng, R.; Yang, X.; Xu, W.; Liu, Y.; Li, F.; Zhang, J.; Tang, H.; Ji, X.; Bi, Y.; et al. Glucose Potentiates β-Cell Function by Inducing Tph1 Expression in Rat Islets. FASEB J. Off. Publ. Fed. Am. Soc. Exp. Biol. 2017, 31, 5342–5355. [Google Scholar] [CrossRef]
- Ciuclan, L.; Hussey, M.J.; Burton, V.; Good, R.; Duggan, N.; Beach, S.; Jones, P.; Fox, R.; Clay, I.; Bonneau, O.; et al. Imatinib Attenuates Hypoxia-Induced Pulmonary Arterial Hypertension Pathology via Reduction in 5-Hydroxytryptamine through Inhibition of Tryptophan Hydroxylase 1 Expression. Am. J. Respir. Crit. Care Med. 2013, 187, 78–89. [Google Scholar] [CrossRef]
- Lascu, A.; Ionică, L.N.; Buriman, D.G.; Merce, A.P.; Deaconu, L.; Borza, C.; Crețu, O.M.; Sturza, A.; Muntean, D.M.; Feier, H.B. Metformin and Empagliflozin Modulate Monoamine Oxidase-Related Oxidative Stress and Improve Vascular Function in Human Mammary Arteries. Mol. Cell. Biochem. 2022. [Google Scholar] [CrossRef]
- Sivasubramaniam, S.D.; Finch, C.C.; Billett, M.A.; Baker, P.N.; Billett, E.E. Monoamine Oxidase Expression and Activity in Human Placentae from Pre-Eclamptic and Normotensive Pregnancies. Placenta 2002, 23, 163–171. [Google Scholar] [CrossRef]
- Carrasco, G.; Cruz, M.A.; Dominguez, A.; Gallardo, V.; Miguel, P.; González, C. The Expression and Activity of Monoamine Oxidase A, but Not of the Serotonin Transporter, Is Decreased in Human Placenta from Pre-Eclamptic Pregnancies. Life Sci. 2000, 67, 2961–2969. [Google Scholar] [CrossRef]
- Balkovetz, D.F.; Tiruppathi, C.; Leibach, F.H.; Mahesh, V.B.; Ganapathy, V. Evidence for an Imipramine-Sensitive Serotonin Transporter in Human Placental Brush-Border Membranes. J. Biol. Chem. 1989, 264, 2195–2198. [Google Scholar] [CrossRef]
- Karahoda, R.; Horackova, H.; Kastner, P.; Matthios, A.; Cerveny, L.; Kucera, R.; Kacerovsky, M.; Duintjer Tebbens, J.; Bonnin, A.; Abad, C.; et al. Serotonin Homeostasis in the Materno-Foetal Interface at Term: Role of Transporters (SERT/SLC6A4 and OCT3/SLC22A3) and Monoamine Oxidase A (MAO-A) in Uptake and Degradation of Serotonin by Human and Rat Term Placenta. Acta Physiol. 2020, 229, e13478. [Google Scholar] [CrossRef]
- Paulmann, N.; Grohmann, M.; Voigt, J.P.; Bert, B.; Vowinckel, J.; Bader, M.; Skelin, M.; Jevšek, M.; Fink, H.; Rupnik, M.; et al. Intracellular Serotonin Modulates Insulin Secretion from Pancreatic β-Cells by Protein Serotonylation. PLoS Biol. 2009, 7, e1000229. [Google Scholar] [CrossRef]
- Farrelly, L.A.; Thompson, R.E.; Zhao, S.; Lepack, A.E.; Lyu, Y.; Bhanu, N.V.; Zhang, B.; Loh, Y.-H.E.; Ramakrishnan, A.; Vadodaria, K.C.; et al. Histone Serotonylation Is a Permissive Modification That Enhances TFIID Binding to H3K4me3. Nature 2019, 567, 535–539. [Google Scholar] [CrossRef] [PubMed]
- Maggiorani, D.; Manzella, N.; Edmondson, D.E.; Mattevi, A.; Parini, A.; Binda, C.; Mialet-Perez, J. Monoamine Oxidases, Oxidative Stress, and Altered Mitochondrial Dynamics in Cardiac Ageing. Oxid. Med. Cell. Longev. 2017, 2017, 3017947. [Google Scholar] [CrossRef] [PubMed]
- Resta, J.; Santin, Y.; Roumiguié, M.; Riant, E.; Lucas, A.; Couderc, B.; Binda, C.; Lluel, P.; Parini, A.; Mialet-Perez, J. Monoamine Oxidase Inhibitors Prevent Glucose-Dependent Energy Production, Proliferation and Migration of Bladder Carcinoma Cells. Int. J. Mol. Sci. 2022, 23, 11747. [Google Scholar] [CrossRef] [PubMed]
- Bianco-Miotto, T.; Craig, J.M.; Gasser, Y.P.; van Dijk, S.J.; Ozanne, S.E. Epigenetics and DOHaD: From Basics to Birth and Beyond. J. Dev. Orig. Health Dis. 2017, 8, 513–519. [Google Scholar] [CrossRef] [PubMed]
- Majali-Martinez, A.; Weiss-Fuchs, U.; Miedl, H.; Forstner, D.; Bandres-Meriz, J.; Hoch, D.; Djelmis, J.; Ivanisevic, M.; Hiden, U.; Gauster, M.; et al. Type 1 Diabetes Mellitus and the First Trimester Placenta: Hyperglycemia-Induced Effects on Trophoblast Proliferation, Cell Cycle Regulators, and Invasion. Int. J. Mol. Sci. 2021, 22, 10989. [Google Scholar] [CrossRef]
- Weiss, U.; Cervar, M.; Puerstner, P.; Schmut, O.; Haas, J.; Mauschitz, R.; Arikan, G.; Desoye, G. Hyperglycaemia in Vitro Alters the Proliferation and Mitochondrial Activity of the Choriocarcinoma Cell Lines BeWo, JAR and JEG-3 as Models for Human First-Trimester Trophoblast. Diabetologia 2001, 44, 209–219. [Google Scholar] [CrossRef]
- Kwist, K.; Bridges, W.C.; Burg, K.J.L. The Effect of Cell Passage Number on Osteogenic and Adipogenic Characteristics of D1 Cells. Cytotechnology 2016, 68, 1661–1667. [Google Scholar] [CrossRef]
- Viau, M.; Lafond, J.; Vaillancourt, C. Expression of Placental Serotonin Transporter and 5-HT 2A Receptor in Normal and Gestational Diabetes Mellitus Pregnancies. Reprod. Biomed. Online 2009, 19, 207–215. [Google Scholar] [CrossRef]
- Devlin, A.M.; Brain, U.; Austin, J.; Oberlander, T.F. Prenatal Exposure to Maternal Depressed Mood and the MTHFR C677T Variant Affect SLC6A4 Methylation in Infants at Birth. PLoS ONE 2010, 5, e12201. [Google Scholar] [CrossRef]


Disclaimer/Publisher’s Note: The statements, opinions and data contained in all publications are solely those of the individual author(s) and contributor(s) and not of MDPI and/or the editor(s). MDPI and/or the editor(s) disclaim responsibility for any injury to people or property resulting from any ideas, methods, instructions or products referred to in the content. |
© 2023 by the authors. Licensee MDPI, Basel, Switzerland. This article is an open access article distributed under the terms and conditions of the Creative Commons Attribution (CC BY) license (https://creativecommons.org/licenses/by/4.0/).