
Estimation of Cancellous Changes Using Fractal Analysis in Patients with Periodontitis
 , , and
Abstract
:1. Introduction
- To determine the relationship between the fractal dimension of the cancellous bone and different stages of periodontal disease.
- To estimate the changes caused by periodontitis.
- To provide an additional criterion for the staging of periodontitis.
2. Materials and Methods
2.1. Patients’ Selection
2.2. Statistics
3. Results
4. Discussion
5. Conclusions
Author Contributions
Funding
Institutional Review Board Statement
Informed Consent Statement
Data Availability Statement
Conflicts of Interest
References
- Cardoso, E.M.; Reis, C.; Manzanares-Céspedes, M.C. Chronic Periodontitis, Inflammatory Cytokines, and Interrelationship with Other Chronic Diseases. Postgrad. Med. 2018, 130, 98–104. [Google Scholar] [CrossRef] [PubMed]
- Silness, J.; Loe, H. Periodontal Disease in Pregnancy. II. Correlation between Oral Hygiene and Periodontal Condtion. Acta Odontol. Scand. 1964, 22, 121–135. [Google Scholar] [CrossRef] [PubMed]
- Machtei, E.E.; Christersson, L.A.; Grossi, S.G.; Dunford, R.; Zambon, J.J.; Genco, R.J. Clinical Criteria for the Definition of “Established Periodontitis”. J. Periodontol. 1992, 63, 206–214. [Google Scholar] [CrossRef] [PubMed]
- Greenstein, G. The Role of Bleeding upon Probing in the Diagnosis of Periodontal Disease: A Literature Review. J. Periodontol. 1984, 55, 684–688. [Google Scholar] [CrossRef] [PubMed]
- Pihlstrom, B.L. Measurement of Attachment Level in Clinical Trials: Probing Methods. J. Periodontol. 1992, 63, 1072–1077. [Google Scholar] [CrossRef] [PubMed]
- Tarnow, D.; Fletcher, P. Classification of the Vertical Com ponent of Furcation Involvement. J. Periodontol. 1984, 55, 283–284. [Google Scholar] [CrossRef] [PubMed]
- Glargia, M.; Lindhe, J. Tooth Mobility and Periodontal Disease. J. Clin. Periodontol. 1997, 24, 785–795. [Google Scholar] [CrossRef]
- Hallmon, W.W. Occlusal Trauma: Effect and Impact on the Periodontium. Ann. Periodontol. 1999, 4, 102–108. [Google Scholar] [CrossRef]
- Caton, J.G.; Armitage, G.; Berglundh, T.; Chapple, I.L.C.; Jepsen, S.; Kornman, K.S.; Mealey, B.L.; Papapanou, P.N.; Sanz, M.; Tonetti, M.S. A New Classification Scheme for Periodontal and Peri-Implant Diseases and Conditions—Introduction and Key Changes from the 1999 Classification. J. Clin. Periodontol. 2018, 45 (Suppl. S20), S1–S8. [Google Scholar] [CrossRef]
- Park, J.-Y.; Chung, J.-H.; Lee, J.-S.; Kim, H.-J.; Choi, S.-H.; Jung, U.-W. Comparisons of the Diagnostic Accuracies of Optical Coherence Tomography, Micro-Computed Tomography, and Histology in Periodontal Disease: An Ex Vivo Study. J. Periodontal. Implant Sci. 2017, 47, 30–40. [Google Scholar] [CrossRef]
- Shrout, M.K.; Hildebolt, C.F.; Potter, B.J.; Comer, R.W. Comparison of 5 Protocols Based on Their Abilities to Use Data Extracted from Digitized Clinical Radiographs to Discriminate between Patients with Gingivitis and Periodontitis. J. Periodontol. 2000, 71, 1750–1755. [Google Scholar] [CrossRef] [PubMed]
- Brägger, U. Radiographic Parameters: Biological Significance and Clinical Use. Periodontology 2000 2005, 39, 73–90. [Google Scholar] [CrossRef] [PubMed]
- Sánchez, I.; Uzcátegui, G. Fractals in Dentistry. J. Dent. 2011, 39, 273–292. [Google Scholar] [CrossRef] [PubMed]
- Mandelbrot, B. Fractals and Chaos: The Mandelbrot Set and Beyond; Springer Science & Business Media: Berlin/Heidelberg, Germany, 2013; ISBN 978-1-4757-4017-2. [Google Scholar]
- Chen, Y.; Chen, L. Fractal Geometry; Earthquke Bulisher: Beijing, China, 1998. [Google Scholar]
- White, S.C.; Rudolph, D.J. Alterations of the Trabecular Pattern of the Jaws in Patients with Osteoporosis. Oral Surg. Oral Med. Oral Pathol. Oral Radiol. Endodontol. 1999, 88, 628–635. [Google Scholar] [CrossRef] [PubMed]
- Parkinson, I.H.; Fazzalari, N.L. Cancellous Bone Structure Analysis Using Image Analysis. Australas. Phys. Eng. Sci. Med. 1994, 17, 64–70. [Google Scholar] [PubMed]
- Updike, S.X.; Nowzari, H. Fractal Analysis of Dental Radiographs to Detect Periodontitis-Induced Trabecular Changes. J. Periodontal. Res. 2008, 43, 658–664. [Google Scholar] [CrossRef] [PubMed]
- Sener, E.; Cinarcik, S.; Baksi, B.G. Use of Fractal Analysis for the Discrimination of Trabecular Changes between Individuals with Healthy Gingiva or Moderate Periodontitis. J. Periodontol. 2015, 86, 1364–1369. [Google Scholar] [CrossRef] [PubMed]
- Mishra, S.; Kumar, M.; Mishra, L.; Mohanty, R.; Nayak, R.; Das, A.C.; Mishra, S.; Panda, S.; Lapinska, B. Fractal Dimension as a Tool for Assessment of Dental Implant Stability—A Scoping Review. J. Clin. Med. 2022, 11, 4051. [Google Scholar] [CrossRef]
- Mu, T.-J.; Lee, D.-W.; Park, K.-H.; Moon, I.-S. Changes in the Fractal Dimension of Peri-Implant Trabecular Bone after Loading: A Retrospective Study. J. Periodontal. Implant Sci. 2013, 43, 209–214. [Google Scholar] [CrossRef]
- Khajavi, M.A.; Saljoghinezhad, M.; Sargolazaii, N. Feasibility of Fractal Analysis for Detecting Primary Bone Changes in Chronic Periodontitis. Int. J. Contemp. Dent. Med. Rev. 2017, 2017, 010817. [Google Scholar]
- Faul, F.; Erdfelder, E.; Lang, A.-G.; Buchner, A. G*Power 3: A Flexible Statistical Power Analysis Program for the Social, Behavioral, and Biomedical Sciences. Behav. Res. Methods 2007, 39, 175–191. [Google Scholar] [CrossRef] [PubMed]
- Introduction. Available online: https://imagej.nih.gov/ij/docs/intro.html (accessed on 9 April 2021).
- Shrout, M.K.; Potter, B.J.; Hildebolt, C.F. The Effect of Image Variations on Fractal Dimension Calculations. Oral Surg. Oral Med. Oral Pathol. Oral Radiol. Endodontol. 1997, 84, 96–100. [Google Scholar] [CrossRef] [PubMed]
- Jett, S.; Shrout, M.K.; Mailhot, J.M.; Potter, B.J.; Borke, J.L. An Evaluation of the Origin of Trabecular Bone Patterns Using Visual and Digital Image Analysis. Oral Surg. Oral Med. Oral Pathol. Oral Radiol. Endodontol. 2004, 98, 598–604. [Google Scholar] [CrossRef]
- Tosoni, G.M.; Lurie, A.G.; Cowan, A.E.; Burleson, J.A. Pixel Intensity and Fractal Analyses: Detecting Osteoporosis in Perimenopausal and Postmenopausal Women by Using Digital Panoramic Images. Oral Surg. Oral Med. Oral Pathol. Oral Radiol. Endodontol. 2006, 102, 235–241. [Google Scholar] [CrossRef] [PubMed]
- Jolley, L.; Majumdar, S.; Kapila, S. Technical Factors in Fractal Analysis of Periapical Radiographs. Dentomaxillofac. Radiol. 2006, 35, 393–397. [Google Scholar] [CrossRef] [PubMed]
- Corbet, E.F.; Ho, D.K.L.; Lai, S.M.L. Radiographs in Periodontal Disease Diagnosis and Management. Aust. Dent. J. 2009, 54 (Suppl. S1), S27–S43. [Google Scholar] [CrossRef] [PubMed]
- Shrout, M.K.; Roberson, B.; Potter, B.J.; Mailhot, J.M.; Hildebolt, C.F. A Comparison of 2 Patient Populations Using Fractal Analysis. J. Periodontol. 1998, 69, 9–13. [Google Scholar] [CrossRef] [PubMed]
- Aktuna Belgin, C.; Serindere, G. Evaluation of Trabecular Bone Changes in Patients with Periodontitis Using Fractal Analysis: A Periapical Radiography Study. J. Periodontol. 2020, 91, 933–937. [Google Scholar] [CrossRef]
- Kumar, M.; Mishra, L. Management of a Large Non Healing Periapical Lesion by Combined Endodontic-Periodontic Approach: A Case Report. Endodontology 2015, 27, 77–79. [Google Scholar]
- Panda, S.; Karanxha, L.; Goker, F.; Satpathy, A.; Taschieri, S.; Francetti, L.; Chandra Das, A.; Kumar, M.; Panda, S.; Del Fabbro, M. Autologous Platelet Concentrates in Treatment of Furcation Defects—A Systematic Review and Meta-Analysis. Int. J. Mol. Sci. 2019, 20, 1347. [Google Scholar] [CrossRef]
- Butera, A.; Pascadopoli, M.; Pellegrini, M.; Gallo, S.; Zampetti, P.; Scribante, A. Oral Microbiota in Patients with Peri-Implant Disease: A Narrative Review. Appl. Sci. 2022, 12, 3250. [Google Scholar] [CrossRef]
- Vale, G.C.; Mayer, M.P.A. Effect of Probiotic Lactobacillus Rhamnosus By-Products on Gingival Epithelial Cells Challenged with Porphyromonas Gingivalis. Arch Oral Biol. 2021, 128, 105174. [Google Scholar] [CrossRef]
- Butera, A.; Pascadopoli, M.; Pellegrini, M.; Gallo, S.; Zampetti, P.; Cuggia, G.; Scribante, A. Domiciliary Use of Chlorhexidine vs. Postbiotic Gels in Patients with Peri-Implant Mucositis: A Split-Mouth Randomized Clinical Trial. Appl. Sci. 2022, 12, 2800. [Google Scholar] [CrossRef]
- White, S.C.; Atchison, K.A.; Gornbein, J.A.; Nattiv, A.; Paganini-Hill, A.; Service, S.K.; Yoon, D.C. Change in Mandibular Trabecular Pattern and Hip Fracture Rate in Elderly Women. Dentomaxillofac. Radiol. 2005, 34, 168–174. [Google Scholar] [CrossRef]


| Inclusion Criteria | Exclusion Criteria |
|---|---|
| Patients within the age group of 30–60 years | Radiographs with poor resolution or diagnostic quality |
| Systemically healthy patients | Patients having diseases which may affect the bone density |
| Patients consenting to radiographic exposure | Patients not willing to have radiation exposure. |
| Patients having at least 20 remaining teeth | Teeth with dental caries extending in the cervical area. |
| Confirmed diagnosis of periodontitis (World Workshop Classification for Periodontal and Peri-Implant Diseases and Conditions, 2017) | Teeth with clinical attachment loss on the distal aspect of a second molar and associated with malposition or extraction of a third molar |
| Teeth having previous root canal therapy or periapical lesions |
| Study Group | Group Description |
|---|---|
| Group A | Healthy controls |
| Group B | Interdental CAL at the site of greatest loss 1–2 mm (STAGE I) |
| Group C | Interdental CAL at the site of greatest loss 3–4 mm (STAGE II) |
| Group D | Interdental CAL at the site of greatest loss ≥ 5 mm (STAGE III) |
| Group E | Interdental CAL at the site of greatest loss ≥ 5 mm (STAGE IV) Tooth loss due to periodontitis of ≥5 teeth. |
| Stage | N | % Bone Loss | Kruskal–Wallis Test ‘p’ Value | ||||
|---|---|---|---|---|---|---|---|
| Mean | SD | Median | Range | Mean Rank | |||
| Stage I | 15 | 12.1 | 2.6 | 12.9 (10.0–14.7) | (7.0–14.9) | 8.0 | p < 0.0001 |
| Stage II | 15 | 25.4 | 4.7 | 25.3 (20.4–29.9) | (17.5–32.6) | 23.0 | |
| Stage III | 15 | 57.9 | 6.1 | 58.8 (52.3–63.0) | (46.2–67.3) | 38.8 | |
| Stage IV | 15 | 77.0 | 10.3 | 77.6 (70.5–87.2) | (54.7–91.5) | 52.2 | |
| Total | 60 | 43.1 | 26.7 | 39.4 (15.6–64.9) | (7.0–91.5) | ||
| Stage | N | FD Value | Kruskal–Wallis Test ‘p’ Value | ||||
|---|---|---|---|---|---|---|---|
| Mean | SD | Median | Range | Mean Rank | |||
| Control | 15 | 1.21 | 0.07 | 1.23 (1.19–1.27) | (1.03–1.29) | 54.23 | p < 0.0001 |
| Stage I | 15 | 1.21 | 0.06 | 1.21 (1.18–1.27) | (1.11–1.29) | 53.00 | |
| Stage II | 15 | 1.19 | 0.05 | 1.18 (1.15–1.21) | (1.10–1.30) | 46.10 | |
| Stage III | 15 | 1.11 | 0.05 | 1.12 (1.08–1.16) | (1.01–1.17) | 25.73 | |
| Stage IV | 15 | 1.02 | 0.11 | 1.03 (1.01–1.08) | (0.63–1.10) | 10.93 | |
| Total | 75 | 1.15 | 0.10 | 1.16 (1.09–1.22) | (0.63–1.30) | ||
| Stages | % Bone Loss | FD Value (D) |
|---|---|---|
| Overall | Pearson Correlation | −0.739 ** |
| Sig. (2-tailed) | 0.000 | |
| N | 60 | |
| Stage I | Pearson Correlation | −0.639 * |
| Sig. (2-tailed) | 0.010 | |
| N | 15 | |
| Stage II | Pearson Correlation | −0.561 * |
| Sig. (2-tailed) | 0.030 | |
| N | 15 | |
| Stage III | Pearson Correlation | 0.226 |
| Sig. (2-tailed) | 0.418 | |
| N | 15 | |
| Stage IV | Pearson Correlation | −0.353 |
| Sig. (2-tailed) | 0.196 | |
| N | 15 |
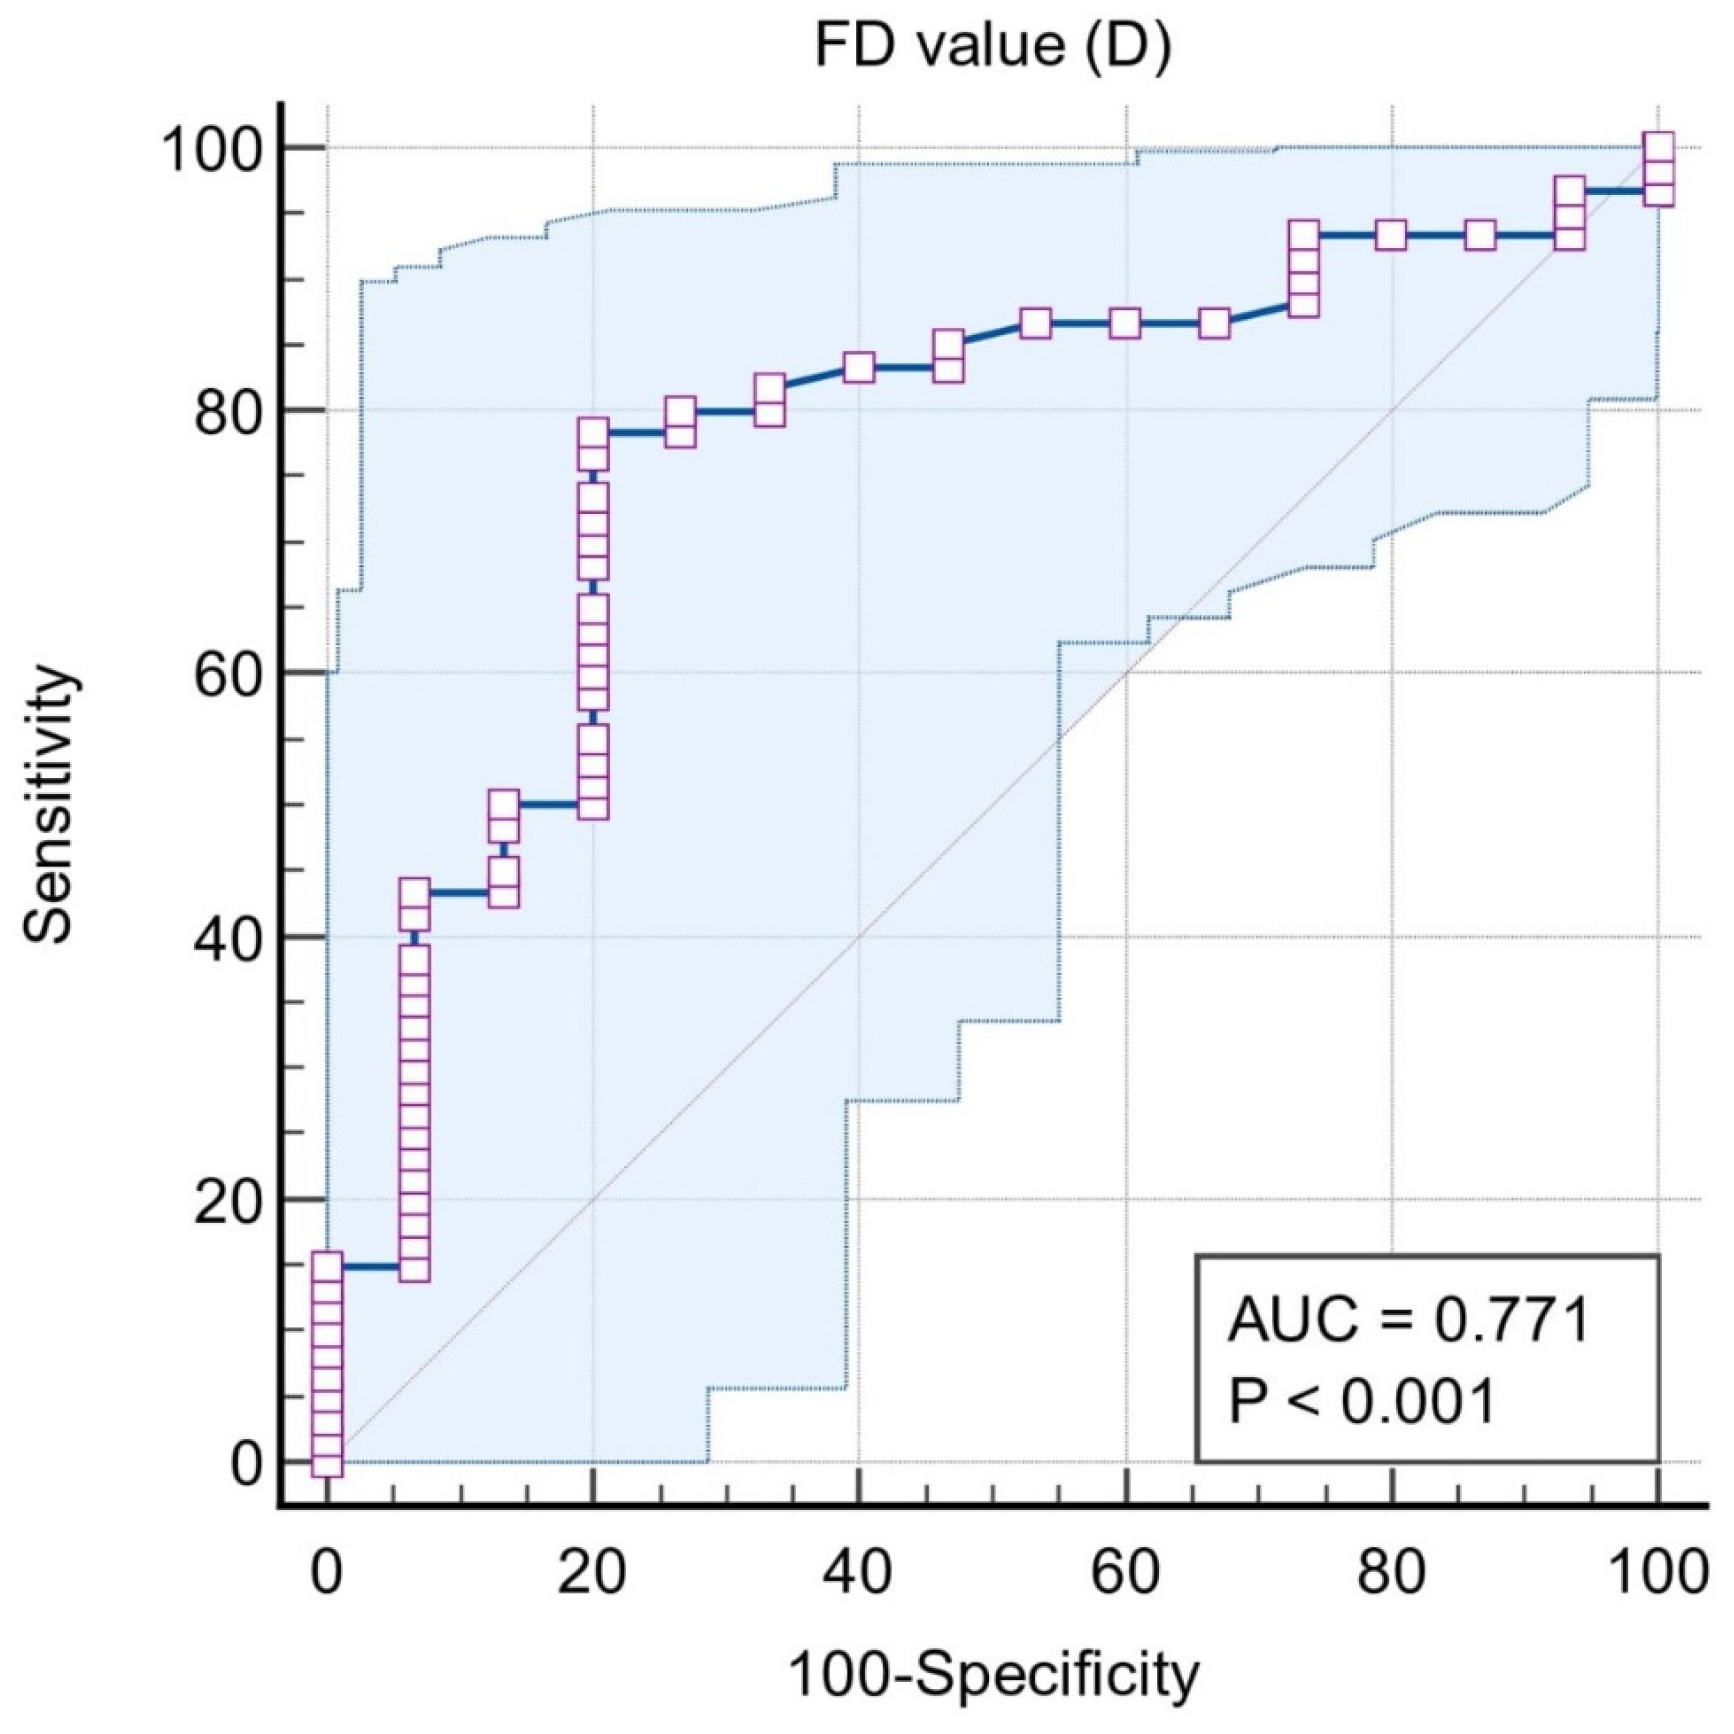
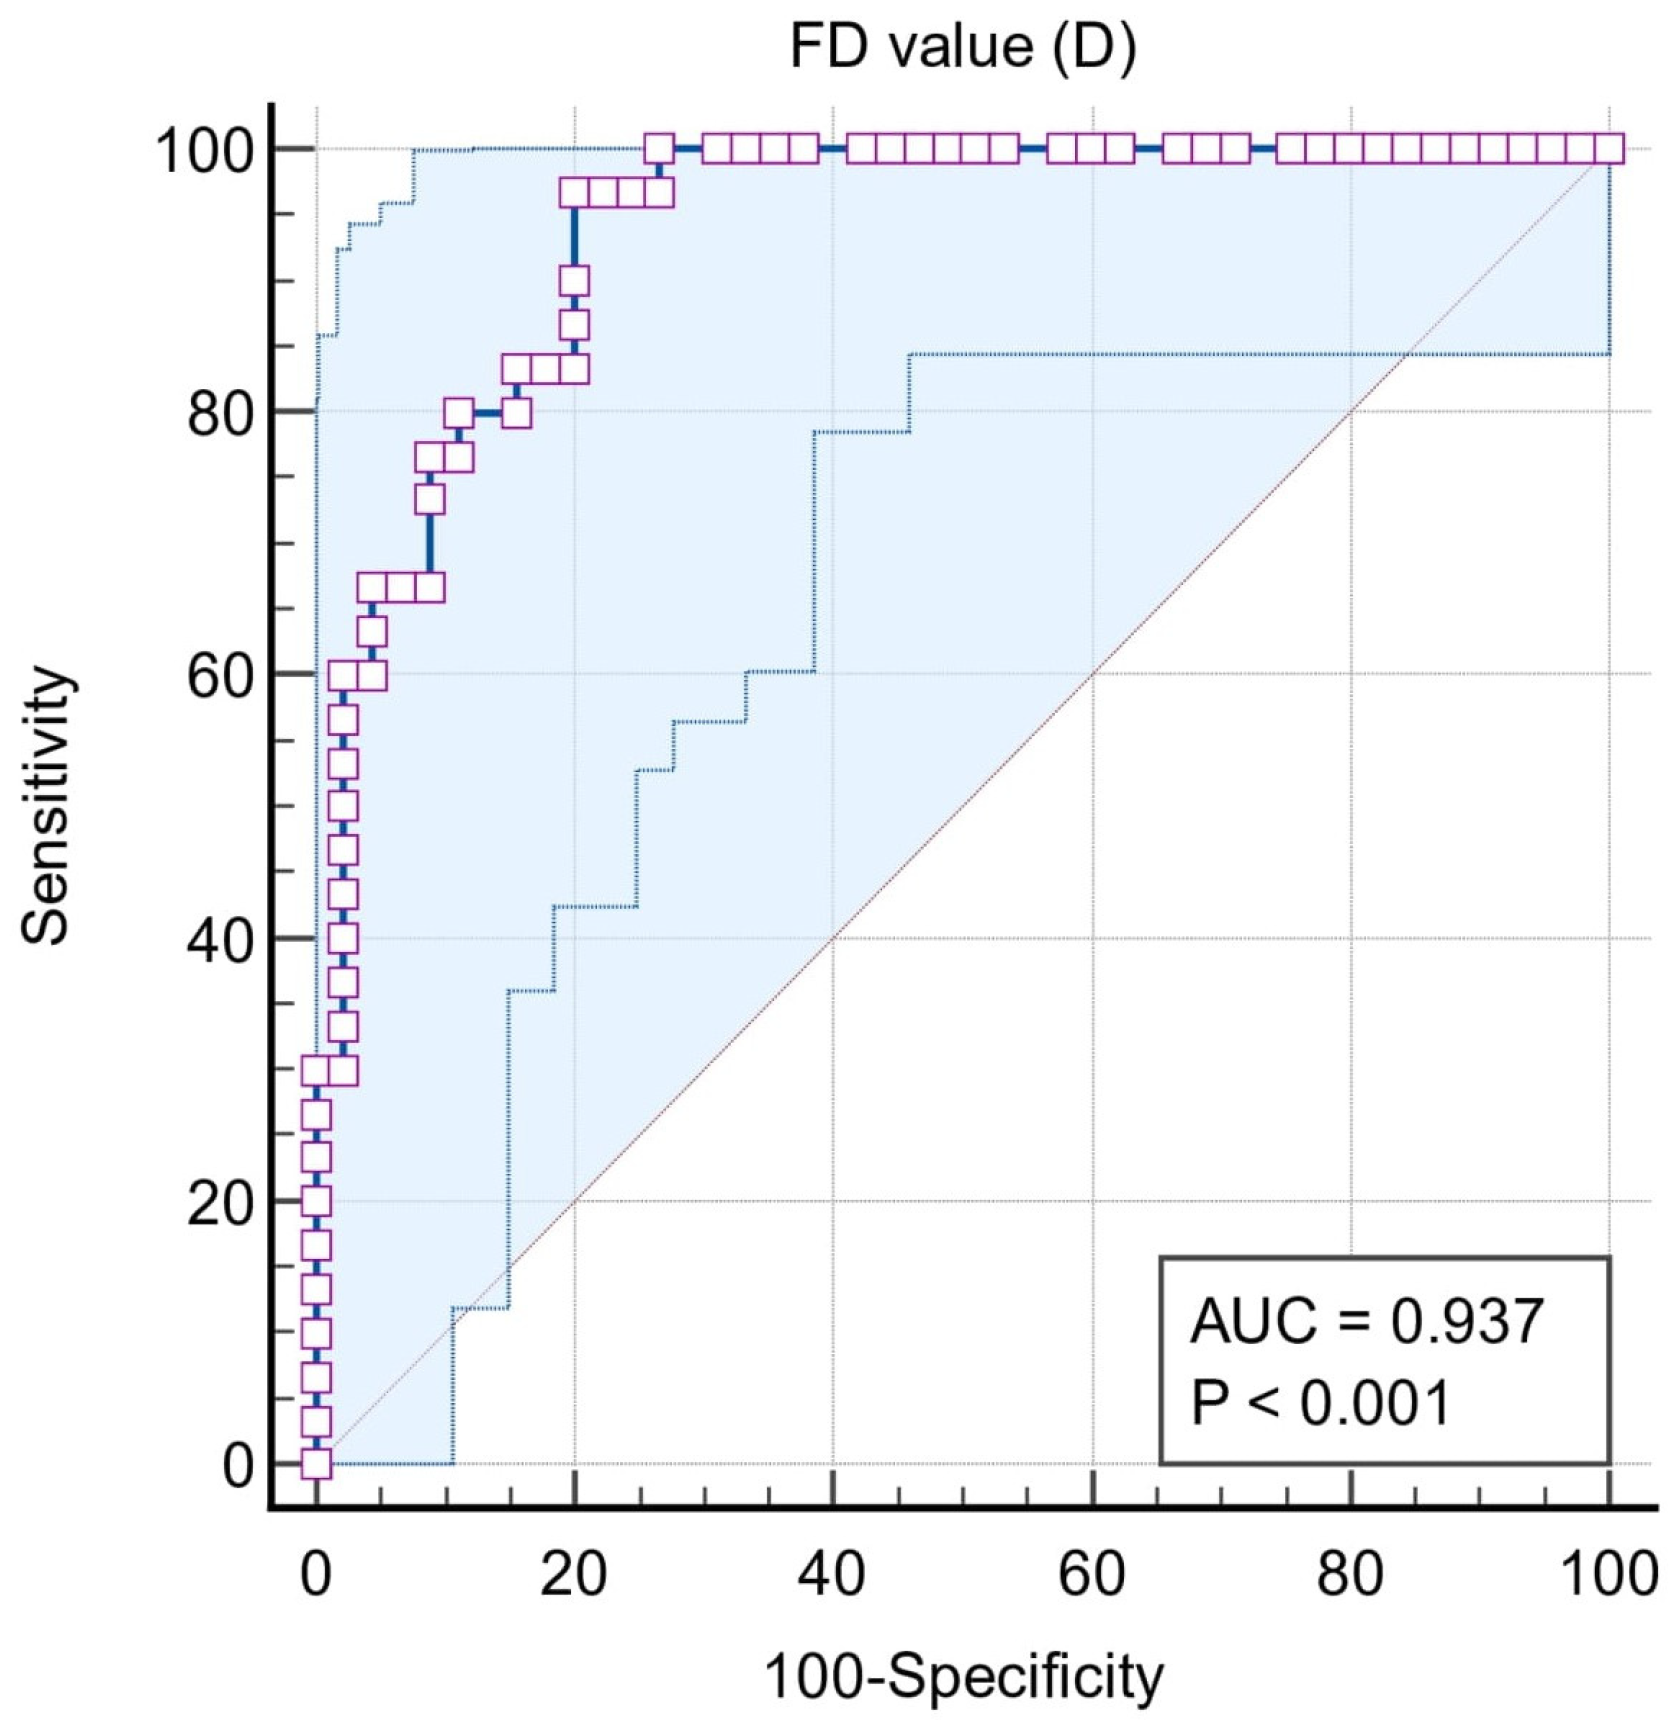
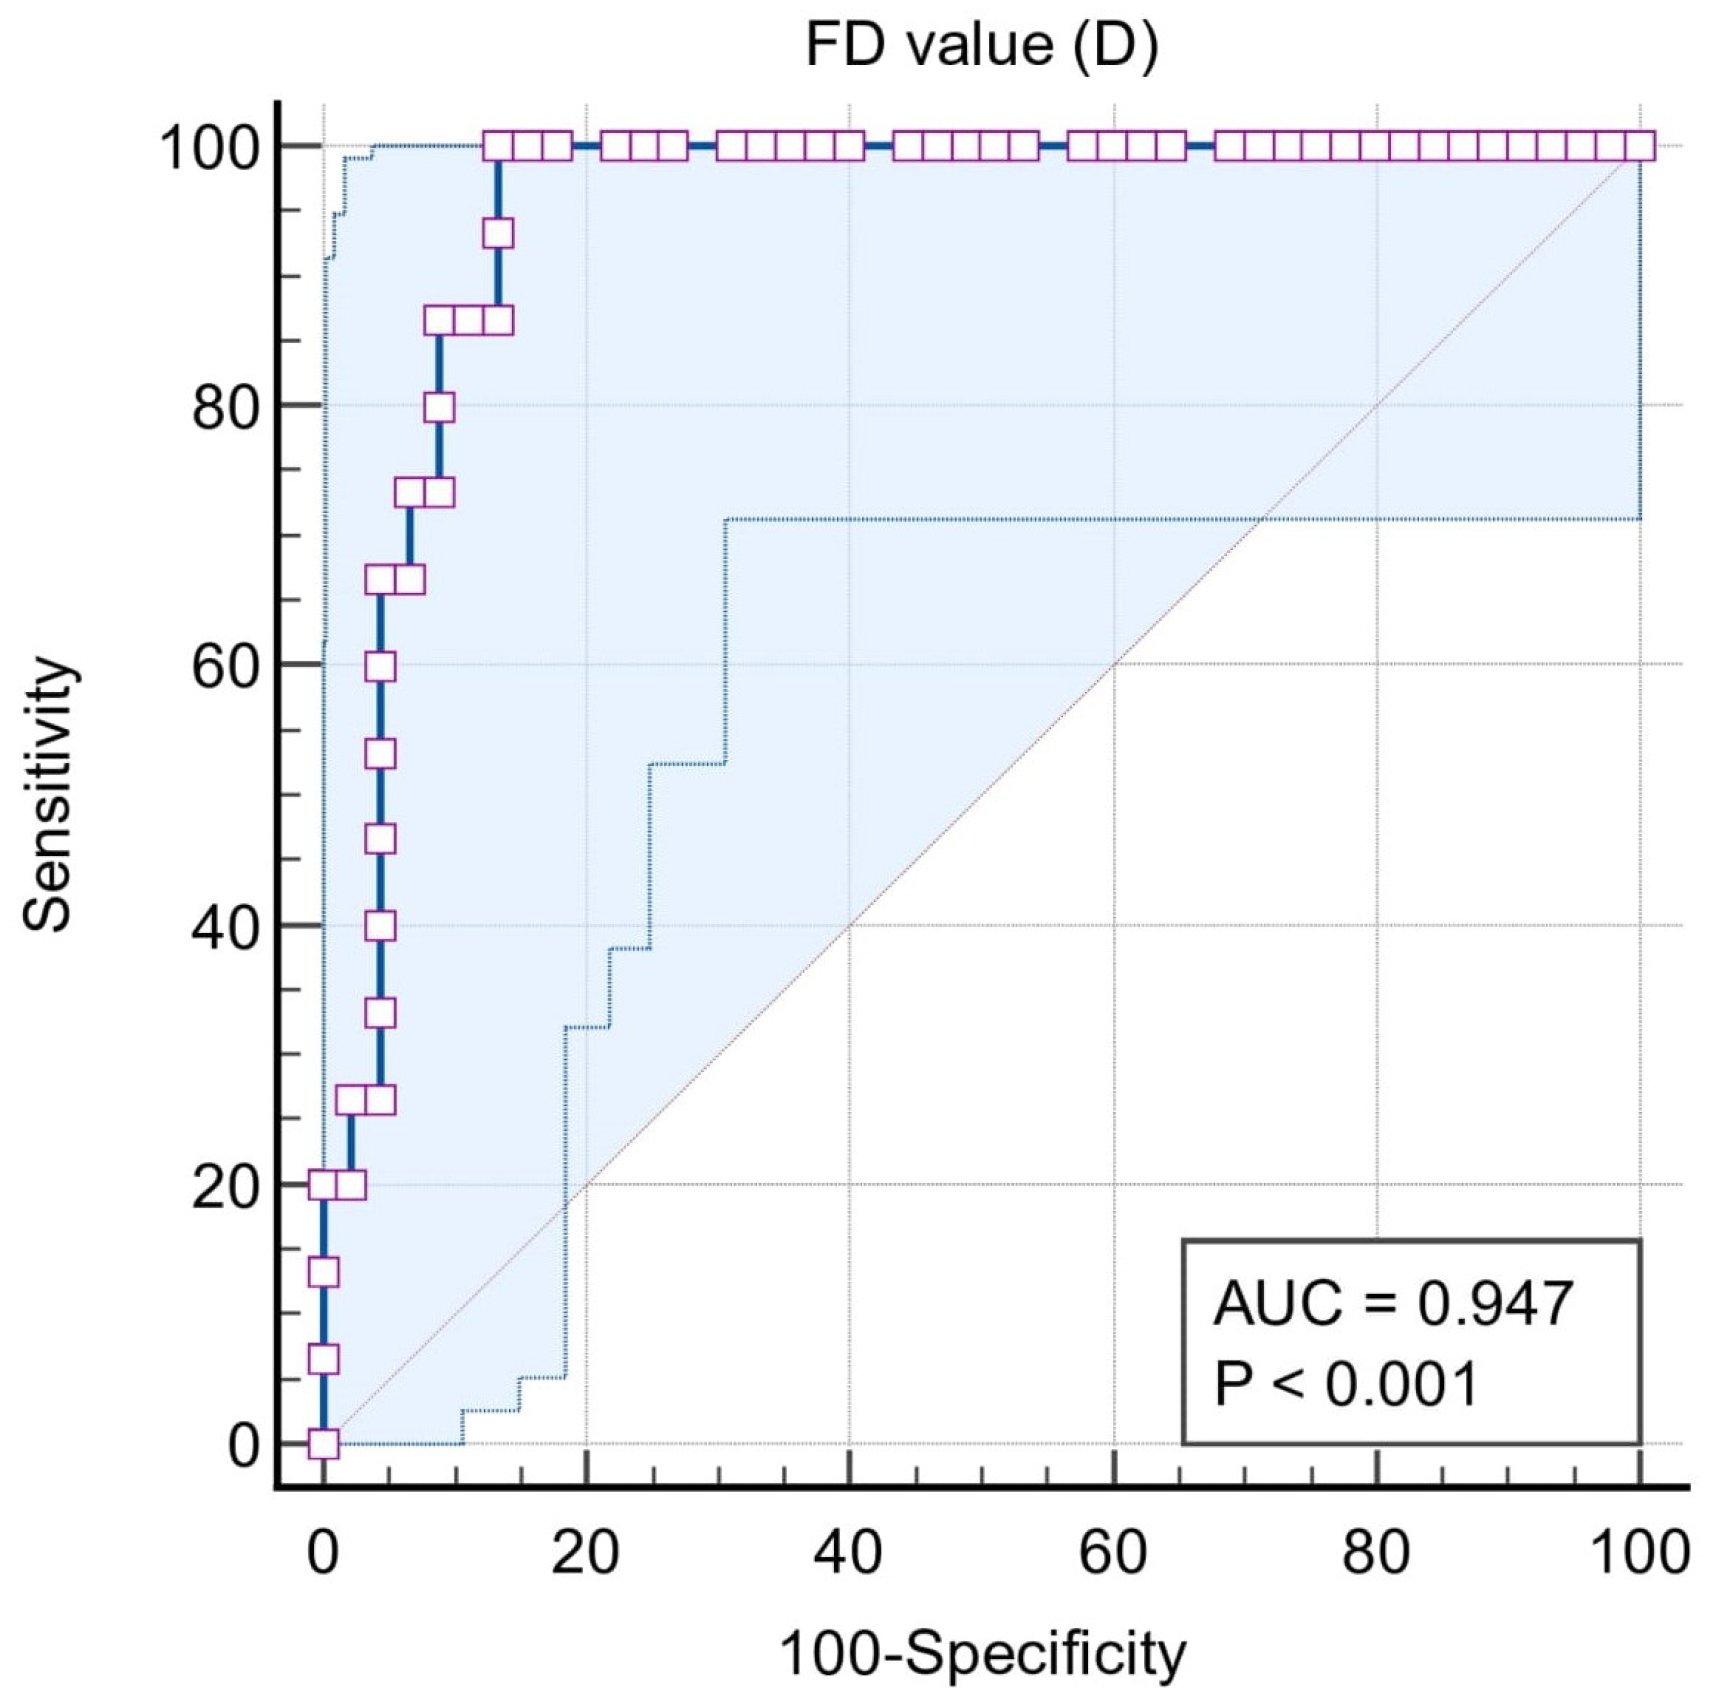
| ROC | Classification Variables | ||||
|---|---|---|---|---|---|
| Situation #1 (Stages I, II, III, and IV = 1, Control = 0) | Situation #2 (Stages III and IV = 1, Control, Stages I and II = 0) | Situation #3 (Stages III and IV = 1, Stages I and II = 0) | Situation #4 (Stage IV = 1, Stages I, II, and III = 0) | Situation #5 (Stage I and II = 1, Control = 0) | |
| Sample size | 75 | 75 | 60 | 60 | 45 |
| Area under the ROC curve (AUC) | 0.771 | 0.937 | 0.942 | 0.947 | 0.614 |
| 95% Confidence interval b | 0.659 to 0.860 | 0.856 to 0.980 | 0.850 to 0.986 | 0.856 to 0.988 | 0.458 to 0.756 |
| Significance level P (Area = 0.5) | 0.0001 | <0.0001 | <0.0001 | <0.0001 | 0.2228 |
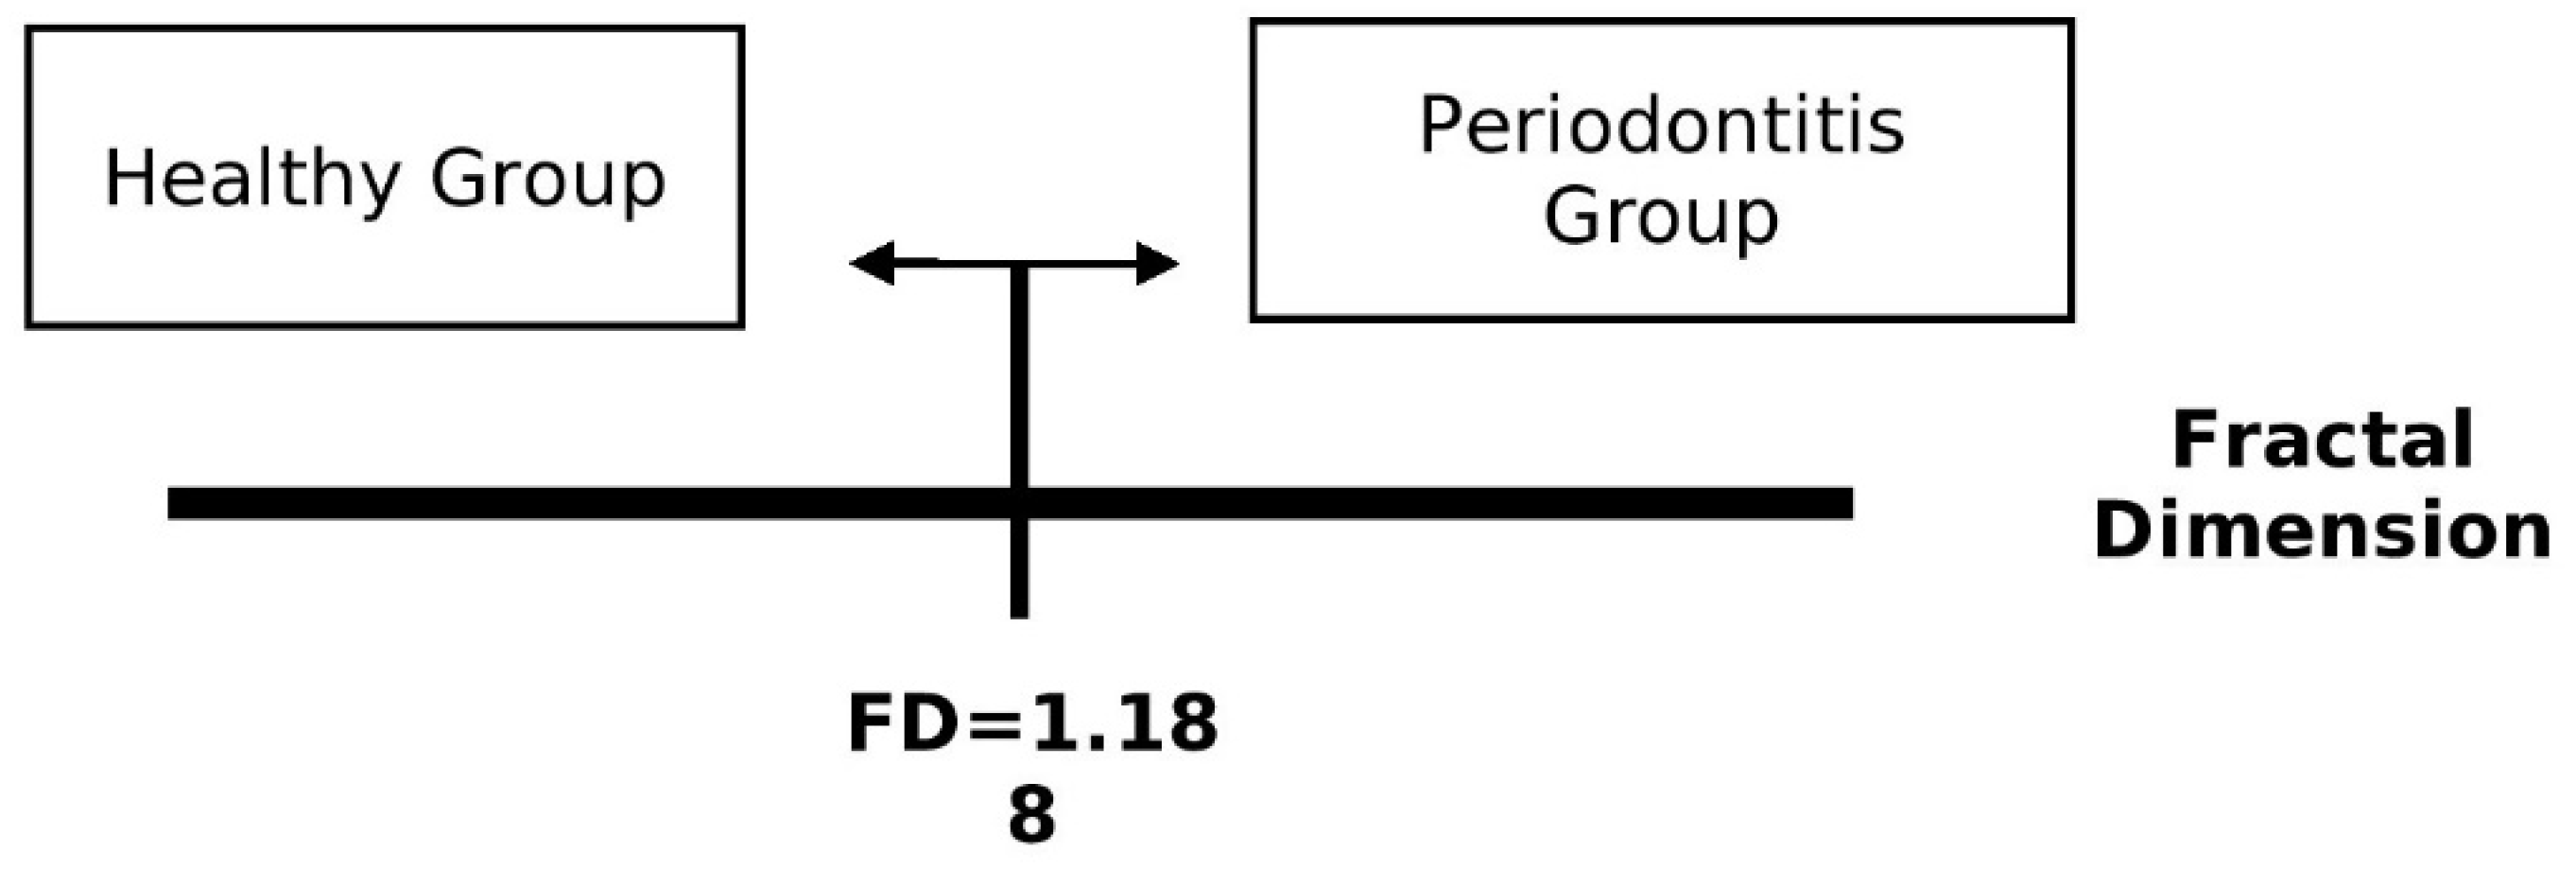
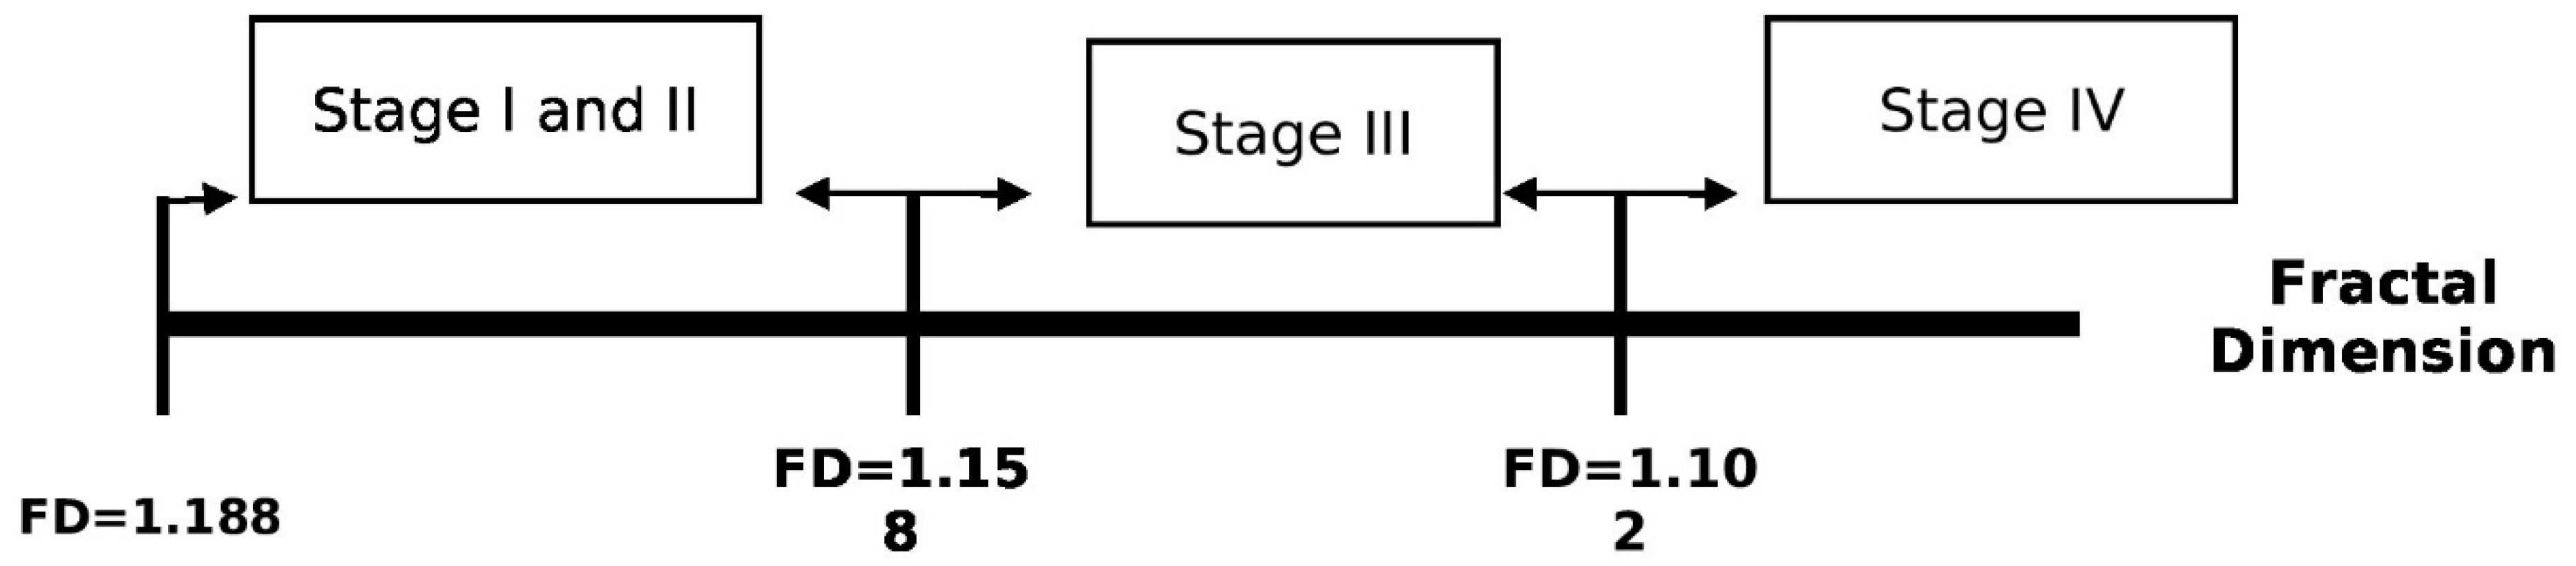
| Associated criterion | ≤1.188 | ≤1.158 | ≤1.158 | ≤1.102 | ≤1.188 |
| Sensitivity (95% CI) | 78.3 (65.8–87.9) | 96.7 (82.8–99.9) | 96.7 (82.8–99.9) | 100 (78.2–100) | 56.67 (37.4–74.5) |
| Specificity (95% CI) | 80 (51.9–95.7) | 80 (65.4–90.4) | 80 (61.4–92.3) | 86.7 (73.2–94.9) | 80.00 (51.9–95.7) |
Disclaimer/Publisher’s Note: The statements, opinions and data contained in all publications are solely those of the individual author(s) and contributor(s) and not of MDPI and/or the editor(s). MDPI and/or the editor(s) disclaim responsibility for any injury to people or property resulting from any ideas, methods, instructions or products referred to in the content. |
© 2023 by the authors. Licensee MDPI, Basel, Switzerland. This article is an open access article distributed under the terms and conditions of the Creative Commons Attribution (CC BY) license (https://creativecommons.org/licenses/by/4.0/).
Share and Cite
Mishra, S.; Kumar, M.; Mishra, L.; Panda, S.; Panda, S.; Lewkowicz, N.; Lapinska, B. Estimation of Cancellous Changes Using Fractal Analysis in Patients with Periodontitis. Biomedicines 2023, 11, 2547. https://doi.org/10.3390/biomedicines11092547
Mishra S, Kumar M, Mishra L, Panda S, Panda S, Lewkowicz N, Lapinska B. Estimation of Cancellous Changes Using Fractal Analysis in Patients with Periodontitis. Biomedicines. 2023; 11(9):2547. https://doi.org/10.3390/biomedicines11092547
Chicago/Turabian StyleMishra, Sukanya, Manoj Kumar, Lora Mishra, Swagatika Panda, Saurav Panda, Natalia Lewkowicz, and Barbara Lapinska. 2023. "Estimation of Cancellous Changes Using Fractal Analysis in Patients with Periodontitis" Biomedicines 11, no. 9: 2547. https://doi.org/10.3390/biomedicines11092547
APA StyleMishra, S., Kumar, M., Mishra, L., Panda, S., Panda, S., Lewkowicz, N., & Lapinska, B. (2023). Estimation of Cancellous Changes Using Fractal Analysis in Patients with Periodontitis. Biomedicines, 11(9), 2547. https://doi.org/10.3390/biomedicines11092547