
Are MTV and TLG Accurate for Quantifying the Intensity of Brown Adipose Tissue Activation?

 , , , and
Abstract
:1. Introduction
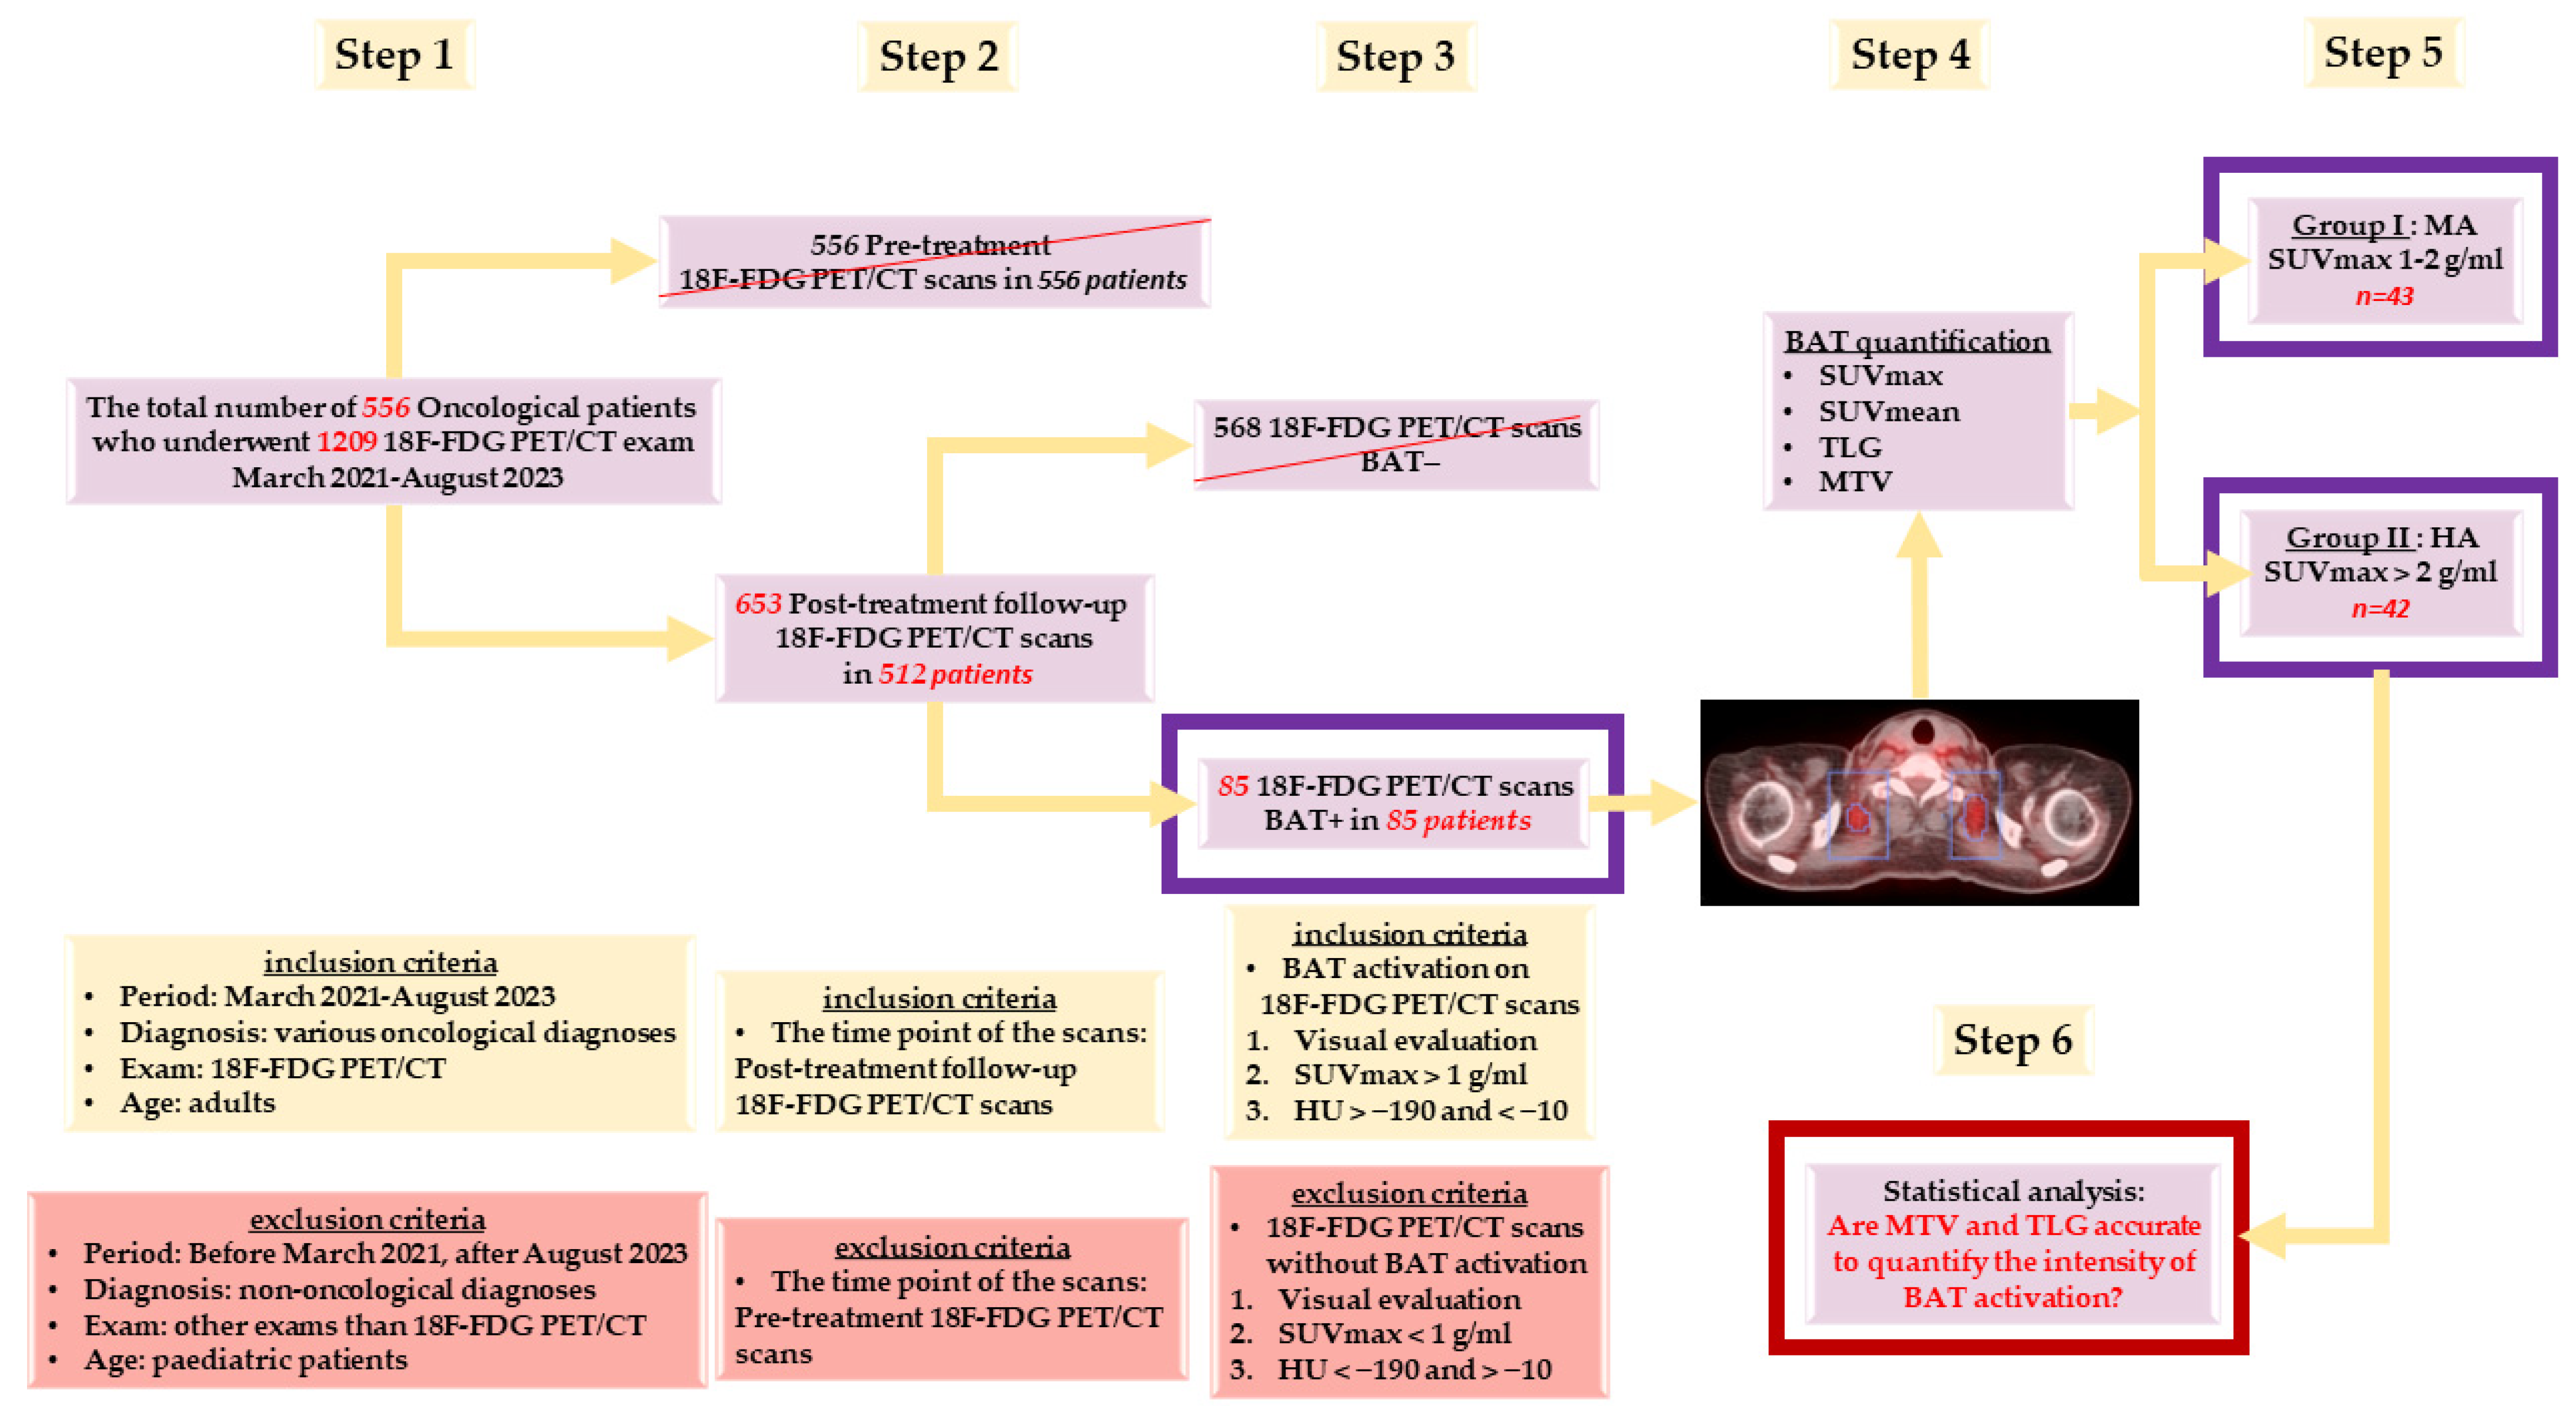
2. Materials and Methods
2.1. Patients
2.2. 18F-FDG PET/CT Scanning Protocol
2.3. Image Processing and Interpretation
2.3.1. Visual Determination of BAT Activation
2.3.2. Quantitative Confirmation of BAT Activation
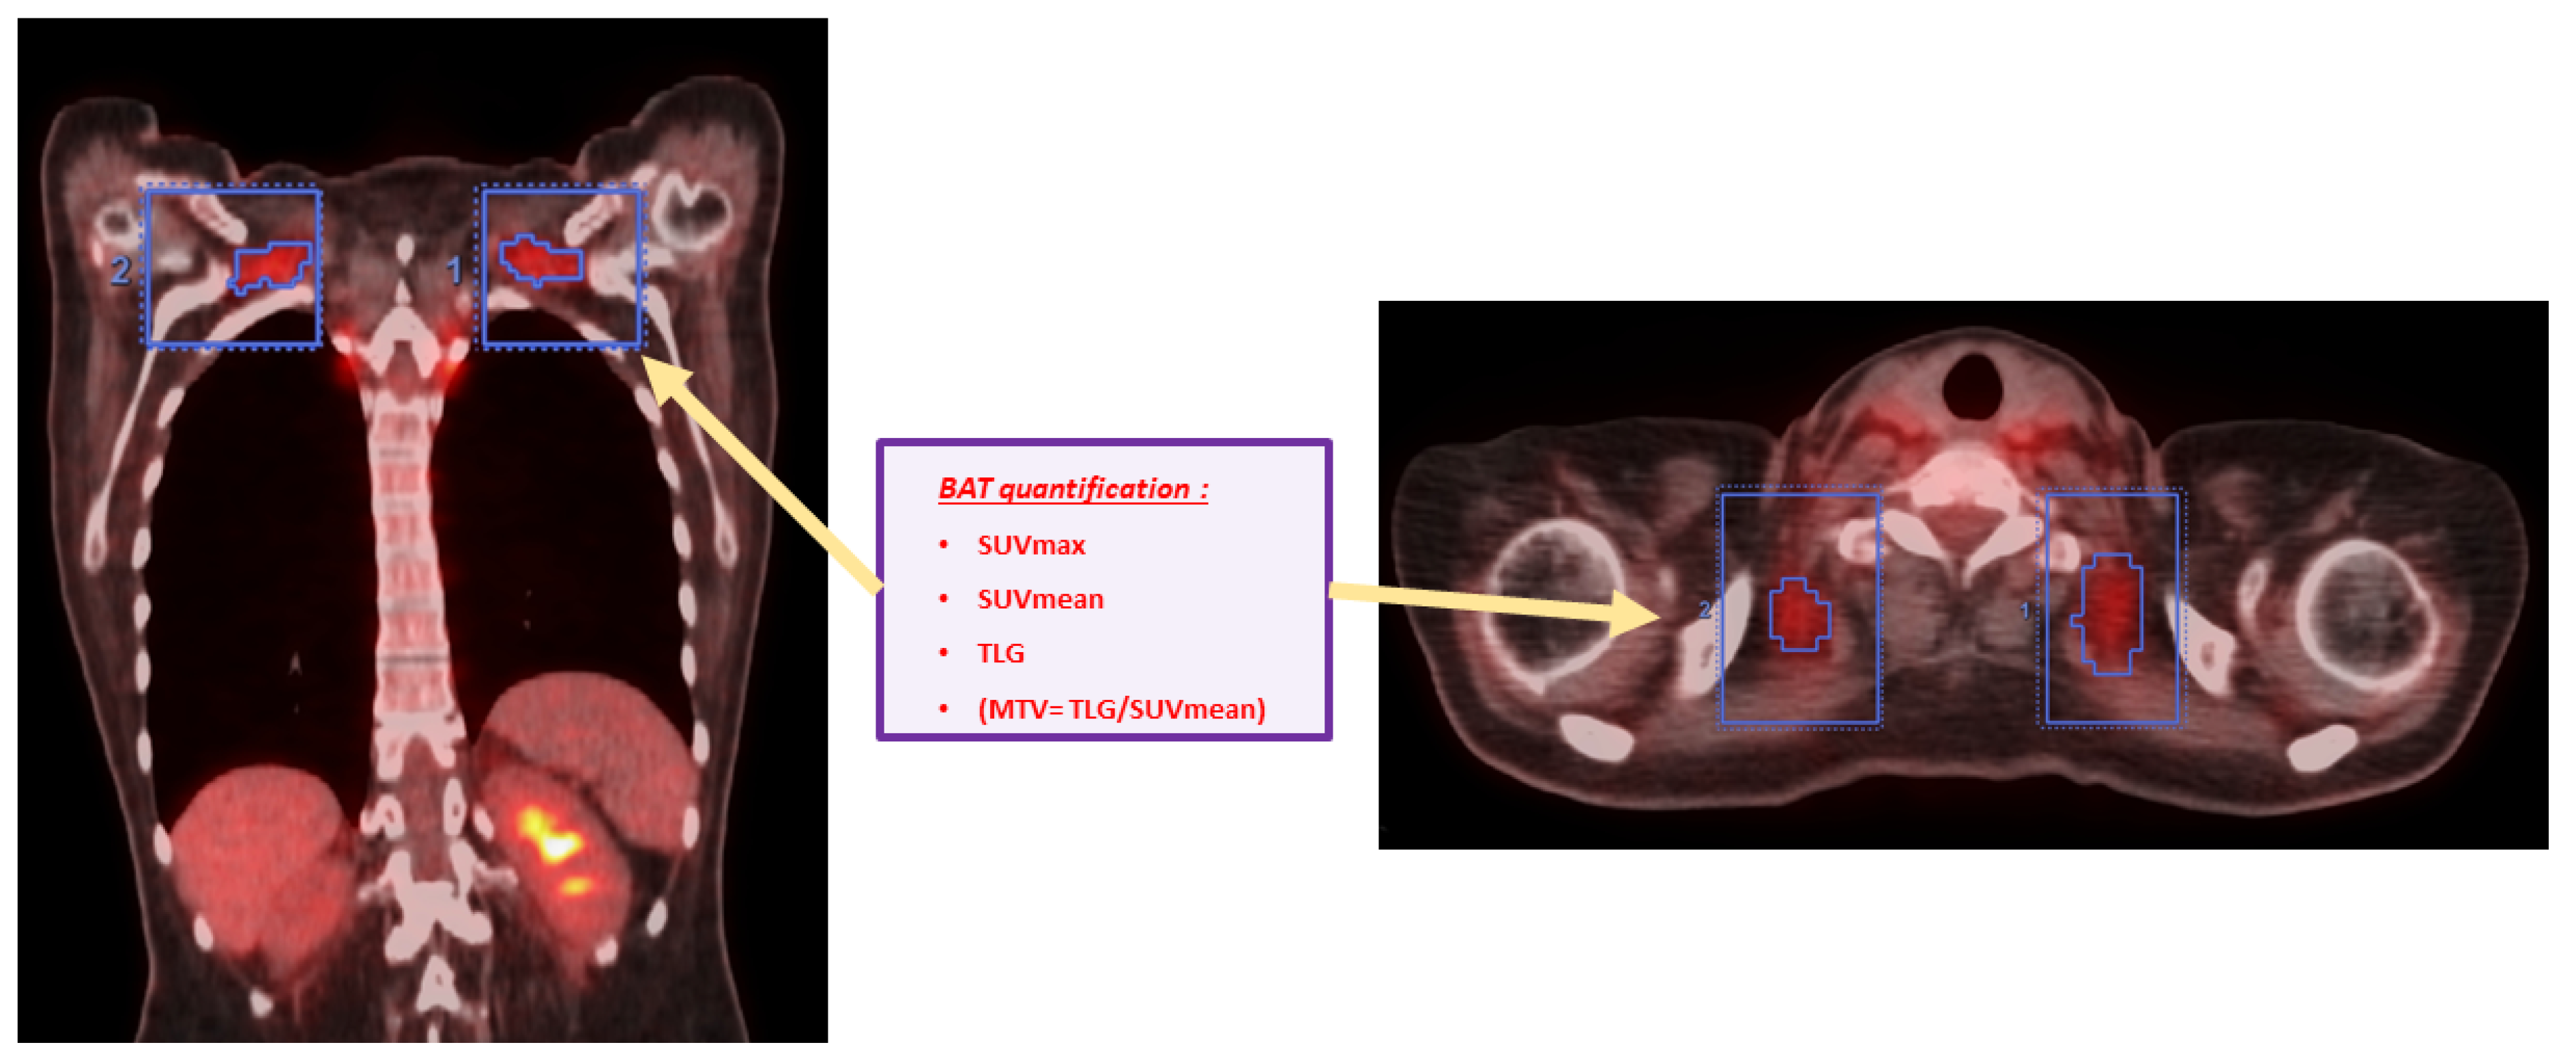
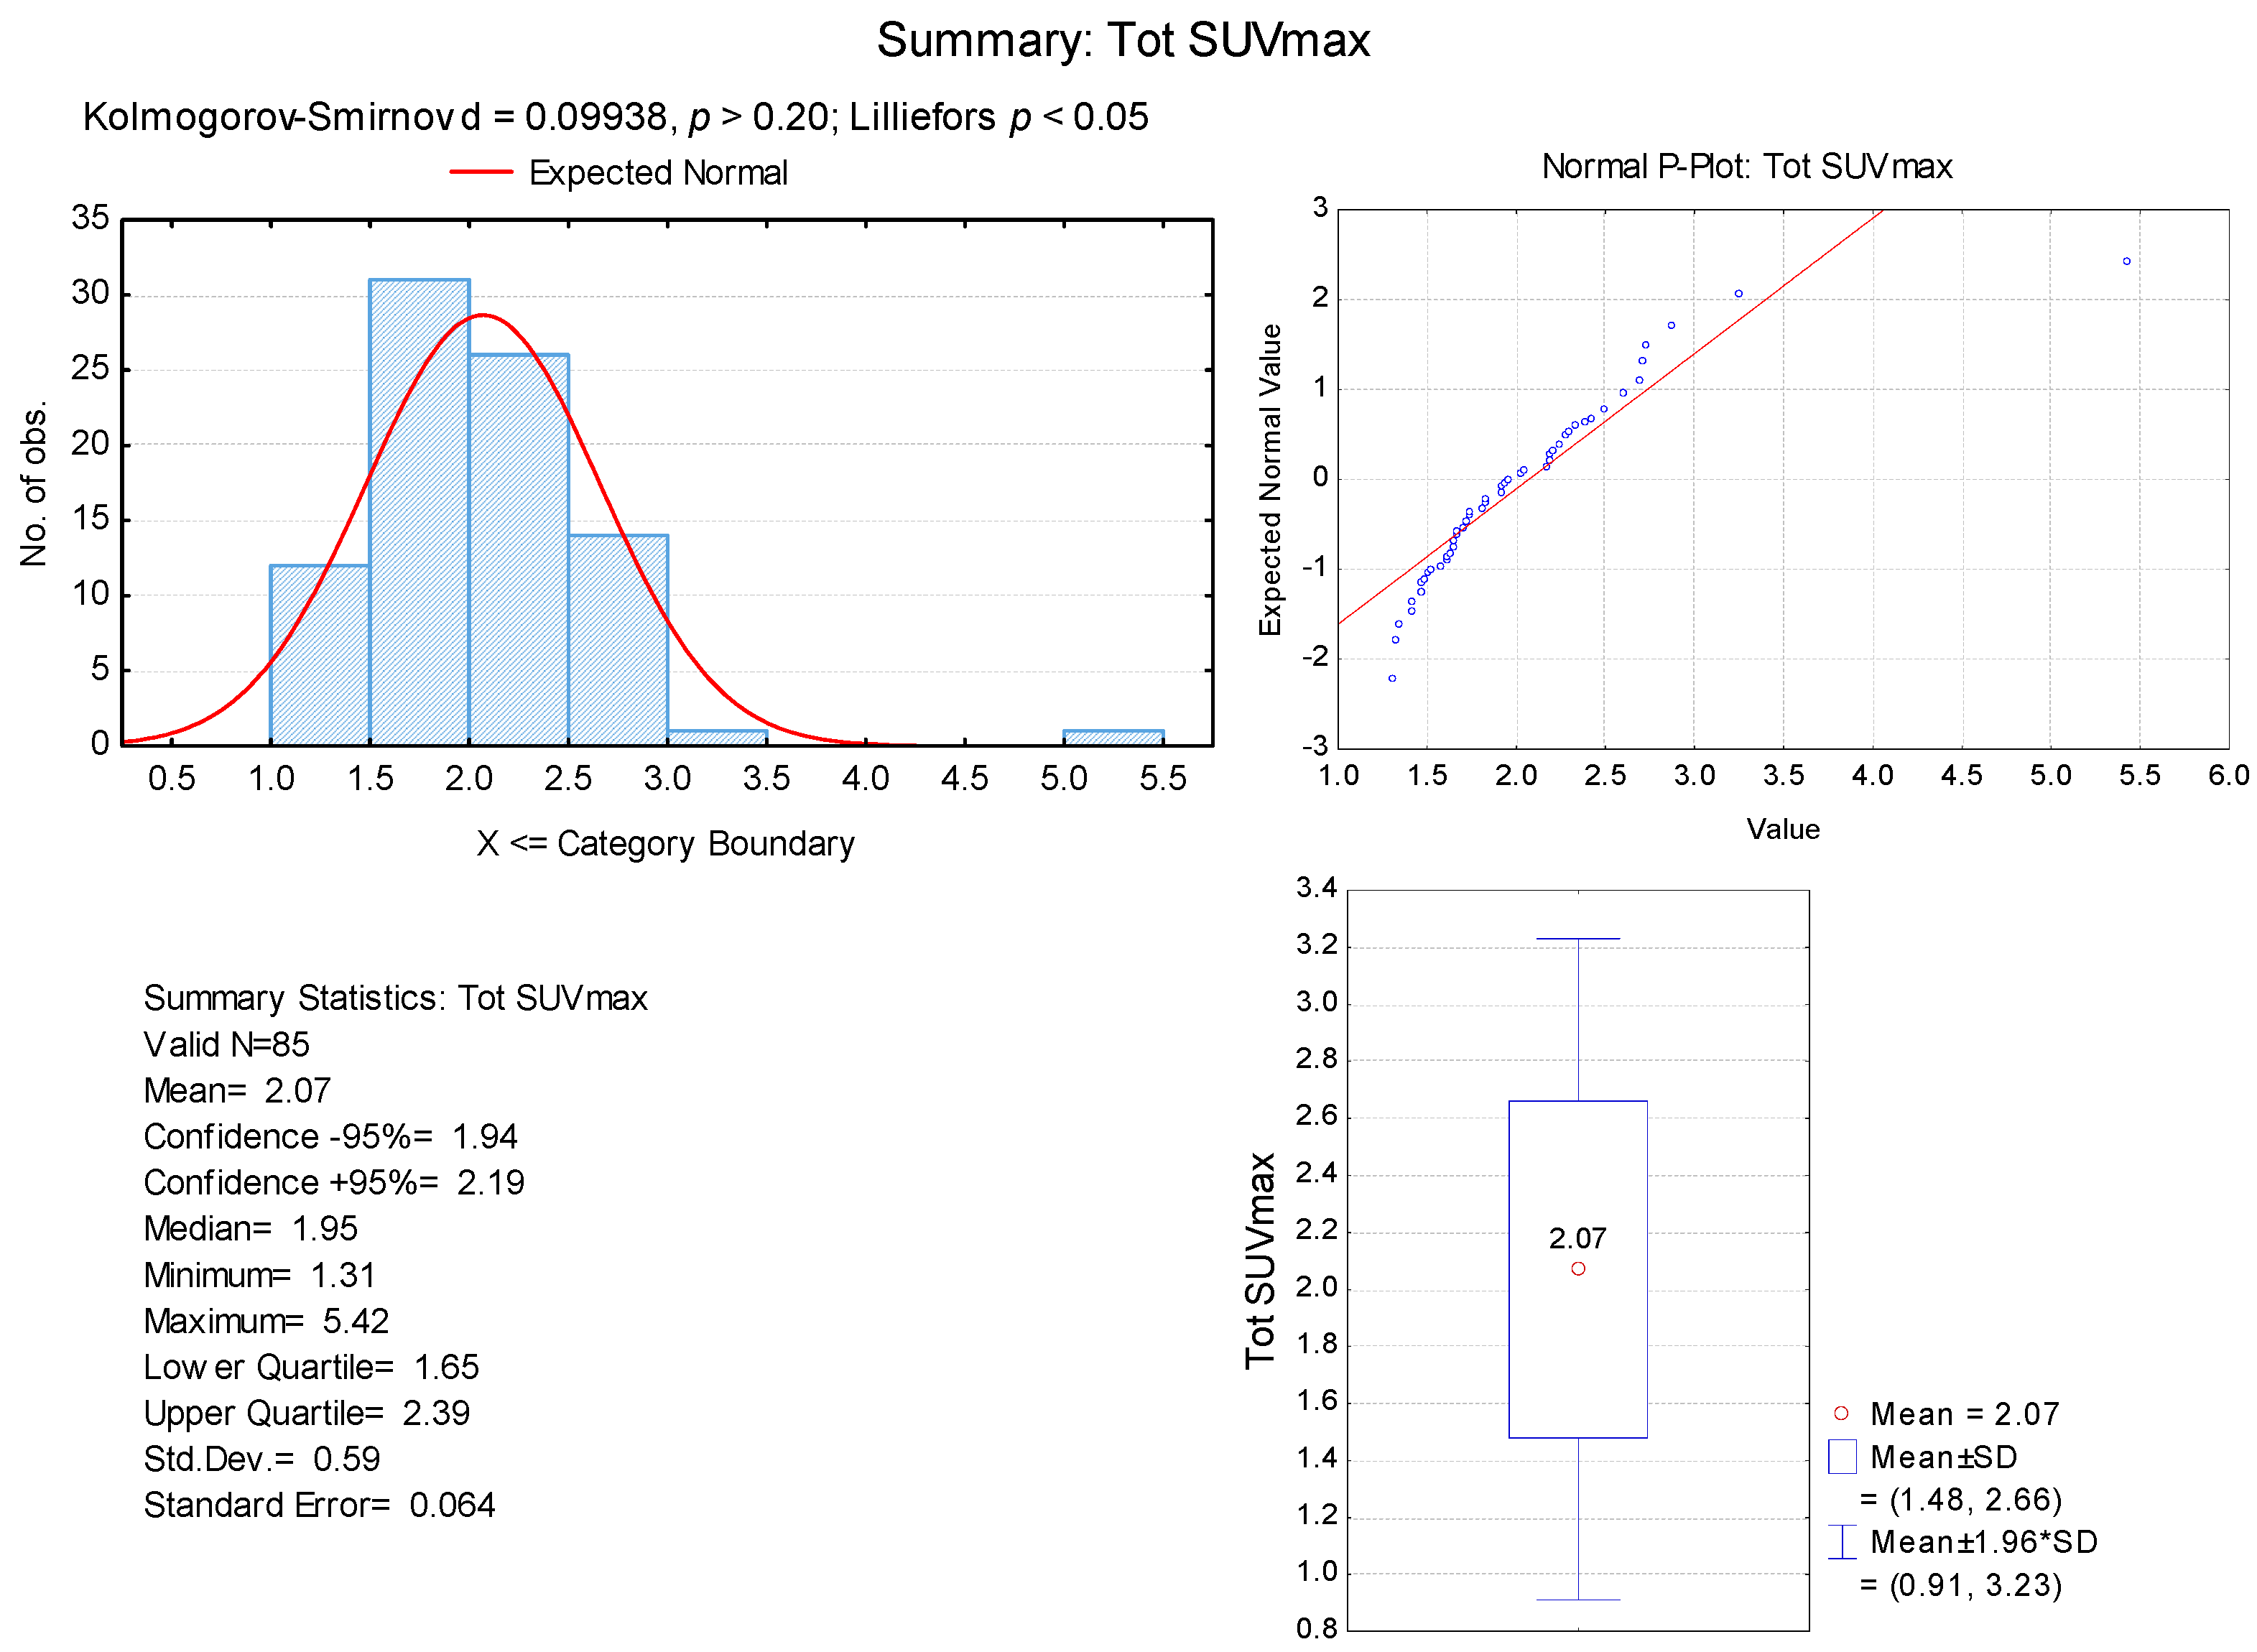
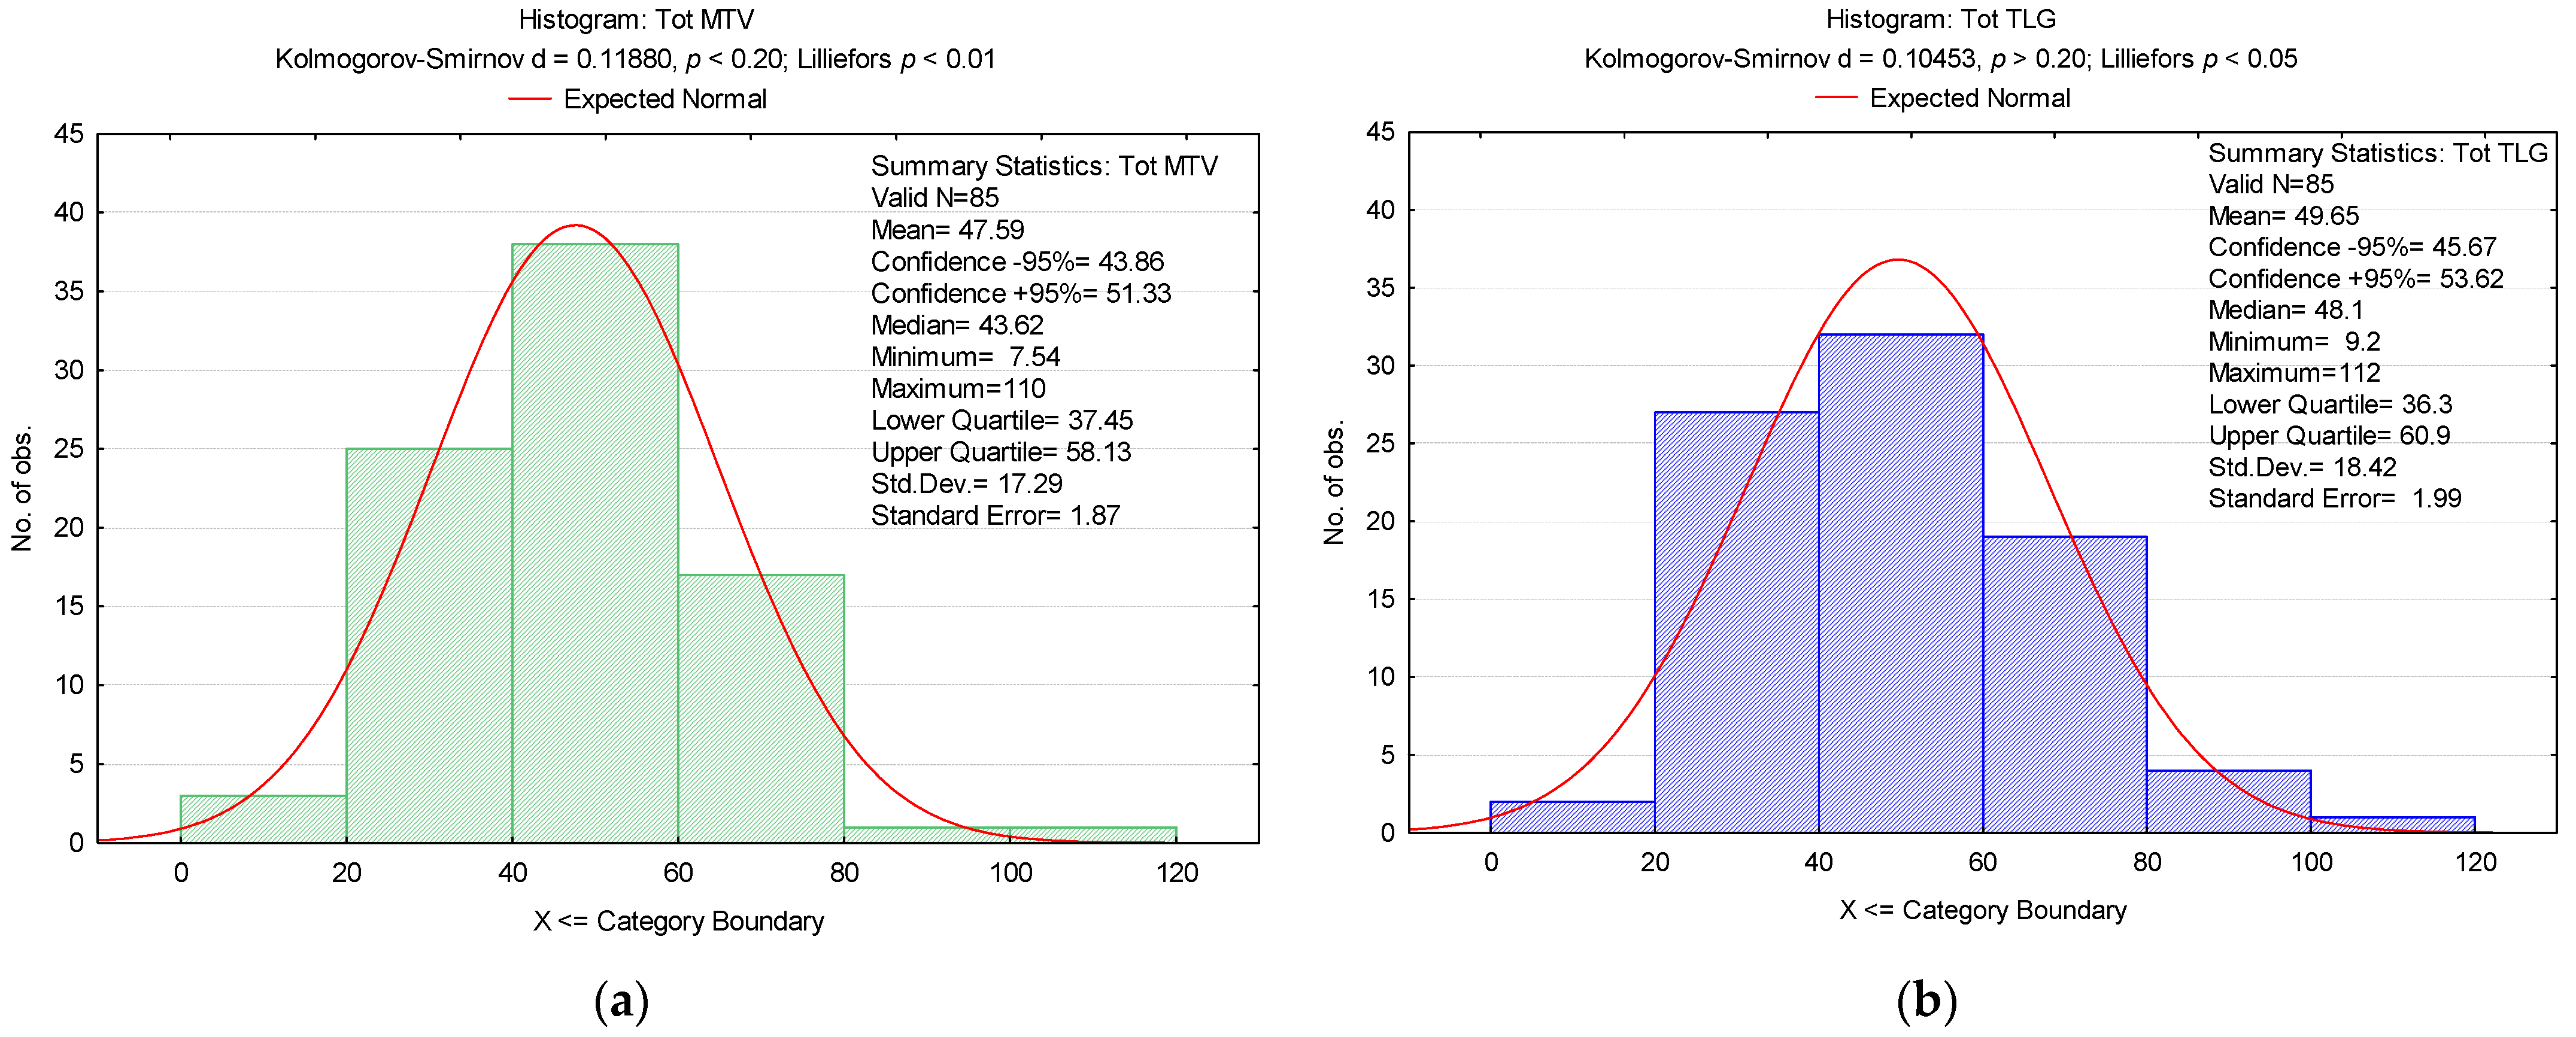
2.3.3. Quantification of BAT Activation Intensity in Every BAT+ Scan
- Total BAT SUVmax in g/mL (Tot SUVmax) = We chose the greatest value of SUVmax measured in all of the VOIs drawn from all BAT localisations;
- Total BAT SUVmean in g/mL (Tot SUVmean) = We calculated the mean of all SUVmean values measured in all of the VOIs in all BAT localisations;
- Total BAT TLG in cm3 × g/mL (Tot TLG) = We calculated the sum of all TLG values measured in all of the VOIs drawn from all BAT localisations;
- Total BAT MTV in cm3 (Tot MTV) = We calculated the sum of all MTV values measured through the ratio of Tot TLG/Tot SUVmean in all of the VOIs drawn from all BAT localisations.
- -
- Group I: Patients with BAT moderate activation (MA)—Tot SUVmax between 1–2 g/mL;
- -
- Group II: Patients with BAT high activation (HA)—Tot SUVmax > 2 g/mL.
2.4. Statistical Analysis
3. Results
4. Discussion
5. Conclusions
Author Contributions
Funding
Institutional Review Board Statement
Informed Consent Statement
Data Availability Statement
Acknowledgments
Conflicts of Interest
Abbreviations
References
- Marzola, P.; Boschi, F.; Moneta, F.; Sbarbati, A.; Zancanaro, C. Preclinical In Vivo Imaging for Fat Tissue Identification, Quantification, and Functional Characterization. Front. Pharmacol. 2016, 7, 336. [Google Scholar] [CrossRef]
- Giordano, A.; Frontini, A.; Cinti, S. Convertible Visceral Fat as a Therapeutic Target to Curb Obesity. Nat. Rev. Drug Discov. 2016, 15, 405–424. [Google Scholar] [CrossRef]
- Kuryłowicz, A.; Puzianowska-Kuźnicka, M. Induction of Adipose Tissue Browning as a Strategy to Combat Obesity. Int. J. Mol. Sci. 2020, 21, 6241. [Google Scholar] [CrossRef]
- Mu, W.-J.; Zhu, J.-Y.; Chen, M.; Guo, L. Exercise-Mediated Browning of White Adipose Tissue: Its Significance, Mechanism and Effectiveness. Int. J. Mol. Sci. 2021, 22, 11512. [Google Scholar] [CrossRef]
- Scheel, A.K.; Espelage, L.; Chadt, A. Many Ways to Rome: Exercise, Cold Exposure and Diet-Do They All Affect BAT Activation and WAT Browning in the Same Manner? Int. J. Mol. Sci. 2022, 23, 4759. [Google Scholar] [CrossRef]
- Cinti, S. The Adipose Organ: Morphological Perspectives of Adipose Tissues. Proc. Nutr. Soc. 2001, 60, 319–328. [Google Scholar] [CrossRef]
- Smorlesi, A.; Frontini, A.; Giordano, A.; Cinti, S. The Adipose Organ: White-Brown Adipocyte Plasticity and Metabolic Inflammation. Obes. Rev. 2012, 13 (Suppl. S2), 83–96. [Google Scholar] [CrossRef]
- Lidell, M.E.; Betz, M.J.; Dahlqvist Leinhard, O.; Heglind, M.; Elander, L.; Slawik, M.; Mussack, T.; Nilsson, D.; Romu, T.; Nuutila, P.; et al. Evidence for Two Types of Brown Adipose Tissue in Humans. Nat. Med. 2013, 19, 631–634. [Google Scholar] [CrossRef]
- Carpentier, A.C.; Blondin, D.P.; Virtanen, K.A.; Richard, D.; Haman, F.; Turcotte, É.E. Brown Adipose Tissue Energy Metabolism in Humans. Front. Endocrinol. 2018, 9, 447. [Google Scholar] [CrossRef]
- Cannon, B.; Nedergaard, J. Brown Adipose Tissue: Function and Physiological Significance. Physiol. Rev. 2004, 84, 277–359. [Google Scholar] [CrossRef]
- Yau, W.W.; Yen, P.M. Thermogenesis in Adipose Tissue Activated by Thyroid Hormone. Int. J. Mol. Sci. 2020, 21, 3020. [Google Scholar] [CrossRef]
- Feldmann, H.M.; Golozoubova, V.; Cannon, B.; Nedergaard, J. UCP1 Ablation Induces Obesity and Abolishes Diet-Induced Thermogenesis in Mice Exempt from Thermal Stress by Living at Thermoneutrality. Cell Metab. 2009, 9, 203–209. [Google Scholar] [CrossRef]
- Ronti, T.; Lupattelli, G.; Mannarino, E. The Endocrine Function of Adipose Tissue: An Update. Clin. Endocrinol. 2006, 64, 355–365. [Google Scholar] [CrossRef]
- Jalloul, W.; Moscalu, M.; Moscalu, R.; Jalloul, D.; Grierosu, I.C.; Ionescu, T.; Stolniceanu, C.R.; Ghizdovat, V.; Mocanu, V.; Iliescu, R.; et al. Off the Beaten Path in Oncology: Active Brown Adipose Tissue by Virtue of Molecular Imaging. Curr. Issues Mol. Biol. 2023, 45, 7891–7914. [Google Scholar] [CrossRef]
- Romacho, T.; Elsen, M.; Röhrborn, D.; Eckel, J. Adipose Tissue and Its Role in Organ Crosstalk. Acta Physiol. 2014, 210, 733–753. [Google Scholar] [CrossRef]
- Zorena, K.; Jachimowicz-Duda, O.; Ślęzak, D.; Robakowska, M.; Mrugacz, M. Adipokines and Obesity. Potential Link to Metabolic Disorders and Chronic Complications. Int. J. Mol. Sci. 2020, 21, 3570. [Google Scholar] [CrossRef]
- Maliszewska, K.; Kretowski, A. Brown Adipose Tissue and Its Role in Insulin and Glucose Homeostasis. Int. J. Mol. Sci. 2021, 22, 1530. [Google Scholar] [CrossRef]
- Aldiss, P.; Symonds, M.E.; Lewis, J.E.; Boocock, D.J.; Miles, A.K.; Bloor, I.; Ebling, F.J.P.; Budge, H. Interscapular and Perivascular Brown Adipose Tissue Respond Differently to a Short-Term High-Fat Diet. Nutrients 2019, 11, 1065. [Google Scholar] [CrossRef]
- Yang, J.; Zhang, H.; Parhat, K.; Xu, H.; Li, M.; Wang, X.; Ran, C. Molecular Imaging of Brown Adipose Tissue Mass. Int. J. Mol. Sci. 2021, 22, 9436. [Google Scholar] [CrossRef]
- Im, H.-J.; Bradshaw, T.; Solaiyappan, M.; Cho, S.Y. Current Methods to Define Metabolic Tumor Volume in Positron Emission Tomography: Which One Is Better? Nucl. Med. Mol. Imaging 2018, 52, 5. [Google Scholar] [CrossRef]
- Larson, S.M.; Erdi, Y.; Akhurst, T.; Mazumdar, M.; Macapinlac, H.A.; Finn, R.D.; Casilla, C.; Fazzari, M.; Srivastava, N.; Yeung, H.W.D.; et al. Tumor Treatment Response Based on Visual and Quantitative Changes in Global Tumor Glycolysis Using PET-FDG Imaging. The Visual Response Score and the Change in Total Lesion Glycolysis. Clin. Positron Imaging 1999, 2, 159–171. [Google Scholar] [CrossRef]
- Im, H.J.; Kim, T.S.; Park, S.-Y.; Min, H.S.; Kim, J.H.; Kang, H.G.; Park, S.E.; Kwon, M.M.; Yoon, J.H.; Park, H.J.; et al. Prediction of Tumour Necrosis Fractions Using Metabolic and Volumetric 18F-FDG PET/CT Indices, after One Course and at the Completion of Neoadjuvant Chemotherapy, in Children and Young Adults with Osteosarcoma. Eur. J. Nucl. Med. Mol. Imaging 2012, 39, 39–49. [Google Scholar] [CrossRef]
- Im, H.-J.; Kim, Y.K.; Kim, Y.-I.; Lee, J.J.; Lee, W.W.; Kim, S.E. Usefulness of Combined Metabolic-Volumetric Indices of 18F-FDG PET/CT for the Early Prediction of Neoadjuvant Chemotherapy Outcomes in Breast Cancer. Nucl. Med. Mol. Imaging 2013, 47, 36–43. [Google Scholar] [CrossRef]
- Lee, J.W.; Kang, C.M.; Choi, H.J.; Lee, W.J.; Song, S.Y.; Lee, J.-H.; Lee, J.D. Prognostic Value of Metabolic Tumor Volume and Total Lesion Glycolysis on Preoperative 18F-FDG PET/CT in Patients with Pancreatic Cancer. J. Nucl. Med. 2014, 55, 898–904. [Google Scholar] [CrossRef]
- Choi, E.-S.; Ha, S.-G.; Kim, H.-S.; Ha, J.H.; Paeng, J.C.; Han, I. Total Lesion Glycolysis by 18F-FDG PET/CT Is a Reliable Predictor of Prognosis in Soft-Tissue Sarcoma. Eur. J. Nucl. Med. Mol. Imaging 2013, 40, 1836–1842. [Google Scholar] [CrossRef]
- Boellaard, R.; Delgado-Bolton, R.; Oyen, W.J.G.; Giammarile, F.; Tatsch, K.; Eschner, W.; Verzijlbergen, F.J.; Barrington, S.F.; Pike, L.C.; Weber, W.A.; et al. FDG PET/CT: EANM Procedure Guidelines for Tumour Imaging: Version 2.0. Eur. J. Nucl. Med. Mol. Imaging 2015, 42, 328–354. [Google Scholar] [CrossRef]
- Chen, K.Y.; Cypess, A.M.; Laughlin, M.R.; Haft, C.R.; Hu, H.H.; Bredella, M.A.; Enerbäck, S.; Kinahan, P.E.; Lichtenbelt, W.V.M.; Lin, F.I.; et al. Brown Adipose Reporting Criteria in Imaging STudies (BARCIST 1.0): Recommendations for Standardized FDG-PET/CT Experiments in Humans. Cell Metab. 2016, 24, 210–222. [Google Scholar] [CrossRef]
- Martinez-Tellez, B.; Nahon, K.J.; Sanchez-Delgado, G.; Abreu-Vieira, G.; Llamas-Elvira, J.M.; van Velden, F.H.P.; Pereira Arias-Bouda, L.M.; Rensen, P.C.N.; Boon, M.R.; Ruiz, J.R. The Impact of Using BARCIST 1.0 Criteria on Quantification of BAT Volume and Activity in Three Independent Cohorts of Adults. Sci. Rep. 2018, 8, 8567. [Google Scholar] [CrossRef]
- Carey, A.L.; Formosa, M.F.; Van Every, B.; Bertovic, D.; Eikelis, N.; Lambert, G.W.; Kalff, V.; Duffy, S.J.; Cherk, M.H.; Kingwell, B.A. Ephedrine Activates Brown Adipose Tissue in Lean but Not Obese Humans. Diabetologia 2013, 56, 147–155. [Google Scholar] [CrossRef]
- Ouellet, V.; Routhier-Labadie, A.; Bellemare, W.; Lakhal-Chaieb, L.; Turcotte, E.; Carpentier, A.C.; Richard, D. Outdoor Temperature, Age, Sex, Body Mass Index, and Diabetic Status Determine the Prevalence, Mass, and Glucose-Uptake Activity of 18F-FDG-Detected BAT in Humans. J. Clin. Endocrinol. Metab. 2011, 96, 192–199. [Google Scholar] [CrossRef]
- Admiraal, W.M.; Verberne, H.J.; Karamat, F.A.; Soeters, M.R.; Hoekstra, J.B.L.; Holleman, F. Cold-Induced Activity of Brown Adipose Tissue in Young Lean Men of South-Asian and European Origin. Diabetologia 2013, 56, 2231–2237. [Google Scholar] [CrossRef] [PubMed]
- Tatewaki, Y.; Terao, C.M.; Ariake, K.; Saito, R.; Mutoh, T.; Shimomura, H.; Motoi, F.; Mizuma, M.; Odagiri, H.; Unno, M.; et al. Defining the Optimal Method for Measuring Metabolic Tumor Volume on Preoperative 18F-Fluorodeoxyglucose-Positron Emission Tomography/Computed Tomography as a Prognostic Predictor in Patients with Pancreatic Ductal Adenocarcinoma. Front. Oncol. 2021, 11, 646141. [Google Scholar] [CrossRef] [PubMed]
- Erdi, Y.E.; Mawlawi, O.; Larson, S.M.; Imbriaco, M.; Yeung, H.; Finn, R.; Humm, J.L. Segmentation of Lung Lesion Volume by Adaptive Positron Emission Tomography Image Thresholding. Cancer 1997, 80, 2505–2509. [Google Scholar] [CrossRef]
- Burger, I.A.; Vargas, H.A.; Apte, A.; Beattie, B.J.; Humm, J.L.; Gonen, M.; Larson, S.M.; Ross Schmidtlein, C. PET Quantification with a Histogram Derived Total Activity Metric: Superior Quantitative Consistency Compared to Total Lesion Glycolysis with Absolute or Relative SUV Thresholds in Phantoms and Lung Cancer Patients. Nucl. Med. Biol. 2014, 41, 410–418. [Google Scholar] [CrossRef]
- McDonald, J.E.; Kessler, M.M.; Gardner, M.W.; Buros, A.F.; Ntambi, J.A.; Waheed, S.; van Rhee, F.; Zangari, M.; Heuck, C.J.; Petty, N.; et al. Assessment of Total Lesion Glycolysis by 18F FDG PET/CT Significantly Improves Prognostic Value of GEP and ISS in Myeloma. Clin. Cancer Res. 2017, 23, 1981–1987. [Google Scholar] [CrossRef] [PubMed]
- Brendle, C.; Stefan, N.; Grams, E.; Soekler, M.; la Fougère, C.; Pfannenberg, C. Determinants of Activity of Brown Adipose Tissue in Lymphoma Patients. Sci. Rep. 2020, 10, 21802. [Google Scholar] [CrossRef]
- Guerra, C.; Navarro, P.; Valverde, A.M.; Arribas, M.; Brüning, J.; Kozak, L.P.; Kahn, C.R.; Benito, M. Brown Adipose Tissue-Specific Insulin Receptor Knockout Shows Diabetic Phenotype without Insulin Resistance. J. Clin. Investig. 2001, 108, 1205–1213. [Google Scholar] [CrossRef]
- Gunawardana, S.C.; Piston, D.W. Reversal of Type 1 Diabetes in Mice by Brown Adipose Tissue Transplant. Diabetes 2012, 61, 674–682. [Google Scholar] [CrossRef]
- Bartelt, A.; Bruns, O.T.; Reimer, R.; Hohenberg, H.; Ittrich, H.; Peldschus, K.; Kaul, M.G.; Tromsdorf, U.I.; Weller, H.; Waurisch, C.; et al. Brown Adipose Tissue Activity Controls Triglyceride Clearance. Nat. Med. 2011, 17, 200–205. [Google Scholar] [CrossRef]
- Vosselman, M.J.; van Marken Lichtenbelt, W.D.; Schrauwen, P. Energy Dissipation in Brown Adipose Tissue: From Mice to Men. Mol. Cell. Endocrinol. 2013, 379, 43–50. [Google Scholar] [CrossRef]
- Wang, X.; Minze, L.J.; Shi, Z.-Z. Functional Imaging of Brown Fat in Mice with 18F-FDG Micro-PET/CT. J. Vis. Exp. 2012, 69, e4060. [Google Scholar] [CrossRef]
- Ter Voert, E.E.G.W.; Svirydenka, H.; Müller, J.; Becker, A.S.; Balaz, M.; Efthymiou, V.; Maushart, C.I.; Gashi, G.; Wolfrum, C.; Betz, M.J.; et al. Low-Dose 18F-FDG TOF-PET/MR for Accurate Quantification of Brown Adipose Tissue in Healthy Volunteers. EJNMMI Res. 2020, 10, 5. [Google Scholar] [CrossRef] [PubMed]
- Jalloul, W.; Moscalu, M.; Grierosu, I.; Ionescu, T.; Stolniceanu, C.R.; Gutu, M.; Ghizdovat, V.; Mocanu, V.; Azoicai, D.; Iliescu, R.; et al. Brown Adipose Tissue Biodistribution and Correlations Particularities in Parathyroid Pathology Personalized Diagnosis. Diagnostics 2022, 12, 3182. [Google Scholar] [CrossRef] [PubMed]
- Chondronikola, M.; Beeman, S.C.; Wahl, R.L. Non-Invasive Methods for the Assessment of Brown Adipose Tissue in Humans. J. Physiol. 2018, 596, 363–378. [Google Scholar] [CrossRef]
- Bahler, L.; Holleman, F.; Booij, J.; Hoekstra, J.B.; Verberne, H.J. Interobserver and Intraobserver Variability for the Assessment of Brown Adipose Tissue Activity on 18F-FDG PET-CT. Nucl. Med. Commun. 2016, 37, 363–371. [Google Scholar] [CrossRef]
- Sampath, S.C.; Sampath, S.C.; Bredella, M.A.; Cypess, A.M.; Torriani, M. Imaging of Brown Adipose Tissue: State of the Art. Radiology 2016, 280, 4–19. [Google Scholar] [CrossRef]
- Becker, A.S.; Zellweger, C.; Schawkat, K.; Bogdanovic, S.; Phi van, V.D.; Nagel, H.W.; Wolfrum, C.; Burger, I.A. In-Depth Analysis of Interreader Agreement and Accuracy in Categorical Assessment of Brown Adipose Tissue in (18)FDG-PET/CT. Eur. J. Radiol. 2017, 91, 41–46. [Google Scholar] [CrossRef]
- Ong, F.J.; Ahmed, B.A.; Oreskovich, S.M.; Blondin, D.P.; Haq, T.; Konyer, N.B.; Noseworthy, M.D.; Haman, F.; Carpentier, A.C.; Morrison, K.M.; et al. Recent Advances in the Detection of Brown Adipose Tissue in Adult Humans: A Review. Clin. Sci. 2018, 132, 1039–1054. [Google Scholar] [CrossRef]
- Sun, L.; Verma, S.; Michael, N.; Chan, S.P.; Yan, J.; Sadananthan, S.A.; Camps, S.G.; Goh, H.J.; Govindharajulu, P.; Totman, J.; et al. Brown Adipose Tissue: Multimodality Evaluation by PET, MRI, Infrared Thermography, and Whole-Body Calorimetry (TACTICAL-II). Obesity 2019, 27, 1434–1442. [Google Scholar] [CrossRef]
- Branca, R.T.; McCallister, A.; Yuan, H.; Aghajanian, A.; Faber, J.E.; Weimer, N.; Buchanan, R.; Floyd, C.S.; Antonacci, M.; Zhang, L.; et al. Accurate Quantification of Brown Adipose Tissue Mass by Xenon-Enhanced Computed Tomography. Proc. Natl. Acad. Sci. USA 2018, 115, 174–179. [Google Scholar] [CrossRef]
- Malek, E.; Sendilnathan, A.; Yellu, M.; Petersen, A.; Fernandez-Ulloa, M.; Driscoll, J.J. Metabolic Tumor Volume on Interim PET Is a Better Predictor of Outcome in Diffuse Large B-Cell Lymphoma than Semiquantitative Methods. Blood Cancer J. 2015, 5, e326. [Google Scholar] [CrossRef]
- Pak, K.; Cheon, G.J.; Nam, H.-Y.; Kim, S.-J.; Kang, K.W.; Chung, J.-K.; Kim, E.E.; Lee, D.S. Prognostic Value of Metabolic Tumor Volume and Total Lesion Glycolysis in Head and Neck Cancer: A Systematic Review and Meta-Analysis. J. Nucl. Med. 2014, 55, 884–890. [Google Scholar] [CrossRef]
- Kim, D.-H.; Son, S.H.; Kim, C.-Y.; Hong, C.M.; Oh, J.-R.; Song, B.-I.; Kim, H.W.; Jeong, S.Y.; Lee, S.-W.; Lee, J.; et al. Prediction for Recurrence Using F-18 FDG PET/CT in Pathologic N0 Lung Adenocarcinoma after Curative Surgery. Ann. Surg. Oncol. 2014, 21, 589–596. [Google Scholar] [CrossRef] [PubMed]
- Byun, B.H.; Kong, C.-B.; Park, J.; Seo, Y.; Lim, I.; Choi, C.W.; Cho, W.H.; Jeon, D.-G.; Koh, J.-S.; Lee, S.-Y.; et al. Initial Metabolic Tumor Volume Measured by 18F-FDG PET/CT Can Predict the Outcome of Osteosarcoma of the Extremities. J. Nucl. Med. 2013, 54, 1725–1732. [Google Scholar] [CrossRef] [PubMed]
- Zhang, H.; Wroblewski, K.; Liao, S.; Kampalath, R.; Penney, B.C.; Zhang, Y.; Pu, Y. Prognostic Value of Metabolic Tumor Burden from (18)F-FDG PET in Surgical Patients with Non-Small-Cell Lung Cancer. Acad. Radiol. 2013, 20, 32–40. [Google Scholar] [CrossRef]
- La, T.H.; Filion, E.J.; Turnbull, B.B.; Chu, J.N.; Lee, P.; Nguyen, K.; Maxim, P.; Quon, A.; Graves, E.E.; Loo, B.W.; et al. Metabolic Tumor Volume Predicts for Recurrence and Death in Head-and-Neck Cancer. Int. J. Radiat. Oncol. Biol. Phys. 2009, 74, 1335–1341. [Google Scholar] [CrossRef] [PubMed]
- Chung, H.H.; Kwon, H.W.; Kang, K.W.; Park, N.-H.; Song, Y.-S.; Chung, J.-K.; Kang, S.-B.; Kim, J.W. Prognostic Value of Preoperative Metabolic Tumor Volume and Total Lesion Glycolysis in Patients with Epithelial Ovarian Cancer. Ann. Surg. Oncol. 2012, 19, 1966–1972. [Google Scholar] [CrossRef] [PubMed]
- Chen, H.H.W.; Chiu, N.-T.; Su, W.-C.; Guo, H.-R.; Lee, B.-F. Prognostic Value of Whole-Body Total Lesion Glycolysis at Pretreatment FDG PET/CT in Non-Small Cell Lung Cancer. Radiology 2012, 264, 559–566. [Google Scholar] [CrossRef]
- Benz, M.R.; Allen-Auerbach, M.S.; Eilber, F.C.; Chen, H.J.J.; Dry, S.; Phelps, M.E.; Czernin, J.; Weber, W.A. Combined Assessment of Metabolic and Volumetric Changes for Assessment of Tumor Response in Patients with Soft-Tissue Sarcomas. J. Nucl. Med. 2008, 49, 1579–1584. [Google Scholar] [CrossRef]
- Cheebsumon, P.; van Velden, F.H.P.; Yaqub, M.; Frings, V.; de Langen, A.J.; Hoekstra, O.S.; Lammertsma, A.A.; Boellaard, R. Effects of Image Characteristics on Performance of Tumor Delineation Methods: A Test-Retest Assessment. J. Nucl. Med. 2011, 52, 1550–1558. [Google Scholar] [CrossRef]
- Moon, S.H.; Hyun, S.H.; Choi, J.Y. Prognostic Significance of Volume-Based PET Parameters in Cancer Patients. Korean J. Radiol. 2013, 14, 1–12. [Google Scholar] [CrossRef] [PubMed]
- Im, H.-J.; Pak, K.; Cheon, G.J.; Kang, K.W.; Kim, S.-J.; Kim, I.-J.; Chung, J.-K.; Kim, E.E.; Lee, D.S. Prognostic Value of Volumetric Parameters of 18F-FDG PET in Non-Small-Cell Lung Cancer: A Meta-Analysis. Eur. J. Nucl. Med. Mol. Imaging 2015, 42, 241–251. [Google Scholar] [CrossRef] [PubMed]
- Im, H.-J.; Oo, S.; Jung, W.; Jang, J.-Y.; Kim, S.-W.; Cheon, G.J.; Kang, K.W.; Chung, J.-K.; Kim, E.E.; Lee, D.S. Prognostic Value of Metabolic and Volumetric Parameters of Preoperative FDG-PET/CT in Patients With Resectable Pancreatic Cancer. Medicine 2016, 95, e3686. [Google Scholar] [CrossRef]


| Clinical Characteristics | Total Patients n= 85 | MA n= 43 | HA n= 42 | p-Value |
| Age, median (IQR), years | 67 (60–73) | 67 (61–74) | 68 (53–72) | 0.391 |
| Age, mean (SD), years | 64.2 ± 12.4 | 66.7 (8.1) | 61.7 (15.3) | |
| Gender, female/male, n (%) | 25 (29.4)/60 (70.6) | 11 (25.6)/32 (74.4) | 14 (33.3)/28 (66.7) | 0.432 |
| BMI, median (IQR), kg/m2 | 25.8 (22.7–29.8) | 25.2 (21.9–30.4) | 26 (23.3–27.9) | 0.961 |
| BMI, mean (SD), kg/m2 | 25.9 (4.81) | 26.1 (5.1) | 25.8 (4.5) | |
| Diagnostic, n (%) | ||||
| Melanoma | 5 (5.9) | 3 (7) | 2 (4.8) | 0.501 |
| Non-Hodgkin’s lymphoma | 1 (1.2) | 0 (0) | 1 (2.4) | |
| Hodgkin’s lymphoma | 3 (3.5) | 1 (2.3) | 2 (4.8) | |
| Kaposi’s sarcoma | 1 (1.2) | 1 (2.3) | 0 (0) | |
| ENT cancer | 12 (14.1) | 6 (14) | 6 (14.3) | |
| Lung cancer | 18 (21.2) | 13 (30.2) | 5 (11.9) | |
| Esophageal cancer | 2 (2.4) | 1 (2.3) | 1 (2.4) | |
| Pancreatic cancer | 3 (3.5) | 1 (2.3) | 2 (4.8) | |
| Gastric cancer | 3 (3.5) | 1 (2.3) | 2 (4.8) | |
| Hepatic cancer | 2 (2.4) | 1 (2.3) | 1 (2.4) | |
| Colon cancer/Rectal cancer | 19 (22.4) | 9 (20.9) | 10 (23.8) | |
| Breast cancer | 3 (3.5) | 1 (2.3) | 2 (4.8) | |
| Testicular cancer | 2 (2.4) | 1 (2.3) | 1 (2.4) | |
| Uterine cancer | 5 (5.9) | 3 (7) | 2 (4.8) | |
| Ovarian cancer | 2 (2.4) | 0 (0) | 2 (4.8) | |
| Unknown primary cancers | 4 (4.7) | 1 (2.3) | 3 (7.1) | |
| Treatment, n(%) | ||||
| with surgical treatment | 46 (54.1) | 25 (58.1) | 21 (50) | 0.451 |
| chemotherapy | 16 (18.8) | 8 (18.6) | 8 (19) | |
| radiotherapy | 1 (1.2) | 0 (0) | 1 (2.4) | |
| chemotherapy + radiotherapy | 11 (12.9) | 7 (16.3) | 4 (9.5) | |
| without chemotherapy/radiotherapy | 18 (21.2) | 10 (23.3) | 8 (19) | |
| without surgical treatment | 39 (45.9) | 18 (41.9) | 21 (50) | |
| chemotherapy | 30 (35.3) | 15 (34.9) | 15 (35.7) | |
| radiotherapy | 1 (1.2) | 1 (2.3) | 0 (0) | |
| chemotherapy + radiotherapy | 8 (9.4) | 2 (4.7) | 6 (14.3) |
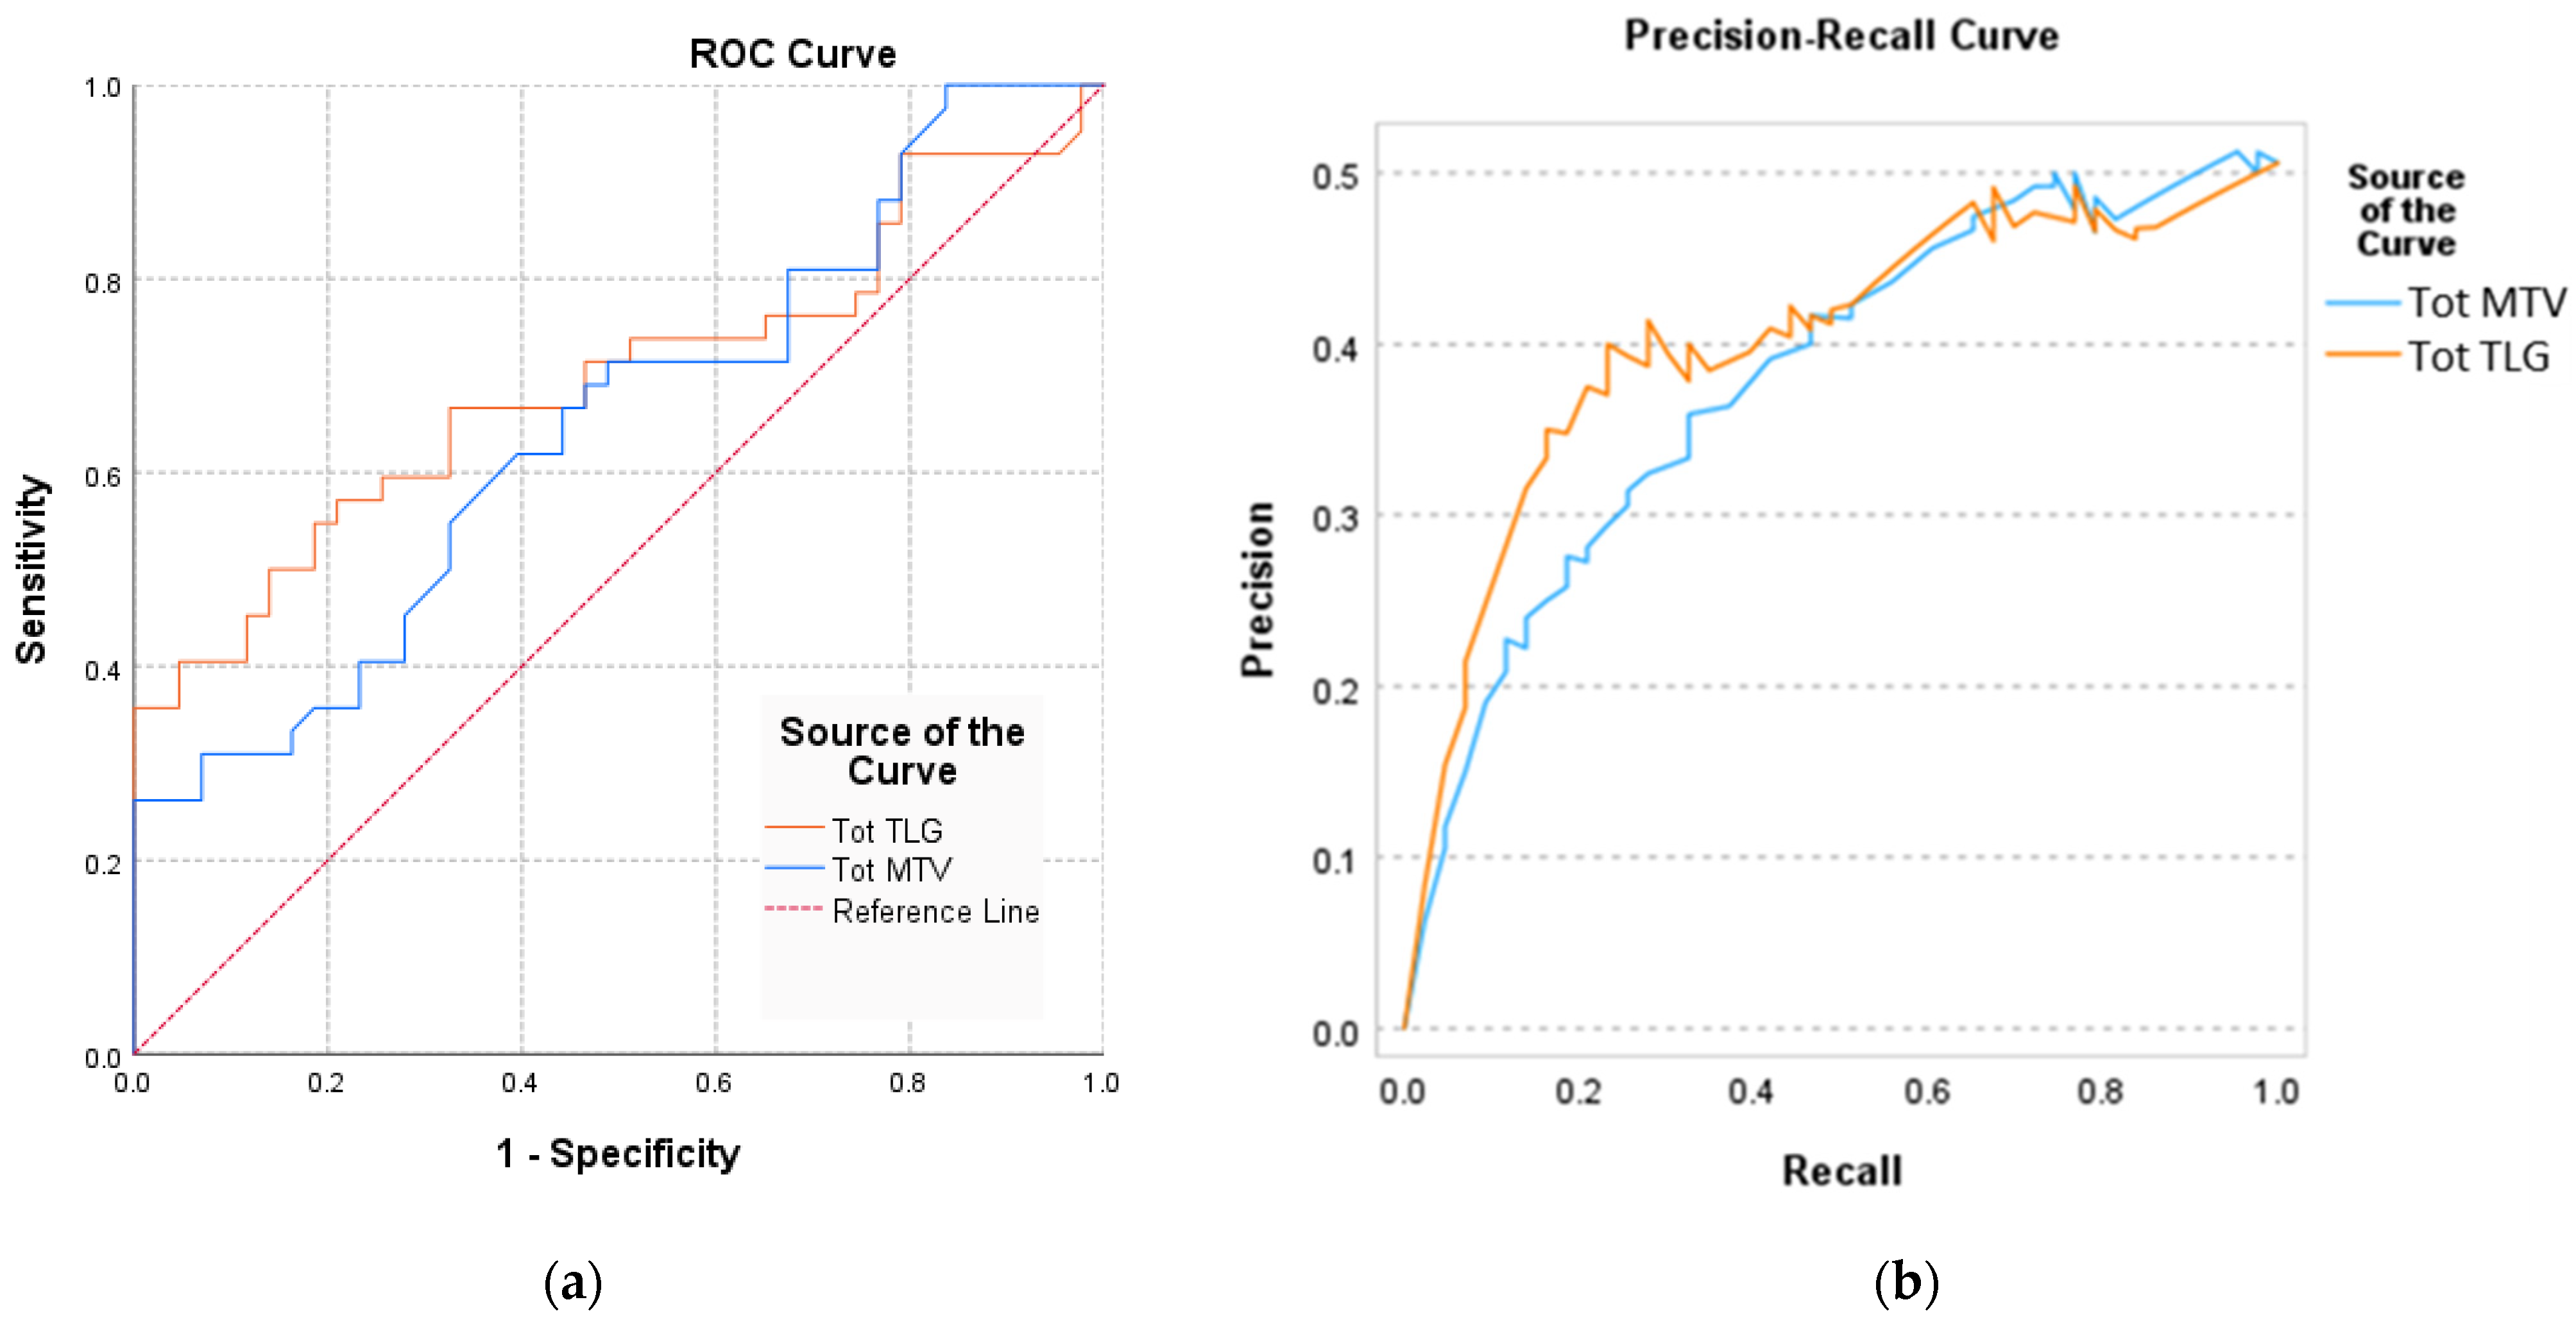
| Area under the Curve AUC (95%CI) | Std. Error | p-Value | |
|---|---|---|---|
| Tot MTV | 0.694 (0.579–0.809) | 0.059 | 0.001 * |
| Tot TLG | 0.721 (0.654–0.832) | 0.062 | 0.013 * |
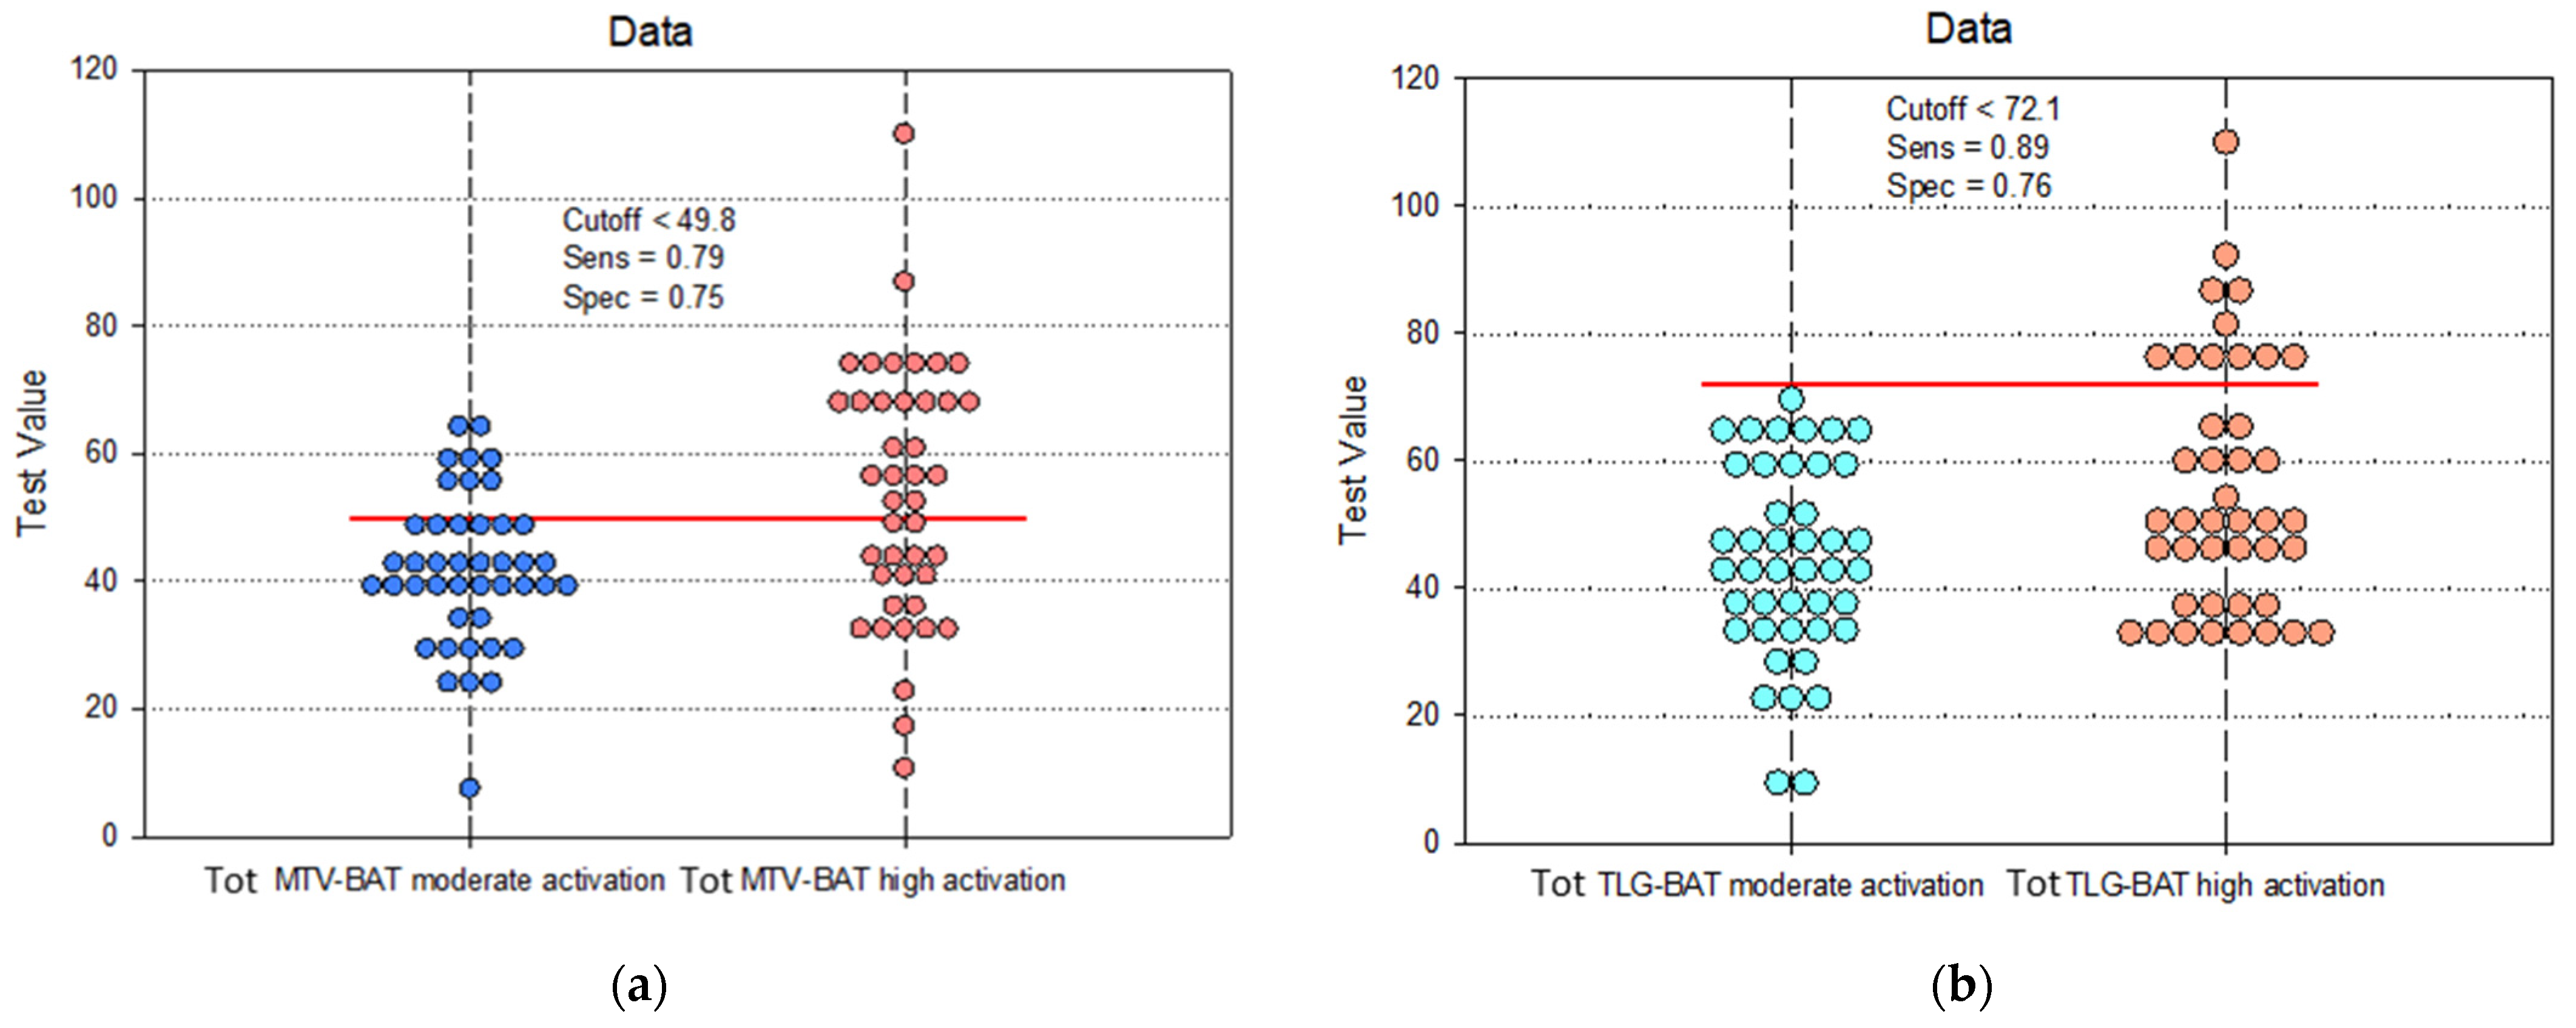
| Sensitivity | 95% CI | Specificity | 95% CI | PPV | NPV | Cutoff | |
|---|---|---|---|---|---|---|---|
| Tot MTV | 0.79 | 0.67 to 0.91 | 0.75 | 0.69 to 0.87 | 0.85 | 0.83 | 49.8 |
| Tot TLG | 0.89 | 0.71 to 0.92 | 0.76 | 0.68 to 0.94 | 0.73 | 0.87 | 72.1 |
Disclaimer/Publisher’s Note: The statements, opinions and data contained in all publications are solely those of the individual author(s) and contributor(s) and not of MDPI and/or the editor(s). MDPI and/or the editor(s) disclaim responsibility for any injury to people or property resulting from any ideas, methods, instructions or products referred to in the content. |
© 2024 by the authors. Licensee MDPI, Basel, Switzerland. This article is an open access article distributed under the terms and conditions of the Creative Commons Attribution (CC BY) license (https://creativecommons.org/licenses/by/4.0/).
Share and Cite
Jalloul, W.; Moscalu, M.; Moscalu, R.; Jalloul, D.; Grierosu, I.C.; Gutu, M.; Haba, D.; Mocanu, V.; Gutu, M.M.; Stefanescu, C. Are MTV and TLG Accurate for Quantifying the Intensity of Brown Adipose Tissue Activation? Biomedicines 2024, 12, 151. https://doi.org/10.3390/biomedicines12010151
Jalloul W, Moscalu M, Moscalu R, Jalloul D, Grierosu IC, Gutu M, Haba D, Mocanu V, Gutu MM, Stefanescu C. Are MTV and TLG Accurate for Quantifying the Intensity of Brown Adipose Tissue Activation? Biomedicines. 2024; 12(1):151. https://doi.org/10.3390/biomedicines12010151
Chicago/Turabian StyleJalloul, Wael, Mihaela Moscalu, Roxana Moscalu, Despina Jalloul, Irena Cristina Grierosu, Mihaela Gutu, Danisia Haba, Veronica Mocanu, Mihai Marius Gutu, and Cipriana Stefanescu. 2024. "Are MTV and TLG Accurate for Quantifying the Intensity of Brown Adipose Tissue Activation?" Biomedicines 12, no. 1: 151. https://doi.org/10.3390/biomedicines12010151