Abstract
Stroke and dementia have been linked to the appearance of white matter hyperintensities (WMHs). Meanwhile, diffusion tensor imaging (DTI) might capture the microstructural change in white matter early. Specific dietary interventions may help to reduce the risk of WMHs. However, research on the relationship between specific nutrients and white matter changes is still lacking. We aimed to investigate the causal effects of essential nutrients (amino acids, fatty acids, mineral elements, and vitamins) on WMHs and DTI measures, including fraction anisotropy (FA) and mean diffusivity (MD), by a Mendelian randomization analysis. We selected single nucleotide polymorphisms (SNPs) associated with each nutrient as instrumental variables to assess the causal effects of nutrient-related exposures on WMHs, FA, and MD. The outcome was from a recently published large-scale European Genome Wide Association Studies pooled dataset, including WMHs (N = 18,381), FA (N = 17,663), and MD (N = 17,467) data. We used the inverse variance weighting (IVW) method as the primary method, and sensitivity analyses were conducted using the simple median, weighted median, and MR-Egger methods. Genetically predicted serum calcium level was positively associated with WMHs risk, with an 8.1% increase in WMHs risk per standard deviation unit increase in calcium concentration (OR = 1.081, 95% CI = 1.006–1.161, p = 0.035). The plasma linoleic acid level was negatively associated with FA (OR = 0.776, 95% CI = 0.616–0.978, p = 0.032). Our study demonstrated that genetically predicted calcium was a potential risk factor for WMHs, and linoleic acid may be negatively associated with FA, providing evidence for interventions from the perspective of gene-environment interactions.
1. Introduction
White matter hyperintensities (WMHs) are defined as periventricular and subcortical (semi-ovoid centers) low-density bands on CT or high signal areas on magnetic resonance imaging T2-weighted images, showing patchy or diffuse patchy lesions [1]. WMHs increase with age and are considered as markers of cerebral small vessel diseases and are associated with the increased risk of stroke and dementia [2]. Although their pathogenesis is uncertain, WMHs are usually thought to result from chronic cerebral hypoperfusion, altered vascular permeability, blood–brain barrier dysfunction, and inflammation reaction [3,4,5,6].
Diffusion tensor imaging (DTI) is a quantitative MRI technique that measures the movement of water within the tissue microstructure [7,8]. DTI measures white matter changes both in areas of WMHs and in normal appearing white matter, which indicates that DTI might be more sensitive than WMHs and might be a biomarker to monitor the progression of white matter changes. Two DTI measures that are commonly used to provide information about the white matter microstructure are fractional anisotropy (FA) and mean diffusivity (MD). FA measures the direction of diffusion to reflect the integrity of white matter bundles, and MD measures the diffusion of water molecules to reflect diffuse white matter injury [8]. A lower FA and higher MD reflect lower microstructural connectivity and capture early damage to white matter and are more useful in predicting diseases such as dementia than WMHs [2,9,10].
Essential nutrients, including vitamins, amino acids, fatty acids, and minerals, can be obtained from the diet. Previous studies showed that some nutrients, e.g., vitamins, minerals, and ω3 polyunsaturated fatty acids contained in the diet that is rich in vegetables, fruits, nuts, cereals and fish, were associated with the decreased risk of brain aging, cardiovascular diseases, and cognitive impairment [11]. Given that stroke and cognitive impairment are also related to white matter changes, specific diet or nutrients are assumed to play a role in white matter changes, which was supported by a few studies [12,13,14,15,16] while other studies presented inconsistent results [14,16]. The different methodologies, such as nutrient measurement and the duration of observation and intervention, could partially explain the inconsistency and demonstrate the challenges in studies focused on nutrients. Randomized controlled trials (RCTs) have been recognized to overcome the limitations of observational studies and to provide the highest level of evidence [17], but there have been no previous RCTs to determine the effects of essential nutrients on WMHs. Mendelian randomization (MR) analysis can evaluate the causal inference of modifiable factors on disease risk based on genetic data. MR analysis uses single nucleotide polymorphisms (SNPs) as instrumental variables (IVs), mimicking random assignment by naturally assigning alleles, which are less susceptible to confounding bias or reverse causation [18].
In this study, we used a two-sample MR approach to investigate whether genetically predicted levels of essential nutrients including amino acids, fatty acids, minerals, and vitamins are associated with WMHs and two DTI measures, FA and MD.
2. Materials and Methods
2.1. Exposure and Outcome Data
Essential nutrients of several types, namely, amino acids, fatty acids, minerals, and vitamins, were chosen as exposures. Exposure-related SNPs were obtained from the largest genome-wide association studies (GWASs) in European populations that were published most recently and available from PubMed [19,20,21,22,23,24,25,26,27,28,29,30,31,32,33,34]. Amino acid-related SNPs were extracted from isoleucine, leucine, lysine, methionine, phenylalanine, tryptophan, and valine datasets [19,20]. The essential fatty acids considered were ω3 polyunsaturated fatty acids including docosapentaenoic acid (DPA), docosahexaenoic acid (DHA), alpha-linolenic acid (ALA), and eicosapentaenoic acid (EPA) and ω6 polyunsaturated fatty acids including arachidonic acid (AA), dihomogamma-linolenic acid (DGLA), gamma-linolenic acid (GLA), and linoleic acid (LA) [19,21,22]. The chosen essential minerals were calcium [23], copper, iron [24], magnesium [25], phosphorus [26], and zinc [27]. The absolute and relative levels of vitamins or vitaminogens in blood were examined to perform a comprehensive assessment of the impact of vitamins and pro-vitamins on disease. The absolute concentrations of vitamins or pro-vitamins, namely, absolute vitamin A (retinol) [28], absolute β-carotene [29], absolute vitamin B-6 [30], absolute vitamin C (ascorbic acid) [31], relative vitamin C (ascorbic acid) [19], absolute vitamin D [25-hydroxyvitamin D (25OHD)] [32], absolute vitamin E (α-tocopherol) [33], relative vitamin E (α-tocopherol and γ-tocopherol [19], and relative retinol [34], were analyzed.
Large-scale European GWAS summary data from a recently published study, which included WMHs (N = 18,381), FA (N = 17,663) and MD (N = 17,467) data, were considered as the outcome dataset [2].
2.2. Selection of Instrumental Variables (IVs)
In total, we referenced GWAS data for 32 different nutrient-related exposures. We removed nutrient-related exposures that only had one associated SNP or the associated SNPs cannot provide enough corresponding effects in the outcome. In the WMHs outcome analysis, we included 2 to 174 instrumental variables related to 21 nutrient-related exposures and removed 11 nutrient-related exposures: isoleucine, lysine, methionine, AA, ALA, DGLA, DPA, EPA, GLA, absolute beta-carotene, and absolute vitamin B-6. For the FA outcome, we included 2 to 170 IVs related to 25 nutrient-related exposures, and removed 7 nutrients: isoleucine, lysine, methionine, ALA, EPA, absolute beta-carotene, and absolute vitamin B-6. For the MD outcomes, we included 2 to 170 IVs related to 25 nutrient-related exposures, removing 7 nutrients: isoleucine, lysine, methionine, ALA, EPA, absolute beta-carotene, and absolute vitamin B-6.
We followed a strict set of criteria to select appropriate nutrient IVs, including (1) independent SNP loci (r2 = 0.01, KB = 5000) with p < 5 × 10⁻⁸ in the exposure GWAS that were selected as IVs that were significantly associated with the exposures; if no SNP with p < 5 × 10⁻⁸ are available, those with moderate significance level (p < 1 × 10⁻⁵) were used as proxies; (2) no rare SNPs were selected (MAF ≥ 0.01); and (3) loci with strong linkage disequilibrium (r2 > 0.8) with the original locus could be used as proxies. Due to methodological limitations, our analyses can only demonstrate exposures with at least 2 associated SNPs.
2.3. Mendelian Randomization
The main MR approach for analyzing causality was the multiplicative random-effects inverse variance-weighted (IVW) method. This method involves regressing the effect of SNPs on both the outcome and the exposure variables [35]. The simple median method, the weighted median method (only approved when ≥50% IVs are valid [36]), and the MR-Egger method (for the detection and correction of bias caused by pleiotropy [37]) were used as sensitivity analyses in order to guarantee that the IVW results are robust. In addition, we used the Cochran’s Q test for heterogeneity. Similar estimates for each IV indicated nonsignificant heterogeneity (p > 0.05). We used the MR-Egger method to test the horizontal pleiotropy by calculating the regression intercept. When the intercept was not significantly distant from the origin, it was considered to have no impact on multicollinearity. The “Leave one out” (LOO) method was used to assess the effect of individual SNP on the overall causality through individually excluding each genetic variant and recalculating MR estimates.
p values were adjusted according to the Bonferroni correction. A p-value < 0.05/k (k is the number of exposures) was considered significant, and a p-value between 0.05/k and 0.05 indicated a suggestive significant association.
R software, version 4.2.1 (R Core Team, Vienna, Austria), with the “TwoSampleMR” package (version 0.5.7), was used to perform all the analyses [38]. The flowchart of the analysis steps is shown in Figure 1.
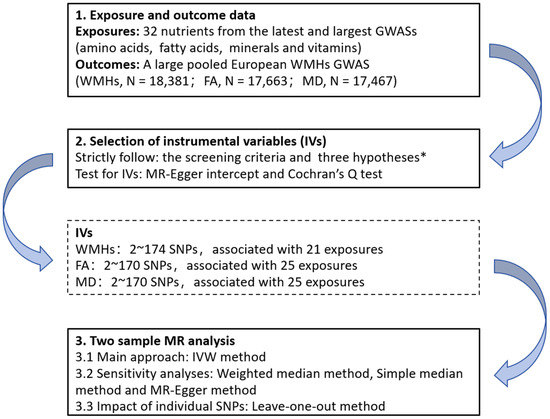
Figure 1.
Flow chart of the Mendelian randomization analysis process in this study. * three key assumptions of Mendelian analyses: (1) the selected genetic variants are significantly associated with the risk of the outcome only through the exposure pathway; (2) the selected genetic variants should be significantly associated with the exposures; and (3) the selected genetic variants are not associated with other confounders. GWASs, genome-wide association studies; WMHs, white matter hyperintensities; FA, fractional order anisotropy; MD, mean diffusivity; IVs, instrumental variables; SNPs: single nucleotide polymorphisms; MR, Mendelian randomization; and IVW, inverse variance weighting.
3. Results
Of the 21 potential risk factors for WMHs from essential nutrients, 4 were related to amino acids, 2 were related to fatty acids, 6 were related to minerals, and 9 were related to vitamins. Of the 25 potential risk factors for FA from essential nutrients, 4 were related to amino acids, 6 were related to fatty acids, 6 were related to minerals, and 9 were related to vitamins. Of the 25 potential risk factors for MD from essential nutrients, 4 were related to amino acids, 6 were related to fatty acids, 6 were related to minerals, and 9 were related to vitamins.
3.1. Amino Acids
None of the studied amino acids, including leucine, phenylalanine, tryptophan, and valine, were significantly associated with WMHs by the IVW method (Table 1 and Figure 2). None of them were significantly associated with the two DTI measures, FA and MD, by the IVW method (Table S2).

Table 1.
Causal effects of each nutrient on WMHs identified by different MR methods.
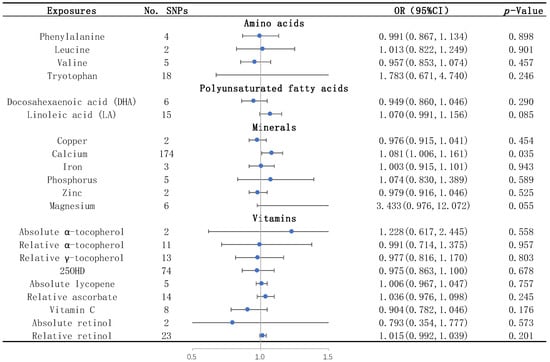
Figure 2.
Causal effects of each nutrient on WMHs identified by IVW. The blue dots represent the OR value, and the straight line represents 95% CI. IVW, inverse variance weighting; SNPs, single nucleotide polymorphisms. OR, odds ratio; 95% CI, 95% confidence interval; and 25OHD: 25-hydroxyvitamin D.
3.2. Unsaturated Fatty Acids
The results of the IVW analysis showed that the plasma level of linoleic acid was negatively associated with FA (OR = 0.776; 95% CI = 0.616–0.978, p = 0.032) (Table S2). Similar trends were shown by the sensitivity analyses including the simple median, the weighted median, and the MR–Egger method (Table S2). The IVs for linoleic acid had no heterogeneity or horizontal pleiotropy according to the Cochran’s Q test and the MR-Egger intercept test (Table S3). Through the LOO method, we found that the effect of linoleic acid on FA did not remain significant after removing some SNPs (rs99780, rs769449, rs821840, or rs7412) (Figure S4.2).
We also found that DGLA (OR = 0.727, 95% CI = 0.588–0.899, p = 0.003) and AA (OR = 1.081; 95% CI = 1.027–1.138, p = 0.003) were associated with FA by the IVW method (Table S2). However, sensitivity analyses and MR-Egger intercept tests were not performed, as there were only two available IVs for both DGLA and AA.
Regarding the other outcomes, none of the unsaturated fatty acids, including DGLA, DHA, DPA, GLA, AA and linoleic acid, showed effects on MD (Table S2), and neither DHA nor linoleic acid showed effects on WMHs after removing DGLA, DPA, GLA, and AA as described in the Materials and Methods Section (Table 1).
3.3. Mineral Elements
We found that the serum calcium level was a risk factor for WMHs, and the risk of WMHs was elevated by 8.1% for each standard deviation unit increase in calcium concentration (OR = 1.081; 95% CI = 1.006–1.161, p = 0.035) (Table 1 and Figure 2). The sensitivity analyses including the simple median, the weighted median, and the MR–Egger methods showed similar trends (Table 1). There was no heterogeneity or horizontal pleiotropy of calcium detected by the Cochran’s Q test and the MR-Egger intercept test (Table 2).
Table 2.
Results of the MR-Egger intercept and Cochran’s Q tests for WMHs.
Through the LOO method, we found that the effect of calcium on WMHs did not remain significant after removing some SNPs (rs1688131, rs6909201, rs760077, rs6841429, rs4917, or rs1260326) (Figure S2.13).
Regarding the other outcomes, FA and MD, none of the mineral elements, including copper, iron, zinc, and magnesium, showed effects (Table S2).
3.4. Vitamins
None of the vitamins, including absolute α-tocopherol, relative α-tocopherol, relative γ-tocopherol, 25OHD, absolute lycopene, relative ascorbate, vitamin C, absolute retinol, and relative retinol, were significantly associated with WMHs (Table 1 and Figure 2) and the two DTI measures, FA and MD (Table S2), by the IVW method.
4. Discussion
In our MR study, we analyzed the effects of essential nutrients on WMHs and two DTI measures, FA and MD, and showed that the serum calcium level was a potential risk factor for WMHs, and the plasma linoleic acid level was a potential risk factor for early damage to white matter as represented by FA.
Our findings suggested that the serum calcium level was a potential risk factor for WMHs. There were few previous studies on the relationship between calcium and WMHs, all of which were small cross-sectional studies; moreover, the conclusions of these studies were inconsistent. One study reported that the serum calcium level was not associated with white matter hyperintensities in older adults [39]. However, other studies have shown that the higher levels of serum calcium might be positively associated with the volume of cerebral white matter lesions in older adults, especially in men and in depressed patients [40]. Calcium and vitamin D intake [41] and the use of calcium-containing dietary supplements [42] might be positively associated with the volume of brain lesions (including those in both the gray and the white matter, albeit predominantly in the white matter) in older adults, which could be explained by our findings. The inconsistency might be interpreted by limitations of studies including the small sample size, the varied measurement methods of white matter changes, the lack of longitudinal data, etc.
Our findings suggested that the plasma level of linoleic acid, an ω-6 unsaturated fatty acid, was a potential risk factor for the early microstructural damage to white matter represented by FA. Previous studies on the relationship between linoleic acid and white matter changes and the underlying mechanism were lacking, probably because the level of linoleic acid is difficult to measure. However, it has been shown that linoleic acid enhances oxidative stress and TNF-alpha [43,44,45]. Therefore, linoleic acid might adversely affect the function and structure of white matter through inflammatory response mechanisms. Further studies are needed to clarify the relationship between the level of linoleic acid and white matter changes.
Previous studies showed that WMHs, as an imaging marker, was closely associated with stroke and dementia [46,47]. Regarding the relationship of calcium with stroke, several prospective studies have shown that serum calcium levels were related with the risk of ischemic stroke. In a cohort study enrolled about 440,000 adults, high serum calcium levels were associated with a significantly increased risk of both ischemic stroke and fatal ischemic stroke compared with low serum calcium levels [48]. Another cohort comprised 13,288 adults and showed a 16% increase in total stroke risk for every one SD increase in the serum calcium concentration [49]. However, an MR study showed that serum calcium concentration was not associated with the various subtypes of ischemic stroke, including large-artery stroke, cardiogenic embolism, and small-vessel stroke [50]. However, the statistical power for measuring calcium in that study was low because the SNPS explained only a small fraction (0.9%) of the variation in serum calcium levels, and thus, a weak association between genetically predicted serum calcium concentrations and ischemic stroke cannot be excluded. Regarding the relationship between calcium and dementia, population-based longitudinal studies showed that calcium supplementation may increase the risk of dementia and stroke-related dementia (including vascular and mixed dementia) in older women with cerebrovascular disease [46]. Higher serum calcium levels may increase the risk of Alzheimer’s disease in older adults [47]. However, an MR study also showed a trend of decreasing risk of Alzheimer’s disease with increasing serum calcium levels, but the results of this study were not statistically significant and other types of dementia including vascular and mixed dementia were not considered [51].
The mechanisms underlying the role calcium as a risk factor for WMHs remain unclear. One possible mechanism was that calcium may promote brain lesions via arterial calcification. Increases in dietary and serum calcium are associated with arterial calcification [41,52,53], while coronary and carotid calcification are independently associated with WMHs [54,55,56]. Second, disturbances in calcium metabolism may also be associated with hypertension and renal disease [40]. In addition, calcium may directly affect brain health by affecting neurotransmitter turnover and neurotoxicity mechanisms [41,42]. Thus, serum calcium may contribute to WMHs by either arterial calcification or another mechanism.
Our study presents the evidence of correlations between nutrients and WMHs and the early microstructural lesions of white matter represented by DTI parameters, FA and MD, providing the potential intervention targets for WMHs and its associated diseases. Our study utilized GWAS data with a large sample size and reliable sources. It overcame several challenges in conducting clinical studies on nutrients, such as the difficulty of accurately measuring nutrient concentrations and the demand for a long period to observe the effect of nutrients on outcomes. However, our study also had some limitations. First, our study investigated lifetime exposure to nutrients, and short-term dietary changes may not impact the outcomes. Second, genetically predicted calcium levels explain only a small fraction of the real calcium levels. Third, the disease may be heterogeneous, and calcium may only have an effect on a part of the population. Our study was performed in European population only and should be interpreted with caution when extrapolated to other populations with different dietary habits. Moreover, in GWASs for FA and MD, only the first principal components were used, which might affect the reliability of estimates and the directionality of the MR results [2].
5. Conclusions
In our study, we used a two-sample MR approach to analyze the effect of essential nutrients in blood including amino acids, fatty acids, minerals, and vitamins on white matter changes measured by WMHs and two DTI measures, FA and MD, suggesting that genetically predicted calcium was a potential risk factor for WMHs and that linoleic acid may be negatively associated with FA, which might provide the evidence for medical interventions in the general population from the perspective of gene–environment interactions. No association was found between other nutrients and white matter changes. These findings need to be verified by further clinical longitudinal studies.
Supplementary Materials
The following supporting information can be downloaded at: https://www.mdpi.com/article/10.3390/biomedicines12040810/s1, Table S1. Characteristics of instrumental variables (IVs). Table S2. Causal effects of each nutrient on fraction anisotropy (FA) and mean diffusivity (MD) identified by different MR methods. Table S3. Results of the MR-Egger intercept and Cochran’s Q tests for fraction anisotropy (FA) and mean diffusivity (MD). Figure S1. Scatterplots of essential nutrient exposures and WMHs. Figure S2. Leave-one-out plots of essential nutrient exposures and WMHs. Figure S3. Scatterplots of essential nutrient exposures and FA. Figure S4. Leave-one-out plots of essential nutrient exposures and FA. Figure S5. Scatterplots of essential nutrient exposures and MD. Figure S6. Leave-one-out plots of essential nutrient exposures and MD.
Author Contributions
Data curation, K.X.; Formal analysis, Z.W.; Methodology, K.X.; Supervision, D.F. and Q.Y.; Validation, J.L., Y.L., Y.Z. and L.Z.; Writing—original draft, Z.W. and K.X.; Writing—review and editing, L.T., X.Z., D.F. and Q.Y. All authors have read and agreed to the published version of the manuscript.
Funding
This research was funded by the National Natural Science Foundation of China (grant number: 81901204) and the Beijing Municipal Science and Technology Commission (grant number: D141100000114005).
Institutional Review Board Statement
Not applicable.
Informed Consent Statement
Not applicable.
Data Availability Statement
The exposure and outcome GWASs are available in the corresponding previous research.
Acknowledgments
We would like to thank the described GWASs for making summary data publicly available, and we are grateful to all participants who contributed to these studies.
Conflicts of Interest
The authors declare no conflicts of interest.
Abbreviations
25OHD: 25-hydroxyvitamin D; AA: arachidonic acid; ALA: alpha-linolenic acid; CI: 95% confidence interval; DTI: diffusion tensor imaging; DHA: docosahexaenoic acid; DPA: docosapentaenoic acid; DGLA: dihomogamma-linolenic acid; EPA: eicosapentaenoic acid; FA: fraction anisotropy; GLA: gamma-linolenic acid; IVW: inverse variance weighting; LA: linoleic acid; MD: mean diffusivity; MR: Mendelian randomization; MAF: minor allele frequency; OR: odds ratio; SNPs: single nucleotide polymorphisms; and WMHs: white matter hyperintensities.
References
- Pantoni, L. Cerebral small vessel disease: From pathogenesis and clinical characteristics to therapeutic challenges. Lancet Neurol. 2010, 9, 689–701. [Google Scholar] [CrossRef] [PubMed]
- Persyn, E.; Hanscombe, K.B.; Howson, J.M.; Lewis, C.M.; Traylor, M.; Markus, H.S. Genome-wide association study of MRI markers of cerebral small vessel disease in 42,310 participants. Nat. Commun. 2020, 11, 2175. [Google Scholar] [CrossRef] [PubMed]
- Debette, S.; Schilling, S.; Duperron, M.-G.; Larsson, S.C.; Markus, H.S. Clinical Significance of Magnetic Resonance Imaging Markers of Vascular Brain Injury: A Systematic Review and Meta-Analysis. JAMA Neurol. 2019, 76, 81–94. [Google Scholar] [CrossRef] [PubMed]
- Zhang, C.E.; Wong, S.M.; Uiterwijk, R.; Backes, W.H.; Jansen, J.F.A.; Jeukens, C.R.L.P.N.; van Oostenbrugge, R.J.; Staals, J. Blood-brain barrier leakage in relation to white matter hyperintensity volume and cognition in small vessel disease and normal aging. Brain Imaging Behav. 2019, 13, 389–395. [Google Scholar] [CrossRef] [PubMed]
- Wardlaw, J.M.; Smith, C.; Dichgans, M. Small vessel disease: Mechanisms and clinical implications. Lancet Neurol. 2019, 18, 684–696. [Google Scholar] [CrossRef] [PubMed]
- Fernando, M.S.; Simpson, J.E.; Matthews, F.; Brayne, C.; Lewis, C.E.; Barber, R.; Kalaria, R.N.; Forster, G.; Esteves, F.; Wharton, S.B.; et al. White matter lesions in an unselected cohort of the elderly: Molecular pathology suggests origin from chronic hypoperfusion injury. Stroke 2006, 37, 1391–1398. [Google Scholar] [CrossRef]
- Wardlaw, J.M.; Smith, C.; Dichgans, M. Mechanisms of sporadic cerebral small vessel disease: Insights from neuroimaging. Lancet Neurol. 2013, 12, 483–497, Erratum in Lancet Neurol.2013, 12, 532. [Google Scholar] [CrossRef] [PubMed]
- Pasi, M.; van Uden, I.W.; Tuladhar, A.M.; de Leeuw, F.-E.; Pantoni, L. White Matter Microstructural Damage on Diffusion Tensor Imaging in Cerebral Small Vessel Disease: Clinical Consequences. Stroke 2016, 47, 1679–1684. [Google Scholar] [CrossRef]
- Viswanathan, A.; Godin, O.; Jouvent, E.; O’sullivan, M.; Gschwendtner, A.; Peters, N.; Duering, M.; Guichard, J.-P.; Holtmannspötter, M.; Dufouil, C.; et al. Impact of MRI markers in subcortical vascular dementia: A multi-modal analysis in CADASIL. Neurobiol. Aging 2010, 31, 1629–1636. [Google Scholar] [CrossRef]
- Zeestraten, E.A.; Lawrence, A.J.; Lambert, C.; Benjamin, P.; Brookes, R.L.; Mackinnon, A.D.; Morris, R.G.; Barrick, T.R.; Markus, H.S. Change in multimodal MRI markers predicts dementia risk in cerebral small vessel disease. Neurology 2017, 89, 1869–1876. [Google Scholar] [CrossRef]
- Leitão, C.; Mignano, A.; Estrela, M.; Fardilha, M.; Figueiras, A.; Roque, F.; Herdeiro, M.T. The Effect of Nutrition on Aging—A Systematic Review Focusing on Aging-Related Biomarkers. Nutrients 2022, 14, 554. [Google Scholar] [CrossRef] [PubMed]
- Del Brutto, O.H.; Recalde, B.Y.; Mera, R.M. Dietary Oily Fish Intake is Inversely Associated with Severity of White Matter Hyperintensities of Presumed Vascular Origin. A Population-Based Study in Frequent Fish Consumers of Amerindian Ancestry. J. Stroke Cerebrovasc. Dis. 2021, 30, 105778. [Google Scholar] [CrossRef]
- Prinelli, F.; Fratiglioni, L.; Kalpouzos, G.; Musicco, M.; Adorni, F.; Johansson, I.; Marseglia, A.; Xu, W. Specific nutrient patterns are associated with higher structural brain integrity in dementia-free older adults. NeuroImage 2019, 199, 281–288. [Google Scholar] [CrossRef]
- Gu, Y.; Scarmeas, N. Diet and Neuroimaging Markers of Cerebrovascular Disease. Curr. Nutr. Rep. 2013, 2, 81–89. [Google Scholar] [CrossRef] [PubMed][Green Version]
- Bowman, G.; Silbert, L.; Howieson, D.; Dodge, H.; Traber, M.; Frei, B.; Kaye, J.; Shannon, J.; Quinn, J. Nutrient biomarker patterns, cognitive function, and MRI measures of brain aging. Neurology 2012, 78, 241–249. [Google Scholar] [CrossRef]
- Jensen, D.E.; Leoni, V.; Klein-Flügge, M.C.; Ebmeier, K.P.; Suri, S. Associations of dietary markers with brain volume and connectivity: A systematic review of MRI studies. Ageing Res. Rev. 2021, 70, 101360. [Google Scholar] [CrossRef]
- Lee, K.; Lim, C.-Y. Mendelian Randomization Analysis in Observational Epidemiology. J. Lipid Atheroscler. 2019, 8, 67–77. [Google Scholar] [CrossRef]
- Smith, G.D.; Timpson, N.; Ebrahim, S. Strengthening causal inference in cardiovascular epidemiology through Mendelian randomization. Ann. Med. 2008, 40, 524–541. [Google Scholar] [CrossRef] [PubMed]
- Kettunen, J.; Demirkan, A.; Würtz, P.; Draisma, H.H.; Haller, T.; Rawal, R.; Vaarhorst, A.; Kangas, A.J.; Lyytikäinen, L.-P.; Pirinen, M.; et al. Genome-wide study for circulating metabolites identifies 62 loci and reveals novel systemic effects of LPA. Nat. Commun. 2016, 7, 11122. [Google Scholar] [CrossRef]
- Shin, S.-Y.; The Multiple Tissue Human Expression Resource (MuTHER) Consortium; Fauman, E.B.; Petersen, A.-K.; Krumsiek, J.; Santos, R.; Huang, J.; Arnold, M.; Erte, I.; Forgetta, V.; et al. An atlas of genetic influences on human blood metabolites. Nat. Genet. 2014, 46, 543–550. [Google Scholar] [CrossRef]
- Guan, W.; Steffen, B.T.; Lemaitre, R.N.; Wu, J.H.Y.; Tanaka, T.; Manichaikul, A.; Foy, M.; Rich, S.S.; Wang, L.; Nettleton, J.A.; et al. Genome-wide association study of plasma N6 polyunsaturated fatty acids within the cohorts for heart and aging research in genomic epidemiology consortium. Circ. Cardiovasc. Genet. 2014, 7, 321–331. [Google Scholar] [CrossRef] [PubMed]
- Lemaitre, R.N.; Tanaka, T.; Tang, W.; Manichaikul, A.; Foy, M.; Kabagambe, E.K.; Nettleton, J.A.; King, I.B.; Weng, L.-C.; Bhattacharya, S.; et al. Genetic loci associated with plasma phospholipid n-3 fatty acids: A meta-analysis of genome-wide association studies from the CHARGE Consortium. PLOS Genet. 2011, 7, e1002193. [Google Scholar] [CrossRef] [PubMed]
- Sinnott-Armstrong, N.; Tanigawa, Y.; Amar, D.; Mars, N.; Benner, C.; Aguirre, M.; Venkataraman, G.R.; Wainberg, M.; Ollila, H.M.; Kiiskinen, T.; et al. Genetics of 35 blood and urine biomarkers in the UK Biobank. Nat. Genet. 2021, 53, 185–194. [Google Scholar] [CrossRef] [PubMed]
- Benyamin, B.; Esko, T.; Ried, J.S.; Radhakrishnan, A.; Vermeulen, S.H.; Traglia, M.; Gögele, M.; Anderson, D.; Broer, L.; Podmore, C.; et al. Novel loci affecting iron homeostasis and their effects in individuals at risk for hemochromatosis. Nat. Commun. 2014, 5, 4926. [Google Scholar] [CrossRef] [PubMed]
- Meyer, T.E.; Verwoert, G.C.; Hwang, S.-J.; Glazer, N.L.; Smith, A.V.; van Rooij, F.J.A.; Ehret, G.B.; Boerwinkle, E.; Felix, J.F.; Leak, T.S.; et al. Genome-wide association studies of serum magnesium, potassium, and sodium concentrations identify six loci influencing serum magnesium levels. PLOS Genet. 2010, 6, e1001045. [Google Scholar] [CrossRef]
- Kestenbaum, B.; Glazer, N.L.; Köttgen, A.; Felix, J.F.; Hwang, S.-J.; Liu, Y.; Lohman, K.; Kritchevsky, S.B.; Hausman, D.B.; Petersen, A.-K.; et al. Common Genetic Variants Associate with Serum Phosphorus Concentration. J. Am. Soc. Nephrol. 2010, 21, 1223–1232. [Google Scholar] [CrossRef]
- Evans, D.M.; Zhu, G.; Dy, V.; Heath, A.C.; Madden, P.A.F.; Kemp, J.P.; McMahon, G.; St Pourcain, B.; Timpson, N.J.; Golding, J.; et al. Genome-wide association study identifies loci affecting blood copper, selenium and zinc. Hum. Mol. Genet. 2013, 22, 3998–4006. [Google Scholar] [CrossRef] [PubMed]
- D’adamo, C.R.; D’urso, A.; Ryan, K.A.; Yerges-Armstrong, L.M.; Semba, R.D.; Steinle, N.I.; Mitchell, B.D.; Shuldiner, A.R.; McArdle, P.F. A Common Variant in the SETD7 Gene Predicts Serum Lycopene Concentrations. Nutrients 2016, 8, 82. [Google Scholar] [CrossRef]
- Ferrucci, L.; Perry, J.R.; Matteini, A.; Perola, M.; Tanaka, T.; Silander, K.; Rice, N.; Melzer, D.; Murray, A.; Cluett, C.; et al. Common variation in the beta-carotene 15,15′-monooxygenase 1 gene affects circulating levels of carotenoids: A genome-wide association study. Am. J. Hum. Genet. 2009, 84, 123–133. [Google Scholar] [CrossRef]
- Hazra, A.; Kraft, P.; Lazarus, R.; Chen, C.; Chanock, S.J.; Jacques, P.; Selhub, J.; Hunter, D.J. Genome-wide significant predictors of metabolites in the one-carbon metabolism pathway. Hum. Mol. Genet. 2009, 18, 4677–4687. [Google Scholar] [CrossRef]
- Zheng, J.-S.; Luan, J.; Sofianopoulou, E.; Imamura, F.; Stewart, I.D.; Day, F.R.; Pietzner, M.; Wheeler, E.; Lotta, L.A.; Gundersen, T.E.; et al. Plasma Vitamin C and Type 2 Diabetes: Genome-Wide Association Study and Mendelian Randomization Analysis in European Populations. Diabetes Care 2020, 44, 98–106. [Google Scholar] [CrossRef]
- Manousaki, D.; Mitchell, R.; Dudding, T.; Haworth, S.; Harroud, A.; Forgetta, V.; Shah, R.L.; Luan, J.; Langenberg, C.; Timpson, N.J.; et al. Genome-Wide Association Study for Vitamin D Levels Reveals 69 Independent Loci. Am. J. Hum. Genet. 2020, 106, 327–337. [Google Scholar] [CrossRef] [PubMed]
- Major, J.M.; Yu, K.; Wheeler, W.; Zhang, H.; Cornelis, M.C.; Wright, M.E.; Yeager, M.; Snyder, K.; Weinstein, S.J.; Mondul, A.; et al. Genome-wide association study identifies common variants associated with circulating vitamin E levels. Hum. Mol. Genet. 2011, 20, 3876–3883. [Google Scholar] [CrossRef]
- Long, T.; Hicks, M.; Yu, H.-C.; Biggs, W.H.; Kirkness, E.F.; Menni, C.; Zierer, J.; Small, K.S.; Mangino, M.; Messier, H.; et al. Whole-genome sequencing identifies common-to-rare variants associated with human blood metabolites. Nat. Genet. 2017, 49, 568–578. [Google Scholar] [CrossRef]
- Burgess, S.; Bowden, J.; Fall, T.; Ingelsson, E.; Thompson, S.G. Sensitivity Analyses for Robust Causal Inference from Mendelian Randomization Analyses with Multiple Genetic Variants. Epidemiology 2017, 28, 30–42. [Google Scholar] [CrossRef]
- Bowden, J.; Smith, G.D.; Haycock, P.C.; Burgess, S. Consistent Estimation in Mendelian Randomization with Some Invalid Instruments Using a Weighted Median Estimator. Genet. Epidemiol. 2016, 40, 304–314. [Google Scholar] [CrossRef] [PubMed]
- Burgess, S.; Thompson, S.G. Interpreting findings from Mendelian randomization using the MR-Egger method. Eur. J. Epidemiol. 2017, 32, 377–389. [Google Scholar] [CrossRef]
- Hemani, G.; Zheng, J.; Elsworth, B.; Wade, K.H.; Haberland, V.; Baird, D.; Laurin, C.; Burgess, S.; Bowden, J.; Langdon, R.; et al. The MR-Base platform supports systematic causal inference across the human phenome. eLife 2018, 7, e34408. [Google Scholar] [CrossRef] [PubMed]
- Silbert, L.C.; Lahna, D.; Promjunyakul, N.-O.; Boespflug, E.; Ohya, Y.; Higashiuesato, Y.; Nishihira, J.; Katsumata, Y.; Tokashiki, T.; Dodge, H.H. Risk Factors Associated with Cortical Thickness and White Matter Hyperintensities in Dementia Free Okinawan Elderly. J. Alzheimer’s Dis. 2018, 63, 365–372. [Google Scholar] [CrossRef]
- Payne, M.E.; Pierce, C.W.; McQuoid, D.R.; Steffens, D.C.; Anderson, J.J.B. Serum ionized calcium may be related to white matter lesion volumes in older adults: A pilot study. Nutrients 2013, 5, 2192–2205. [Google Scholar] [CrossRef]
- Payne, M.E.; Anderson, J.J.; Steffens, D.C. Calcium and vitamin D intakes may be positively associated with brain lesions in depressed and nondepressed elders. Nutr. Res. 2008, 28, 285–292. [Google Scholar] [CrossRef] [PubMed]
- Payne, M.E.; McQuoid, U.R.; Steffens, D.C.; Anderson, J.J.B. Elevated brain lesion volumes in older adults who use calcium supplements: A cross-sectional clinical observational study. Br. J. Nutr. 2014, 112, 220–227. [Google Scholar] [CrossRef] [PubMed]
- Sato, M.; Shibata, K.; Nomura, R.; Kawamoto, D.; Nagamine, R.; Imaizumi, K. Linoleic acid-rich fats reduce atherosclerosis development beyond its oxidative and inflammatory stress-increasing effect in apolipoprotein E-deficient mice in comparison with saturated fatty acid-rich fats. Br. J. Nutr. 2005, 94, 896–901. [Google Scholar] [CrossRef] [PubMed]
- Turpeinen, A.; Basu, S.; Mutanen, M. A high linoleic acid diet increases oxidative stress in vivo and affects nitric oxide metabolism in humans. Prostaglandins Leukot. Essent. Fat. Acids 1998, 59, 229–233. [Google Scholar] [CrossRef] [PubMed]
- Taha, A.Y. Linoleic acid–good or bad for the brain? NPJ Sci. Food 2020, 4, 1, Erratum in NPJ Sci. Food.2020, 4, 6. [Google Scholar] [CrossRef] [PubMed]
- Kern, J.; Kern, S.; Blennow, K.; Zetterberg, H.; Waern, M.; Guo, X.; Börjesson-Hanson, A.; Skoog, I.; Östling, S. Calcium supplementation and risk of dementia in women with cerebrovascular disease. Neurology 2016, 87, 1674–1680. [Google Scholar] [CrossRef] [PubMed]
- Ma, L.-Z.; Wang, Z.-X.; Wang, Z.-T.; Hou, X.-H.; Shen, X.-N.; Ou, Y.-N.; Dong, Q.; Tan, L.; Yu, J.-T. Serum Calcium Predicts Cognitive Decline and Clinical Progression of Alzheimer’s Disease. Neurotox. Res. 2020, 39, 609–617. [Google Scholar] [CrossRef] [PubMed]
- Rohrmann, S.; Garmo, H.; Malmström, H.; Hammar, N.; Jungner, I.; Walldius, G.; Van Hemelrijck, M. Association between serum calcium concentration and risk of incident and fatal cardiovascular disease in the prospective AMORIS study. Atherosclerosis 2016, 251, 85–93. [Google Scholar] [CrossRef]
- Foley, R.N.; Collins, A.J.; Ishani, A.; Kalra, P.A. Calcium-phosphate levels and cardiovascular disease in community-dwelling adults: The Atherosclerosis Risk in Communities (ARIC) Study. Am. Heart J. 2008, 156, 556–563. [Google Scholar] [CrossRef]
- Larsson, S.C.; Traylor, M.; Burgess, S.; Boncoraglio, G.B.; Jern, C.; Michaëlsson, K.; Markus, H.S.; Malik, R.; Chauhan, G.; Sargurupremraj, M.; et al. Serum magnesium and calcium levels in relation to ischemic stroke: Mendelian randomization study. Neurology 2019, 92, e944–e950. [Google Scholar] [CrossRef]
- Shi, Y.; Liu, R.; Guo, Y.; Li, Q.; Zhou, H.; Yu, S.; Liang, H.; Li, Z. An Updated Mendelian Randomization Analysis of the Association between Serum Calcium Levels and the Risk of Alzheimer’s Disease. Front. Genet. 2021, 12, 731391. [Google Scholar] [CrossRef] [PubMed]
- Ishizaka, N.; Ishizaka, Y.; Takahashi, E.; Tooda, E.-I.; Hashimoto, H.; Nagai, R.; Yamakado, M. Serum calcium concentration and carotid artery plaque: A population-based study. J. Cardiol. 2002, 39, 151–157. [Google Scholar] [PubMed]
- Rubin, M.R.; Rundek, T.; McMahon, D.J.; Lee, H.-S.; Sacco, R.L.; Silverberg, S.J. Carotid artery plaque thickness is associated with increased serum calcium levels: The Northern Manhattan study. Atherosclerosis 2007, 194, 426–432. [Google Scholar] [CrossRef] [PubMed]
- Erbay, S.; Han, R.; Baccei, S.; Krakov, W.; Zou, K.H.; Bhadelia, R.; Polak, J. Intracranial carotid artery calcification on head CT and its association with ischemic changes on brain MRI in patients presenting with stroke-like symptoms: Retrospective analysis. Neuroradiology 2006, 49, 27–33. [Google Scholar] [CrossRef] [PubMed]
- Fanning, N.; Walters, T.; Fox, A.; Symons, S. Association between calcification of the cervical carotid artery bifurcation and white matter ischemia. AJNR Am. J. Neuroradiol. 2006, 27, 378–383. [Google Scholar]
- Kim, B.J.; Lee, S.-H.; Kim, C.K.; Ryu, W.-S.; Kwon, H.-M.; Choi, S.-Y.; Yoon, B.-W. Advanced coronary artery calcification and cerebral small vessel diseases in the healthy elderly. Circ. J. 2011, 75, 451–456. [Google Scholar] [CrossRef]


Disclaimer/Publisher’s Note: The statements, opinions and data contained in all publications are solely those of the individual author(s) and contributor(s) and not of MDPI and/or the editor(s). MDPI and/or the editor(s) disclaim responsibility for any injury to people or property resulting from any ideas, methods, instructions or products referred to in the content. |
© 2024 by the authors. Licensee MDPI, Basel, Switzerland. This article is an open access article distributed under the terms and conditions of the Creative Commons Attribution (CC BY) license (https://creativecommons.org/licenses/by/4.0/).