Article

Possible Causal Association between Type 2 Diabetes and Glycaemic Traits in Primary Open-Angle Glaucoma: A Two-Sample Mendelian Randomisation Study

1
Veterans Medical Research Institute, Veterans Health Service Medical Center, Seoul 05368, Republic of Korea
2
Department of Applied Statistics, Chung-Ang University, Seoul 06974, Republic of Korea
*
Author to whom correspondence should be addressed.
These authors contributed equally to this work.
Biomedicines 2024, 12(4), 866; https://doi.org/10.3390/biomedicines12040866
Submission received: 26 February 2024 / Revised: 3 April 2024 / Accepted: 12 April 2024 / Published: 15 April 2024
(This article belongs to the Special Issue Glaucoma: New Diagnostic and Therapeutic Approaches)

Abstract

:
Existing literature suggests a controversial relationship between type 2 diabetes mellitus (T2D) and glaucoma. This study aimed to examine the potential causal connection between T2D and glycaemic traits (fasting glucose [FG] and glycated haemoglobin [HbA1c] levels) as exposures to primary open-angle glaucoma (POAG) in multi-ethnic populations. Single-nucleotide polymorphisms associated with exposure to T2D, FG, and HbA1c were selected as instrumental variables with significance (p < 5.0 × 10⁻⁸) from the genome-wide association study (GWAS)-based meta-analysis data available from the BioBank Japan and the UK Biobank (UKB). The GWAS for POAG was obtained from the meta-analyses of Genetic Epidemiology Research in Adult Health and Aging and the UKB. A two-sample Mendelian randomisation (MR) study was performed to assess the causal estimates using the inverse-variance weighted (IVW) method, and MR-Pleiotropy Residual Sum and Outlier test (MR–PRESSO). Significant causal associations of T2D (odds ratio [OR] = 1.05, 95% confidence interval [CI] = [1.00–1.10], p = 0.031 in IVW; OR = 1.06, 95% CI = [1.01–1.11], p = 0.017 in MR–PRESSO) and FG levels (OR = 1.19, 95% CI = [1.02–1.38], p = 0.026 in IVW; OR = 1.17, 95% CI = [1.01–1.35], p = 0.041 in MR–PRESSO) with POAG were observed, but not in HbA1c (all p > 0.05). The potential causal relationship between T2D or FG and POAG highlights its role in the prevention of POAG. Further investigation is necessary to authenticate these findings.

1. Introduction

Glaucoma is a major cause of permanent vision loss. It is a progressive condition that affects the optic nerve, leading to the deterioration of the retinal ganglion cells and their axons [1]. Primary open-angle glaucoma (POAG) is the predominant form of glaucoma subtype [2]; however, its pathogenesis remains unclear due to the role of multiple factors in its pathophysiology [3,4,5,6]. The proposed risk factors for glaucoma include ageing, elevated intraocular pressure (IOP), vascular factors, genetic factors, systemic disorders (such as diabetes), and environmental factors [3,5,6,7,8,9,10]. Thus, the identification of POAG causal risk factors may facilitate the early detection and prevention of glaucoma; therefore, these studies form the basis for eye and vision research.
Type 2 diabetes (T2D) is an increasingly prevalent chronic metabolic disorder [11,12] that affected approximately 415 million people in 2015 worldwide [13]. This representative systemic illness is frequently regarded as a systemic risk factor, along with systemic hypertension, for glaucoma prevention. However, in contrast to IOP and ageing in POAG, epidemiological findings regarding the effects of T2D on POAG development remain controversial [14,15,16,17,18]. The Blue Mountains Eye Study suggested a substantial correlation between T2D and POAG and considered it a risk factor [15]. Subsequently, several studies have examined the relationship between T2D and POAG, indicating that T2D may be a risk factor for POAG development with increasing IOP related to glycaemic traits [16,17,18]. However, the Rotterdam Study and Baltimore Eye Survey raised concerns regarding the non-significant association between T2D and POAG [19,20]. Additionally, recent studies have reported an insignificant association [21,22,23,24] or negative point estimate [20,25,26] between the two.
A large-scale study using the Korean National Health Insurance Data demonstrated that the hazard ratio of glaucoma for T2D was 1.80 (95% confidence interval [CI], 1.58–2.04) with adjustment [27]. Another meta-analysis suggested that upon comparing patients with and without diabetes, the pooled relative risk for glaucoma was 1.48 (95% CI, 1.29–1.71), with significant heterogeneity (I2 = 82.3%, p < 0.001) [28]. Due to this heterogeneity, it is unclear whether T2D is a risk factor for POAG. In addition, this retrospective association analysis was unable to prove the causality, thus, the nature of the association remains unclear.
Mendelian randomisation (MR) is a genetic epidemiological technique that employs genetic variants linked to potential exposures as the instrumental variables (IVs) to assess their causal impact on disease outcomes [29,30]. A previous study using MR analysis suggested variable evidence for an association between T2D and POAG (odds ratio [OR] = 1.97, 95% CI 1.01–1.15) in individuals with European ancestry [31]. However, a recent MR study of the Japanese population demonstrated that glycaemic traits such as fasting glucose (FG), glycated haemoglobin (HbA1c), and C-peptide levels did not display a significant correlation with POAG [32]. Although POAG prevalence differs between ethnic groups [7], it is a representative common complex disease in terms of genetics and multi-ethnic group analysis and is reliable if the subject pool is large enough for MR analysis [33,34]. Furthermore, a study on the two-sample MR analysis methodology using large cohorts, such as the UK Biobank (UKB), reported that the MR-Egger bias did not affect the inverse-variance weighted (IVW) and weighted median [35]. Moreover, the results of the MR analysis may vary based on the selection of IVs for T2D. Therefore, large datasets combining the meta-analysis of the Biobank Japan (BBJ) and UKB [36] are expected to generate more substantial results. To this end, this study aimed to conduct a two-sample MR analysis to investigate the possible causal effects of T2D and glycaemic traits (FG, and HbA1c levels) on POAG based on the BBJ and UKB meta-analyses [36], as well as the Genetic Epidemiology Research in Adult Health and Aging (GERA) and UKB meta-analyses [37].

2. Materials and Methods
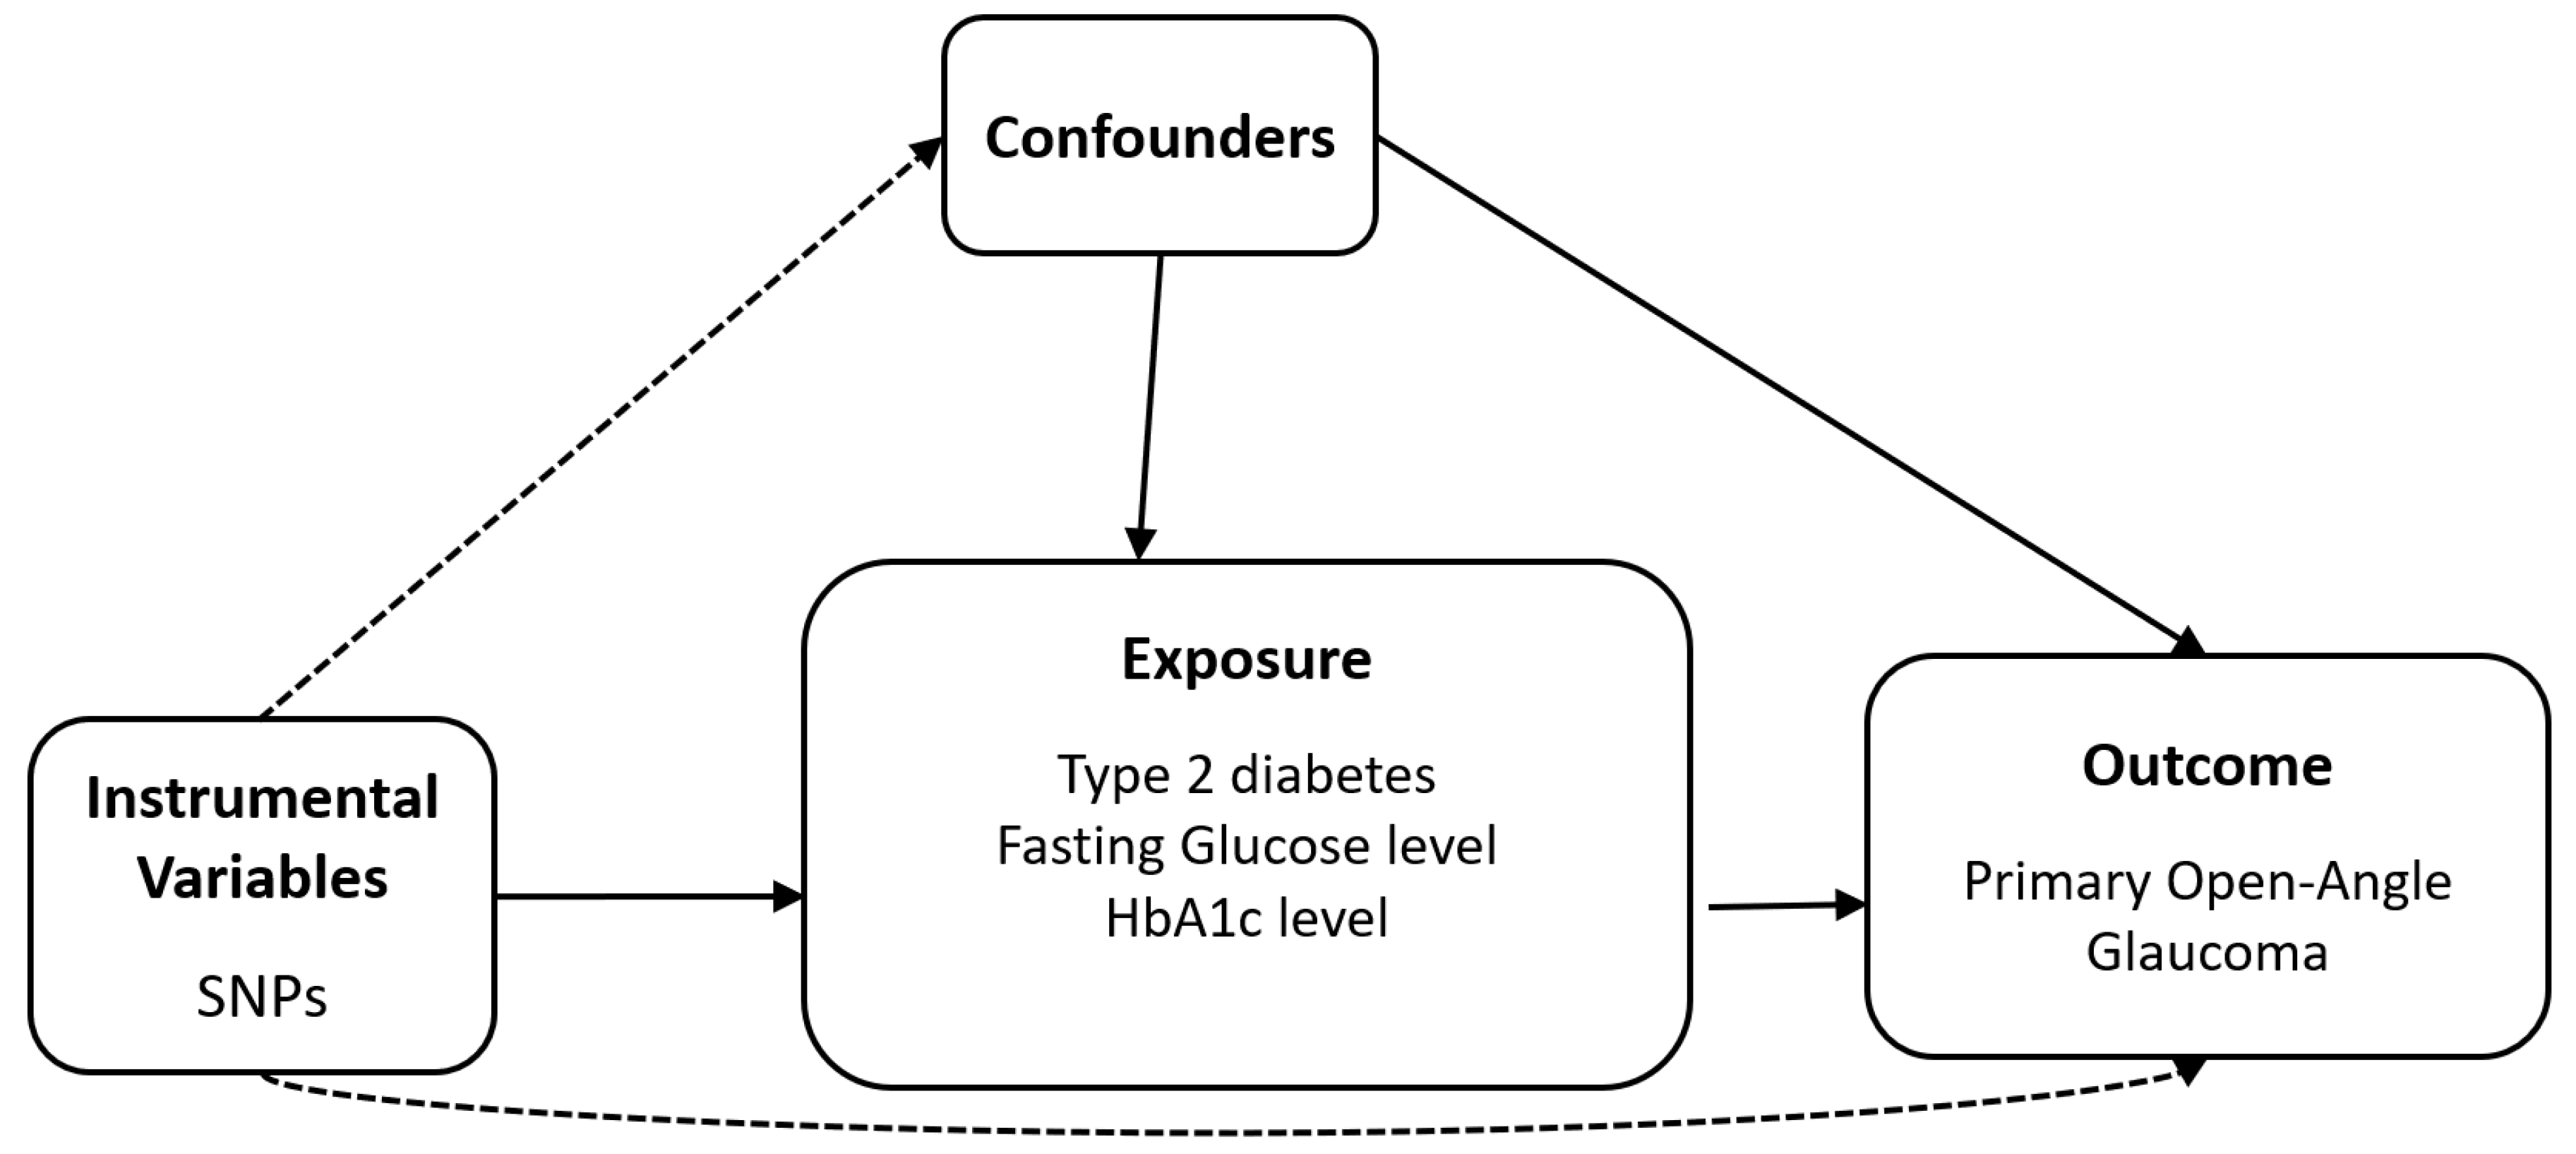
2.1. Study Design

The study protocol was approved by the Institutional Review Board of the Veterans Health Service Medical Centre (IRB No. 2022-03-004), and the need for informed consent was waived because of its retrospective study design. The research was conducted in accordance with the tenets of the Declaration of Helsinki.

2.2. Data Sources

Figure 1 is a schematic of the analytical study design. To examine the potential causal effects of T2D and glycaemic traits (FG and HbA1c) on the risk of POAG, the following datasets were selected: (1) exposure data from the summary statistics of the genome-wide association study (GWAS)-based meta-analysis of the BBJ and UKB for the multi-ethnic population (n = 667,504 for T2D [84,224 cases vs. 583,280 controls], n = 448,252 for FG, and n = 415,403 for HbA1c) (Table 1) [36]; and (2) outcome data from the summary statistics of the POAG GWAS data from the meta-analysis (n = 240,302; [12,315 cases vs. 227,987 controls]) of the GERA and UKB [38]. POAG is defined by the International Classification of Diseases-9 diagnosis code of POAG or normal-tension glaucoma, excluding other subtypes of glaucoma (e.g., pseudoexfoliation, pigmentary, etc.) [38]. Table 1 enlists the datasets used for the summary statistics.

2.3. Selection of the Genetic IVs

Single-nucleotide polymorphisms (SNPs) associated with each exposure at the GWAS threshold p < 5.0 × 10⁻⁸ were used as IVs. To verify that each IV was independent of the other, the SNPs were pruned based on linkage disequilibrium (LD; r2 = 0.001, clumping distance = 10,000 kb). The 1000 Genomes Phase III Dataset (European population) was used as the reference panel to compute the LD for the clumping procedure. The F-value was determined using the formula F = R2(n − 2)/(1 − R2), where n is the sample size and R2 is the proportion of exposure variance by genetic variance [39]. F-values > 10 indicate the absence of a weak instrument bias [40].

2.4. Mendelian Randomisation

The MR analysis was conducted based on the following three presumptions concerning IVs: (1) they have to show a significant association with the exposure, (2) they must be unrelated to the confounding variables, and (3) they should solely affect the outcomes via exposure, indicating the absence of a directional horizontal pleiotropy effect. We employed the inverse variance-weighted (IVW) MR method with random effects as the major strategy [33,40,41]. The Cochran’s Q-test was used to evaluate the heterogeneity among SNPs in the IVW technique [41]. The presence of heterogeneity was shown by a p-value of less than 0.05 for Cochran’s Q-test. Heterogeneity may suggest the potential existence of horizontal pleiotropy. The effectiveness of IVW analysis is maximized when all genetic variations satisfy the three assumptions for IVs [42]. We conducted a sensitivity analysis to test the validity and reliability, taking into consideration potential concerns such as instrumental bias or pleiotropy. The weighted median approach [43], MR-Egger regression (with or without adjustment using the Simulation Extrapolation [SIMEX] method) [44,45], and the MR pleiotropy residual sum and outlier (MR-PRESSO) [46] were employed for sensitivity analysis. The weighted median approach yields reliable estimates, even when as many as 50% of the IVs are inaccurate [42]. The MR-Egger approach provides estimates of appropriate causal effects, even when pleiotropic effects are present, by taking into account a nonzero intercept that denotes the mean horizontal pleiotropic impacts and a slope that serves as an estimate of the causal impact [43]. If there is a violation of the assumption that there is no measurement error (I2 < 90%), bias can be addressed by employing MR-Egger regression with SIMEX [45]. The heterogeneity of the MR-Egger technique was assessed by the utilization of Rücker’s Q′ statistic tests [47]. The MR-PRESSO method is an expansion of the IVW with the objective of mitigating the presence of pleiotropic outliers [46]. The MR–PRESSO global test was employed to assess the presence of directional horizontal pleiotropy [46]. When the MR-PRESSO global test gives a p-value below 0.05, the MR-PRESSO outlier test is utilized to detect the presence of particular horizontal pleiotropic outlier variations [46]. As a consequence, the findings were interpreted in accordance with the suitable technique for MR analysis [48]. All analyses were conducted using the TwoSampleMR and SIMEX packages in R version 3.6.3 (R Core Team, Vienna, Austria).

3. Results

3.1. Genetic IVs

In total, 180 IVs were identified at the significance threshold values of p < 5.0 × 10⁻⁸ for T2D (Table 2). In addition, 108 and 303 IVs were identified at the significance limit of p < 5.0 × 10⁻⁸ for FG and HbA1c, respectively. The mean F-statistics for T2D, FG, and HbA1c (176.16, 111.30, and 119.61, respectively) used for MR were > 10, demonstrating a low likelihood of weak instrument bias (Table 2 and Supplementary Table S1). Detailed information on the IVs is provided in Supplementary Table S1.

3.2. Heterogeneity and Horizontal Pleiotropy of IVs

To evaluate the quality of the IVs, we computed the I2 and p values for Cochran’s Q statistic using IVW, Rücker’s Q’ statistic using MR-Egger, and the MR-PRESSO global test, as displayed in Table 2. The Cochran’s Q test from IVW demonstrated that the IVs for T2D, FG, and HbA1c (all p < 0.001) were heterogeneous (Table 2); therefore, a random-effects IVW approach was used. Additionally, the Rücker’s Q′ test from the MR-Egger demonstrated heterogeneity between the IVs (all p < 0.001). Although heterogeneity suggests genetic variations could indicate pleiotropy, the MR-Egger regression intercepts did not show horizontal pleiotropy (p > 0.05) in all tests, regardless of the SIMEX correction (Table 2). In the MR-PRESSO global test for T2D, FG, and HbA1c, which showed substantial horizontal pleiotropic effects (all p < 0.001), the MR-PRESSO results were considered the primary outcomes based on prior research [48].

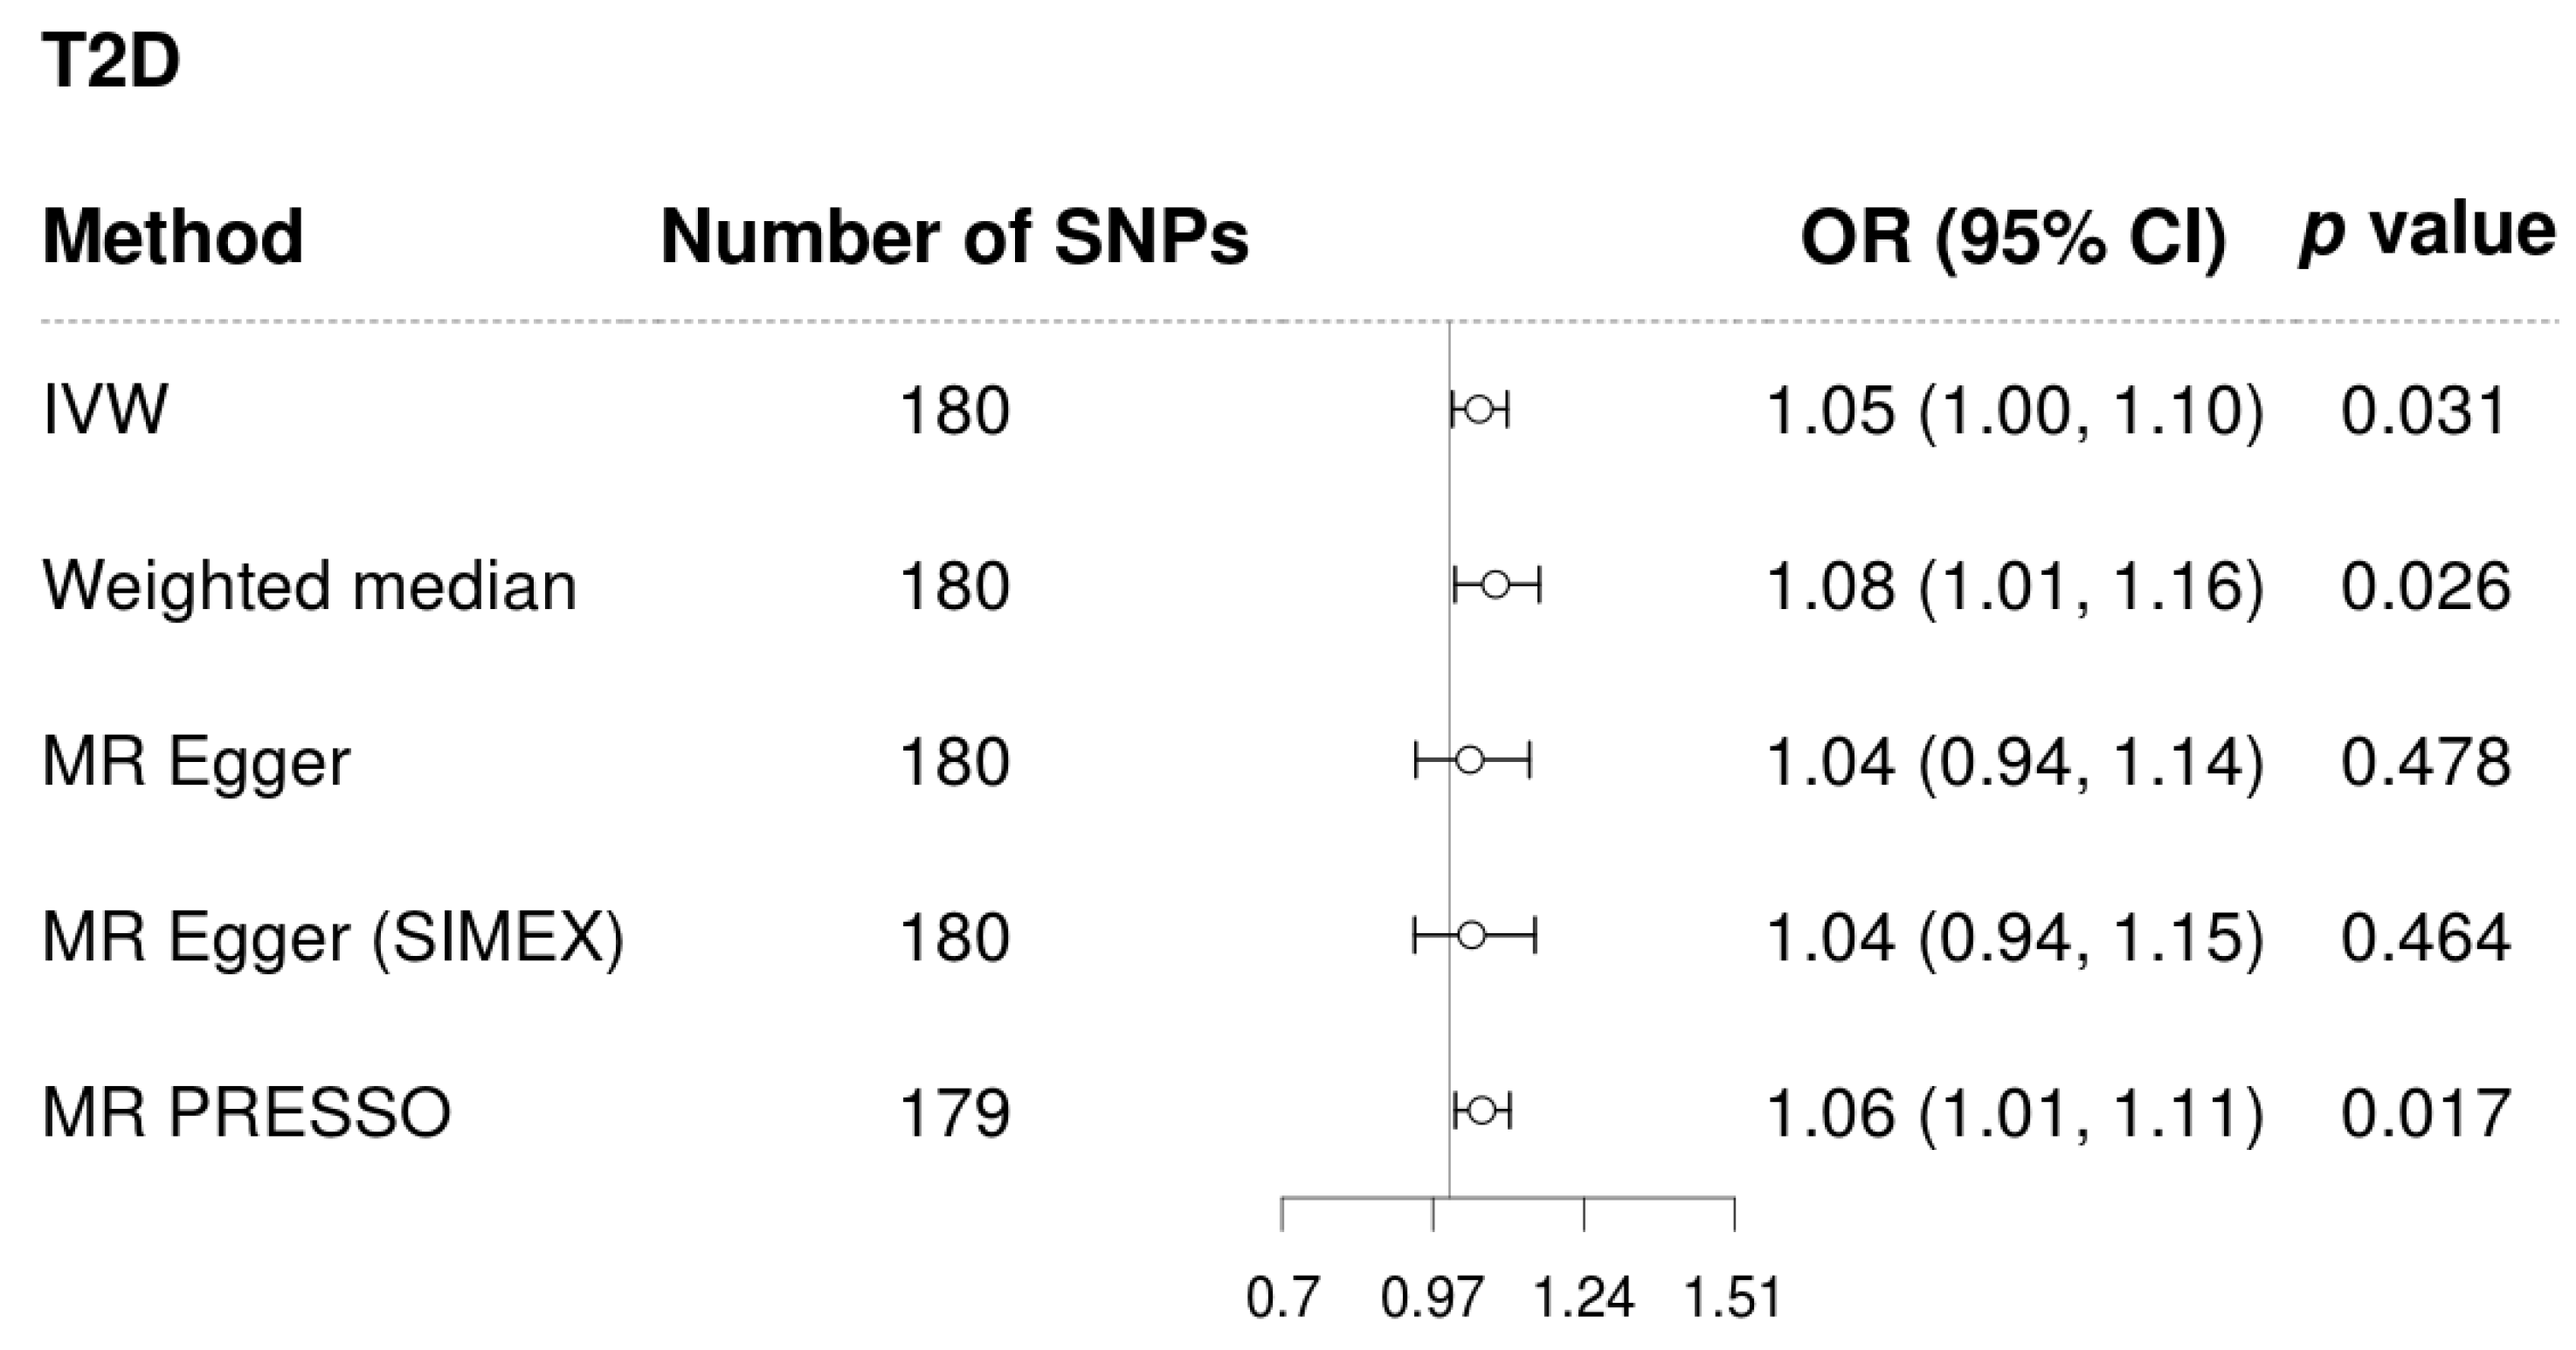
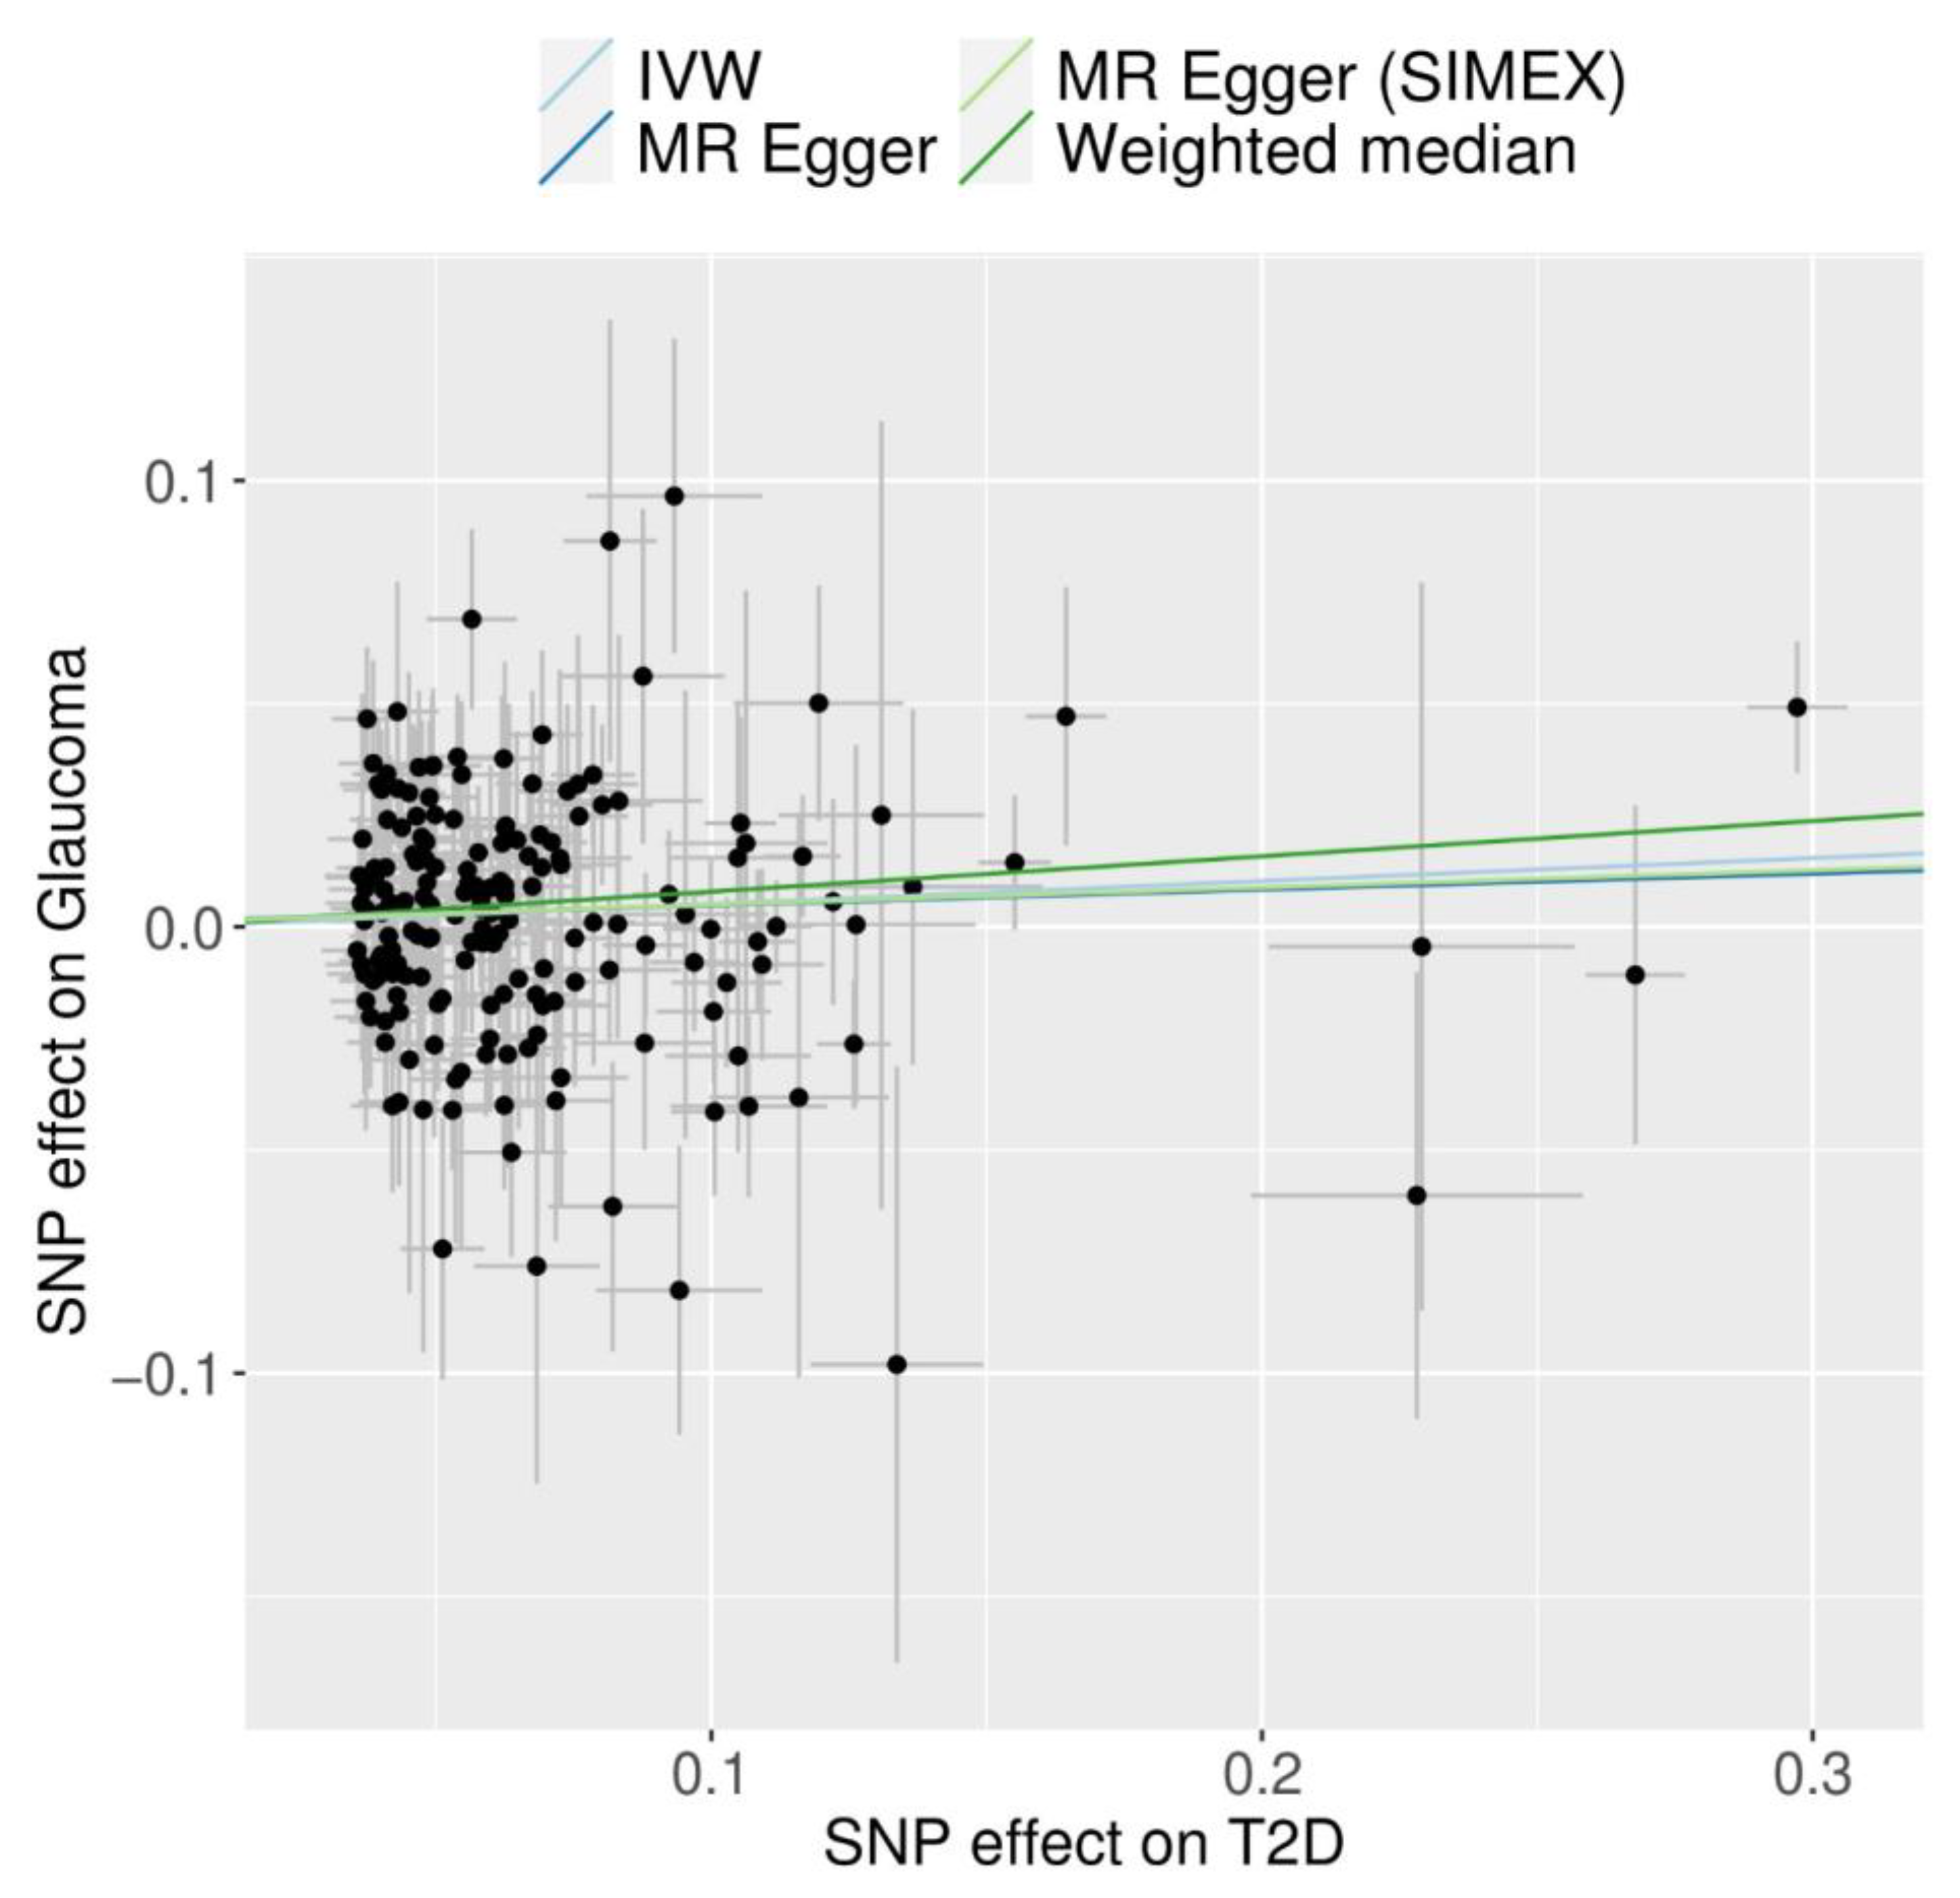
3.3. Mendelian Randomisation for the Possible Causal Association between T2D and POAG

T2D demonstrated a significant and probable causal association with glaucoma using the IVW method (MR OR = 1.05, 95% confidence interval (CI): 1.00–1.10 p = 0.031), weighted median method (MR OR = 1.08, 95% CI: 1.01–1.16, p = 0.026), and MR-PRESSO (MR OR = 1.06, 95% CI: 1.01–1.11 p = 0.017) (Figure 2). The genetic correlation between T2D and glaucoma for each SNP was a significant positive correlation in scatter plots (Figure 3).

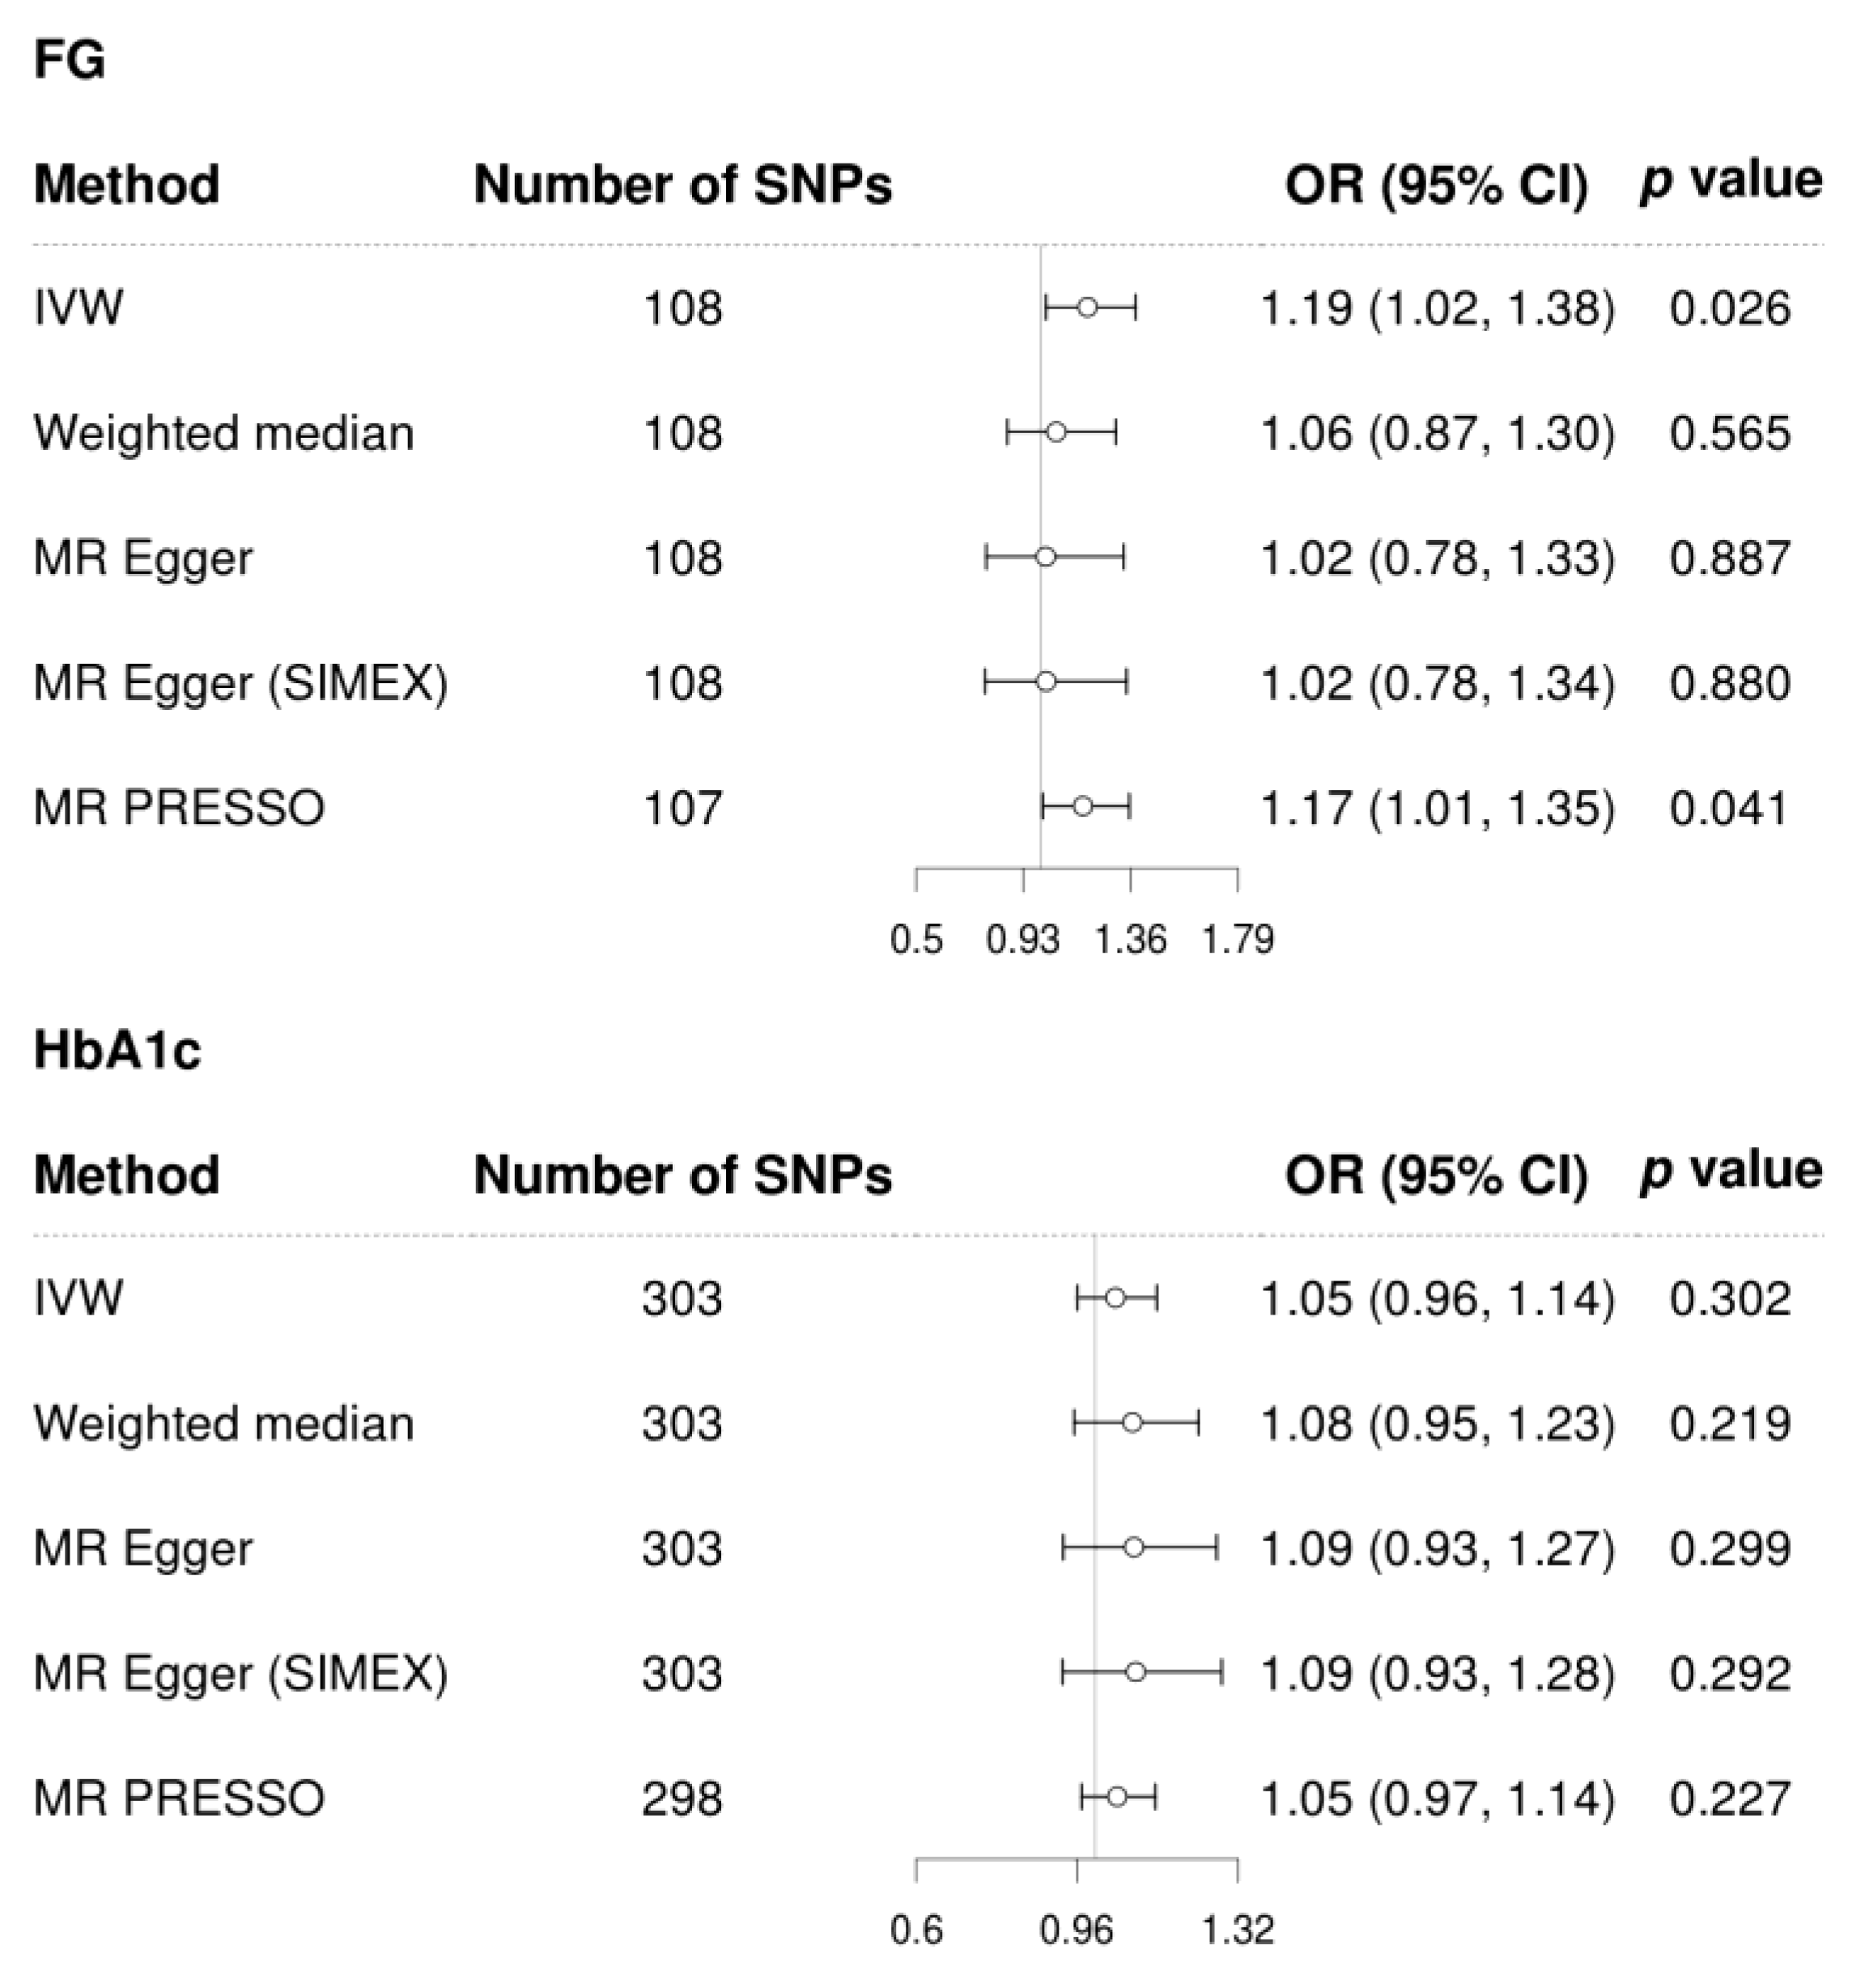
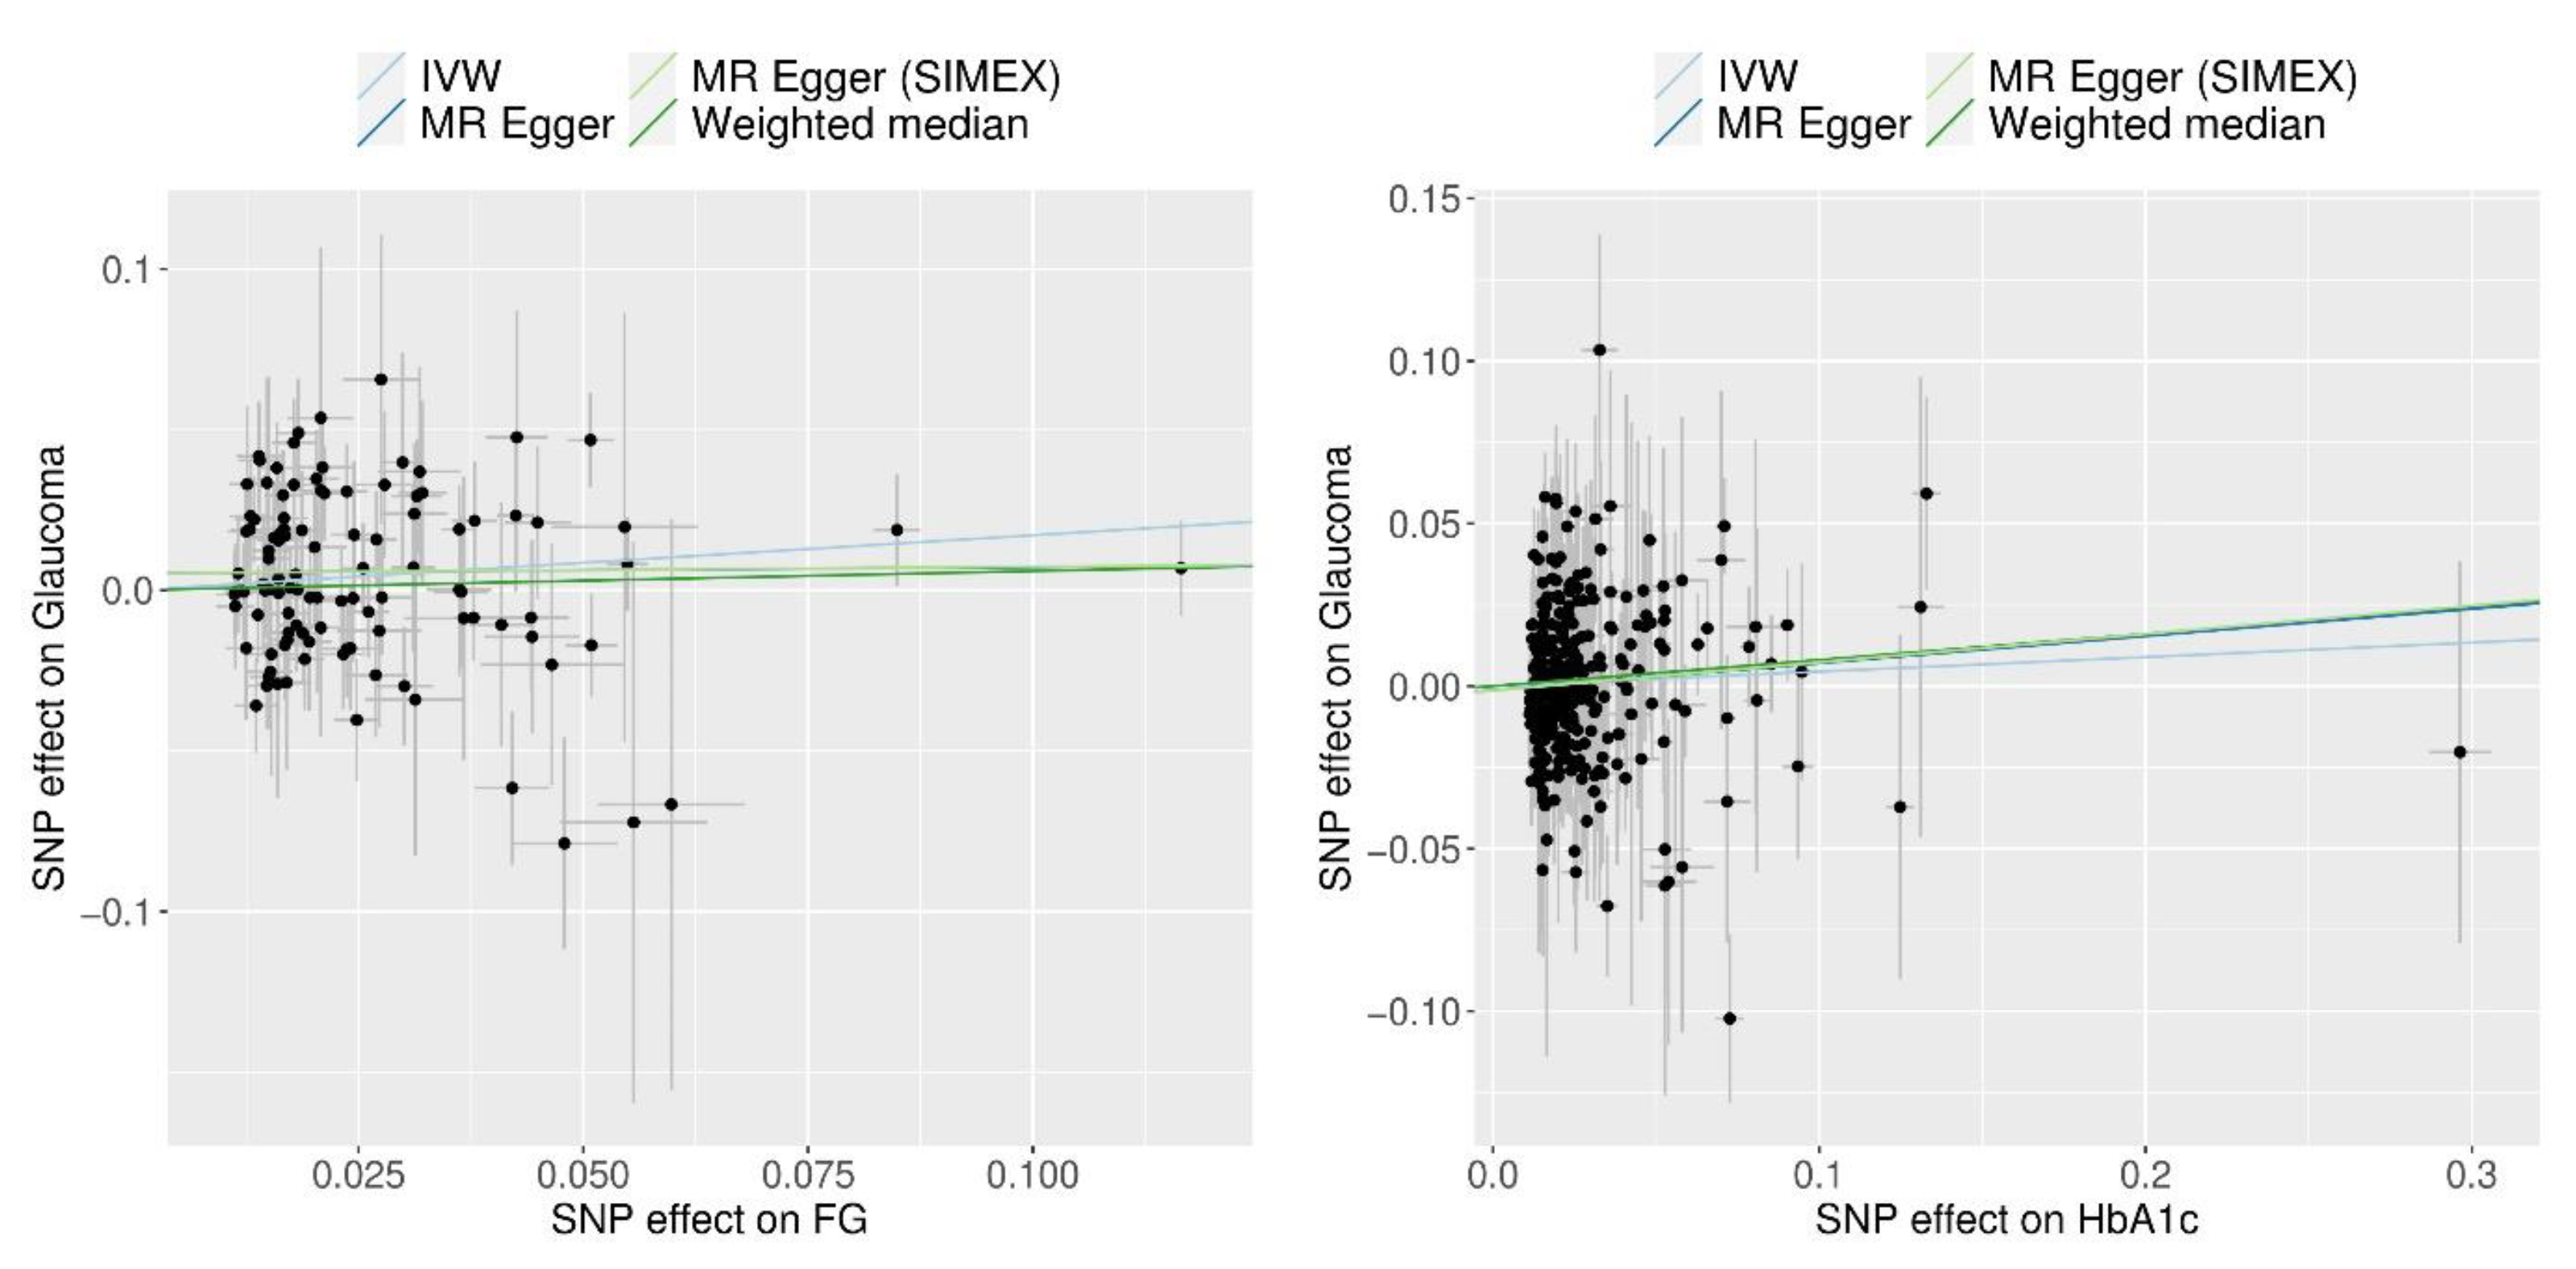
3.4. Mendelian Randomisation for the Possible Causal Association of FG and HbA1c with POAG

FG demonstrated a significant causal association with POAG using the IVW method (MR OR = 1.19, 95% CI: 1.02–1.38 p = 0.026) and MR-PRESSO (MR OR = 1.17, 95% CI: 1.01–1.35, p = 0.041) (Figure 4). However, HbA1c did not demonstrate a significant causal association with POAG (all p > 0.05, all MR methods; Figure 4). Scatter plots indicate the genetic association between FG and HbA1c and that with POAG for each SNP (Figure 5).

4. Discussion

Our study demonstrated a possible causal association between T2D and POAG. Moreover, FG levels, which are popular glycaemic traits to diagnose T2D and prediabetes conditions, demonstrated a potential causal association with POAG. In contrast, HbA1c levels did not demonstrate a causal association with POAG.
Several observational studies have reported an association between T2D and glaucoma [15,49,50]. In addition, a meta-analysis has suggested that upon comparing individuals with and without diabetes, the pooled OR for POAG was 1.50 (95% CI, 1.16–1.93) [51]. However, several studies have reported an insignificant association [21,22,23,24] or negative point estimate [20,25,26]. Therefore, a large-scale study is required to address the disparities between these findings. A large meta-analysis, including 47 studies with 2,981,341 individuals, suggested that T2D is associated with POAG, indicating a pooled relative risk of 1.48 (95% CI: 1.29–1.71) [28]. In addition to an association, an MR analysis method was used to analyse these causal associations. Our study is consistent with the findings of an MR study, which reported on the possible causal relationship between POAG and T2D in Europeans (body mass index [BMI]-unadjusted: OR = 1.07, 95% CI, 1.01–1.14, and p = 0.028; BMI-adjusted: OR = 1.07, 95% CI, 1.01–1.15, and p = 0.035) [31] (Table 3). In our study, considering the possibility of pleiotropy due to the use of multi-ethnic genome-wide data, we conducted additional analyses using data composed of individuals of European descent (Additional File S1). As a result, we confirmed that T2D has a robust causal effect on POAG. The mechanistic consideration of the causality of T2D in POAG is necessary, and there is evidence from other studies that the presence of T2D causally contributes to an increase in IOP [52]. However, one previous study showed the possible causality between T2D and POAG was absent in the analysis of East Asian ancestry (BMI-unadjusted: OR = 1.01, 95% CI, 0.95–1.06, and p = 0.866; BMI-adjusted: OR = 1.00, 95% CI, 0.94–1.05, and p = 0.882) [31]. This difference can be attributed to the inclusion of approximately 46,000 East Asians in the outcome data, as well as the limited sample size, resulting in the possibility that the result may have been insignificant.
FG levels are often used for screening and evaluating prediabetes and T2D [54,55]. Elevated blood glucose levels, an important feature of T2D, are expected to be a reasonable indicator to evaluate the association between T2D and POAG. An observational study using 374,376 individuals from the Korea National Health Insurance data reported a positive association between FG levels and the incidence of glaucoma, with a hazard ratio of 2.022 (95% CI: 1.494–2.736) [56]. Similarly, we observed a strong association between FG and glaucoma using the MR analysis, which is a more stringent validation technique. Despite being a distinct genetic dataset, our results suggesting the causality of FG in POAG are substantial because they are novel and significant, compared with those of a previous study that used an MR analysis (Table 3). A hypothesis to explain this possibility may be that higher plasma FG is associated with higher glucose levels in the aqueous humour, which increases trabecular fibronectin levels and is associated with elevated IOP [57]. These hypotheses are supported by recent meta-analyses that suggest a pooled average increase of 0.09 mmHg in the IOP associated with a 10 mg/dL increase in the FG [28]. However, the association between diabetic retinopathy and glaucoma has been inconsistently demonstrated in several studies [58].
Clinically, HbA1c levels are associated with diabetic microvascular complications, which in turn are associated with long-term glycaemic control [59]. Researchers recommend maintaining a target HbA1c < 48 mmol/mol (6.5%) for the general population with T2D [60,61,62]. Regarding HbA1c and glucose levels, the Singapore Malay Eye Study demonstrated an elevated but insignificant trend, whereas a case-control study in Europe demonstrated a statistically significant association between elevated HbA1c levels and glaucoma [16]. However, HbA1c levels were not causally associated with POAG in our study, consistent with previous results (Table 3). Although we used 303 IVs in this study, heterogeneity and horizontal pleiotropy may have affected our results. An MR study using a large dataset demonstrated that HbA1c indicated marginal significance (p = 0.064); however, combined with the UKBB and FinnGen project dataset, the HbA1c indicated a possible causal association (OR: 1.28 95% CI, 1.01–1.61) [63]. A previous study had shown that the dose-response relationships between glucose metabolism markers and glaucoma prevalence are hockey-stick-shaped for HbA1c, and J-shaped for FG [18]. HbA1c quantifies glycaemic control over a period of 2 to 3 months, whereas FG assesses acute blood glucose levels. Consequently, FG is more sensitive to diseases as compared to HbA1c [64]. These different sensitivities in FG and HbA1C may lead to the different causal effects on POAG.
The chief strength of our study was the use of a relatively large cohort dataset, which suggested a possible causal association between T2D, and FG in glaucoma. However, this study had a few limitations. First, we did not have access to individual-level data; thus, we were unable to explain the presence of numerous confounding factors using summary statistics based on two-sample MR. Second, the test procedures to validate the MR hypotheses do not provide complete validation. The violations of MR assumptions can lead to invalid conclusions, thus warranting a cautious interpretation of the results. Third, few genome datasets include ophthalmic phenotype data; thus, it was difficult to separate and summarise a meta-analysis that included a portion of the UKB. However, considering the research results according to the large-cohort MR analysis methodology [35], the IVW and weighted median remain unaffected, which in turn influences the bias of MR-Egger. IVW and MR-PRESSO were the primary statistics in our study [48]; thus, the bias issue was minimised. In addition, there was no substantial difference between the MR methodologies, thus establishing the credibility of our results. Fourth, since our results contained heterogeneity issues, caution must be exercised when interpreting. The source of heterogeneity included the pleiotropy effect. As an alternative possibility, the samples used to estimate the SNP-exposure and SNP-outcome associations are not homogeneous; for example, a difference in the distribution of a covariate confounding the exposure-outcome relationship across samples could induce heterogeneity. In addition, the SNP-exposure and SNP-outcome relationships are not correctly specified—i.e., in the two-sample setting, the causal relationship between the exposure and the outcome is different in each of the samples [65]. Although we do not know the exact cause of heterogeneity, it was a multi-ethnic result, and since heterogeneity was not significant in the European race results that were additionally analysed (Additional File S1, [66]), it would be ideal to mention the possibility of heterogeneity due to heterogeneity in exposure and outcome data.

5. Conclusions

Our study demonstrated the possible causal association of T2D and FG on POAG development in European and East Asian populations using an MR analysis. The analysis of the European data set yielded consistent results, demonstrating the significance of POAG in T2D and enhancing the robustness and replicability of the findings. This potential causal relationship between T2D or FG and POAG highlights the significance of T2D in early detection and prevention of POAG, considering the high prevalence of T2D. Researchers should further clarify and investigate the association between T2D and POAG.

Supplementary Materials

The following supporting information can be downloaded at: https://www.mdpi.com/article/10.3390/biomedicines12040866/s1, Table S1. List of single-nucleotide polymorphisms used as instrumental variables. Additional File S1: Table S2. Summary statistics of data source. Table S3. Heterogeneity and horizontal pleiotropy of instrumental variables. Table S4. Estimates from MR methods for the association between type 2 diabetes and glaucoma. Figure S1. Forest plot for association of type 2 diabetes and glaucoma. Figure S2. Scatter plots of MR tests assessing the type 2 diabetes and glaucoma.

Author Contributions

J.H.S. and Y.L. designed the study, J.H.S. and Y.L. collected the data, Y.L. performed the statistical analysis, and J.H.S. drafted the manuscript. All authors have read and agreed to the published version of the manuscript.

Funding

This research was funded by the National Research Foundation of Korea (NRF) grant funded by the Korean Government (Ministry of Science and ICT) (No. 2022R1C1C1002929).

Institutional Review Board Statement

The study was conducted in accordance with the tenets of the Declaration of Helsinki and approved by the Institutional Review Board of the Veterans Health Service Medical Center (IRB No. 2022-03-004; 16 March 2022).

Informed Consent Statement

Informed consent was not required because anonymised and de-identified data were used in the analyses. The requirement for patient consent was waived owing to the retrospective nature of the study.

Data Availability Statement

The datasets used and/or analysed in the current study are available from Biobank Japan (BBJ https://pheweb.jp/, accessed on 30 July 2022) [36] and the GWAS catalogue (https://www.ebi.ac.uk/gwas/summary-statistics, accessed on 19 July 2022).

Acknowledgments

We would like to thank Biobank Japan (BBJ https://pheweb.jp/, accessed on 30 July 2022) [36], GWAS catalogue (https://www.ebi.ac.uk/gwas/summary-statistics, accessed 19 July 2022), and Genetic Epidemiology Research in Adult Health and Aging (GERA) cohort and UK Biobank (UKB) [37]. FinnGen (https://finngen.gitbook.io/documentation/v/r5/, accessed on 30 July 2023).

Conflicts of Interest

The authors declare no conflicts of interest.

References

  1. Quigley, H.A. Glaucoma. Lancet 2011, 377, 1367–1377. [Google Scholar] [CrossRef] [PubMed]
  2. Tham, Y.C.; Li, X.; Wong, T.Y.; Quigley, H.A.; Aung, T.; Cheng, C.Y. Global prevalence of glaucoma and projections of glaucoma burden through 2040: A systematic review and meta-analysis. Ophthalmology 2014, 121, 2081–2090. [Google Scholar] [CrossRef] [PubMed]
  3. Jonas, J.B.; Aung, T.; Bourne, R.R.; Bron, A.M.; Ritch, R.; Panda-Jonas, S. Glaucoma. Lancet 2017, 390, 2183–2193. [Google Scholar] [CrossRef] [PubMed]
  4. Bonomi, L.; Marchini, G.; Marraffa, M.; Bernardi, P.; Morbio, R.; Varotto, A. Vascular risk factors for primary open angle glaucoma: The Egna-Neumarkt Study. Ophthalmology 2000, 107, 1287–1293. [Google Scholar] [CrossRef] [PubMed]
  5. Yanagi, M.; Kawasaki, R.; Wang, J.J.; Wong, T.Y.; Crowston, J.; Kiuchi, Y. Vascular risk factors in glaucoma: A review. Clin. Exp. Ophthalmol. 2011, 39, 252–258. [Google Scholar] [CrossRef] [PubMed]
  6. Weinreb, R.N.; Aung, T.; Medeiros, F.A. The pathophysiology and treatment of glaucoma: A review. JAMA 2014, 311, 1901–1911. [Google Scholar] [CrossRef] [PubMed]
  7. Shin, H.T.; Yoon, B.W.; Seo, J.H. Analysis of risk allele frequencies of single nucleotide polymorphisms related to open-angle glaucoma in different ethnic groups. BMC Med. Genom. 2021, 14, 80. [Google Scholar] [CrossRef]
  8. Seo, J.H.; Kim, T.W.; Weinreb, R.N. Lamina cribrosa depth in healthy eyes. Investig. Ophthalmol. Vis. Sci. 2014, 55, 1241–1251. [Google Scholar] [CrossRef] [PubMed]
  9. Jonas, J.B. Role of cerebrospinal fluid pressure in the pathogenesis of glaucoma. Acta Ophthalmol. 2011, 89, 505–514. [Google Scholar] [CrossRef]
  10. Seo, J.H.; Kim, T.W.; Weinreb, R.N.; Kim, Y.A.; Kim, M. Relationship of intraocular pressure and frequency of spontaneous retinal venous pulsation in primary open-angle glaucoma. Ophthalmology 2012, 119, 2254–2260. [Google Scholar] [CrossRef]
  11. International Expert Committee. International Expert Committee report on the role of the A1C assay in the diagnosis of diabetes. Diabetes Care 2009, 32, 1327–1334. [Google Scholar] [CrossRef] [PubMed]
  12. American Diabetes Association. Diagnosis and classification of diabetes mellitus. Diabetes Care 2014, 37 (Suppl. S1), S81–S90. [Google Scholar] [CrossRef] [PubMed]
  13. Ogurtsova, K.; da Rocha Fernandes, J.D.; Huang, Y.; Linnenkamp, U.; Guariguata, L.; Cho, N.H.; Cavan, D.; Shaw, J.E.; Makaroff, L.E. IDF Diabetes Atlas: Global estimates for the prevalence of diabetes for 2015 and 2040. Diabetes Res. Clin. Pract. 2017, 128, 40–50. [Google Scholar] [CrossRef]
  14. Ocular Hypertension Treatment Study Group; European Glaucoma Prevention Study Group; Gordon, M.O.; Torri, V.; Miglior, S.; Beiser, J.A.; Floriani, I.; Miller, J.P.; Gao, F.; Adamsons, I.; et al. Validated prediction model for the development of primary open-angle glaucoma in individuals with ocular hypertension. Ophthalmology 2007, 114, 10–19. [Google Scholar] [CrossRef] [PubMed]
  15. Mitchell, P.; Smith, W.; Chey, T.; Healey, P.R. Open-angle glaucoma and diabetes: The Blue Mountains eye study, Australia. Ophthalmology 1997, 104, 712–718. [Google Scholar] [CrossRef] [PubMed]
  16. Welinder, L.G.; Riis, A.H.; Knudsen, L.L.; Thomsen, R.W. Diabetes, glycemic control and risk of medical glaucoma treatment: A population-based case-control study. Clin. Epidemiol. 2009, 1, 125–131. [Google Scholar] [CrossRef] [PubMed]
  17. Newman-Casey, P.A.; Talwar, N.; Nan, B.; Musch, D.C.; Stein, J.D. The relationship between components of metabolic syndrome and open-angle glaucoma. Ophthalmology 2011, 118, 1318–1326. [Google Scholar] [CrossRef] [PubMed]
  18. Zhao, D.; Cho, J.; Kim, M.H.; Friedman, D.; Guallar, E. Diabetes, glucose metabolism, and glaucoma: The 2005-2008 National Health and Nutrition Examination Survey. PLoS ONE 2014, 9, e112460. [Google Scholar] [CrossRef] [PubMed]
  19. Tielsch, J.M.; Katz, J.; Quigley, H.A.; Javitt, J.C.; Sommer, A. Diabetes, intraocular pressure, and primary open-angle glaucoma in the Baltimore Eye Survey. Ophthalmology 1995, 102, 48–53. [Google Scholar] [CrossRef]
  20. de Voogd, S.; Ikram, M.K.; Wolfs, R.C.; Jansonius, N.M.; Witteman, J.C.; Hofman, A.; de Jong, P.T. Is diabetes mellitus a risk factor for open-angle glaucoma? The Rotterdam Study. Ophthalmology 2006, 113, 1827–1831. [Google Scholar] [CrossRef]
  21. Quigley, H.A.; West, S.K.; Rodriguez, J.; Munoz, B.; Klein, R.; Snyder, R. The prevalence of glaucoma in a population-based study of Hispanic subjects: Proyecto VER. Arch. Ophthalmol. 2001, 119, 1819–1826. [Google Scholar] [CrossRef]
  22. Leske, M.C.; Connell, A.M.; Wu, S.Y.; Hyman, L.G.; Schachat, A.P. Risk factors for open-angle glaucoma. The Barbados Eye Study. Arch. Ophthalmol. 1995, 113, 918–924. [Google Scholar] [CrossRef] [PubMed]
  23. Tielsch, J.M.; Katz, J.; Sommer, A.; Quigley, H.A.; Javitt, J.C. Hypertension, perfusion pressure, and primary open-angle glaucoma. A population-based assessment. Arch. Ophthalmol. 1995, 113, 216–221. [Google Scholar] [CrossRef]
  24. Kaimbo, D.K.; Buntinx, F.; Missotten, L. Risk factors for open-angle glaucoma: A case-control study. J. Clin. Epidemiol. 2001, 54, 166–171. [Google Scholar] [CrossRef]
  25. Jonas, J.B.; Grundler, A.E. Prevalence of diabetes mellitus and arterial hypertension in primary and secondary open-angle glaucomas. Graefes Arch. Clin. Exp. Ophthalmol. 1998, 236, 202–206. [Google Scholar] [CrossRef] [PubMed]
  26. Charliat, G.; Jolly, D.; Blanchard, F. Genetic risk factor in primary open-angle glaucoma: A case-control study. Ophthalmic Epidemiol. 1994, 1, 131–138. [Google Scholar] [CrossRef] [PubMed]
  27. Jung, Y.; Han, K.; Park, H.L.; Park, C.K. Type 2 diabetes mellitus and risk of open-angle glaucoma development in Koreans: An 11-year nationwide propensity-score-matched study. Diabetes Metab. 2018, 44, 328–332. [Google Scholar] [CrossRef] [PubMed]
  28. Zhao, D.; Cho, J.; Kim, M.H.; Friedman, D.S.; Guallar, E. Diabetes, fasting glucose, and the risk of glaucoma: A meta-analysis. Ophthalmology 2015, 122, 72–78. [Google Scholar] [CrossRef]
  29. Burgess, S.; Thompson, S.G. Multivariable Mendelian randomization: The use of pleiotropic genetic variants to estimate causal effects. Am. J. Epidemiol. 2015, 181, 251–260. [Google Scholar] [CrossRef]
  30. Burgess, S.; Thompson, S.G. Interpreting findings from Mendelian randomization using the MR-Egger method. Eur. J. Epidemiol. 2017, 32, 377–389. [Google Scholar] [CrossRef]
  31. Hu, Z.; Zhou, F.; Kaminga, A.C.; Xu, H. Type 2 Diabetes, Fasting Glucose, Hemoglobin A1c Levels and Risk of Primary Open-Angle Glaucoma: A Mendelian Randomization Study. Investig. Ophthalmol. Vis. Sci. 2022, 63, 37. [Google Scholar] [CrossRef] [PubMed]
  32. Hanyuda, A.; Goto, A.; Nakatochi, M.; Sutoh, Y.; Narita, A.; Nakano, S.; Katagiri, R.; Wakai, K.; Takashima, N.; Koyama, T.; et al. Association Between Glycemic Traits and Primary Open-Angle Glaucoma: A Mendelian Randomization Study in the Japanese Population. Am. J. Ophthalmol. 2022, 245, 193–201. [Google Scholar] [CrossRef] [PubMed]
  33. Lee, Y.; Kim, Y.A.; Seo, J.H. Causal Association of Obesity and Dyslipidemia with Type 2 Diabetes: A Two-Sample Mendelian Randomization Study. Genes 2022, 13, 2407. [Google Scholar] [CrossRef] [PubMed]
  34. Seo, J.H.; Lee, Y. Causal Association between Iritis or Uveitis and Glaucoma: A Two-Sample Mendelian Randomisation Study. Genes 2023, 14, 642. [Google Scholar] [CrossRef] [PubMed]
  35. Minelli, C.; Del Greco, M.F.; van der Plaat, D.A.; Bowden, J.; Sheehan, N.A.; Thompson, J. The use of two-sample methods for Mendelian randomization analyses on single large datasets. Int. J. Epidemiol. 2021, 50, 1651–1659. [Google Scholar] [CrossRef] [PubMed]
  36. Sakaue, S.; Kanai, M.; Tanigawa, Y.; Karjalainen, J.; Kurki, M.; Koshiba, S.; Narita, A.; Konuma, T.; Yamamoto, K.; Akiyama, M.; et al. A cross-population atlas of genetic associations for 220 human phenotypes. Nat. Genet. 2021, 53, 1415–1424. [Google Scholar] [CrossRef] [PubMed]
  37. Choquet, H.; Paylakhi, S.; Kneeland, S.C.; Thai, K.K.; Hoffmann, T.J.; Yin, J.; Kvale, M.N.; Banda, Y.; Tolman, N.G.; Williams, P.A.; et al. A multiethnic genome-wide association study of primary open-angle glaucoma identifies novel risk loci. Nat. Commun. 2018, 9, 2278. [Google Scholar] [CrossRef] [PubMed]
  38. Loh, M.; Zhang, W.; Ng, H.K.; Schmid, K.; Lamri, A.; Tong, L.; Ahmad, M.; Lee, J.J.; Ng, M.C.Y.; Petty, L.E.; et al. Identification of genetic effects underlying type 2 diabetes in South Asian and European populations. Commun. Biol. 2022, 5, 329. [Google Scholar] [CrossRef]
  39. Burgess, S.; Thompson, S.G.; CRP CHD Genetics Collaboration. Avoiding bias from weak instruments in Mendelian randomization studies. Int. J. Epidemiol. 2011, 40, 755–764. [Google Scholar] [CrossRef]
  40. Burgess, S.; Butterworth, A.; Thompson, S.G. Mendelian randomization analysis with multiple genetic variants using summarized data. Genet. Epidemiol. 2013, 37, 658–665. [Google Scholar] [CrossRef]
  41. Bowden, J.; Del Greco, M.F.; Minelli, C.; Davey Smith, G.; Sheehan, N.; Thompson, J. A framework for the investigation of pleiotropy in two-sample summary data Mendelian randomization. Stat. Med. 2017, 36, 1783–1802. [Google Scholar] [CrossRef]
  42. Burgess, S.; Davey Smith, G.; Davies, N.M.; Dudbridge, F.; Gill, D.; Glymour, M.M.; Hartwig, F.P.; Holmes, M.V.; Minelli, C.; Relton, C.L.; et al. Guidelines for performing Mendelian randomization investigations. Wellcome Open Res. 2019, 4, 186. [Google Scholar] [CrossRef] [PubMed]
  43. Bowden, J.; Davey Smith, G.; Haycock, P.C.; Burgess, S. Consistent Estimation in Mendelian Randomization with Some Invalid Instruments Using a Weighted Median Estimator. Genet. Epidemiol. 2016, 40, 304–314. [Google Scholar] [CrossRef] [PubMed]
  44. Bowden, J.; Davey Smith, G.; Burgess, S. Mendelian randomization with invalid instruments: Effect estimation and bias detection through Egger regression. Int. J. Epidemiol. 2015, 44, 512–525. [Google Scholar] [CrossRef] [PubMed]
  45. Bowden, J.; Del Greco, M.F.; Minelli, C.; Davey Smith, G.; Sheehan, N.A.; Thompson, J.R. Assessing the suitability of summary data for two-sample Mendelian randomization analyses using MR-Egger regression: The role of the I2 statistic. Int. J. Epidemiol. 2016, 45, 1961–1974. [Google Scholar] [CrossRef] [PubMed]
  46. Verbanck, M.; Chen, C.Y.; Neale, B.; Do, R. Publisher Correction: Detection of widespread horizontal pleiotropy in causal relationships inferred from Mendelian randomization between complex traits and diseases. Nat. Genet. 2018, 50, 1196. [Google Scholar] [CrossRef]
  47. Greco, M.F.; Minelli, C.; Sheehan, N.A.; Thompson, J.R. Detecting pleiotropy in Mendelian randomisation studies with summary data and a continuous outcome. Stat. Med. 2015, 34, 2926–2940. [Google Scholar] [CrossRef] [PubMed]
  48. Jin, H.; Lee, S.; Won, S. Causal Evaluation of Laboratory Markers in Type 2 Diabetes on Cancer and Vascular Diseases Using Various Mendelian Randomization Tools. Front. Genet. 2020, 11, 597420. [Google Scholar] [CrossRef] [PubMed]
  49. Klein, B.E.; Klein, R.; Jensen, S.C. Open-angle glaucoma and older-onset diabetes. The Beaver Dam Eye Study. Ophthalmology 1994, 101, 1173–1177. [Google Scholar] [CrossRef]
  50. Dielemans, I.; de Jong, P.T.; Stolk, R.; Vingerling, J.R.; Grobbee, D.E.; Hofman, A. Primary open-angle glaucoma, intraocular pressure, and diabetes mellitus in the general elderly population. The Rotterdam Study. Ophthalmology 1996, 103, 1271–1275. [Google Scholar] [CrossRef]
  51. Bonovas, S.; Peponis, V.; Filioussi, K. Diabetes mellitus as a risk factor for primary open-angle glaucoma: A meta-analysis. Diabet. Med. 2004, 21, 609–614. [Google Scholar] [CrossRef] [PubMed]
  52. Yuan, R.; Liu, K.; Cai, Y.; He, F.; Xiao, X.; Zou, J. Body shape and risk of glaucoma: A Mendelian randomization. Front. Med. 2022, 9, 999974. [Google Scholar] [CrossRef] [PubMed]
  53. Lin, Y.; Zhu, X.; Luo, W.; Jiang, B.; Lin, Q.; Tang, M.; Li, X.; Xie, L. The Causal Association Between Obesity and Primary Open-Angle Glaucoma: A Two-Sample Mendelian Randomization Study. Front. Genet. 2022, 13, 835524. [Google Scholar] [CrossRef] [PubMed]
  54. The Expert Committee on the Diagnosis; Classification of Diabetes Mellitus. Report of the expert committee on the diagnosis and classification of diabetes mellitus. Diabetes Care 2003, 26 (Suppl. S1), S5–S20. [Google Scholar] [CrossRef]
  55. Galicia-Garcia, U.; Benito-Vicente, A.; Jebari, S.; Larrea-Sebal, A.; Siddiqi, H.; Uribe, K.B.; Ostolaza, H.; Martin, C. Pathophysiology of Type 2 Diabetes Mellitus. Int. J. Mol. Sci. 2020, 21, 6275. [Google Scholar] [CrossRef] [PubMed]
  56. Choi, J.A.; Park, Y.M.; Han, K.; Lee, J.; Yun, J.S.; Ko, S.H. Fasting plasma glucose level and the risk of open angle glaucoma: Nationwide population-based cohort study in Korea. PLoS ONE 2020, 15, e0239529. [Google Scholar] [CrossRef]
  57. Sato, T.; Roy, S. Effect of high glucose on fibronectin expression and cell proliferation in trabecular meshwork cells. Investig. Ophthalmol. Vis. Sci. 2002, 43, 170–175. [Google Scholar]
  58. Li, Y.; Mitchell, W.; Elze, T.; Zebardast, N. Association Between Diabetes, Diabetic Retinopathy, and Glaucoma. Curr. Diab. Rep. 2021, 21, 38. [Google Scholar] [CrossRef]
  59. Kim, Y.A.; Lee, Y.; Seo, J.H. Renal Complication and Glycemic Control in Korean Veterans with Type 2 Diabetes: A 10-Year Retrospective Cohort Study. J. Diabetes Res. 2020, 2020, 9806790. [Google Scholar] [CrossRef]
  60. UK Prospective Diabetes Study (UKPDS) Group. Intensive blood-glucose control with sulphonylureas or insulin compared with conventional treatment and risk of complications in patients with type 2 diabetes (UKPDS 33). Lancet 1998, 352, 837–853. [Google Scholar]
  61. American Diabetes Association. 6. Glycemic Targets: Standards of Medical Care in Diabetes-2019. Diabetes Care 2019, 42, S61–S70. [Google Scholar] [CrossRef] [PubMed]
  62. Diabetes Control and Complications Trial Research Group; Nathan, D.M.; Genuth, S.; Lachin, J.; Cleary, P.; Crofford, O.; Davis, M.; Rand, L.; Siebert, C. The effect of intensive treatment of diabetes on the development and progression of long-term complications in insulin-dependent diabetes mellitus. N. Engl. J. Med. 1993, 329, 977–986. [Google Scholar] [CrossRef] [PubMed]
  63. Wang, K.; Yang, F.; Liu, X.; Lin, X.; Yin, H.; Tang, Q.; Jiang, L.; Yao, K. Appraising the Effects of Metabolic Traits on the Risk of Glaucoma: A Mendelian Randomization Study. Metabolites 2023, 13, 109. [Google Scholar] [CrossRef] [PubMed]
  64. Ho-Pham, L.T.; Nguyen, U.D.T.; Tran, T.X.; Nguyen, T.V. Discordance in the diagnosis of diabetes: Comparison between HbA1c and fasting plasma glucose. PLoS ONE 2017, 12, e0182192. [Google Scholar] [CrossRef] [PubMed]
  65. Hemani, G.; Bowden, J.; Davey Smith, G. Evaluating the potential role of pleiotropy in Mendelian randomization studies. Hum. Mol. Genet. 2018, 27, R195–R208. [Google Scholar] [CrossRef]
  66. Jiang, L.; Zheng, Z.; Fang, H.; Yang, J. A generalized linear mixed model association tool for biobank-scale data. Nat. Genet. 2021, 53, 1616–1621. [Google Scholar] [CrossRef]
Figure 1. Diagram of two-sample Mendelian randomisation analysis. Abbreviation: HbA1c, glycated haemoglobin; SNP, Single nucleotide polymorphism.
Biomedicines 12 00866 g001
Figure 2. Forest plot of causal associations of T2D on glaucoma. Abbreviations: T2D, type 2 diabetes; IVW, inverse-variance weighted; SIMEX, Simulation Extrapolation; MR–PRESSO, MR- pleiotropy residual sum and outlier test; OR, odds ratio; CI, confidence interval.
Biomedicines 12 00866 g002
Figure 3. Scatter plots of MR tests assessing the effect of T2D on glaucoma. Abbreviations: T2D, type 2 diabetes; IVW, inverse-variance weighted; SIMEX, Simulation Extrapolation; MR, Mendelian randomisation. Light blue, light green, dark blue, and dark green regression lines represent the IVW, MR–Egger (SIMEX), MR–Egger, and weighted median estimate, respectively.
Biomedicines 12 00866 g003
Figure 4. Forest plot of causal associations of FG and HbA1c on glaucoma. Abbreviations: FG, fasting glucose; IVW, inverse-variance weighted; SIMEX, Simulation Extrapolation; MR–PRESSO, MR-pleiotropy residual sum and outlier test; OR, odds ratio; CI, confidence interval, HbA1c, glycated haemoglobin.
Biomedicines 12 00866 g004
Figure 5. Scatter plots of MR tests assessing the effect of FG and HbA1c on glaucoma. Abbreviations: FG, fasting glucose; IVW, inverse-variance weighted; SIMEX, Simulation Extrapolation; HbA1c, glycated haemoglobin; MR, Mendelian randomisation. Light blue, light green, dark blue, and dark green regression lines represent the IVW, MR–Egger (SIMEX), MR–Egger, and weighted median estimate, respectively.
Biomedicines 12 00866 g005
Table 1. Statistical measures summarizing the data source.
TraitsData SourceSubjects NumberPopulationVariants NumberReference
T2DBBJ Project + UKB667,504 (84,224 cases + 583,280 controls)East Asian + European25,845,091 [36]
FGBBJ Project + UKB448,252 East Asian + European20,535,873 [36]
HbA1cBBJ Project + UKB415,403 East Asian + European20,525,742 [36]
GlaucomaGERA cohort + UKB240,302
(12,315 cases + 227,987 controls)
Multi-ethnic:
214,102 European
5103 African unspecified
3571 Other admixed ancestry
1847 African American or Afro-Caribbean
5189 Hispanic or Latin American
5370 East Asian
5120 South Asian
7,760,820[37]
Abbreviations: T2D, type 2 diabetes; BBJ, BioBank Japan; UKB, UK Biobank; FG, fasting glucose; HbA1c, glycated haemoglobin; GERA, Genetic Epidemiology Research in Adult Health and Ageing.
Table 2. Heterogeneity and horizontal pleiotropy of instrumental variables.
Exposure HeterogeneityHorizontal Pleiotropy
Cochran’s Q Test
from IVW
Rucker’s Q’ Test
from MR-Egger
MR-PRESSO
Global Test
MR-Egger MR-Egger (SIMEX)
NFI2 (%)p-Valuep-Valuep-ValueIntercept, β (SE)p-ValueIntercept, β (SE)p-Value
T2D180176.16 95.57 <0.001<0.001<0.0010.001 (0.004)0.720 0.001 (0.004)0.771
FG108111.30 97.76 <0.001<0.001<0.0010.005 (0.004)0.179 0.005 (0.004)0.191
HbA1c303119.61 97.63 <0.001<0.001<0.001−0.001 (0.002)0.565 −0.001 (0.002)0.548
Abbreviation: N, number of instruments; F, mean F statistic; IVW, inverse-variance weighted; MR, Mendelian randomisation; PRESSO, pleiotropy residual sum and outlier; SIMEX, simulation extrapolation; β, beta coefficient; SE, standard error; T2D, type 2 diabetes; FG, fasting glucose; HbA1c, glycated haemoglobin.
Table 3. Comparison of previous studies using MR on type 2 diabetes and glycaemic traits on glaucoma.
EthnicityExposure DatasetOutcome DatasetInstrumental VariablesCausal Association with GlaucomaReferences
EUR339,2248591 cases, 210,201 controlsBMI: n = 64
WC: n = 36
WHR: n = 29
BMI: Significant
WC: Significant
WHR: NS
[52]
EURBMI: n = 339,224
WC and HC n = 224,459
1824 cases, 93,036 controlsBMI: n = 31
WC: n = 33
HC: n = 24
BMI: Significant
WC: NS
HC: Significant
[53]
EUR/EAST2D:
 EUR
 74,124 cases, 824,006 controls
 EAS
 77,418 cases, 356,122 controls
FG and HbA1c
 EUR: 196,991
 EAS: 36,584
182,702 EUR
(15,229 cases, 177,473 controls)
T2D: n = 165
FG: n = 58
HbA1c: n = 60
T2D: Significant
FG: NS
HbA1c: NS
[31]
46,523 EAS
(6935 cases, 39,588 controls)
T2D: n = 129
FG: n = 11
HbA1c: n = 15
T2D: NS
FG: NS
HbA1c: NS
EASFG: n = 17,289
HbA1c: n = 52,802
C-peptide: n = 1666
22,795
(3980 cases, 18,815 controls)
FG: n = 34
HbA1c: n = 43
C-peptide: n = 17
FG: NS
HbA1c: NS
C-peptide: NS
[32]
Multi-ethnicityT2D: 667,504
FG: 448,252
HbA1c: 415,403
240,302
(12,315 cases, 227,987 controls)
T2D: n = 180
FG: n = 108
HbA1c: n = 303
T2D: Significant
FG: Significant
HbA1c: NS
This study
Abbreviations: EUR, Europeans; EAS, East Asians; BMI, body mass index; WC, waist circumference; WHR, waist hip ratio; HC, hip circumference; T2D, type 2 diabetes; FG, fasting glucose; HbA1c, glycated haemoglobin; NS, not significant.
Disclaimer/Publisher’s Note: The statements, opinions and data contained in all publications are solely those of the individual author(s) and contributor(s) and not of MDPI and/or the editor(s). MDPI and/or the editor(s) disclaim responsibility for any injury to people or property resulting from any ideas, methods, instructions or products referred to in the content.

