Article

The Wnt/β-catenin/TCF/Sp5/Zic4 Gene Network That Regulates Head Organizer Activity in Hydra Is Differentially Regulated in Epidermis and Gastrodermis

by
Laura Iglesias Ollé
,
Chrystelle Perruchoud
,
Paul Gerald Layague Sanchez
,
Matthias Christian Vogg
and
Brigitte Galliot
*
Department of Genetics and Evolution, Institute of Genetics and Genomics (iGE3), Faculty of Sciences, University of Geneva, 30 Quai Ernest Ansermet, 1205 Geneva, Switzerland
*
Author to whom correspondence should be addressed.
Biomedicines 2024, 12(6), 1274; https://doi.org/10.3390/biomedicines12061274
Submission received: 22 April 2024 / Revised: 2 June 2024 / Accepted: 3 June 2024 / Published: 8 June 2024
(This article belongs to the Special Issue Hydra, Polyps, Medusae: Model Organisms in Biomedical Research)

Abstract

:
Hydra head formation depends on an organizing center in which Wnt/β-catenin signaling, that plays an inductive role, positively regulates Sp5 and Zic4, with Sp5 limiting Wnt3/β-catenin expression and Zic4 triggering tentacle formation. Using transgenic lines in which the HySp5 promoter drives eGFP expression in either the epidermis or gastrodermis, we show that Sp5 promoter activity is differentially regulated in each epithelial layer. In intact animals, epidermal HySp5:GFP activity is strong apically and weak along the body column, while in the gastrodermis, it is maximal in the tentacle ring region and maintained at a high level along the upper body column. During apical regeneration, HySp5:GFP is activated early in the gastrodermis and later in the epidermis. Alsterpaullone treatment induces a shift in apical HySp5:GFP expression towards the body column where it forms transient circular figures in the epidermis. Upon β-catenin(RNAi), HySp5:GFP activity is down-regulated in the epidermis while bud-like structures expressing HySp5:GFP in the gastrodermis develop. Sp5(RNAi) reveals a negative Sp5 autoregulation in the epidermis, but not in the gastrodermis. These differential regulations in the epidermis and gastrodermis highlight the distinct architectures of the Wnt/β-catenin/TCF/Sp5/Zic4 network in the hypostome, tentacle base and body column of intact animals, as well as in the buds and apical and basal regenerating tips.

Graphical Abstract

1. Introduction

Hydra is a freshwater hydrozoan polyp known for its exceptional regenerative capacities, including its capacity to regrow any missing part of its body, such as a new fully functional head in three to four days after a mid-gastric bisection (reviewed in [1]). Its anatomy is simple; it is a gastric tube composed of two myoepithelial layers known as the epidermis and gastrodermis along a single oral–aboral axis. This bilayered gastric tube connects the apical or head region at the oral side to the basal disc at the aboral side. The regenerative process relies on the rapid establishment of a head organizer in the regenerating tip, initially identified by Ethel Browne through transplantation experiments [2]. Indeed, she showed that tissues isolated from the head of intact animals, from the head-regenerating tip or from the presumptive head of the developing bud, can instruct and recruit cells from the body column of the host to induce the formation of an ectopic head, a property later named organizer activity by Spemann and Mangold [3]. Additional transplantation experiments confirmed that the head organizer is actively involved in developmental processes in Hydra such as 3D reconstruction of the missing head after decapitation at any level along the body column or formation of a new head during budding. In addition, the head organizer is also required in a homeostatic context, actively maintaining head patterning in intact animals [4,5,6,7,8,9]. Hence, in Hydra, two types of head organizer activity take place, one in homeostasis and the other in developmental contexts, the latter ones giving rise to the former.
The principle of organizer activity was later shown to be also at work during embryonic development in vertebrates, initially in gastrulae [3,10] and later on during appendage and hindbrain development [11,12,13,14]. These organizers are transient developmental structures with evolutionarily conserved patterning properties [15]. Similarly, regenerating blastema that form after amputation can be considered as organizing centers, which exhibit patterning properties to reconstruct the missing structure due to the molecular instructions they deliver to the surrounding cells to modify their behavior [8,16,17,18]. Indeed, these recruitment and patterning properties can be observed by transplanting regenerative blastema.
The Hydra polyp, an animal easily maintained in the laboratory, provides a model to decipher the cellular and molecular basis of regeneration. Transplantation experiments identified two distinct activities for the head organizer named head activation and head inhibition, both with maximal activity apically and a theoretical parallel apical-to-basal-graded distribution along the body axis [5,7,19,20]. In 1972, Gierer and Meinhardt proposed a reaction–diffusion model close to Turing’s one to predict how the organizer acts and how it is restored after bisection, with both processes relying on the cross-talk between an auto-catalytic short-range activator and a longer-range inhibitor, interacting in a positive–negative feedback loop [21]. According to this model, the activator positively acts on its own production as well as on that of the inhibitor, whereas the inhibitor negatively acts on the production/activity/stability of the activator. At any position along the animal length, the equilibrium between these two components is tightly controlled under homeostatic conditions, but is immediately disrupted upon amputation, resulting in the rapid restoration of the activity of the activating component, i.e., head activation, and the delayed restoration of the activity of the inhibitory component, i.e., head inhibition, given their respective rates of diffusion, self-regulatory capacity and cross-regulation.
Three decades later, Wnt/β-catenin signaling was proposed to actually act as the head activator, required to initiate apical morphogenesis and maintain apical differentiation in Hydra [22,23,24,25,26,27]. More recently, the transcription factor Sp5, whose expression is regulated by Wnt/β-catenin signaling in many species including Hydra [28,29,30,31,32,33], was shown to restrict the activity of Wnt/β-catenin signaling, thus fulfilling the expected positive–negative feedback loop of the head inhibitor [33]. Indeed, a transient knock-down of Sp5 suffices to induce a multiheaded phenotype characterized by ectopic head formation along the body column of intact animals and the regeneration or budding of animals with multiple heads [33]. As anticipated, after a mid-gastric bisection, Sp5 and Wnt3 are up-regulated in the apical-regenerating tips, within two to three hours for Wnt3 and after eight hours for Sp5, and both of them remain expressed at high levels throughout the entire head regenerative process but not the foot one [33]. Also, the transcription factor Zic4, whose gene expression is positively-regulated by Sp5, is responsible for the maintenance of tentacle differentiation and for their formation during apical development [34].
Hydra is populated by a dozen distinct cell types that are derived from three populations of adult stem cells, i.e., epithelial–epidermal, epithelial–gastrodermal and interstitial, which constantly self-renew in the body column to maintain Hydra homeostasis. In intact animals, Wnt3, Sp5 and Zic4 are predominantly expressed in epithelial cells of both the gastrodermis and epidermis [25,33,34], a finding confirmed by single-cell sequencing [35] (Figure S1). However, while Wnt3, Sp5 and Zic4 are expressed at their highest levels apically, their respective profiles in the apical region are very different: Wnt3 is detected at a maximum level at the tip of the head, around the mouth opening, where the organizing activity is located [25,27]. In this region, Sp5 and Zic4 are in fact not detected, their expression being maximal at the base of the head where the tentacles are implanted and in the proximal region of the tentacles (Figure 1A). Also, Sp5 is the only one to be detected along the body column.
Pharmacological and genetic manipulations have shown that dynamic interactions between Wnt/β-catenin, Sp5 and Zic4 play a crucial role for apical development and the maintenance of apical patterning [33,34]. However, although Wnt3 is predominantly expressed in the gastrodermis, the specific role of each epithelial layer in the formation and maintenance of the head organizer remains unknown. The aim of this study is to uncover the dynamics of the Wnt/β-catenin/Sp5/Zic4 gene regulatory network in the epidermis and gastrodermis. To test these regulations in homeostatic and developmental contexts, we generated two transgenic lines that constitutively express the HyAct-1388:mCherry_HySp5-3169:GFP reporter construct in either epithelial layer. We monitored mCherry and GFP fluorescence in parallel with the detection of GFP, Sp5, Wnt3 expression in intact, budding or regenerating animals, as well as in animals where Wnt/β-catenin signaling is either stimulated or knocked-down. In each of these contexts, we recorded distinct regulations of Sp5 in the epidermis and gastrodermis, notably an epidermal-specific negative autoregulation of Sp5 in the body column. These results point to distinct architectures of the Wnt/β-catenin/Sp5/Zic4 gene regulatory networks active in the epidermis and the gastrodermis, and we discuss their respective roles in the regulation and activity of the head organizer.

2. Materials and Methods

2.1. Animal Culture and Drug Treatment

Strains of Hydra vulgaris (Hv) identified as Basel (Hv_Basel), magnipapillata (Hm-105) or AEP2 (Hv_AEP2) strains [36] were cultured in Hydra Medium (HM: 1 mM NaCl, 1 mM CaCl2, 0.1 mM KCl, 0.1 mM MgSO4, 1 mM Tris pH 7.6) at 18 °C and fed two to three times a week with freshly hatched Artemia nauplii (Sanders, Aqua Schwarz). For regeneration experiments, animals were starved for four days, then bisected at mid-gastric bisection. To activate Wnt/β-catenin signaling, Hv_Basel or Hv_AEP2 animals, starved for three or four days, were treated with 5 µM Alsterpaullone (ALP, Sigma-Aldrich A4847, St. Louis, MO, USA) or 0.015% DMSO for the indicated periods of time and subsequently washed with HM.

2.2. Mapping of the Transcriptional Start Sites (TSS)

Sp5 and Zic4 cDNAs sequences obtained by high throughput sequencing, available on HydrAtlas [37], Uniprot or NCBI, were aligned to the corresponding Hm-105 genomic sequences (Table S1) with the Muscle Align program (ebi.ac.uk/Tools/msa/muscle/) selecting a ClustalW output format. Next, the alignment was visualized with the MView tool [38] (ebi.ac.uk/Tools/msa/mview/) and the putative TSS deduced from the 5′ end of cDNAs.

2.3. Reporter Constructs Expressed in Hydra or in HEK293T Cells

All reporter constructs used in this study are listed in Table S3. To produce the HyAct-1388:mCherry_HySp5-3169:eGFP construct (further named HySp5-3169:GFP), a block of 3194 bp HySp5 sequences were amplified from Hm105 genomic DNA including 2968 bp promoter sequences, 201 bp 5′UTR sequences and 27 bp coding sequences. The sequences of the HySp5 promoter Forward and Reverse primers are given in Table S2. The hoTG-HyWnt3FL-EGFP-HyAct:dsRED plasmid (kind gift from T. Holstein) [27] was then digested with the EcoRV and AgeI enzymes to remove the HyWnt3FL promoter region and insert the Sp5 3194 bp region. Next, the dsRED sequence was replaced by the mCherry sequence by GenScript. The sequences of the final construct were verified by sequencing (Figure S2). From the HySp5-2992:Luciferase construct [33], six constructs were generated either by deleting the five Sp5-binding sites (BS) located in the proximal promoter or by mutating one of them: BS1 at position −129, BS2 at position −105, BS3 at position −52, BS4 at position −34 and BS5 at position +18. These HySp5-2828:Luc, HySp5-2992-mBS1:Luc, HySp5-2992-mBS2:Luc, HySp5-2992-mBS3:Luc, HySp5-2992-mBS4:Luc and HySp5-2992-mBS5:Luc constructs were generated using the QuikChange Lightning Multi Site-Directed Mutagenesis Kit (Agilent Technologies, Santa Clara, CA, USA).

2.4. Generation of the Hydra Transgenic Lines

To generate the Sp5 transgenic lines, gametogenesis was induced in the Hv_AEP2 strain by alternating the feeding rhythm from four times per week to once a week consequently. The HySp5-3169:GFP construct was injected into one- or two-cell-stage Hv_AEP2 embryos [39]. Out of 330 injected eggs, 27 embryos hatched and 3/27 embryos exhibited GFP and mCherry fluorescence. The epidermal and gastrodermal HySp5-3169:GFP lines analyzed in this work were obtained through clonal propagation from a single embryo for each of them in which only a few cells were positive after hatching. By asexual reproduction of the original animal, i.e., budding, we obtained two transgenic animals with a complete set of mCherry–eGFP-positive epithelial cells, either epidermal or gastrodermal. The generation of the epidermal and gastrodermal HyWnt3FL:eGFP-HyAct:dsRED transgenic lines, renamed here as epidermal HyWnt3-2149:GFP and gastrodermal HyWnt3-2149:GFP, is described in [33].

2.5. RNA Interference

For the gene silencing experiments, we applied the procedure reported in [33]. Briefly, four-day starved budless animals were selected from the Hv_AEP2 culture, rinsed 3× in water, incubated for 45–60 min in Milli-Q water and electroporated with 4 µM siRNAs, either targeting Sp5 or β-catenin or scramble as the negative control. For Sp5 and β-catenin, an equimolecular mixture of three siRNAs was used (siRNA1+siRNA2+siRNA3, see sequences in Table S2). Animals were electroporated once, twice or three times (EP1, EP2 and EP3) every other day as indicated.

2.6. Quantitative RT-PCR

At the indicated time-points after electroporation, 20 animals per condition were amputated either at an 80% level to obtain the apical region (100–80%) and the body column (80–0%) or at 80% and 30% levels to obtain the apical region as above, the central body column (80–30%) and the basal region (30–0%). Besides electroporated transgenic animals, non-electroporated wild-type Hv_AEP2 animals were used to provide the reference expression levels. The different parts of the animals were transferred to RNA-later (Sigma-Aldrich R0901) immediately after amputation and kept at 4 °C prior to RNA extraction. RNA extraction was performed using the E.Z.N.A.® Total RNA kit (Omega, Norcross, GA, USA) and cDNA was synthesized with the qScriptTM cDNA SuperMix (Quanta Biosciences, Beverly Hills, CA, USA). The cDNA samples were diluted to 1.6 ng/µL and the primer sequences used to amplify the Sp5, Wnt3, β-catenin, GFP and TBP genes were designed with Primer3-OligoPerfect (Thermo Fisher, Waltham, MA, USA) (Table S2). Quantitative RT-PCR was performed using the SYBR Select Master Mix for CFX (Applied Biosystems, Waltham, MA, USA) and a Biorad CFX96TM Real-Time System. Relative gene expression levels were calculated as described in [40], using TBP to normalize all data. Fold change (FC) values at each time point or condition were calculated over the values obtained in non-electroporated animals. Finally, in each condition, the FC values measured in β-catenin(RNAi) or Sp5(RNAi) animals were divided by those measured in animals of the same condition exposed to scramble dsRNA.

2.7. Whole-Mount In Situ Hybridization (WM-ISH)

The animals were relaxed in 2% urethane/HM for 1 min, fixed in 4% PFA prepared in HM for 4 h at room temperature (RT), then washed several times with MeOH before being stored in MeOH at −20 °C. WMISH was performed as described in [33]. For double WMISH, the Wnt3 riboprobe was labeled with DIG (Sigma, Roche-11277073910) and the Sp5 and GFP riboprobes were labeled with fluorescein (Sigma, Roche-11685619910); the Wnt3-DIG riboprobe was co-incubated with either the Sp5-FLUO or GFP-FLUO riboprobe during the hybridization step. The Wnt3-DIG riboprobe was first detected with NBT/BCIP (Sigma, Roche-11383213001) and the FLUO-labeled riboprobe was subsequently detected with Fast Red. To stop the NBT/BCIP reaction, the samples were washed several times in NTMT, then incubated in 100 mM glycine, 0.1%Tween (pH 2.2) for 10 min, washed in Buffer I (1× MAB; 0.1% Tween), then incubated in Buffer I supplemented with 10% sheep serum (Buffer I-SS) for 30 min at RT and prolonged for 1 h with fresh Buffer I-SS at 4 °C. Incubation with the anti-FLUO-AP antibody (1:4000, Roche-1142638910) was carried out at 4 °C overnight. Next, the samples were briefly washed in Buffer I then in 0.1M Tris/HCl (pH 8.2) 3× 10 min and then developed with Fast Red (SigmaFAST, F4648, St. Louis, MO, USA). To stop the reaction, the samples were washed several times in 0.1M Tris/HCl (pH 8.2) and fixed in 3.7% formaldehyde for 10 min at RT, rinsed in water and mounted in Mowiol. The co-detection of two riboprobes is technically challenging as the NBT/BCIP detection of the DIG-labeled riboprobe, which is normally far more sensitive than the Fast Red detection of the fluorescein-labeled riboprobe, is much less efficient when tissues are treated for Fast Red. Consequently, we first analyzed the expression pattern of each gene separately and subsequently co-detected Wnt3 and Sp5, or Wnt3 and GFP. In these conditions, we found the co-detection highly informative to record context-specific regulations. The plasmids used to produce the riboprobes are listed in Table S3.

2.8. Immunofluorescence

Animals were fixed and subsequently rehydrated as for WMISH with repeated washes in successive dilutions of EtOH in PBST (PBS, 0.5% Triton). Blocking was performed with 2% BSA in PBST for 1–2 h at RT. For immunostaining, samples were incubated overnight at 4 °C with an anti-GFP antibody (1:400, Novus NB600-308) in 2% BSA. Then, after several washes in PBST, the secondary antibody anti-rabbit coupled to Alexa 488 (1:600, Invitrogen A21206) was added in 2% BSA for 4 h. For double immunofluorescence, the anti-mCherry (1:400, Abcam ab125096) and secondary anti-mouse coupled to Alexa 555 (1:600, Invitrogen A31570) antibodies were used.

2.9. Nuclear Extracts (NEs) and Electro-Mobility Shift Assay (EMSA)

NEs were prepared according to [41]. Briefly, 100 Hm-105 or Hv_AEP2 animals were washed rapidly in HM and once in Hypotonic Buffer (HB: 10 mM Hepes pH7.9, 2 mM MgCl2, 5 mM KCl, 0.5 mM spermidine, 0.15 mM spermine), then placed in a 1 mL glass dounce with 1 mL HB and 20 strokes were given. After slowly adding (drop by drop) 210 µL of 2 M sucrose, 15 more strokes were given. The extract was centrifuged for 10 min at 3200 rpm at 4 °C, the pellet was washed twice with 800 µL Sucrose Buffer (0.3 M sucrose in HB), resuspended in 50 µL Elution Buffer (glycerol 10%, 400 mM NaCl, 10 mM Hepes pH 7.9, 0.1 mM EDTA, 0.1 mM EGTA, 0.5 mM spermidine, 0.15 mM spermine) and incubated for 45 min. The eluate was centrifuged at 4 °C for 20 min at 13,000 rpm and the supernatant was aliquoted and stored at −80 °C. All manipulations were carried out on ice and all buffers contained a mix of a protease inhibitor cocktail (Bimake B14012).
The LightShift Chemiluminescent EMSA Kit (Thermo-Scientific, 89880, Waltham, MA, USA) was used to perform EMSA with Hydra NE and biotin-labeled double-stranded oligos (Table S2). Briefly, 3 µL of Hydra NEs per 20 µL binding reaction was incubated for 20 min with the double-stranded oligos (20 fmol), then loaded on a 6% polyacrylamide gel (PAGE) in TBE 0.5x, electrophoresed and transferred onto a nylon membrane (BrightStar-Plus Invitrogen AM10102). A crosslink was carried out by exposing the membrane to UV-light 120 mJ/cm2 for 30–50 s (Marshall Scientific, SS-UV1800, Hampton, NH, USA) and the samples fixed on the membrane were blocked for 15 min with Blocking Buffer (Thermo-Scientific 89880A). The membrane was conjugated with Stabilized Streptavidin-Horseradish Peroxidase (1:300, Thermo-Scientific, 89880D) and developed by adding a Luminol/Enhancer solution (Thermo-Scientific 89880E/F).

2.10. Production of Anti-Sp5 Antibodies

Two anti-Sp5 antibodies were generated. A rabbit polyclonal antibody was produced by Covalab (Bron, France) against three peptides: P1 (178–191), NEHHIKEYSEHSQA; P2 (398–411), CDENVMELEVNVEN; and P3 (155–175), PASPISWLFPQNIIQSHPSKV. After four immunizations, the sera were collected from a single rabbit and an ELISA test was performed to check the immunoreactivity. Next, the sera were purified by Covalab with the peptides P1 and P2 to remove any P3 cross-reactivity. The mouse monoclonal antibody was produced by Proteogenix (Schiltigheim, France) against a 6His-tag (MGSHHHHHHSG) coupled to a 218 AA-long Hydra Sp5 fragment (ISPLEQT---YSMSTSI) produced chemically. The Sp5-218 protein (24.5 kDa) was expressed in E. coli and injected into the animals. After four immunizations, spleen cells collected from two mice were fused to myeloma cells. The antibody, produced from one selected clone, was validated by IP analysis.

2.11. Cell Culture and Whole Cell Extracts (WCEs) and Western Blotting

The immortalized human embryonic kidney HEK293T cells were cultured in DMEM High Glucose, 10% fetal bovine serum (FBS), 6 mM L-glutamine and 1 mM NA pyruvate in 10 cm-diameter cell culture dishes (CellStar, Greiner Bio-One 664160, Kremsmünster, Austria). After a two-day growth, the cells were collected by scraping, counted and 15 × 104 cells per well were seeded in 6-well plates and grown for 19 h. Next, the cells were transfected with 2 µg of pCS2+empty or pCS2+HySp5 plasmid using the X-tremeGENE HP DNA transfection reagent (Sigma, 6366546001, St. Louis, MO, USA). To prepare the cell extracts 24 h later, the cells were resuspended in PBS 1× before being centrifuged for 3 min at 3000 rpm at 4 °C. After discarding the supernatant, the pellet was resuspended in fresh Lysis Buffer (LB): 50 mM Hepes pH 7.6, 150 mM NaCl, 2.5 mM MgCl2, 0.5 mM DTT, 10% glycerol, 1% Triton 100×, 0.1 mg/mL PMSF, 10% protease inhibitor cocktail (Bimake, B14012, Houston, TX, USA) and a lab-made phosphatase inhibitors cocktail (8 mM NaF, 20 mM β-glycerophosphate, 10 mM Na3VO4). After a 30 min incubation on ice, the extract was centrifuged at 14,000 rpm for 10 min at 4 °C and the supernatant was aliquoted and stored at −80 °C. Next, 20 µg extracts, either WCEs or NEs, were diluted with Loading Laemmli buffer and then boiled for 5 min at 95 °C before being loaded onto a 10% SDS-PAGE, then electrophoresed and transferred onto a PVDF membrane (Bio-Rad 162-0177). Next, the membrane was blocked for 1 h at RT with 5% dry milk in TBS 1×, 0.1%Tween (TBS-T). Anti-Sp5 antibodies were added at a 1:500 dilution and incubated overnight at 4 °C. The membranes were washed 3× 10 min in TBS-T before being incubated for 2 h with the secondary anti-mouse-HRP- or anti-rabbit HRP antibody (1:5000, Promega anti-mouse, W4021; anti-rabbit W4011). The membranes were washed in TBS-T for 3× 10 min and developed with Western Lightning Plus-ECL reagent (Perkin Elmer NEL104). To produce the Sp5 protein in vitro, the pCS2+empty and pCS2*HySp5 plasmids were incubated using the TNT Quick Coupled Transcription/Translation Systems (Promega L2080, Madison, WI, USA) and 1 µL was loaded on 10% SDS-PAGE.

2.12. Chromatin Immuno-Precipitation and Quantitative PCR (ChIP-qPCR)

ChIP was performed with 300 Hm105 or Hv_AEP2 animals fixed in 1% Formaldehyde Solution (Thermo-Scientific 28906) for 15 min, then transferred into a Stop Solution (Active Motif 103922) for 3 min, briefly washed in cold HM before being resuspended in 5 mL Chromatin prep buffer containing 0.1 mM PMSF and 0.1% protease inhibitor cocktail (Active Motif 103923). The samples were transferred to pre-cooled 15 mL glass dounces and crushed with 30 strokes. The samples were incubated on ice for 10 min before being centrifuged at 4 °C for 5 min at 1250 rcf. Each pellet was resuspended in 1 mL Sonication Buffer (SB: 1% SDS, 50 mM Tris-HCl pH 8.0, 10 mM EDTA pH 8.0, 1 mM PMSF, 1% protease inhibitor cocktail) and incubated on ice for 10 min. The chromatin was then sonicated with a Diagenode Bioruptor Cooler (sonication conditions: Amp: 25%, Time: 20 s on, 30 s off, 2 cycles). The samples were centrifuged at 14,000 rpm for 10 min at 4 °C, the supernatant was sonicated (sonication conditions as above, but 3 cycles), centrifuged at 14,000 rpm for 10 min at 4 °C and the supernatant was recovered. After measuring the DNA with Qubit, 10 µg of the sonicated chromatin was diluted (1:5) in ChIP Dilution Buffer (DB: 0.1% NP-40, 0.02 M Hepes pH 7.3, 1 mM EDTA pH 8.0, 0.15 M NaCl, 1 mM PMSF, 1% protease inhibitor cocktail) and incubated with 1 µg of either the monoclonal or polyclonal α-Sp5 antibody or pre-immune serum antibody overnight at 4 °C on a rotating wheel. The sample was then loaded onto a ChIP-IT ProteinG Agarose Column (Active Motif 53039, Carlsbad, CA, USA), incubated on a rotating wheel for 3 h at 4 °C and washed 6 times with 1 mL Buffer AM1 before being eluted with 180 µL Buffer AM4. After, 1M NaCl and 3× TE buffer were added to perform decrosslinking overnight at 65 °C. Next, RNAse A (10 µg/µL) was added for 30 min at 37 °C followed by Proteinase K (10 µg/µL) for 2 h at 55 °C. Finally, the MiniElute PCR purification kit (Qiagen, 28004, Hilden, Germany) was used to purify the samples. DNA was eluted in 30 µL and 1 µL per condition that was used for qPCR.

2.13. Imaging

Live imaging to analyze the dynamics of mCherry and GFP fluorescence and the imaging of immunofluorescence on whole animals were performed on the Leica DM5500 microscope (Wetzlar, Germany). To quantify GFP fluorescence, the acquired data were analyzed with the Fiji ImageJ2 software. Optical sections were acquired using a Spinning disc confocal CSU (Yokogawa, Japan) mounted on an inverted Nikon Ti microscope (Tokyo, Japan) with both the bright-field and GFP channels merged. A confocal LSM780 Zeiss microscope (Oberkochen, Germany) was used to image the immunostained hypostome region of transgenic animals, as well as the budding region of live transgenic animals incubated in 1 mM linalool in HM for 10 min prior to imaging, then kept in the linalool solution between two coverslips separated by a 0.025 mm spacer. WMISH pictures were acquired with the Olympus SZX10 microscope.

2.14. Statistical Analyses

The statistical analyses were two-tailed, unpaired and were carried out using the GraphPad Prism 8.4.3 software. p values are for **** ≤ 0.0001, *** > 0.0001 and ≤0.001, ** > 0.001 and ≤0.01, * > 0.01 and <0.05 and ns ≥ 0.05.

3. Results

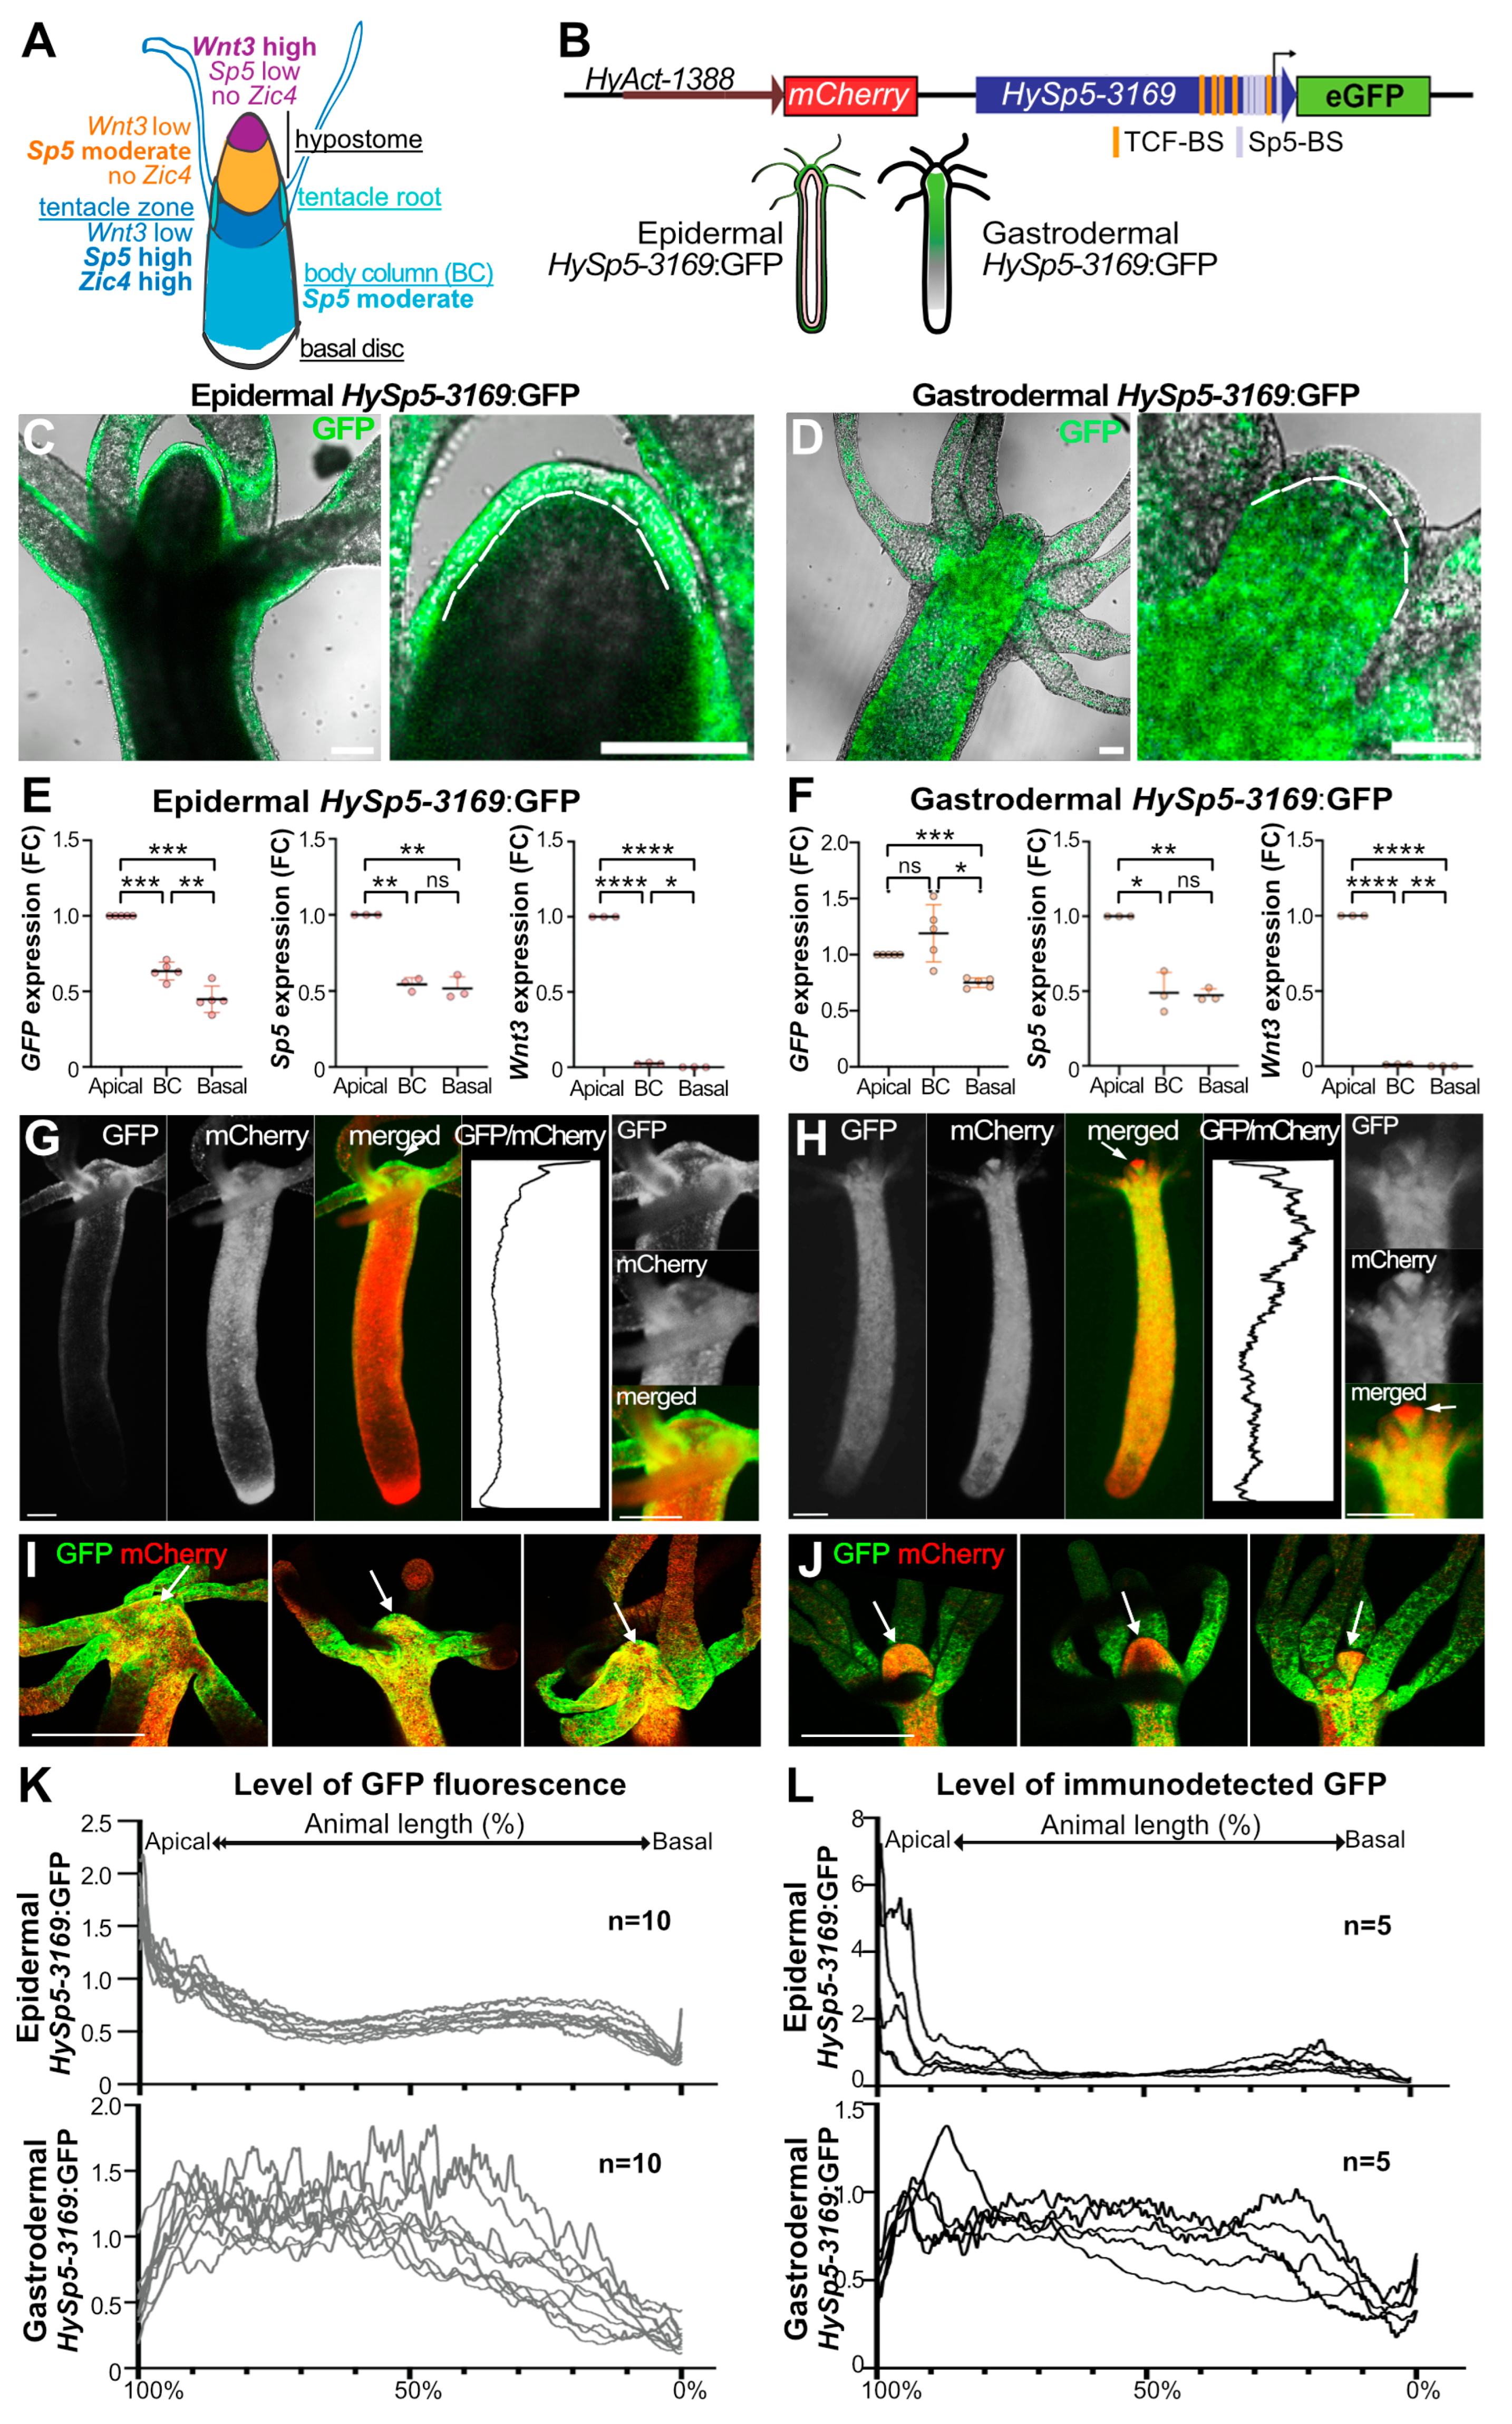
3.1. Differential Sp5 Regulation in the Epidermal and Gastrodermal Layers along the Body Axis

To monitor the regulation of Sp5 expression in the epidermal and gastrodermal epithelial layers, we produced a tandem reporter construct, HyAct-1388:mCherry_HySp5-3169:GFP, where the Hydra Actin promoter (HyAct, 1388 bp) drives the ubiquitous expression of mCherry and the Hydra Sp5 promoter (HySp5, 3169 bp) drives eGFP expression (Figure 1B and Figure S2). After injecting the reporter construct into Hv_AEP2 embryos, two transgenic lines were obtained by clonal amplification, one expressing the reporter in the epidermis (epidermal HySp5-3169:GFP) and the other in the gastrodermis (gastrodermal HySp5-3169:GFP) (Figure 1C,D and Figure S3). Next, in the q-PCR analysis we compared the expression levels of Sp5, GFP and Wnt3 in the apical, central body column and basal regions of each transgenic line (Figure 1E,F). As expected, in both lines, we found Wnt3 expressed exclusively apically and Sp5 expressed in all regions but at maximal levels apically. By contrast, GFP appears differentially regulated along the two layers of the body axis, rapidly declining in its expression from the apical region to the upper gastric column in epidermal HySp5-3169:GFP animals, with a similar high level of expression in the apical and upper body column regions in gastrodermal HySp5-3169:GFP animals, followed by a low level of expression in the basal region (Figure 1E,F). These results indicate that the Sp5-3169 promoter is differentially regulated along the body column in the epidermal and gastrodermal layers.
Figure 1. Differential regulation of HySp5-3169:GFP expression in the epidermal and gastrodermal layers. (A) Schematized view of Hydra anatomy that includes the apical region or head, formed from a dome-shape named hypostome, centered around the oral opening, surrounded by a ring of tentacles at its basis, the elongated or contracted body column and the basal disc or foot that can attach to substrates. The respective expression levels of Wnt3, Sp5 and Zic4 define three distinct domains in the apical region (see ref. [34]). (B) Structure of the HyAct-1388:mCherry_HySp5-3169:GFP reporter construct used to generate the epidermal and gastrodermal HySp5-3169:GFP transgenic lines, where epithelial cells from the epidermis and gastrodermis, respectively, express GFP and mCherry (sequence in Figure S2). TCF-BS: TCF-binding sites (orange); Sp5-BS: Sp5-binding sites (grey). (C,D) Optical sections of live transgenic animals expressing HySp5-3169:GFP in the epidermis (C) and gastrodermis (D). Brightfield and eGFP channels are shown and the apical region of each animal is magnified on the right (Figure S3A,B). The dashed white line indicates the thin extracellular layer known as the mesoglea, which delimits the epidermal (outer) and gastrodermal (inner) epithelial layers. Scale bar: 100 µm. (E,F) Q-PCR analysis of GFP, Sp5 and Wnt3 transcript levels in the apical, body column (BC) and basal regions of epidermal (E) and gastrodermal (F) HySp5-3169:GFP animals fixed immediately after dissection. p values as indicated in Materials & Methods. (G,H) Live imaging of epidermal (G) and gastrodermal (H) HySp5-3169:GFP animals with eGFP (green), mCherry (red); the apical region of each animal is magnified on the right. White arrows point to the tip of the hypostome. The graphs show the eGFP/mCherry fluorescence intensity ratios (relative GFP intensity) along the animal axis. (I,J) Immunodetection of GFP (green) and mCherry (red) in the apical region (white arrow) of epidermal (I) and gastrodermal (J) HySp5-3169:GFP animals. Scale bars in panels (GJ): 250 µm. (K,L) Graphs showing the relative GFP fluorescence recorded live (K) or after immunodetection (L) in epidermal or gastrodermal HySp5-3169:GFP animals. The apical extremity is on the left (100%), the basal one on the right (0%). See Figure S4.
Biomedicines 12 01274 g001
This result was confirmed at the protein level by recording live fluorescent GFP (Figure 1G,H and Figures S3 and S4) or by immunodetecting GFP (Figure 1I,J and Figure S3). In epidermal transgenic animals, GFP fluorescence and GFP protein are detected in the epidermal layer over the whole hypostome, the tentacle ring, the proximal part of the tentacles and the upper body column (Figure 1G,I and Figures S3A,C and S4A,C). In gastrodermal transgenic animals, GFP fluorescence and GFP protein extend over a broad domain in the gastrodermal layer, from the apical region throughout the body column (Figure 1H,J and Figures S3B,D and S4B,D). However, the tip of the hypostome is free of gastrodermal GFP fluorescence and GFP protein (see enlarged head in Figure 1H, arrows in Figure 1J), an area where Wnt3 expression is maximal and endogenous Sp5 expression is minimal [27,33].
Together with the colocalization of endogenous Sp5 transcripts and immunodetected HySp5-3169:GFP (Figure S3C,D), these analyses show that 3169 bp sequences of the Sp5 promoter are sufficient to recapitulate the previously identified endogenous Sp5 expression pattern in the apical region and along the body column [33] and to highlight previously unrecognized differences in the expression between the epidermis and gastrodermis.
From the GFP and mCherry fluorescence profiles, we produced a relative GFP intensity profile for each animal that corresponds to the GFP/mCherry ratio at any point along the body axis (Figure 1K,L and Figure S4C–F). By superimposing the profiles of 10 animals, we concluded that GFP fluorescence in the epidermis of live animals is graded apical-to-basal, from 100% to 70% of the body length, then maintained at low levels between the 70% to 10% positions (Figure 1K and Figure S4E). In contrast, in gastrodermal_HySp5-3169:GFP animals, the GFP levels are low at the most apical end (position 100–90%), reach a high plateau from the position of 90% up to 40% of the body length and then decrease towards the basal end (Figure 1K and Figure S4F). For each transgenic line, we noted that the fluorescence intensity profiles of GFP in live animals corresponded to the profile of GFP immunodetected in the corresponding fixed samples (Figure 1L). In conclusion, a comparative analysis of GFP transcripts, GFP fluorescence and GFP protein converges to identify distinct patterns in the epidermis and gastrodermis, both apically and along the body axis, indicating that Sp5 is differentially regulated in these two layers.

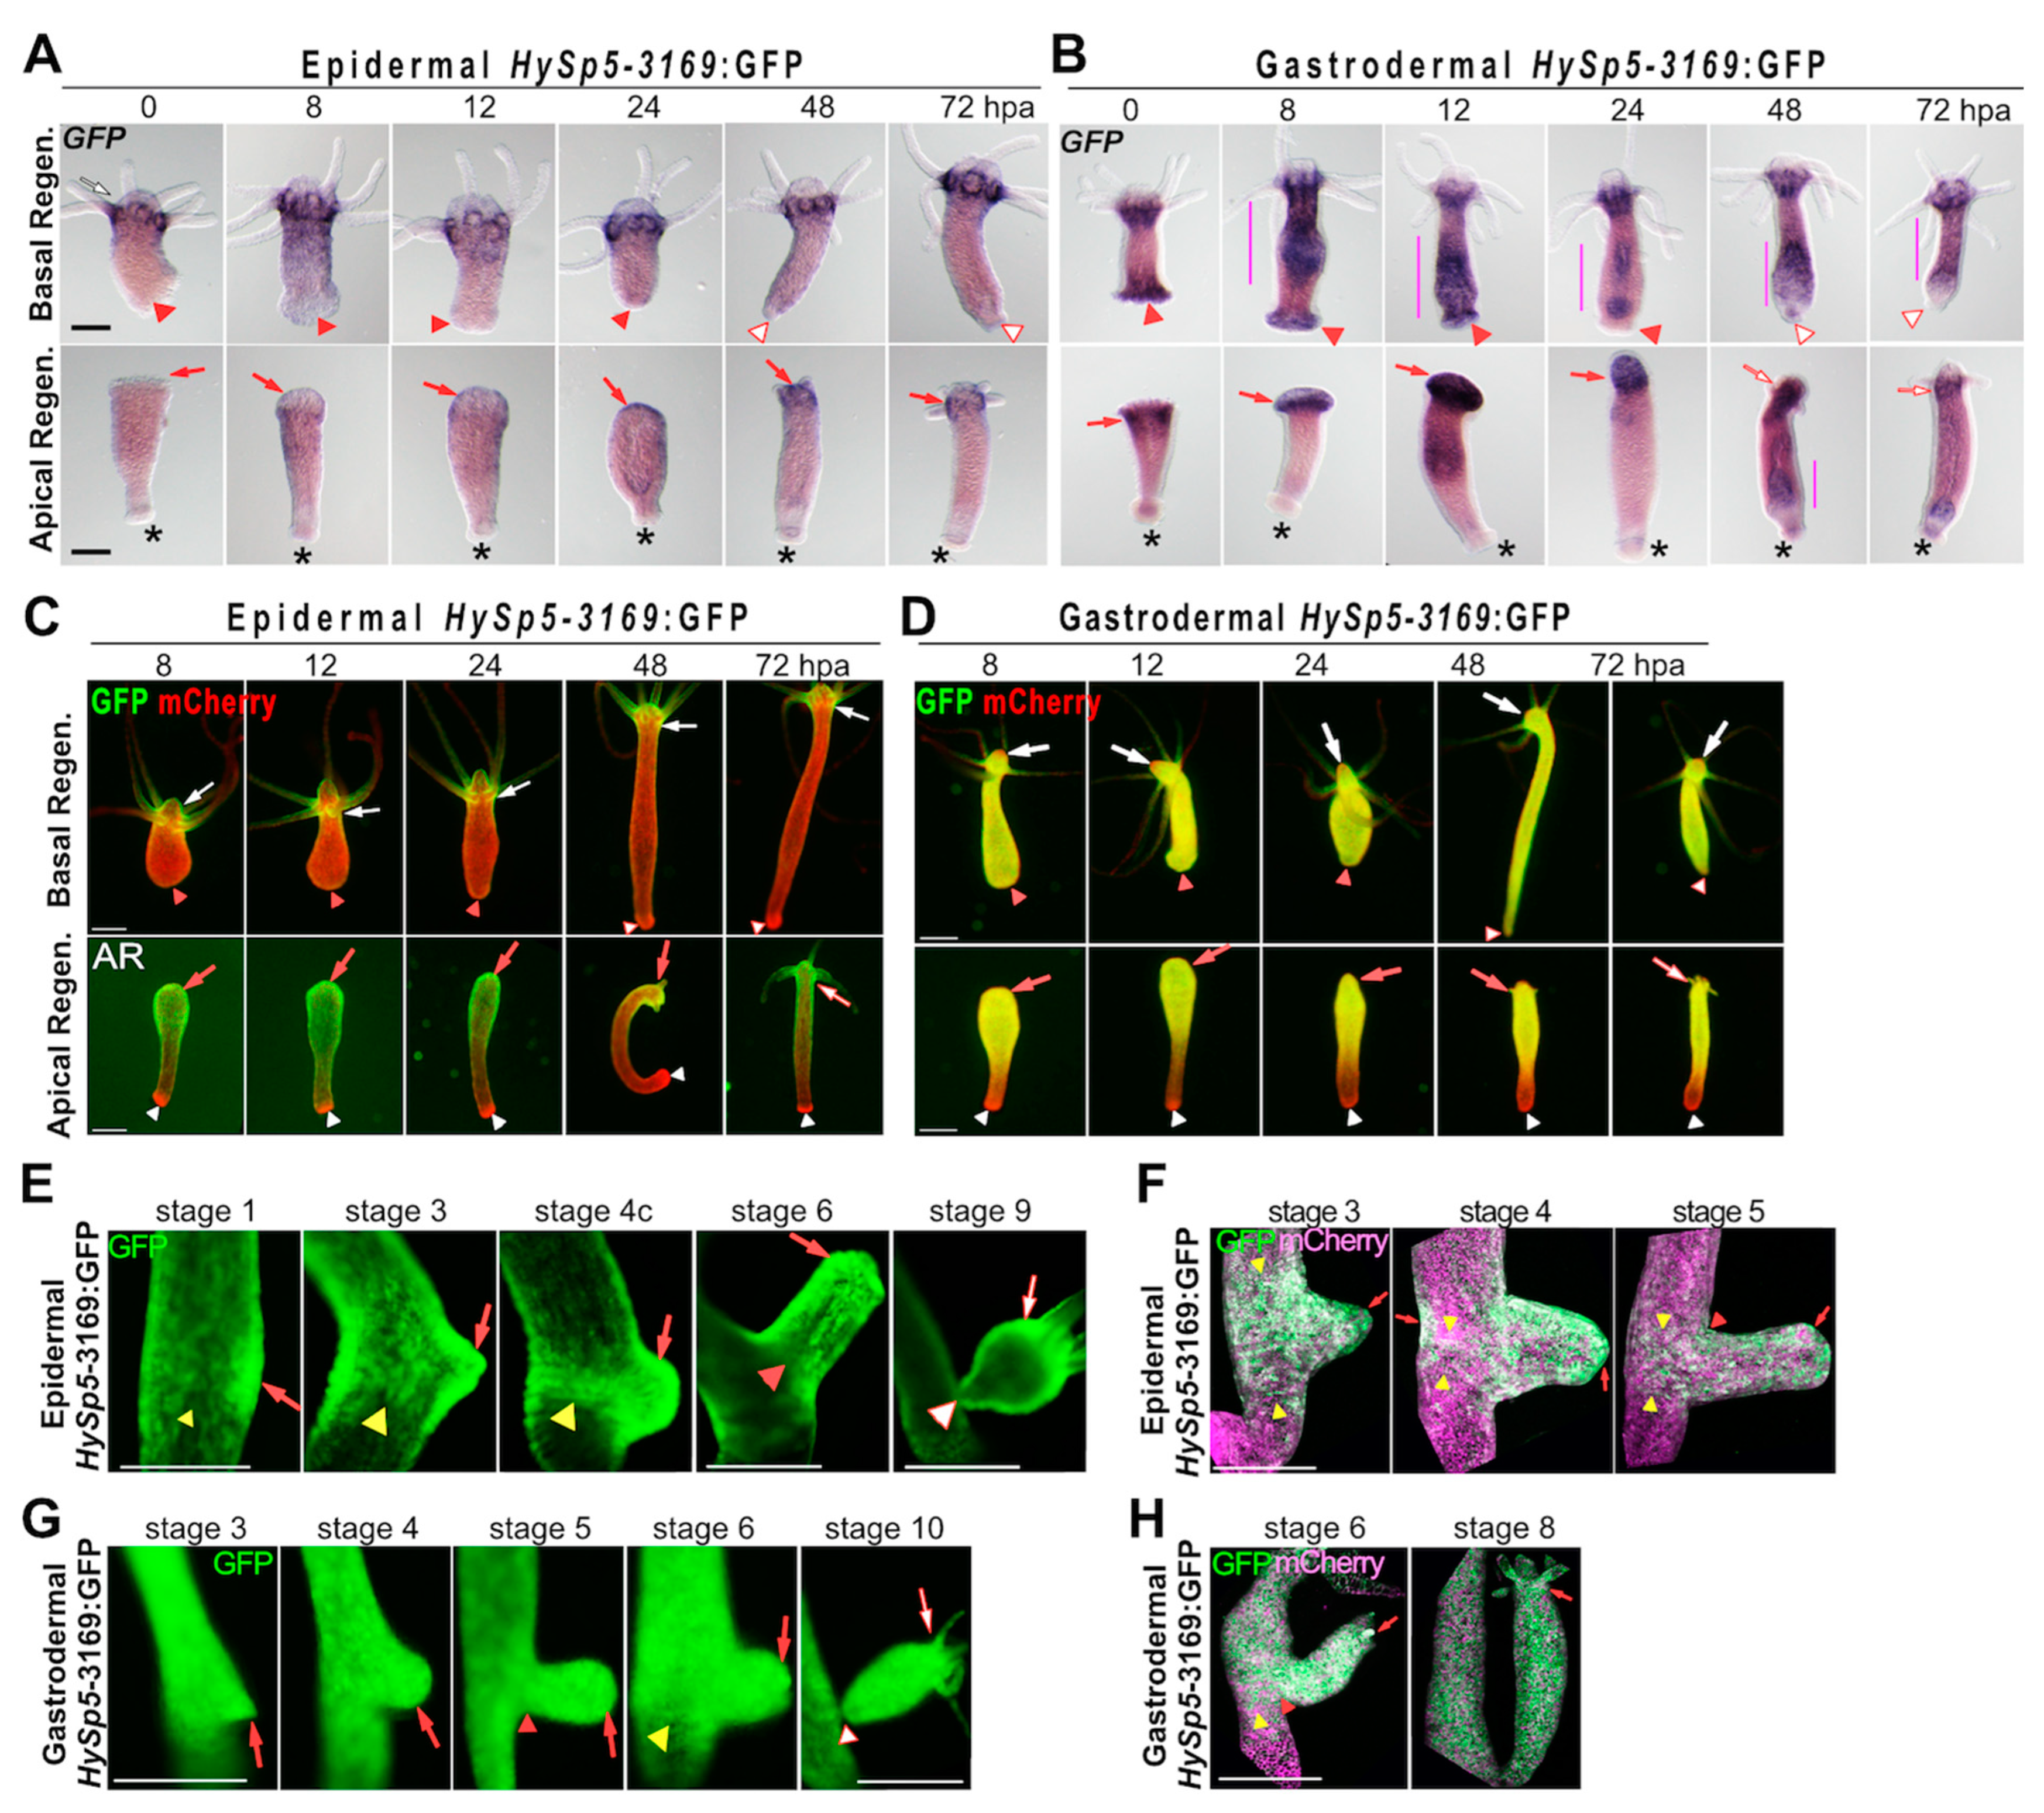
3.2. Sp5 Regulation after Bisection Is Systemic in Gastrodermis but Localized in Epidermis

Next, we analyzed how HySp5-3169:GFP is regulated in developmental contexts. During regeneration, epidermal HySp5-3169:GFP animals show no or low GFP expression in their apical-regenerating (AR) tips fixed at 8 and 12 h post-amputation (hpa) (Figure 2A and Figure S5A). Then, at 24 hpa, GFP expression is detected. At 48 hpa, tentacle rudiments that emerge do not express GFP whereas the tip of the developing hypostome strongly expresses GFP; at 72 hpa, the epidermal GFP pattern is typical, with maximal expression at the root of tentacles. In contrast, in gastrodermal HySp5-3169:GFP animals, GFP is detected immediately after bisection, presumably artifactually in injured tissue, then at high levels at 8 and 12 hpa in a broad domain encompassing the AR tips (Figure 2B and Figure S5B). At 24 hpa, the gastrodermal GFP expression becomes restricted to the apical area, at 48 hpa the emerging tentacles and the tip of the future hypostome are free of GFP expression. At 72 hpa, apical GFP expression is mainly present in the tentacle ring, absent from the tentacles and hypostome and at a low level in the peduncle region. Along the body column of these animals, the gastrodermal GFP expression either forms stripes alternating higher and lower levels or is diffused throughout the animal.
During basal regeneration, GFP expression is excluded from the basal-regenerating (BR) half in epidermal_HySp5-3169:GFP animals at any time-point (Figure 2A and Figure S5C). At 48 hpa, most animals have differentiated a new basal disc and GFP expression is slightly up-regulated in the peduncle region. In gastrodermal HySp5-3169:GFP animals, the immediate GFP signals observed in the BR tips is presumably artifactual, linked to injury as in AR tips (Figure 2B and Figure S5D). At subsequent stages, GFP expression is quite strong in the body column, in continuity with the apical domain, but becomes weaker at 24 hpa. In the BR tips, gastrodermal GFP expression is transient, becoming low or undetectable in most animals at 24 hpa. A new basal disc, free of GFP, is usually formed at 48 hpa, whereas some GFP expression remains in the adjacent peduncle region.
Regarding GFP fluorescence, it can be detected during apical regeneration at high levels in both epithelial layers at 8, 12 and 24 hpa, extending along the AR half, except in the peduncle region (Figure 2C,D and Figure S6A,C). Subsequently, as the tentacle rudiments appear, epidermal GFP fluorescence becomes maximal in the apical region, while gastrodermal GFP fluorescence disappears from the tip of the forming head and becomes predominant in the tentacle ring and upper body column, resembling the homeostatic pattern. As expected, in epidermal HySp5-3169:GFP animals regenerating their basal half, no GFP fluorescence is observed, except in the apical region of origin (Figure 2C and Figure S6B); in gastrodermal HySp5-3169:GFP animals, GFP fluorescence is widely distributed along the body axis, but excluded from the differentiating basal disc, as observed at 48 hpa (Figure 2D and Figure S6D).
During budding, GFP fluorescence is detected throughout the process in the epidermal and gastrodermal layers of HySp5-3169:GFP animals, but with different patterns (Figure 2E–H). In the budless parental polyp, epidermal GFP fluorescence is first visible as a patch preceding bud formation (stage 1, Figure 2E), then in the budding belt, where GFP fluorescence persists until stage 6, it is seen as gradually forming well-defined boundaries (Figure 2E,F). In the gastrodermis, GFP fluorescence is also detected in the budding belt, but with diffuse boundaries, in continuity on the apical side with the GFP expression domain in the body column (Figure 2G,H). In the growing bud, GFP fluorescence is ubiquitously expressed in both layers, predominantly apical in the epidermis from stage 6 onwards. At stages 9 and 10, when the bud is mature and ready to detach, the epidermal and gastrodermal GFP fluorescence correspond to those observed in adult polyps, apically restricted in the epidermis, while they diffuse along the axis in the gastrodermis (Figure 2E,G).
In conclusion, the HySp5-3169:GFP transgenic lines highlight the temporal and spatial layer-specific regulations of Sp5 linked to regeneration and budding. During apical regeneration, Sp5 is up-regulated in the epidermis at an early–late phase (24 hpa) and not at all during basal regeneration. In contrast, gastrodermal GFP expression is broadly enhanced at an early stage, whatever the type of regeneration, apical or basal. This widespread increase in GFP expression in the gastrodermis reflects a systemic Sp5 response to amputation, specifically driven by the Sp5 promoter as such an increase is not observed with mCherry driven by the Actin promoter. Similarly, during budding, Sp5 expression is tightly regulated in the epidermis, but rather diffuse and systemic in the gastrodermis.

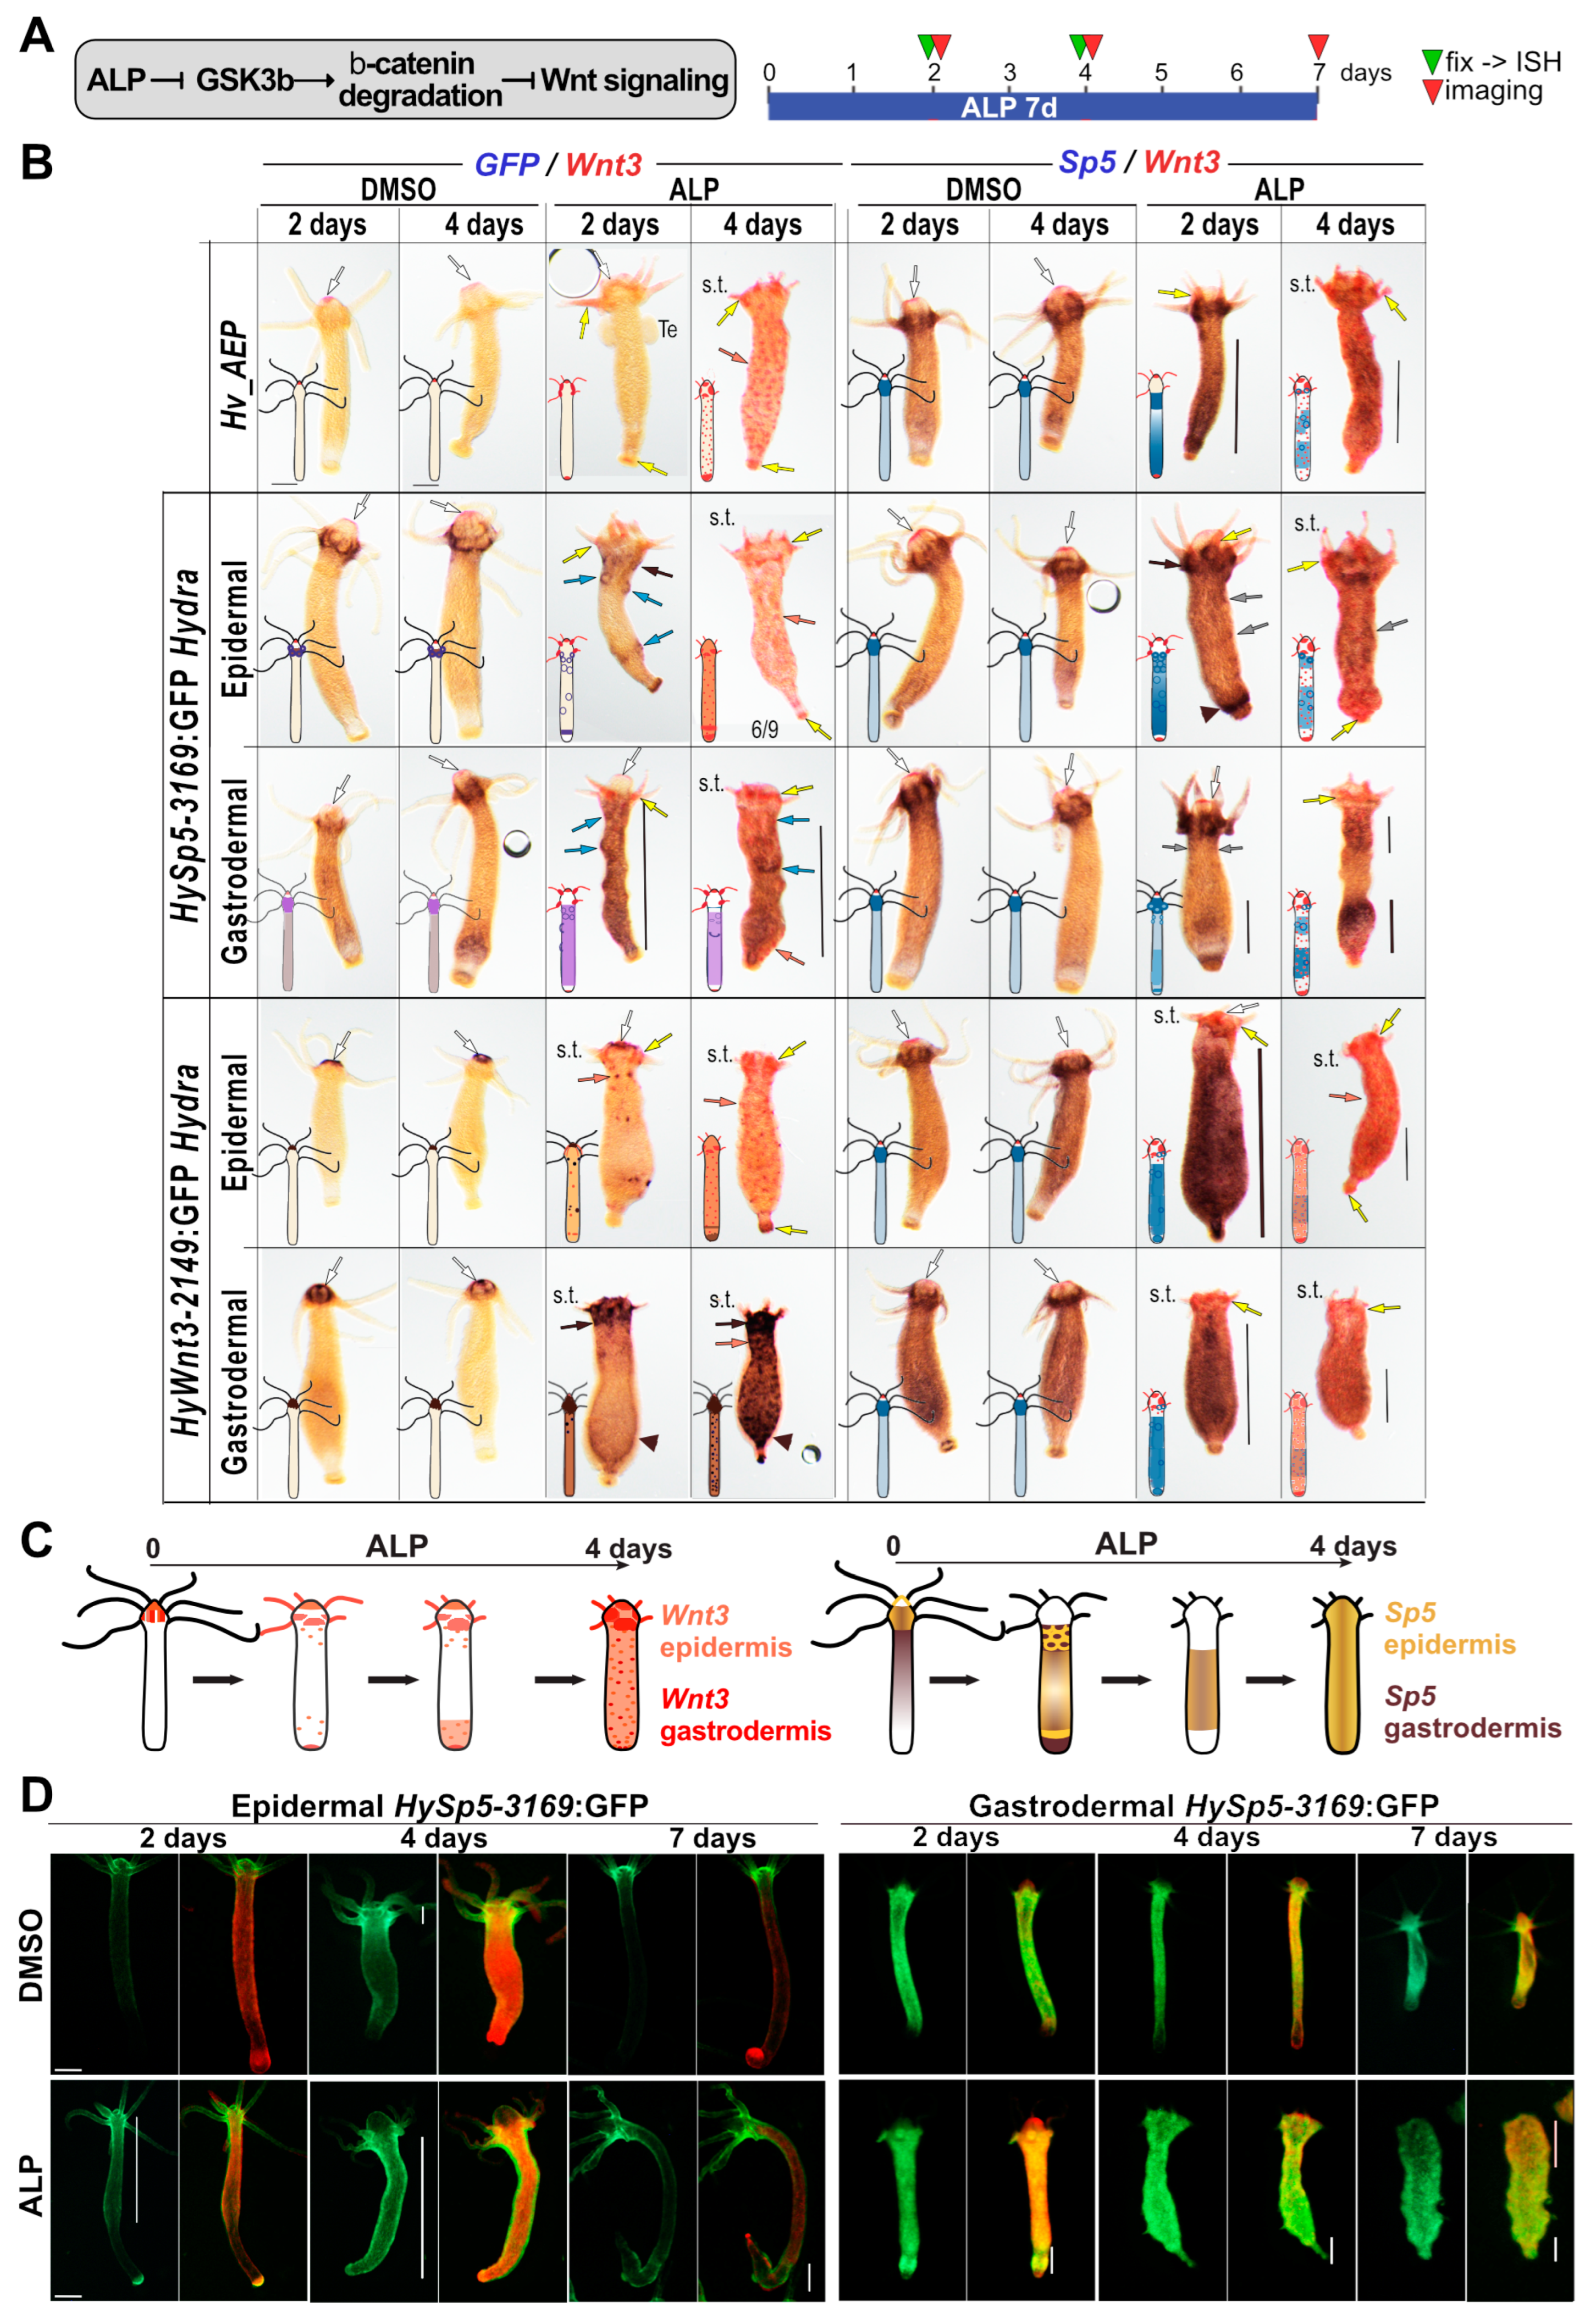
3.3. Layer-Specific Modulations of Sp5 Expression upon Alsterpaullone (ALP) Treatment

We then compared the phenotypic changes induced by the GSK3β inhibitor Alsterpaullone (ALP), which in the H. vulgaris Zürich L2 strain (Hv_ZüL2) leads to an increase in the level of nuclear β-catenin in the body column and the subsequent activation of Wnt3/β-catenin signaling [23] (Figure 3A). As a result, a two-day ALP treatment induces the formation of multiple ectopic tentacles along the body column of Hv_ZüL2 or Hv_Basel animals [23,33]. However, in animals from the Hv_AEP2 strain, two-, four- or even seven-day ALP treatment only leads to the transient and partial development of a few ectopic tentacles along the body column, likely as a result of the lower sensitivity of Hv_AEP2 animals to drug treatments [42].
Nevertheless, after a four-day treatment, we noticed additional morphogenetic changes such as the striking reduction in the size of both the original tentacles and the hypostome at the apical pole, together with the enlargement of the upper body column that appears globally “swollen”, the progressive disappearance of the basal disc and the refinement of the basal extremity (Figure 3B and Figures S7–S9). Given the positive feedback loop that operates between Wnt3/β-catenin, Sp5 and Zic4 and the negative one between Sp5 and Wnt3, we investigated how Sp5 expression is modulated in each epithelial layer when β-catenin signaling is constitutively activated. We thus exposed non-transgenic and HySp5-3169:GFP transgenic animals to ALP for two or four days and analyzed the concomitant modulations of Sp5 and Wnt3 and GFP and Wnt3 (Figure 3B and Figures S7 and S8).
After two days, we observed in all conditions a transient extension of the apical Sp5 and HySp5-3169:GFP expression domain (i.e., positive for both Sp5 and GFP) below the head, forming a second tentacle ring, from which, in some animals, ectopic tentacles transiently emerge. In the body column, Sp5 is globally up-regulated along the gastrodermis while about half of the epidermal HySp5-3169:GFP animals form circular figures along the upper body column, possibly outlining regions where ectopic structures are transiently induced (Figure 3B and Figure S8). We also noted, in both epidermal and gastrodermal HySp5-3169:GFP animals, a high level of GFP expression close to the basal extremity, including a GFP+ ring just above the basal disc.
After four days, most of the two-day ALP-induced changes had vanished: Sp5 and GFP were no longer detected apically, neither in the epidermis, nor in the gastrodermis, the Sp5/GFP epidermal figures along the body column had disappeared and the global epidermal GFP expression was dramatically reduced. In the gastrodermis, the HySp5-3169:GFP expression remained present in the central part of the body column in most animals (Figure 3B and Figure S8). In summary, this analysis shows a similar silencing of epidermal and gastrodermal HySp5-3169:GFP in the apical region, but striking differences along the body column, with HySp5-3169:GFP transiently enhanced and forming circular figures in the epidermis, while remaining diffuse and long-lasting in the gastrodermis.

3.4. Layer-Specific Modulations of Wnt3 Expression Induced by ALP Treatment

In parallel, we tested the putative layer-specific modulations of Wnt3 by exposing it to ALP animals of the epidermal and gastrodermal HyAct-1388:mCherry_HyWnt3-2149:GFP transgenic lines (named HyWnt3-2149:GFP), where GFP expression is under the control of 2149 bp of the Wnt3 promoter [27,33] (Figure S9). With regard to Wnt3 regulation after a two-day ALP treatment, the epidermal HyWnt3-2149:GFP persists at the tip of the hypostome while being strongly up-regulated in the tentacle ring and in tentacle roots, whereas small dots expressing Wnt3 and HyWnt3-2149:GFP become visible along the body column. After a four-day ALP treatment, as expected, Sp5 is strongly down-regulated, while a dense network of Wnt3 or HyWnt3-2149:GFP dots is established along the entire body column in both layers (Figure 3B and Figures S7–S9). We also noted a strong overall increase in gastrodermal HyWnt3-2149:GFP expression along the body column, indicating that the transactivation driven by the HyWnt3-2149 promoter in the gastrodermis is much greater than that driven by the full set of regulatory sequences of the endogenous HyWnt3 gene.
In summary, the analysis of GFP expression in these four transgenic lines helps identify the layer-specific regulation of Sp5 and Wnt3 in response to the ALP-induced activation of Wnt/β-catenin signaling (Figure 3C). The monitoring of GFP fluorescence in HySp5-3169:GFP animals confirmed these layer-specific differences, i.e., a transient Sp5 up-regulation in the body column after two or four days of ALP exposure, followed by a down-regulation when Wnt3/β-catenin signaling is highly active, mimicking the situation at the tip of the hypostome. Indeed, after a seven-day ALP treatment, HySp5-3169:GFP fluorescence is restricted to the modified apical and basal extremities in epidermal transgenic animals and shifted to the lower half of the body in gastrodermal ones (Figure 3D).

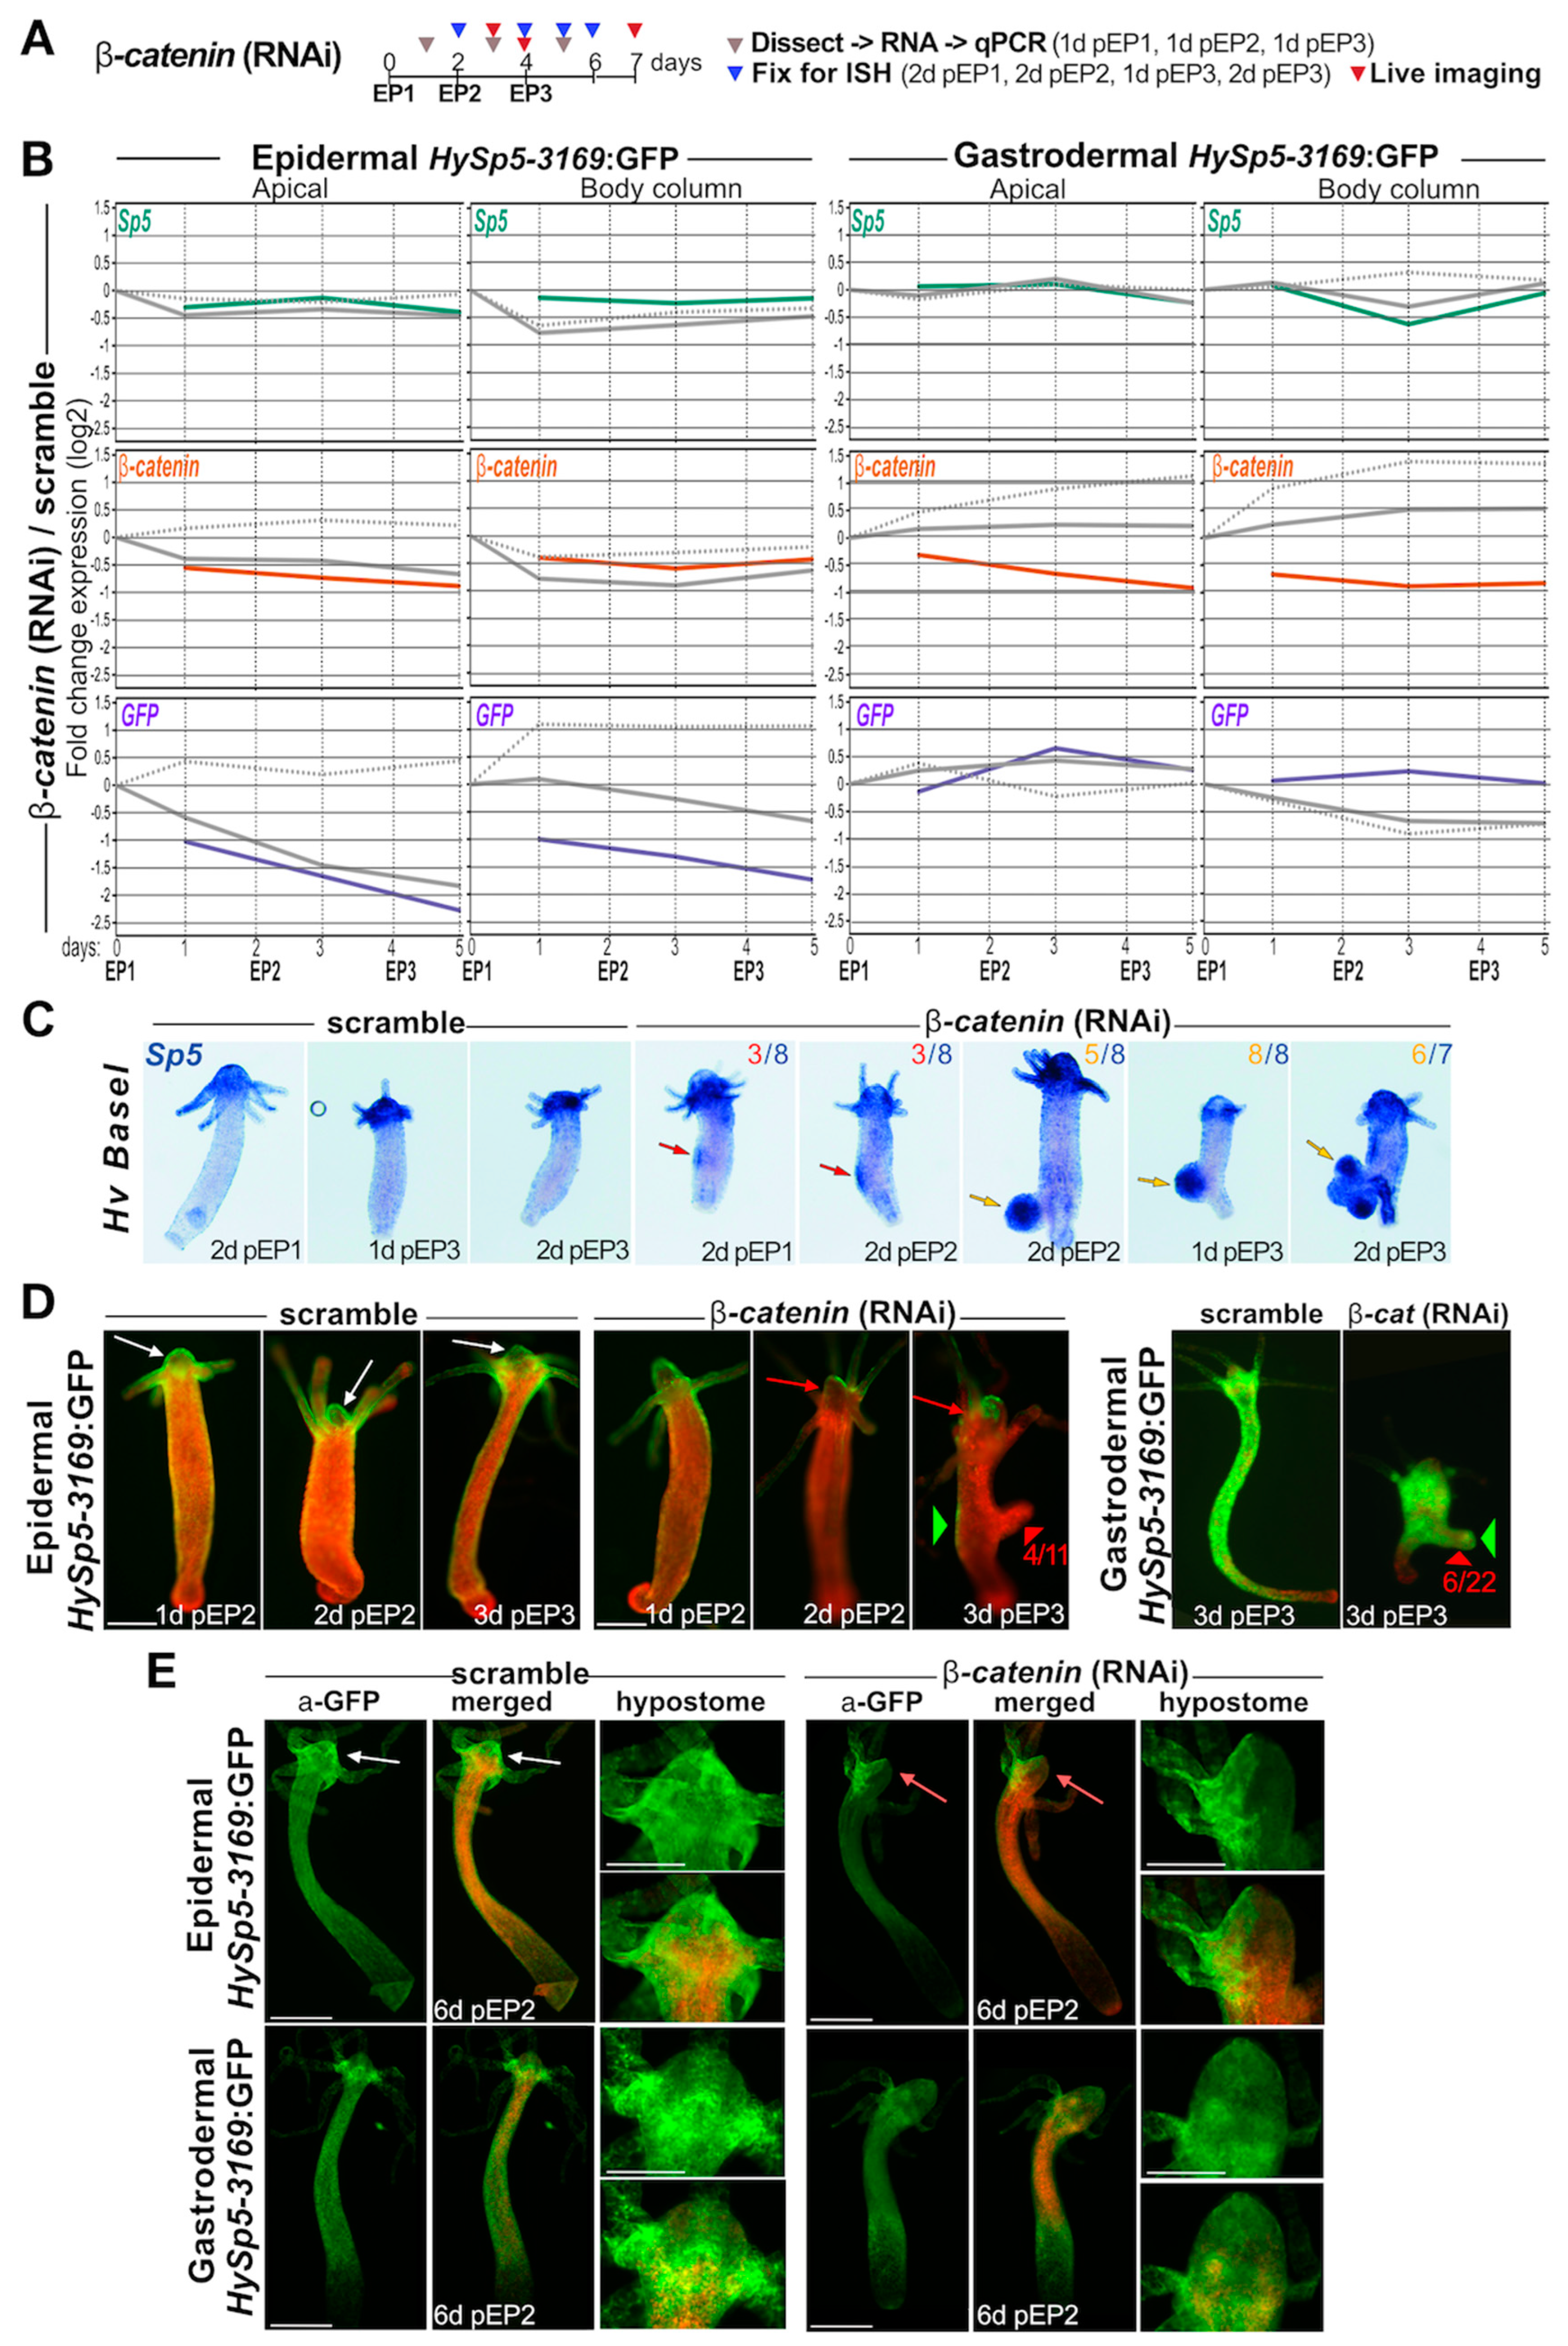
3.5. β-Catenin Knock-Down Differentially Impacts Sp5 Expression in Epidermis and Gastrodermis

To test a possible layer-specific regulation of Sp5 when β-catenin signaling is reduced, we knocked-down β-catenin in HySp5-3169:GFP transgenic animals (Figure 4A). As early as 24 h after the 1st electroporation (EP), we found the normalized levels of β-catenin transcripts significantly decreased by about 2-fold in each layer of the apical region and by 2-fold along the gastrodermis of the body column. Surprisingly, in gastrodermal HySp5-3169:GFP animals exposed to scrambled siRNAs, β-catenin transcript levels increase steadily after each EP in the apical region and body column. This observation suggests that the EP procedure leads to an unspecific stress-induced response that either activates β-catenin regulatory sequences and/or stabilizes β-catenin transcripts (Figure 4B and Figure S10).
With regard to the Sp5 levels, we did not detect any specific modulation, with the exception of a transient decrease one day post-EP2 along the body column of gastrodermal HySp5-3169:GFP animals (Figure 4B and Figure S11). Concerning the GFP levels, we recorded in the apical and body column regions of the epidermal HySp5-3169:GFP animals a progressive decrease below 25% in the apical region one day after EP3, a result that likely reflects the weaker activation of the HySp5-3169 promoter in the epidermis when β-catenin expression is decreased. We also noted in animals exposed to scrambled siRNAs a twofold increase in the level of epidermal GFP transcripts along the body column, again pointing to an EP-induced stress response. The consequences of β-catenin knock-down are different in the gastrodermis and are actually quite limited with a transient increase in the HySp5-3169:GFP transcript level in the apical region one day after EP2 without any significant modulation in the body column. It should be noted that the non-specific EP-induced increase in GFP observed in the epidermis is not observed in the gastrodermis.
In summary, the β-catenin RNAi procedure efficiently reduces the level of β-catenin transcripts, up to twofold in both the epidermis (mainly apical) and the gastrodermis (apical and body column). This β-catenin reduction does not affect the levels of Sp5 transcripts outside the −1.41/+ 1.41-fold range (except at one time-point in the gastrodermal body column). Notably, it strongly affects the HySp5-3169:GFP transcript levels in the epidermis where a two-to-four-fold reduction (apical and body column) is noted. Such an effect is not observed in the gastrodermis. Finally, we noted that the RNAi procedure produces an EP-induced stress response in the body column leading to an unspecific increase in β-catenin levels in the gastrodermis and in HySp5-3169:GFP levels in the epidermis.

3.6. β-catenin Knock-Down Leads to Formation of Bud-like Structures Expressing Gastrodermal Sp5

We previously showed that a transient knock-down of β-catenin triggers a size reduction in Hv_Basel animals, as well as the formation of “bud-like structures”, which grow from the body column similarly to buds, but without forming a complete head with a fully differentiated ring of tentacles [33]. These bud-like structures are present in 100% of Hv_Basel animals one day after EP3 (Figure S11). Remarkably, as early as two days after EP1, well-defined regions along the parental polyp already strongly express Sp5, even though the bud-like structures are not morphologically visible yet (Figure 4C and Figure S11).
Concerning GFP and mCherry fluorescence in epidermal_HySp5-3169:GFP animals, the control animals exposed to scramble siRNAs show the expected pattern of high-level GFP fluorescence in the apical region and a low one along the body column. Meanwhile, the β-catenin(RNAi) animals exhibit a loss of GFP fluorescence two days post-EP2 in well-defined areas of the apical region together with a globally reduced GFP fluorescence along the body column, except for some GFP-positive patches (Figure 4D and Figure S12A). Three days post-EP3, newly formed bud-like structures become visible in 30% to 60% of the animals and they never show any epidermal GFP fluorescence. We confirmed these findings by immuno-detecting GFP and mCherry in epidermal HySp5-3169:GFP animals knocked-down for β-catenin.
We noted the loss of epidermal GFP expression in large parts of the apical region, the presence of GFP-positive patches along the body column and the lack of GFP protein in the bud-like structures (Figure 4E and Figure S13). In gastrodermal HySp5-3169:GFP animals knocked-down for β-catenin, the gastrodermal layer remains GFP fluorescent in the tentacle ring and along the body column. The bud-like structures are all GFP fluorescent, with a positive signal in the presumptive apical region and often with a patchy pattern (Figure 4D and Figure S11B). We confirmed these findings by immunodetecting GFP and mCherry six days post-EP2 in these animals (Figure 4E and Figure S13).
In summary, β-catenin(RNAi) leads to the formation of bud-like structures in both Hv_Basel and Hv_AEP2 animals, a phenotype observed with a higher penetrance in the former (100% post-EP3) than in the latter (27% to 60%). These bud-like structures induced by β-catenin(RNAi) show low HySp5-3169:GFP/GFP expression in the epidermis, but high in the gastrodermis, in contrast to what is observed in natural buds (Figure 2E–H). This localized high level of Sp5 might explain why bud-like structures do not differentiate hypostome or tentacle rings. These results again point to a differential regulation of HySp5-3169:GFP by β-catenin signaling in the epidermis and gastrodermis.

3.7. Negative Auto-Regulation of Sp5 in the Epidermis

To determine whether the transcription factor Sp5 regulates its own expression, we knocked-down Sp5 in HySp5-3169:GFP transgenic animals and monitored in each layer changes in GFP, Wnt3 and Sp5 expression as well as changes in GFP fluorescence at different time points after EP1 and EP2. We anticipated that after Sp5(RNAi), GFP/GFP expression would be increased if Sp5 autoregulation was negative and decreased if Sp5 autoregulation was positive. As previously reported, we, however, noticed some unspecific EP-induced increases in the transcript levels in animals exposed to scramble siRNAs. Here, this corresponds to an unspecific increase in Wnt3 levels in both layers, maximal in the body column at 8 h post-EP1 and post-EP2. For Sp5(RNAi), we found in epidermal HySp5-3169:GFP animals, GFP transcripts more abundant 16 and 24 h after EP1 and EP2, two-to-four-fold in the apical region and above four-fold in the body column (Figure 5A and Figure S14). This GFP modulation was not observed in gastrodermal HySp5-3169:GFP animals. Regarding Wnt3 and Sp5 transcript levels, we did not detect any significant modulation by qPCR analysis, neither in the epidermal nor in the gastrodermal line.
The analysis of the GFP expression pattern in Sp5(RNAi) epidermal HySp5-3169:GFP transgenic animals confirmed the above results, with an increase in GFP levels at the same time-points (Figure 5B and Figure S15A). At the protein level, we first noted at 8 h post-EP1 some weak epidermal GFP fluorescence along the body column of some control and Sp5(RNAi) animals, possibly linked to the EP-induced activation of the HySp5-3169 promoter. At 16 h post-EP1, we recorded a marked and specific increase in epidermal GFP fluorescence along the body column of Sp5(RNAi) animals, which is maintained high up to 24 h post-EP2 (Figure 5C and Figure S16A). However, at two days post-EP2, when the ectopic epidermal GFP fluorescence is still detected, we found the GFP transcript levels in Sp5(RNAi) epidermal HySp5-3169:GFP transgenic animals significantly reduced in the apical and body column regions, implying that the Sp5(RNAi)-induced up-regulation of HySp5-3169:GFP is transient (Figure 5D). In gastrodermal HySp5-3169:GFP animals, we did not detect the global or localized modulation of GFP expression after Sp5(RNAi) (Figure 5A,B and Figures S14B and S15B). We also did not record any significant change in GFP fluorescence after EP1 (Figure 5C and Figure S16B). However, after EP2, we noted, in about half of the animals, ectopic spots of GFP fluorescence in the lowest part of body column or in the tentacles, indicating that Sp5-negative autoregulation might also take place in the gastrodermis, albeit more spatially restricted than in the epidermis.

3.8. Up-regulation of β-catenin after Sp5(RNAi) in Epidermis and Gastrodermis

We also performed concomitant q-PCR analysis of Sp5, Wnt3 and β-catenin transcript levels in HySp5-3169:GFP animals knocked-down for Sp5 at two days post-EP2. In epidermal HySp5-3169:GFP animals, we detected a significant increase in β-catenin transcripts in the body column and basal regions in the absence of significant modulations of Sp5 and Wnt3 levels (Figure 5D). In gastrodermal HySp5-3169:GFP animals, we likewise noted a significant increase in the levels of β-catenin transcripts in these two regions, alongside a slight reduction in the Sp5 and GFP transcript levels (Figure 5D). This up-regulation of β-catenin upon Sp5(RNAi), which is detected along the body column to a similar extent in both layers, is expected since the negative regulation played by Sp5 on Wnt/β-catenin expression is reduced when Sp5 is down-regulated, even transiently. Such regulation is, however, not detected in the apical region, consistently with previous results [33].
Despite the lack of the sustained down-regulation of Sp5 transcripts after Sp5(RNAi), we conclude that the two-step RNAi procedure we applied is effective, highlighting the dynamic regulation of Sp5 in each epithelial layer, with a 24 h-long up-regulation of HySp5-3169:GFP along the epidermis after each exposure to Sp5(RNAi). We did not record such a modulation of HySp5-3169:GFP in the gastrodermis. We interpreted the up-regulation of the epidermal GFP transcripts after Sp5(RNAi) as the consequence of knocking down the negative autoregulation played by the Sp5 transcription factor on its own expression. This is, however, only transient, as one day later, the GFP expression levels decreased by about twofold, probably as a consequence of the up-regulation of β-catenin expression that takes place in both layers of the body column, leading to a transient up-regulation of Sp5 between 24 and 48 h after EP2, producing the Sp5 protein at a level where it represses the Sp5 promoter and hence decreases the GFP transcript levels. However, two days after EP2, an ectopic GFP fluorescence was still visible in the epidermis (Figure 5E and Figure S17), in keeping with the long lifespan of the GFP protein [43].

3.9. Identification of Five Active Sp5-Binding Sites within the Proximal Hydra Sp5 Promoter

The Hydra Sp5 transcription factor belongs to the Sp/KLF family, a class of DNA-binding proteins that bind GC-rich boxes or GT/CACC elements through their three zinc finger (ZF) domains [32,44]. We previously identified, by ChIP-seq analysis performed with extracts from HEK293T cells, five Sp5-binding sites (Sp5-BS) and five TCF-binding sites (TCF-BS) within 2966 bp of the Sp5 promoter, clustered in two adjacent regions named PPA and PPB in the vicinity of the Sp5 transcriptional start site [33]. To identify active Sp5-binding sites (Sp5-BS) in Hydra Sp5 promoter sequences, we raised antibodies against the Hydra Sp5 protein with the aim of performing a ChIP-qPCR analysis of the HySp5 promoter using Hydra extracts and comparing Sp5-binding sites with those previously identified in human cells expressing HySp5. We raised two antibodies against HySp5, one monoclonal and the other polyclonal, designed to target regions that do not contain evolutionarily conserved domains present in HySp5, such as the Sp box, the Buttonhead box and the ZF DNA-binding domain (Figure 6A and Figure S18A). The two Sp5 antibodies specifically recognize the HySp5 protein, either as the HySp5-218 recombinant protein (24.5 kDA) used to raise the Sp5 monoclonal antibody, produced full length in vitro with the TNT reticulocyte transcription-coupled-translation system or expressed in transfected HEK293T cells (Figure 6B and Figure S18B,C).
In the Hv_AEP2 extracts, the monoclonal anti-Sp5 detects the Sp5 protein at higher levels in the apical region than in the body column as expected. In contrast, in three independent experiments, the polyclonal anti-Sp5 antibody recognizes a band at the appropriate size, but exclusively in nuclear extracts (NEs) prepared from the lower body column and not from the apical region (Figure S17C). To evidence the possible cross-reactivity with the closely related Sp4 protein, we tested the polyclonal α-Sp5 antibody on the TNT-produced Hydra Sp4 protein but did not detect any band. We suspect that the polyclonal α-Sp5 antibody detects the Sp5 protein, but also cross-reacts with an unidentified Sp/KLF protein predominantly expressed in the body column and basal half of Hydra.
Next, we tested both the monoclonal and the polyclonal α-Sp5 antibodies in a ChIP-seq analysis of the Sp5-bound regions. We first used Hm-105 extracts to assay the amplification of 15 regions along the 3169 bp of the Sp5 promoter and 5′UTR sequences after ChIP (Figure 6C and Figure S18D). Of these 15 regions, we found only two 100 bp-long regions specifically enriched with either antibody, but not by pre-immune serum, namely the overlapping PP4 (−135/−36) and PP5 (−71/+29) regions located in the proximal promoter of Sp5. Interestingly, the enrichment of the regions PP4 and PP5 by ChIP-qPCR is similar when extracts from Hv_AEP animals are used (Figure 6D and Figure S18D). Moreover, these two regions were also identified when the ChIP-qPCR analysis was performed with extracts from human cells expressing HySp5 [33]. Each region contains three putative Sp5-BS, one of them (Sp5-BS3) being present in both PP4 and in PP5 (Figure 6E,F).
To test whether these putative Sp5-BS are functional in Hydra, we designed two double-stranded oligonucleotides (ds-DNAs) to perform an Electro-Mobility Shift Assay (EMSA) with (1) PPA (−135 to −67), which encompasses the identical Sp5-BS1 and Sp5-BS2 motifs, and (2) PPB (−71 to +2), which contains the distinct Sp5-BS3 and Sp5-BS4 motifs (Figure 6E–G). When Hydra NEs were incubated with biotin-labeled Sp5 ds-DNAs, we recorded a mobility shift, with two retarded bands for PPA and two distinct bands for PPB, no longer visible in the presence of a 200 fold excess of unlabeled oligonucleotides (Figure 6G). The mutation of Sp5-BS1 and Sp5-BS2 in the PPA region (CCGCCT -> CTTCCT) did not cancel the shift, but rather accentuated it. In contrast, when Sp5-BS3 (GCGCCA -> GTTCCA) and Sp5-BS4 (AGGCGT -> ATTCGT) in the PPB region were mutated, the shift almost disappeared. We, therefore, concluded that HySp5 likely binds the putative Sp5 binding sites in the PPA and PPB regions, with higher specificity in the latter; these results support the hypothesis that in Hydra, the Sp5 transcription factor is involved in Sp5 autoregulation.

3.10. The Sp5 Proximal Promoter Is Involved in Sp5-Negative Autoregulation

To determine whether some of these five proximal Sp5-binding sites are indeed involved in Sp5 auto-regulation, we tested these sequences in an ex vivo transactivation assay system (Figure 7A). We prepared seven reporter constructs where the expression of luciferase is driven either by the full HySp5 promoter (HySp5-2992:luciferase), by a shorter version where 164 bp of the proximal sequences are deleted (HySp5-2828:luciferase) or by the full HySp5 promoter where one of the five HySp5-BS is mutated (HySp5-2992-mBS1:luciferase, -mBS2, -mBS3, -mBS4 and -mBS5). Each of these reporter constructs were co-expressed in HEK293T cells either with the full Sp5 protein under the control of the CMV promoter (CMV:HySp5-420) or with a truncated version of the Sp5 protein lacking the DNA-binding domain (CMV:HySp5-ΔDBD).
In conditions where Sp5 is either not expressed or expressed but in its truncated version (HySp5-ΔDBD), we recorded low luciferase activity, consistent with the fact that the HySp5-2992 promoter is poorly active in HEK293T cells (Vogg et al., 2019) [33]. In contrast, in the presence of the HySp5-420 protein, we measured a 7 fold higher level of activity of the HySp5-2992 promoter and obtained similar levels when the HySp5-BS1, HySp5-BS2 and HySp5-BS4 sites were mutated (Figure 7A). However, surprisingly, when the proximal sequences are completely deleted, the transactivation levels are more than doubled, indicating that these sequences actively repress the activity of the HySp5-2992 promoter in the presence of the HySp5-420 protein. When the HySp5-BS3 and HySp5-BS5 sites are mutated, the activity is lower than that recorded when the HySp5-2992 promoter is complete, indicating that either these two sites play a positive role for the full activity of the HySp5 promoter or they restrict the repressive activity of the proximal sequences. These results show that the HySp5 promoter is subject to complex regulation, with a clear Sp5-dependent repressive role of the proximal sequences and an enhancing role of the more upstream ones.

3.11. The Zic4 Transcription Factor Positively Regulates Sp5 Expression

We recently showed that the Hydra transcription factor Zic4 (HyZic4), which is involved in the differentiation of tentacles and the maintenance of their identity, is a downstream target gene of HySp5 [34]. We considered the possibility that Zic4 also regulates Sp5 expression in a feedback loop. We first searched for the presence of Zic-binding sequences (Zic-BS) as deduced from those identified in vertebrate or non-vertebrate gene promoters [45] (Table 1). We identified two putative Zic-BS in the HySp5-2992 upstream sequences at positions −670/−659 and −391/−369 (Table 1, Figure S2), as well two putative Zic-BS in the HyWnt3-2149 upstream sequences and five in the HyZic4 ones (Table 1, Figure S20). To test whether HyZic4 regulates HySp5, we expressed in HEK293T cells the HySp5-2992:luciferase construct together with either the full HyZic4 protein (CMV:Zic4-431) or a truncated form lacking its DNA-binding domain (CMV:HyZic4-ΔDBD) (Figure 7B). In the presence of HyZic4, the HySp5-2992:luciferase activity is multiplied by almost 50 fold when human β-catenin is co-expressed and over 50 fold when human β-catenin is not co-expressed. Remarkably, the luciferase activity becomes basal when the Zic4 DNA-binding domain is deleted, indicating that HyZic4 can enhance HySp5 expression through directly binding to its promoter, independently of β-catenin.
Next, we tested the level of HyZic4 promoter activity in HEK293T cells, which contain two putative Sp5-binding sites [34], when Sp5 is co-expressed. We measured a 10 fold increase in the HyZic4-3505:luciferase activity when the full Sp5 protein (CMV:HySp5-420) is co-expressed, an increase no longer detected when the Sp5 protein lacks its DNA-binding domain (CMV:HySp5-ΔDBD) (Figure 7C). As stated previously, this increase is observed at similar levels in the presence or absence of human β-catenin co-expression. This result indicates that Sp5 can significantly enhance HyZic4 expression through direct DNA-binding.
Similarly, we also measured a strong Zic4 auto-activation (~50 fold), which requires the DNA-binding domain (Figure 7G). By contrast, when we used the TOPFlash assay where six tandem TCF-binding sites can enhance luciferase expression [61], we found that the TOPFLASH luciferase activity decreased when Zic4 is co-expressed. This Zic4-dependent repression requires the Zic4 DNA-binding domain, proved to be Zic4 dose-dependent and is enhanced when human β-catenin is co-expressed (Figure 7E,F). However, when we tested the Zic4 activity on the Wnt3 promoter (2142 bp), we found a 10 fold increase in the HyWnt3-2142:luciferase activity, likely through a direct interaction as this increase is no longer observed when the Zic4 DNA-binding domain is deleted (Figure 7G).
We have summarized these interactions with those previously identified with Sp5 or Zic4 in HEK293T cells [28,29] in a scheme that presents a series of positive loops where Zic4 appears very potent, including in its own autoregulatory loop, and two negative regulations, with Sp5 repressing Wnt3 expression and Zic4 repressing TCF-regulated promoters (Figure 7H). In HEK293T cells overexpressing HyZic4, we also show by co-immunoprecipitation that the two transcription factors HyZic4 and human TCF1 can physically interact (Figure 7I), similarly to what we previously showed between HySp5 and TCF1 [33]. These results suggest that in Hydra cells where Sp5 and Zic4 are co-expressed, they enhance each other’s expression while repressing TCF/β-catenin transcriptional activity.
We tested this gene regulatory network (GRN) in Hydra and indeed found in animals knocked-down for Zic4 or β-catenin the Zic4 levels down-regulated at least two-fold and also reduced after Sp5 knock-down, but at a lower level (Figure 7J). We also found the levels of Sp5 moderately down-regulated in animals knocked-down for Zic4 or for β-catenin (Figure 7K). We concluded that the regulatory events recorded in HEK293T cells likely take place in Hydra cells where all components of this GRN are expressed, namely in the gastrodermal epithelial cells of the head region where Sp5 and Wnt3 are highly expressed and in the epithelial battery cells located in the epidermis of the tentacles (Figure 8A).

4. Discussion

4.1. Epithelial Layer-Specific Regulations of Sp5 in Intact Animals

To better decipher the dynamics of the interactions between the activating and inhibiting components of the head organizer in intact and regenerating Hydra, we compared the in vivo regulation of Sp5 in each epithelial layer, epidermal and gastrodermal, when developmental, pharmacological or genetic conditions vary (see Table A1). For this purpose, we used transgenic lines expressing the reporter construct HySp5-3169:GFP either in the epidermis or gastrodermis and analyzed GFP expression in intact or developing animals, either regenerating or budding. In intact animals, we found several differences between epidermal and gastrodermal GFP/GFP expression; in the epidermis, GFP/GFP is expressed throughout the hypostome, while the tip of the hypostome is free of gastrodermal GFP/GFP, in agreement with the fact that Sp5 transcripts are not detected in this area [33]. In addition, epidermal GFP/GFP is maximal in the tentacle ring and uppest body column, while the gastrodermal one extends along the body axis. In animals regenerating their heads, we noted a differential temporal regulation of Sp5 in each layer, with GFP up-regulated during the early phase in the gastrodermis but one day later in the epidermis.
These layer-specific regulations of HySp5-3169:GFP were identified through different approaches: at the protein level, by monitoring in vivo GFP fluorescence and immunodetecting GFP protein expression, and at the transcript level, by performing qPCR and in situ hybridization to quantify and map endogeneous Sp5 and GFP expression along the body axis. In addition, these layer-specific regulations of Sp5 in intact animals are supported by the single-cell analysis of Sp5 expression [35] that shows a predominant expression of Sp5 in epithelial cells, with maximal levels observed in tentacle battery cells located in the epidermis, a lower level in epithelial cells of the hypostome and no expression in stem cells along the body column. In the gastrodermis, single-cell analysis detects the highest levels of Sp5 in apical cells and in one sub-population of epithelial stem cells along the body column (Figure 8A). Therefore, we concluded that the HySp5-3169:GFP transgenic lines provide suitable and reliable tools to monitor the endogenous Sp5 regulation, with the 3 kb of Sp5 upstream sequences inserted in this construct being sufficient to direct GFP expression in a way that mimics endogenous Sp5 regulation in each layer.

4.2. Three Architectures of the Wnt3/β-Catenin/TCF/Sp5/Zic4 GRN in Intact Hydra

This study adds a new level of understanding of how the head organizer works in Hydra. The parallel analysis of the Wnt3/β-catenin/TCF/Sp5/Zic4 GRN in human HEK293T cells and in Hydra epithelial layers reveals complex cross-regulatory interactions. We first could confirm several positive regulations, those of Wnt3/β-catenin/TCF on Sp5 and Zic4 expression and that of Sp5 on Zic4, and identify some new ones such as Zic4 on Sp5 and Zic4 on Wnt3 (at least in HEK293T cells). We also confirmed the down-regulation of Wnt3 by Sp5 and reported, as a new finding, the down-regulation of β-catenin by Sp5, as well as the down-regulation of β-catenin/TCF activity by Zic4 (at least in HEK293T cells). Finally, we identified autoregulatory loops, positive for Sp5/Sp5 and Zic4/Zic4 in HEK293T cells, positive for Wnt3/Wnt3 and β-catenin/β-catenin via TCF in Hydra and negative for Sp5/Sp5 in the Hydra epidermis (see Table A1).
By analyzing these interactions along the body axis of intact animals, we could characterize three distinct organizations of the Wnt3/β-catenin/TCF/Sp5/Zic4 GRN that correspond to three distinct patterning functions in three anatomical contexts (Figure 8). Indeed, in the analysis of Wnt3, β-catenin, Sp5 and GFP regulation in epidermal and gastrodermal HySp5-3169:eGFP and HyWnt3-2149:eGFP transgenic lines after ALP treatment, β-catenin(RNAi) or Sp5(RNAi) show that Sp5 is differentially regulated in the epidermis and gastrodermis (1) at the apex, (2) in the tentacle zone and (3) along the body column (Figure 8B–E). At the apex of intact animals, the tightly spatially restricted expression of Sp5 in the gastrodermis is crucial for maintaining maximal levels of Wnt3 expression at the tip of the head, where Wnt3/β-catenin/TCF signaling drives the constitutive head organizer activity leading to head maintenance. In the tentacle zone, the positive co-regulation of Sp5 and Zic4 in the epidermis of the tentacle zone is critical for tentacle formation with an unclear role for the gastrodermis. Along the body column, the high levels of Sp5 expression and Sp5 activity in the gastrodermis, possibly through positive autoregulation, are critical for keeping Wnt3/β-catenin/TCF signaling low and preventing the formation of ectopic tentacles, bud-like structures or ectopic heads.

4.3. Sp5-Negative Autoregulation in the Epidermis

Sp5 was identified as a target and a regulator of the Wnt transcriptional program in vertebrates [28,29,30,31,32], notably as a repressor [30,62]. We also showed that Hydra or zebrafish Sp5 expressed in human cells acts as an evolutionarily conserved transcriptional repressor, including on transcriptional machinery and on Sp genes [33]. This new study confirms this finding as in Hydra, Sp5 negatively regulates its own expression in the epidermis, as evidenced by the transient up-regulation of Sp5 after each exposure to Sp5 siRNAs. However, the response to Sp5(RNAi) in HySp5-3169:GFP transgenic animals is highly asymmetrical between the epithelial layers as in the epidermis, there is a transient but massive increase in GFP expression and GFP fluorescence along the body axis, together with a limited increase in Sp5 and Wnt3 levels along the body column. In contrast, in the gastrodermis, we recorded no overall increase in the GFP transcript level, but only a few ectopic spots of GFP overexpression or GFP fluorescence in the peduncle region and tentacles.
We interpret this transient GFP/GFP up-regulation in the epidermis together with that of Sp5, although more limited, as a release of the negative auto-regulation played by Sp5 in this layer. This epidermal-specific Sp5 negative autoregulation suffices to explain the lower constitutive Sp5 expression recorded in this layer. As such, this constitutive asymmetry in Sp5 expression also explains the more effective Sp5(RNAi) knock-down in the epidermis as Sp5 levels are low and epithelial cells are highly accessible to electroporated siRNAs, whereas in the gastrodermis, Sp5 levels are higher and epithelial cells are less accessible.
Among the 2992 bp Sp5 upstream sequences, the ChIP-seq analysis could identify only two areas in the Sp5 proximal promoter, PPA and PPB, which are enriched in the Sp5 protein when Hm-105 or Hv_AEP2 nuclear extracts are used. In addition, these two areas, which each contain two Sp5-binding sites previously identified by ChIP-seq analysis in human cells expressing HySp5, are necessary for Sp5-negative autoregulation. The role of Sp5-negative autoregulation in the GRN is further supported by these new findings, showing that Sp5 can directly regulate its own promoter.
Sp5 regulation is quite dynamic, as observed in HySp5-3169:GFP animals exposed to Sp5(RNAi) where GFP levels are first found up-regulated in the epidermis, as discussed above, then one day later, significantly down-regulated in the apical region and body column, providing evidence for a return to Sp5-repressive activity. In parallel, the Sp5 and Wnt3 transcript levels remain unaffected, possibly as the result of the highly dynamic cross-regulations that take place between these genes. In the gastrodermis, the Sp5 and GFP levels are only mildly decreased in response to Sp5(RNAi), whereas β-catenin is up-regulated in both layers along the body column indicating that in intact animals, Sp5 acts as a head inhibitor by repressing not only Wnt3, but also β-catenin expression, thus reinforcing the feed-back loop that reduces head activation, i.e., Wnt3/β-catenin signaling activity.

4.4. Distinct Configurations of the Wnt3/β-Catenin/Sp5 GRN in the Homeostatic and Developmental Head Organizers

This study shows that the temporal and spatial regulation of Sp5 and Wnt3 in each epithelial layer is in fact different in the homeostatic and developmental organizers. In intact animals, the absence of HySp5-3169:GFP expression in the gastrodermal epithelial cells of the perioral region where Wnt3 expression is maximal indicates that a high level of Wnt/β-catenin signaling can only be stably maintained if Sp5 expression is repressed. This equilibrium situation is necessary to maintain homeostatic organizer activity. How Sp5 expression is maintained inhibited within gastrodermal cells of the homeostatic head organizer has not yet been identified. Since in each context where Wnt3 expression is highest, Sp5 is repressed, we infer that the highest levels of Wnt/β-catenin signaling induce the transcriptional repression of Sp5 and/or degradation of Sp5 transcripts.
In contrast, in the apical-regenerating tip, the Sp5 expression domain is broad in the gastrodermis, likely necessary for restricting head organizer activity, i.e., limiting Wnt3 and β-catenin up-regulation as well as the activation of Wnt3/β-catenin/TCF signaling, as such as a single head develops instead of multiple ones. The Wnt3 and Sp5 gastrodermal domains overlap at least for the first 24 h after a mid-gastric bisection, with Sp5 expressed at a high level in these cells. Therefore, we believe that in gastrodermal epithelial cells that have the power to develop organizing activity, as in apical-regenerating tips, Wnt3/β-catenin signaling is protected from Sp5 activity, either by the active inhibition of Sp5 repressive transcriptional activity on Wnt3 or β-catenin expression or by the enhanced degradation of the Sp5 protein. In conclusion, it remains to be understood how interactions between Wnt3/β-catenin signaling and the Sp5 transcription factor remain distinct in the homeostatic and developmental head organizers, possibly via transcriptional or post-transcriptional mechanisms in the former context and via translational or post-translational mechanisms in the latter one.

4.5. Phenotypic Changes Induced by Dysregulations of the Wnt3/β-Catenin/TCF/Sp5/Zic4 GRN

The perturbations of the dynamic interactions within the Wnt3/β-catenin/TCF/Sp5/Zic4 GRN induce several phenotypes along the body axis such as (i) the loss of tentacle identity after Zic4(RNAi) [34], (ii) the formation of ectopic tentacles after ALP treatment [23] associated with an overall increase in gastrodermal Sp5 expression and a punctuated up-regulation of Wnt3 in both layers, (iii) the formation of multiple ectopic heads induced by Sp5(RNAi) linked to the time- and space-restricted decrease in gastrodermal Sp5 associated with the localized activation of Wnt3/β-catenin/TCF signaling, as observed in Hv_Basel [33], and (iv) the formation of bud-like structures upon β-catenin(RNAi), which rarely differentiate a head. This latter phenotype is highly penetrant in Hv_Basel, was present in 100% of animals one day after EP3 and was identical but less penetrant in Hv_AEP2 transgenic animals.
The regulations of Sp5 in HySp5-3169:GFP transgenic animals knocked-down for β-catenin are layer-specific, consistent with the observed phenotype. In the epidermis, β-catenin(RNAi) leads to a drastic reduction in GFP expression and GFP fluorescence, consistent with the fact that Sp5 is directly positively regulated by Wnt/β-catenin signaling [33]. In contrast, in the gastrodermis, the localized up-regulation of GFP expression and GFP fluorescence in the bud-like structures were unexpected. The preliminary results indicate that the RNAi-induced decrease in the β-catenin transcript levels leads to the rapid nuclear translocation of the β-catenin protein available in gastrodermal cells and the subsequent transactivation of β-catenin/TCF target genes such as Sp5.
This paradoxal response to β-catenin(RNAi) explains (a) the rapid growth of bud-like structures in starved animals that normally do not bud, (b) the high level of gastrodermal HySp5-3169:GFP and Sp5 expression in these structures and (c) the lack of head structure differentiation due to the high level of Sp5 and the inhibition of the head organizer. This two-step response to β-catenin knock-down provides an experimental paradigm for inducing the proliferative phase of the budding process in the absence of apical differentiation and for characterizing the molecular players required in parental tissues.

4.6. Variability of Head Organizer Inhibitor Strength across Hydra Strains

In this study, we observed great phenotypic variability between Hv_Basel and Hv_AEP2 after exposure to GRN modulators, whether ALP treatment or Sp5 knockdown. After ALP, Hv_Basel developed numerous ectopic tentacles along their body column within a few days, whereas Hv_AEP2 formed very few, even after seven days of ALP exposure. In Hv_Basel, a two-day exposure to ALP led to a first wave of Sp5 up-regulation, followed two days later by a second wave of Wnt3 up-regulation, inducing the formation of small Wnt3 spots along the body column and the subsequent emergence of multiple ectopic tentacles, as observed in Hv_ZüL2.
In contrast, in Hv_AEP2 animals, either non-transgenic or transgenic (Sp5-3169:GFP and Wnt3-2149:GFP animals), exposure to ALP led to two waves of gene regulation that were slightly different. In the first phase, large circles of cells transiently expressing Sp5 were formed in the epidermis and a more diffuse and intense expression of Sp5 was observed in the gastrodermis. This phase was followed by the appearance of Wnt3 spots along the body column, with just a few in the epidermis, but multiple ones in the gastrodermis together with a Wnt3 diffuse expression (Figure 8D,E). Nevertheless, only rare ectopic tentacles were formed in Hv_AEP2 animals. We infer that despite multiple spots of high Wnt3, Sp5 activity is constitutively higher along the gastrodermis when compared to Hv_Basel, repressing β-catenin which is kept minimal in SC2 epithelial stem cells.
After Sp5(RNAi), all Hv_Basel animals become multiheaded, whereas Hv_AEP2 animals treated in the same way do not. This highly penetrant multiheaded phenotype in Hv_Basel occurs without affecting the original head region, likely because Sp5 expression remains high there, less subject to modulation and sufficient to have a phenotypic impact (Figure 8B,C). In contrast, in Hv_Basel, the body column acquires the properties of a head organizer after Sp5(RNAi). However, this does not happen in Hv_AEP2 animals, where the absence of ectopic axis formation upon Sp5(RNAi) is explained by the fact that gastrodermal cells express Sp5 at higher constitutive levels than in Hv_Basel, maintaining Sp5 repression on Wnt3 and β-catenin expression and preventing ectopic axis formation.
In conclusion, the rarity of the ectopic tentacle phenotype after ALP or the absence of the multiple-head phenotype after exposure to Sp5(RNAi) in Hv_AEP2 animals result from the stronger activity of the head organizer inhibitor along the body column in these animals compared to that present along the body column of Hv_Basel or Hv_ZüL2 animals. These results are consistent with previous studies that revealed, through systematic transplantation experiments performed on a variety of Hydra strains, significant variations in the respective strengths of the head activation and head inhibition components along the apical-to-basal axis between Hydra strains [7,63,64]. These results also highlight the predominant role of the gastrodermis in the negative regulation of the head organizer as previously demonstrated by producing chimeric animals with gastrodermal epithelial cells isolated from strains with low or high levels of head inhibition [65].

5. Conclusions

This study, based on the analysis of Sp5 and Wnt3 regulation in each epithelial layer of Hydra, reveals distinct architectures of the Wnt3/β-catenin/TCF/Sp5/Zic4 GRN in different anatomical regions of the animal. Each architecture is characterized by a specific relative weight for each component, providing a unique combination that controls or prevents a specific patterning process. In the context of tentacle formation, the β-catenin-dependent activation of a subset of the GRN, namely Sp5 and Zic4, plays the leading role in the epidermis and the head activator component is kept inactive. In the context of head maintenance or head formation, the head activator component, i.e., Wnt3/β-catenin/TCF signaling, plays the leading role in the gastrodermis. In the context of the body column, the head inhibitor component plays the leading role in the gastrodermis to keep the head organizer locked, even though the time- and space-restricted down-regulation of Sp5 can occur, supporting the localized activation of Wnt3/β-catenin/TCF signaling and further ectopic head formation.
The next step will be to compare the epidermal and gastrodermal chromatin signatures in the hypostome, the apical-regenerating tips and the tentacle ring along the body column to map the regulatory sites linked to the context-specific GRN architecture. The complete set of actors involved in each context as well as the role they play in relation to the Wnt3/β-catenin/TCF/Sp5/Zic4 GRN remains to be identified, e.g., Brachyury [66,67] and MAPK/CREB [24,41,68,69,70] for head activation; notum [66,67], Dkk1/2/4, Thrombospondin and HAS7 [71,72,73,74] for head inhibition; and Alx and Notch signaling for tentacle formation [75,76,77]. Also, further questions to investigate will be how this GRN, which is conserved across evolution [32,33,62], moves from one architecture to another, typically when Sp5 or β-catenin levels reach some threshold values or when additional players modify the GRN patterning function. More generally, an in-depth understanding of the molecular mechanisms behind the formation of the organizing center should enable us to transform a somatic tissue into one endowed with developmental organizing properties.

Supplementary Materials

The following supporting information can be downloaded at: https://www.mdpi.com/article/10.3390/biomedicines12061274/s1, Table S1: Accession numbers of the Hydra genes used in this study; Table S2: List of primers, siRNAs and ds-oligonucleotides; Table S3: List of reporter or expression constructs used in this work; Figure S1: Sp5 (t29291aep) single-cell expression as deduced from Hydra single-cell transcriptomes; Figure S2: Map and sequences of the HyActin-1388:mCherry_HySp5-3169:GFP construct (10,533 bp); Figure S3: Epidermal and gastrodermal GFP fluorescence in intact HySp5-3169:GFP transgenic animals; Figure S4: Epidermal and gastrodermal profiles of GFP and mCherry fluorescence in intact HySp5-3169:GFP transgenic animals; Figure S5: Layer-specific GFP expression in regenerating HySp5-3169:GFP animals; Figure S6: GFP and mCherry fluorescence in apical-regenerating (AR) or basal-regenerating (BR) halves of epidermal and gastrodermal HySp5-3169:GFP transgenic animals; Figure S7: Impact of alsterpaullone treatment on Sp5 and Wnt3 expression in Hv_AEP2 animals; Figure S8: Impact of ALP treatment on Sp5, GFP and Wnt3 expression patterns in epidermal and gastrodermal HySp5-3169:GFP transgenic animals; Figure S9: Impact of ALP treatment on Sp5, GFP and Wnt3 expression patterns in epidermal and gastrodermal HyWnt3-2149:GFP transgenic animals; Figure S10: Impact of β-catenin(RNAi) on β-catenin, Sp5 and GFP transcript levels in epidermal and gastrodermal HySp5-3169:GFP transgenic animals; Figure S11: Impact of β-catenin(RNAi) on formation of bud-like structures expressing Sp5 in Hv_Basel animals; Figure S12: Impact of β-catenin(RNAi) on GFP and mCherry fluorescence in epidermal and gastrodermal HySp5-3169:GFP transgenic animals after one, two or three siRNA exposures; Figure S13: Impact of β-catenin(RNAi) on GFP and mCherry immuno-detected patterns in epidermal and gastrodermal HySp5-3169:GFP transgenic animals six days after the 2nd siRNA exposure; Figure S14: Impact of Sp5(RNAi) on Sp5, GFP and Wnt3 transcript levels in epidermal and gastrodermal HySp5-3169:GFP transgenic animals; Figure S15: Impact of Sp5(RNAi) on GFP expression patterns in epidermal and gastrodermal HySp5-3169:GFP transgenic animals; Figure S16: Impact of Sp5(RNAi) on GFP and mCherry fluorescence in epidermal or gastrodermal HySp5-3169:GFP transgenic animals at early time-points after one or two siRNA exposures; Figure S17: Impact of Sp5(RNAi) on GFP and mCherry fluorescence in epidermal and gastrodermal HySp5-3169:GFP animals two days after the 2nd siRNA exposure; Figure S18: ChIP-qPCR analysis of the Sp5-binding sites in the HySp5 promoter using anti-HySp5 antibodies; Figure S19: Mapping the putative Sp5 Transcriptional Start Sites (TSS); Figure S20: Putative Zic4-binding sites in the Hydra Wnt3 and Zic4 genomic sequences. References [78,79,80] are cited in the supplementary materials.

Author Contributions

Conceptualization: L.I.O., M.C.V., P.G.L.S. and B.G.; Methodology: L.I.O., C.P., P.G.L.S. and B.G.; Investigation: L.I.O., C.P., M.C.V. and P.G.L.S.; Visualization: L.I.O., C.P., P.G.L.S., M.C.V. and B.G.; Funding acquisition: B.G.; Supervision and project administration: B.G.; Writing—original draft: L.I.O. and B.G.; Writing—review and editing: B.G. All authors have read and agreed to the published version of the manuscript.

Funding

This work was supported by the Canton of Geneva, the Swiss National Science Foundation grants (31003_169930; 310030_189122). L.I.O. was supported by an iGE3 doctoral fellowship and PGLS was supported by an Excellence Scholarship for Foreign Scholars of the Swiss Government.

Institutional Review Board Statement

Not applicable.

Informed Consent Statement

Not applicable.

Data Availability Statement

Data are contained within the article and Supplementary Materials.

Acknowledgments

The authors thank Ariel Ruiz-i-Altaba and Charisios Tsiairis for fruitful discussions on the project, Leonardo Beccari for excellent advice, Wanda Buzgariu for commenting on the manuscript and helping with the imaging, and all members of the Galliot lab for discussions.

Conflicts of Interest

The authors declare no conflicts of interest. The funders had no role in the design of the study; in the collection, analyses, or interpretation of data; in the writing of the manuscript; or in the decision to publish the results.

Appendix A

Table A1. Summary table listing the results obtained in the epidermis and gastrodermis of HySp5-3169:GFP transgenic animals. Features specific to the epidermal epithelial layer are written in red, those specific to the gastrodermal epithelial layer are in blue and those identical between the two layers are in black; items written in brown indicate similar features between the two layers, with distinct quantitative values. BC: body column, d: days, hpa: hours post-amputation, pEP: post-electroporation, st.: stage.
Experimental ConditionsPhenotypes Tested GenesEpidermal GFP
HySp5-3169:GFP Animals
Gastrodermal GFP
HySp5-3169:GFP Animals
Figures
Supplement.
INTACT ANIMALSGFP, Sp5, Wnt3 transcripts
GFP fluorescence
GFP protein
Apical: tentacle ring, tentacles
Hypostome: whole, tentacle ring +
BC: upper only
Apical: tentacle ring, tentacles
low at head tip, tentacle ring ++
BC: high from 90% to 40%
1E, 1F
1C, 1D, 1G-1L
S3, S4
REGENERATING ANIMALSGFP transcripts
GFP fluorescence
Apical Reg.: GFP(+) from 24 hpa
GFP(+) in upper AR half
Basal Reg.: no GFP, no GFP
Apical Reg.: GFP(+) from 8 hpa
GFP(+) in upper AR half
Basal Reg: GFP(+) 8-12 hpa, then GFP(-)
diffuse GFP along BR halves
2A, 2B, S5
2C, 2D, S6
BUDDING ANIMALSGFP fluorescenceGFP(+) patch (st.1)
GFP+ budding belt (st.3,4)
GFP(+) bud (st. 5,6)
GFP(+) head (st.9)
diffuse GFP(+) polyp (st.3, 4)
diffuse GFP(+) bud (st.5, 6)
low boundary GFP(+) belt (st. 6)
diffuse GFP(+) bud (st.9)
2E-2H
Alsterpaullone (ALP) treatmentMorphological
phenotype
shortening of tentacles (4d)
small and transient ectopic structures along the BC (2d, 4d)
basal disc refined after 4d, apical-like: Wnt3+, Sp5+
3A, 3B, 3D,
S7, S8, S9
Sp5 patternLoss of apical Sp5 (4d)
Sp5 diffuse along BC
Sp5 spots in upper BC (2d)
Sp5 ring above basal disc (2d)
Loss of apical Sp5 (4d)
Sp5 diffuse along BC (2d)
Sp5 diffuse is higher in lower BC (4d)
3A-3C,
S7A,
S8A, S8C
S9A, S9C
Wnt3 patternWnt3 lost at the head tip
Wnt3+ in tentacle roots (2d)
Wnt3+ dots along BC (4d)
High Wnt3 at basal pole (4d)
Wnt3 lost at the head tip
Wnt3+ in tentacle roots (2d)
Wnt3+ dots along BC (4d)
High Wnt3 at basal pole (4d)
3A-3C,
S7, S8, S9
GFP patternLoss of GFP in tentacle ring
GFP(+) spots in upper BC (2d)
GFP(+) ring above basal disc
Loss of GFP in tentacle ring
GFP diffuse along BC + rings
GFP diffuse along lower BC
3A-3C,
S7B, S8B, S8D
S9B, S9D
GFP fluorescenceGFP diffuse along BC (4d)
high GFP in peduncle (7d)
Loss of apical GFP fluo (4d)
GFP fluo in lower half (7d)
3D
β-catenin(RNAi)Morphological phenotypeBud-like structures (GFP-)
Size reduction
Bud-like structures (GFP+)
Size reduction
4A, 4C, 4D, 4E
S11, S12, S13
β-catenin transcriptsApical: β-cat 2x decrease
BC: no change
Apical: β-cat 2x decrease
BC: β-cat 2x decrease
4A, 4B, S10
Sp5 transcripts
Sp5 pattern (HvBasel)
No Sp5 specific responseBC: Sp5 transient decrease4A, 4B, S10
4C, S11
GFP transcriptsApical: GFP ~4x decrease
BC: GFP ~4x decrease
Apical: GFP transient increase
BC: no specific response
4A, 4B, S10
GFP fluorescence
GFP protein
Loss of apical fluorescence
Ectopic patches along BC
Progressive reduction in GFP fluorescence along the lower body column4D, S12
4E, S13
PhenotypeNO MORPHOLOGICAL CHANGENO MORPHOLOGICAL CHANGE4D, S11, S12, S13,
S15, S16
scramble RNAsβ-catenin transcriptsMINOR MODULATIONSApical: steady increase up to 2x
BC: steady increase > 2x
S10 (4A, 4B)
Sp5 transcriptsBC: transiently decreased
BC: transiently decreased ~2x
NO STRONG MODULATION
BC: transiently decreased < -2x
S10 (4A, 4B), S11
S14A, S14B (5A)
GFP transcriptsBC: increased ~2x
BC: decreased ~2x
BC: decreased ~2x
Ap, BC: Limited modulation
S10 (4A, 4B)
S14A, S14B (5A)
GFP fluorescenceNO STRONG MODULATIONBC: Progressive decrease along BCS12, S13
Wnt3 transcriptsBC: increase > 2xBC: increase > 2xS14A, S14B (5A)
Sp5(RNAi)PhenotypeNo multiheaded phenotype up to 2d pEP2 in the Hv_AEP2 transgenic animals5B,5C,5E, S15-S17
Sp5 transcriptsBC: increase ~ 2x 1d pEP2BC: increase < 2x pEP25A, S14
Wnt3 transcriptsBC: transient increase 16h pEP2BC: transient moderate increase 1d pEP2 5A, S14
GFP transcripts Apical: transient increase 2x – 4x;
BC: transient increase > 4x
No significant modulation5A, 5D, S14
GFP pattern
GFP fluorescence
BC: Extended areas of GFP/GFP overexpression along the BCEctopic GFP/GFP spots 2d pEP2 in lower BC and in tentacles5B, 5C, 5E,
S15, S16, S17
β-cateninBC: increased ~1.5x 2d pEP2BC: increased ~1.5x 2d pEP25D

References

  1. Galliot, B. The Hydra Model System. Int. J. Dev. Biol. 2012, 56, 407–409. [Google Scholar] [CrossRef]
  2. Browne, E.N. The Production of New Hydranths in Hydra by the Insertion of Small Grafts. J. Exp. Zool. 1909, 7, 1–37. [Google Scholar] [CrossRef]
  3. Spemann, H.; Mangold, H. Über Die Induktion von Embryonalanlagen Durch Implantation Artfremder Organisatoren. Wilhem Roux Arch. Entw. Mech. 1924, 100, 599–638. [Google Scholar]
  4. Yao, T. Studies on the Organizer Problem in Pelmatohydra Oligactis. I. The Induction Potency of the Implants and the Nature of the Induced Hydranth. J. Exp. Biol. 1945, 21, 145–150. [Google Scholar] [CrossRef]
  5. MacWilliams, H.K. Hydra Transplantation Phenomena and the Mechanism of Hydra Head Regeneration. II. Properties of the Head Activation. Dev. Biol. 1983, 96, 239–257. [Google Scholar] [CrossRef] [PubMed]
  6. Broun, M.; Bode, H.R. Characterization of the Head Organizer in Hydra. Development 2002, 129, 875–884. [Google Scholar] [CrossRef] [PubMed]
  7. Shimizu, H. Transplantation Analysis of Developmental Mechanisms in Hydra. Int. J. Dev. Biol. 2012, 56, 463–472. [Google Scholar] [CrossRef] [PubMed]
  8. Vogg, M.C.; Wenger, Y.; Galliot, B. How Somatic Adult Tissues Develop Organizer Activity. Curr. Top. Dev. Biol. 2016, 96, 391–414. [Google Scholar] [CrossRef] [PubMed]
  9. Vogg, M.C.; Galliot, B.; Tsiairis, C.D. Model Systems for Regeneration: Hydra. Development 2019, 146, dev177212. [Google Scholar] [CrossRef]
  10. De Robertis, E.M.; Wessely, O.; Oelgeschlager, M.; Brizuela, B.; Pera, E.; Larrain, J.; Abreu, J.; Bachiller, D. Molecular Mechanisms of Cell-Cell Signaling by the Spemann-Mangold Organizer. Int. J. Dev. Biol. 2001, 45, 189–197. [Google Scholar]
  11. Tickle, C.; Summerbell, D.; Wolpert, L. Positional Signalling and Specification of Digits in Chick Limb Morphogenesis. Nature 1975, 254, 199–202. [Google Scholar] [CrossRef] [PubMed]
  12. Alvarado-Mallart, R.-M.; Martinez, S.; Lance-Jones, C.C. Pluripotentiality of the 2-Day-Old Avian Germinative Neuroepithelium. Dev. Biol. 1990, 139, 75–88. [Google Scholar] [CrossRef]
  13. Nakamura, H. Do CNS Anlagen Have Plasticity in Differentiation? Analysis in Quail-Chick Chimera. Brain Res. 1990, 511, 122–128. [Google Scholar] [CrossRef] [PubMed]
  14. Joubin, K.; Stern, C.D. Formation and Maintenance of the Organizer among the Vertebrates. Int. J. Dev. Biol. 2001, 45, 165–175. [Google Scholar] [PubMed]
  15. Anderson, C.; Stern, C.D. Organizers in Development. Curr. Top. Dev. Biol. 2016, 117, 435–454. [Google Scholar] [CrossRef] [PubMed]
  16. Nye, H.L.; Cameron, J.A.; Chernoff, E.A.; Stocum, D.L. Regeneration of the Urodele Limb: A Review. Dev. Dyn. 2003, 226, 280–294. [Google Scholar] [CrossRef] [PubMed]
  17. Brockes, J.P.; Kumar, A. Comparative Aspects of Animal Regeneration. Annu. Rev. Cell Dev. Biol. 2008, 24, 525–549. [Google Scholar] [CrossRef] [PubMed]
  18. Kragl, M.; Knapp, D.; Nacu, E.; Khattak, S.; Maden, M.; Epperlein, H.H.; Tanaka, E.M. Cells Keep a Memory of Their Tissue Origin during Axolotl Limb Regeneration. Nature 2009, 460, 60–65. [Google Scholar] [CrossRef]
  19. Rand, H.W.; Bovard, J.F.; Minnich, D.E. Localization of Formative Agencies in Hydra. Proc. Natl. Acad. Sci. USA 1926, 12, 565–570. [Google Scholar] [CrossRef]
  20. MacWilliams, H.K. Hydra Transplantation Phenomena and the Mechanism of Hydra Head Regeneration. I. Properties of the Head Inhibition. Dev. Biol. 1983, 96, 217–238. [Google Scholar] [CrossRef]
  21. Gierer, A.; Meinhardt, H. A Theory of Biological Pattern Formation. Kybernetik 1972, 12, 30–39. [Google Scholar] [CrossRef]
  22. Hobmayer, B.; Rentzsch, F.; Kuhn, K.; Happel, C.M.; von Laue, C.C.; Snyder, P.; Rothbächer, U.; Holstein, T.W. WNT Signalling Molecules Act in Axis Formation in the Diploblastic Metazoan Hydra. Nature 2000, 407, 186–189. [Google Scholar] [CrossRef]
  23. Broun, M.; Gee, L.; Reinhardt, B.; Bode, H.R. Formation of the Head Organizer in Hydra Involves the Canonical Wnt Pathway. Development 2005, 132, 2907–2916. [Google Scholar] [CrossRef]
  24. Chera, S.; Ghila, L.; Dobretz, K.; Wenger, Y.; Bauer, C.; Buzgariu, W.; Martinou, J.-C.; Galliot, B. Apoptotic Cells Provide an Unexpected Source of Wnt3 Signaling to Drive Hydra Head Regeneration. Dev. Cell 2009, 17, 279–289. [Google Scholar] [CrossRef]
  25. Lengfeld, T.; Watanabe, H.; Simakov, O.; Lindgens, D.; Gee, L.; Law, L.; Schmidt, H.A.; Ozbek, S.; Bode, H.; Holstein, T.W. Multiple Wnts Are Involved in Hydra Organizer Formation and Regeneration. Dev. Biol. 2009, 330, 186–199. [Google Scholar] [CrossRef]
  26. Gee, L.; Hartig, J.; Law, L.; Wittlieb, J.; Khalturin, K.; Bosch, T.C.; Bode, H.R. Beta-Catenin Plays a Central Role in Setting up the Head Organizer in Hydra. Dev. Biol. 2010, 340, 116–124. [Google Scholar] [CrossRef]
  27. Nakamura, Y.; Tsiairis, C.D.; Özbek, S.; Holstein, T.W. Autoregulatory and Repressive Inputs Localize Hydra Wnt3 to the Head Organizer. Proc. Natl. Acad. Sci. USA 2011, 108, 9137–9142. [Google Scholar] [CrossRef]
  28. Weidinger, G.; Thorpe, C.J.; Wuennenberg-Stapleton, K.; Ngai, J.; Moon, R.T. The Sp1-Related Transcription Factors Sp5 and Sp5-like Act Downstream of Wnt/Beta-Catenin Signaling in Mesoderm and Neuroectoderm Patterning. Curr. Biol. 2005, 15, 489–500. [Google Scholar] [CrossRef]
  29. Thorpe, C.J.; Weidinger, G.; Moon, R.T. Wnt/Beta-Catenin Regulation of the Sp1-Related Transcription Factor Sp5l Promotes Tail Development in Zebrafish. Development 2005, 132, 1763–1772. [Google Scholar] [CrossRef]
  30. Fujimura, N.; Vacik, T.; Machon, O.; Vlcek, C.; Scalabrin, S.; Speth, M.; Diep, D.; Krauss, S.; Kozmik, Z. Wnt-Mediated down-Regulation of Sp1 Target Genes by a Transcriptional Repressor Sp5. J. Biol. Chem. 2007, 282, 1225–1237. [Google Scholar] [CrossRef]
  31. Park, D.-S.; Seo, J.-H.; Hong, M.; Bang, W.; Han, J.-K.; Choi, S.-C. Role of Sp5 as an Essential Early Regulator of Neural Crest Specification in Xenopus. Dev. Dyn. 2013, 242, 1382–1394. [Google Scholar] [CrossRef]
  32. Kennedy, M.W.; Chalamalasetty, R.B.; Thomas, S.; Garriock, R.J.; Jailwala, P.; Yamaguchi, T.P. Sp5 and Sp8 Recruit β-Catenin and Tcf1-Lef1 to Select Enhancers to Activate Wnt Target Gene Transcription. Proc. Natl. Acad. Sci. USA 2016, 113, 3545–3550. [Google Scholar] [CrossRef]
  33. Vogg, M.C.; Beccari, L.; Iglesias Ollé, L.; Rampon, C.; Vriz, S.; Perruchoud, C.; Wenger, Y.; Galliot, B. An Evolutionarily-Conserved Wnt3/β-Catenin/Sp5 Feedback Loop Restricts Head Organizer Activity in Hydra. Nat. Commun. 2019, 10, 312. [Google Scholar] [CrossRef]
  34. Vogg, M.C.; Ferenc, J.; Buzgariu, W.C.; Perruchoud, C.; Sanchez, P.G.L.; Beccari, L.; Nuninger, C.; Le Cras, Y.; Delucinge-Vivier, C.; Papasaikas, P.; et al. The Transcription Factor Zic4 Promotes Tentacle Formation and Prevents Epithelial Transdifferentiation in Hydra. Sci. Adv. 2022, 8, eabo0694. [Google Scholar] [CrossRef]
  35. Siebert, S.; Farrell, J.A.; Cazet, J.F.; Abeykoon, Y.; Primack, A.S.; Schnitzler, C.E.; Juliano, C.E. Stem Cell Differentiation Trajectories in Hydra Resolved at Single-Cell Resolution. Science 2019, 365, eaav9314. [Google Scholar] [CrossRef]
  36. Schenkelaars, Q.; Perez-Cortes, D.; Perruchoud, C.; Galliot, B. The Polymorphism of Hydra Microsatellite Sequences Provides Strain-Specific Signatures. PLoS ONE 2020, 15, e0230547. [Google Scholar] [CrossRef]
  37. Wenger, Y.; Buzgariu, W.; Perruchoud, C.; Loichot, G.; Galliot, B. Generic and Context-Dependent Gene Modulations during Hydra Whole Body Regeneration. BioRxiv 2019, 587147. [Google Scholar] [CrossRef]
  38. Madeira, F.; Pearce, M.; Tivey, A.R.N.; Basutkar, P.; Lee, J.; Edbali, O.; Madhusoodanan, N.; Kolesnikov, A.; Lopez, R. Search and Sequence Analysis Tools Services from EMBL-EBI in 2022. Nucleic Acids Res. 2022, 50, W276–W279. [Google Scholar] [CrossRef]
  39. Wittlieb, J.; Khalturin, K.; Lohmann, J.U.; Anton-Erxleben, F.; Bosch, T.C. Transgenic Hydra Allow in Vivo Tracking of Individual Stem Cells during Morphogenesis. Proc. Natl. Acad. Sci. USA 2006, 103, 6208–6211. [Google Scholar] [CrossRef]
  40. Pfaffl, M.W. A New Mathematical Model for Relative Quantification in Real-Time RT-PCR. Nucleic Acids Res. 2001, 29, e45. [Google Scholar] [CrossRef]
  41. Galliot, B.; Welschof, M.; Schuckert, O.; Hoffmeister, S.; Schaller, H.C. The cAMP Response Element Binding Protein Is Involved in Hydra Regeneration. Development 1995, 121, 1205–1216. [Google Scholar] [CrossRef]
  42. Suknovic, N.; Tomczyk, S.; Colevret, D.; Perruchoud, C.; Galliot, B. The ULK1 Kinase, a Necessary Component of the pro-Regenerative and Anti-Aging Machinery in Hydra. Mech. Ageing Dev. 2021, 194, 111414. [Google Scholar] [CrossRef]
  43. Corish, P.; Tyler-Smith, C. Attenuation of Green Fluorescent Protein Half-Life in Mammalian Cells. Protein Eng. 1999, 12, 1035–1040. [Google Scholar] [CrossRef]
  44. Harrison, S.M.; Houzelstein, D.; Dunwoodie, S.L.; Beddington, R.S. Sp5, a New Member of the Sp1 Family, Is Dynamically Expressed during Development and Genetically Interacts with Brachyury. Dev. Biol. 2000, 227, 358–372. [Google Scholar] [CrossRef]
  45. Hatayama, M.; Aruga, J. Role of Zic Family Proteins in Transcriptional Regulation and Chromatin Remodeling. In Zic Family; Aruga, J., Ed.; Advances in Experimental Medicine and Biology; Springer: Singapore, 2018; Volume 1046, pp. 353–380. ISBN 978-981-10-7310-6. [Google Scholar]
  46. Aruga, J.; Yokota, N.; Hashimoto, M.; Furuichi, T.; Fukuda, M.; Mikoshiba, K. A Novel Zinc Finger Protein, Zic, Is Involved in Neurogenesis, Especially in the Cell Lineage of Cerebellar Granule Cells. J. Neurochem. 1994, 63, 1880–1890. [Google Scholar] [CrossRef]
  47. Ishiguro, A.; Inoue, T.; Mikoshiba, K.; Aruga, J. Molecular Properties of Zic4 and Zic5 Proteins: Functional Diversity within Zic Family. Biochem. Biophys. Res. Commun. 2004, 324, 302–307. [Google Scholar] [CrossRef]
  48. Okumura, K.; Hosoe, Y.; Nakajima, N. Zic1 Is a Transcriptional Repressor Through the Lamin A/C Promoter and Has an Intrinsic Repressive Domain. J. Health Sci. 2004, 50, 423–427. [Google Scholar] [CrossRef]
  49. Ebert, P.J.; Timmer, J.R.; Nakada, Y.; Helms, A.W.; Parab, P.B.; Liu, Y.; Hunsaker, T.L.; Johnson, J.E. Zic1 Represses Math1 Expression via Interactions with the Math1 Enhancer and Modulation of Math1 Autoregulation. Development 2003, 130, 1949–1959. [Google Scholar] [CrossRef]
  50. Salero, E.; Pérez-Sen, R.; Aruga, J.; Giménez, C.; Zafra, F. Transcription Factors Zic1 and Zic2 Bind and Transactivate the Apolipoprotein E Gene Promoter. J. Biol. Chem. 2001, 276, 1881–1888. [Google Scholar] [CrossRef]
  51. Yang, Y.; Hwang, C.K.; Junn, E.; Lee, G.; Mouradian, M.M. ZIC2 and Sp3 Repress Sp1-Induced Activation of the HumanD Dopamine Receptor Gene. J. Biol. Chem. 2000, 275, 38863–38869. [Google Scholar] [CrossRef]
  52. Sakurada, T.; Mima, K.; Kurisaki, A.; Sugino, H.; Yamauchi, T. Neuronal Cell Type-Specific Promoter of the α CaM Kinase II Gene Is Activated by Zic2, a Zic Family Zinc Finger Protein. Neurosci. Res. 2005, 53, 323–330. [Google Scholar] [CrossRef]
  53. Sanchez-Ferras, O.; Bernas, G.; Laberge-Perrault, E.; Pilon, N. Induction and Dorsal Restriction of Paired-Box 3 (Pax3) Gene Expression in the Caudal Neuroectoderm Is Mediated by Integration of Multiple Pathways on a Short Neural Crest Enhancer. BBA Gene Reg. Mec. 2014, 1839, 546–558. [Google Scholar] [CrossRef]
  54. Zhu, P.; Wang, Y.; He, L.; Huang, G.; Du, Y.; Zhang, G.; Yan, X.; Xia, P.; Ye, B.; Wang, S.; et al. ZIC2-Dependent OCT4 Activation Drives Self-Renewal of Human Liver Cancer Stem Cells. J. Clin. Investig. 2015, 125, 3795–3808. [Google Scholar] [CrossRef]
  55. Zhu, L.; Harutyunyan, K.G.; Peng, J.L.; Wang, J.; Schwartz, R.J.; Belmont, J.W. Identification of a Novel Role of ZIC3 in Regulating Cardiac Development. Hum. Mol. Genet. 2007, 16, 1649–1660. [Google Scholar] [CrossRef]
  56. Lim, L.S.; Hong, F.H.; Kunarso, G.; Stanton, L.W. The Pluripotency Regulator Zic3 Is a Direct Activator of the Nanog Promoter in ESCs. Stem Cells 2010, 28, 1961–1969. [Google Scholar] [CrossRef]
  57. Satow, R.; Nakamura, T.; Kato, C.; Endo, M.; Tamura, M.; Batori, R.; Tomura, S.; Murayama, Y.; Fukami, K. ZIC5 Drives Melanoma Aggressiveness by PDGFD-Mediated Activation of FAK and STAT3. Cancer Res. 2017, 77, 366–377. [Google Scholar] [CrossRef]
  58. Yagi, K.; Satou, Y.; Satoh, N. A Zinc Finger Transcription Factor, ZicL, Is a Direct Activator of Brachyury in the Notochord Specification of Ciona intestinalis. Development 2004, 131, 1279–1288. [Google Scholar] [CrossRef]
  59. Yagi, K.; Satoh, N.; Satou, Y. Identification of Downstream Genes of the Ascidian Muscle Determinant Gene Ci-Macho1. Dev. Biol. 2004, 274, 478–489. [Google Scholar] [CrossRef]
  60. Sawada, K.; Fukushima, Y.; Nishida, H. Macho-1 Functions as Transcriptional Activator for Muscle Formation in Embryos of the Ascidian Halocynthia Roretzi. Gene Expr. Patterns 2005, 5, 429–437. [Google Scholar] [CrossRef]
  61. Korinek, V.; Barker, N.; Morin, P.J.; Van Wichen, D.; De Weger, R.; Kinzler, K.W.; Vogelstein, B.; Clevers, H. Constitutive Transcriptional Activation by a β-Catenin-Tcf Complex in APC−/− Colon Carcinoma. Science 1997, 275, 1784–1787. [Google Scholar] [CrossRef] [PubMed]
  62. Huggins, I.J.; Bos, T.; Gaylord, O.; Jessen, C.; Lonquich, B.; Puranen, A.; Richter, J.; Rossdam, C.; Brafman, D.; Gaasterland, T.; et al. The WNT Target SP5 Negatively Regulates WNT Transcriptional Programs in Human Pluripotent Stem Cells. Nat. Commun. 2017, 8, 1034. [Google Scholar] [CrossRef]
  63. Takano, J.; Sugiyama, T. Genetic Analysis of Developmental Mechanisms in Hydra. VIII. Head-Activation and Head-Inhibition Potentials of a Slow-Budding Strain (L4). J. Embryol. Exp. Morphol. 1983, 78, 141–168. [Google Scholar] [CrossRef]
  64. Achermann, J.; Sugiyama, T. Genetic Analysis of Developmental Mechanisms in Hydra. X. Morphogenetic Potentials of a Regeneration-Deficient Strain (Reg-16). Dev. Biol. 1985, 107, 13–27. [Google Scholar] [CrossRef]
  65. Takano, J.; Sugiyama, T. Genetic Analysis of Developmental Mechanisms in Hydra. XII. Analysis of Chimaeric Hydra Produced from a Normal and a Slow-Budding Strain (L4). J. Embryol. Exp. Morphol. 1984, 80, 155–173. [Google Scholar]
  66. Technau, U.; Bode, H.R. HyBra1, a Brachyury Homologue, Acts during Head Formation in Hydra. Development 1999, 126, 999–1010. [Google Scholar] [CrossRef]
  67. Schwaiger, M.; Andrikou, C.; Dnyansagar, R.; Murguia, P.F.; Paganos, P.; Voronov, D.; Zimmermann, B.; Lebedeva, T.; Schmidt, H.A.; Genikhovich, G.; et al. An Ancestral Wnt–Brachyury Feedback Loop in Axial Patterning and Recruitment of Mesoderm-Determining Target Genes. Nat. Ecol. Evol. 2022, 6, 1921–1939. [Google Scholar] [CrossRef]
  68. Kaloulis, K.; Chera, S.; Hassel, M.; Gauchat, D.; Galliot, B. Reactivation of Developmental Programs: The cAMP-Response Element-Binding Protein Pathway Is Involved in Hydra Head Regeneration. Proc. Natl. Acad. Sci. USA 2004, 101, 2363–2368. [Google Scholar] [CrossRef]
  69. Chera, S.; Ghila, L.; Wenger, Y.; Galliot, B. Injury-Induced Activation of the MAPK/CREB Pathway Triggers Apoptosis-Induced Compensatory Proliferation in Hydra Head Regeneration: MAPK-Dependent Injury-Induced Apoptosis in Hydra. Dev. Growth Differ. 2011, 53, 186–201. [Google Scholar] [CrossRef]
  70. Tursch, A.; Bartsch, N.; Mercker, M.; Schlüter, J.; Lommel, M.; Marciniak-Czochra, A.; Özbek, S.; Holstein, T.W. Injury-Induced MAPK Activation Triggers Body Axis Formation in Hydra by Default Wnt Signaling. Proc. Natl. Acad. Sci. USA 2022, 119, e2204122119. [Google Scholar] [CrossRef] [PubMed]
  71. Guder, C.; Pinho, S.; Nacak, T.G.; Schmidt, H.A.; Hobmayer, B.; Niehrs, C.; Holstein, T.W. An Ancient Wnt-Dickkopf Antagonism in Hydra. Development 2006, 133, 901–911. [Google Scholar] [CrossRef] [PubMed]
  72. Augustin, R.; Franke, A.; Khalturin, K.; Kiko, R.; Siebert, S.; Hemmrich, G.; Bosch, T.C. Dickkopf Related Genes Are Components of the Positional Value Gradient in Hydra. Dev. Biol. 2006, 296, 62–70. [Google Scholar] [CrossRef]
  73. Lommel, M.; Strompen, J.; Hellewell, A.L.; Balasubramanian, G.P.; Christofidou, E.D.; Thomson, A.R.; Boyle, A.L.; Woolfson, D.N.; Puglisi, K.; Hartl, M.; et al. Hydra Mesoglea Proteome Identifies Thrombospondin as a Conserved Component Active in Head Organizer Restriction. Sci. Rep. 2018, 8, 11753. [Google Scholar] [CrossRef]
  74. Ziegler, B.; Yiallouros, I.; Trageser, B.; Kumar, S.; Mercker, M.; Kling, S.; Fath, M.; Warnken, U.; Schnölzer, M.; Holstein, T.W.; et al. The Wnt-Specific Astacin Proteinase HAS-7 Restricts Head Organizer Formation in Hydra. BMC Biol. 2021, 19, 120. [Google Scholar] [CrossRef]
  75. Smith, K.M.; Gee, L.; Bode, H.R. HyAlx, an Aristaless-Related Gene, Is Involved in Tentacle Formation in Hydra. Development 2000, 127, 4743–4752. [Google Scholar] [CrossRef]
  76. Munder, S.; Tischer, S.; Grundhuber, M.; Buchels, N.; Bruckmeier, N.; Eckert, S.; Seefeldt, C.A.; Prexl, A.; Kasbauer, T.; Bottger, A. Notch-Signalling Is Required for Head Regeneration and Tentacle Patterning in Hydra. Dev. Biol. 2013, 383, 146–157. [Google Scholar] [CrossRef]
  77. Pan, Q.; Mercker, M.; Klimovich, A.; Wittlieb, J.; Marciniak-Czochra, A.; Böttger, A. Genetic Interference with HvNotch Provides New Insights into the Role of the Notch-Signalling Pathway for Developmental Pattern Formation in Hydra. Sci. Rep. 2024, 14, 8553. [Google Scholar] [CrossRef]
  78. Melotti, A.; Mas, C.; Kuciak, M.; Lorente-Trigos, A.; Borges, I.; Ruiz I Altaba, A. The River Blindness Drug Ivermectin and Related Macrocyclic Lactones Inhibit WNT-TCF Pathway Responses in Human Cancer. EMBO Mol. Med. 2014, 6, 1263–1278. [Google Scholar] [CrossRef]
  79. Molenaar, M.; van de Wetering, M.; Oosterwegel, M.; Peterson-Maduro, J.; Godsave, S.; Korinek, V.; Roose, J.; Destrée, O.; Clevers, H. XTcf-3 Transcription Factor Mediates β-catenin-Induced Axis Formation in Xenopus Embryos. Cell 1996, 86, 391–399. [Google Scholar] [CrossRef]
  80. Ma, G.; Yasunaga, J.; Fan, J.; Yanagawa, S.; Matsuoka, M. HTLV-1 bZIP Factor Dysregulates the Wnt Pathways to Support Proliferation and Migration of Adult T-cell Leukemia Cells. Oncogene 2013, 32, 4222–4230. [Google Scholar] [CrossRef]
Figure 2. GFP regulation in regenerating and budding HySp5-3169:GFP transgenic animals. (A,B) GFP expression in regenerating halves from epidermal (A) and gastrodermal (B) HySp5-3169:GFP transgenic animals bisected at t0 and fixed at indicated times. Regen.: regeneration; hpa: hours post-amputation; red arrows point to apical-regenerating (AR) regions, red triangles to the basal-regenerating (BR) regions, vertical bars indicate gastrodermal GFP expression along the body column, asterisks the original basal discs, white arrows outlined red to the regenerated heads, white triangles outlined red to the regenerated basal discs. See Figure S5. (C,D) GFP (green) and mCherry (red) fluorescence in AR and BR halves of HySp5-3169:GFP transgenic animals pictured live at indicated time points. White arrows point to apical regions of original polyps, red arrows to AR regions, white arrows outlined red to regenerated heads; white arrowheads to original mature basal discs, red arrowheads to the BR regions. See Figure S6. (EH) Live imaging of budding HySp5-3961:GFP transgenic animals, either epidermal (E) or gastrodermal (F), pictured at indicated stages with the Olympus SZX10 microscope ((E,G), GFP fluorescence only) or the Zeiss LSM780 microscope ((F,H), GFP and mCherry fluorescence). On the parental polyp, yellow arrowheads point to the “budding belt” that forms in the budding zone; on the developing buds, red arrows point to the developing apical region, red arrowheads to the differentiating basal region and white arrowheads outlined red to fully differentiated basal discs. Scale bar: 250 µm.
Biomedicines 12 01274 g002
Figure 3. Alsterpaullone-induced modulations of GFP, Wnt3 and Sp5 expression along the epidermis and gastrodermis of HySp5-3169:GFP and HyWnt3-2149:GFP transgenic animals. (A) Schematic representation of the activating effect of ALP on Wnt/β-catenin signaling. (B) Co-detection of GFP (purple) and Wnt3 (red) (left half) or Sp5 (purple) and Wnt3 (red) (right half) in wild-type Hv_AEP animals or in transgenic animals that constitutively express the HySp5-3169:GFP or HyWnt3-2149:GFP constructs, after 2- or 4-day ALP exposure. White arrows: Wnt3 expression at the tip of the hypostome; black arrows: expression immediately below the apical region; black arrowheads: ALP-induced GFP expression in the peduncle zone; blue and grey arrows: ALP-induced circular zones of GFP and Sp5 expression respectively along the body column; yellow arrows: ALP-induced ectopic Wnt3 expression in the apical or basal regions; orange arrows: Wnt3-expressing spots along the body column; vertical black bars: areas of ALP-induced GFP expression along the body column; s.t.: short tentacles; Te: testis. (C) Schematic representation of the ALP-induced modulations of Wnt3 and Sp5 in the epidermal and gastrodermal HySp5-3169:GFP and HyWnt3-2149:GFP transgenic lines. See Figures S7–S9. (D) Live imaging of mCherry and GFP fluorescence in epidermal and gastrodermal HySp5-3169:GFP animals treated for 2, 4 and 7 days with ALP or DMSO. For each condition, GFP fluorescence is shown on the left and the merged GFP (green) and mCherry (red) fluorescence on the right. Vertical white bars indicate areas of ectopic GFP fluorescence. Scale bar: 250 µm.
Biomedicines 12 01274 g003
Figure 4. Impact of β-catenin(RNAi) on Sp5 expression in Hv-Basel and HySp5-3169:GFP transgenic animals. (A) Schematic view of the procedure: After one, two or three electroporations (EP1, EP2 and EP3) with scramble or β-catenin siRNAs, animals were either dissected in apical and body column regions for RNA extraction (grey triangles), or fixed for whole-mount in situ hybridization (ISH, blue triangles) or imaged live (red triangles) at indicated time-points (d pEP: day(s) post-EP). (B) Q-PCR analysis of Sp5, β-catenin and GFP transcript levels in apical (100–80%, left) and body column (80–0%, right) regions of epidermal (left) and gastrodermal (right) HySp5-3169:GFP transgenic animals taken one or two days after EP1 (days 1 and 2), after EP2 (days 3 and 4) or one day after EP3 (day 5). In each panel, the colored line corresponds to the Fold Change (FC) values between β-catenin RNAi animals (continuous grey lines) and control animals exposed to scramble siRNAs (dotted grey lines). Values are each expressed as FC relative to non-electroporated animals at time 0, just before EP1. See Figure S10. (C) Sp5 expression pattern and phenotypic changes in scramble and β-catenin(RNAi) Hv_Basel animals at indicated time-points. Red arrows point to Sp5-expressing patches along the body column, yellow arrows to bud-like structures that express Sp5 and become multiple two days pEP3 without differentiating apical structures. See Figure S11. (D) GFP (green) and mCherry (red) fluorescence in β-catenin(RNAi) HySp5-3169:GFP transgenic live animals. GFP fluorescence in apical regions is either normal (white arrows) or missing (red arrows). Note the transient bud-like structures that develop after β-catenin(RNAi) (red arrowheads) and express GFP in gastrodermal_HySp5-3169:GFP animals (green triangles). See Figure S12. (E) Immunodetection of GFP and mCherry in β-catenin(RNAi) HySp5-3169:GFP animals 6 days post-EP2 (6d pEP2). Apical regions of scramble and β-catenin(RNAi) animals are magnified on the right. White and red arrows as in (D). See Figure S13. Scale bar: 250 µm.
Biomedicines 12 01274 g004
Figure 5. Ectopic GFP/GFP expression in HySp5-3169:GFP animals knocked-down for Sp5. (A) RNAi procedure applied in experiments depicted in panels A-C. At 8 h, 16 h and 24 h post-EP1 (pEP1) and 8 h, 16 h and 24 h post-EP2 (pEP2, red triangles), animals were either fixed for RNA extraction, or imaged live and fixed for whole-mount ISH. Q-PCR analysis of Sp5, β-catenin and GFP transcript levels in apical (100–80%, left) and body column (80–0%, right) regions of epidermal (left) and gastrodermal (right) HySp5-3169:GFP transgenic animals exposed to scramble siRNAs or to Sp5 siRNAs. In each panel, the colored line corresponds to the Fold Change (FC) values between Sp5 RNAi animals (continuous grey lines) and control animals exposed to scramble siRNAs (dotted grey lines), which are each expressed as FC relative to non-electroporated animals at time 0, just before EP1. See Figure S14. (B) GFP expression detected by WM-ISH at indicated time-points after Sp5(RNAi), as depicted in (A). Vertical black bars along the body column and white arrows in the lower body column indicate regions where GFP is up-regulated. See Figure S15. (C) GFP (green) and mCherry (red) fluorescence in Sp5 (RNAi) epidermal (left) or gastrodermal (right) HySp5-3169:GFP animals as depicted in (A). See Figure S16. (D) RNAi procedure applied in experiments depicted in panels D and E. Q-PCR quantification of Sp5, GFP, Wnt3 and β-catenin transcripts in the apical (100–80%), central body column (BC, 80–30%) and basal (30–0%) regions of epidermal (left) and gastrodermal (right) HySp5-3169:GFP animals dissected two days post-EP2 (2d pEP2). ns: non-significant value, other statistical values as indicated in Materials & Methods. (E) GFP (green) and mCherry (red) fluorescence in epidermal (left) or gastrodermal (right) HySp5-3169:GFP animals 2d pEP2. White bars indicate areas of ectopic GFP fluorescence along the body column, white arrows point to spots of ectopic gastrodermal GFP fluorescence in tentacles. See Figure S17. Scale bars correspond to 250 µm, except in (B) where it is 200 µm.
Biomedicines 12 01274 g005
Figure 6. CHIP-qPCR identification of Sp5-binding sites in the Hydra Sp5 promoter. (A) Structure of the Hydra Sp5 protein with the conserved Sp box (green), Buttonhead box (Btd, light purple) and zinc-finger (ZF) domain (light blue); the purple line indicates the 218 AA-long region used to raise the monoclonal anti-Sp5 (mSp5) antibody, the green lines indicated the peptides used to raise the polyclonal anti-Sp5 (pSp5) antibody. (B) Western blot using the mSp5 antibody to detect the TNT-produced HySp5 protein (lanes 1, 2), the HySp5-218 recombinant protein used to raise mSp5 (lane 3), HySp5 expressed in HEK293T cells (lanes 4, 5) or HySp5 present in Hv_AEP2 nuclear extracts prepared from whole animals (lane 6), from apical (100–50%, lane 7) and basal (50–0%, lane 8) halves. (C) Schematic view of the 15 regions (see 15 pairs of primers in Table S2) tested along the 2992 bp-long Sp5 promoter by ChIP-qPCR using Hm105 extracts and the mSp5 antibody. Significant enrichment is noted only in regions PP4 and PP5. (D) Similar ChIP-qPCR enrichment in regions PP4 and PP5 obtained with mSp5 antibody when Hm105 (left) or Hv_AEP2 (right) extracts are used. See Figure S18. (E) Proximal HySp5 promoter sequence (−162 to +29), which contains the transcriptional start sites (TSS) identified in Hv_AEP (TSS1 +1) and Hm105 (TSS2 −149, see Figure S19), five Sp5 binding sites (SP5-BS, light blue), a single TCF binding site (TCF-BS, orange), the PP4 (grey) and PP5 (green) primers used for ChIP-qPCR. In the same region, the PPA (−135 to −67) and PPB (−71 to +2) stretches, underlined with purple (PPA) and pink (PPB) dashed lines, respectively, were used in Electro-Mobility Shift Assay (EMSA). (F) Schematic map of the HySp5 2992 bp promoter region indicating the predicted TSS1, the clustered TCF-BS and Sp5-BS (light purple and orange bars, respectively), the PP1, PP4 and PP5 primer pairs. Sequences of the TCF-BS and Sp5-BS identified in the HySp5 promoter. (G) EMSA showing a shift (arrows) of the PPA and PPB ds-DNAs incubated with Hm105 NEs. Comp.: unlabeled ds-PPA (left) or ds-PPB (right) added as competitor 200 fold in excess during the incubation; mut: mutated.
Biomedicines 12 01274 g006
Figure 7. Functional analysis of the Hydra Sp5, Zic4 and Wnt3 promoters. (AG) Luciferase reporter assays performed in HEK293T cells to measure the Relative Luciferase Activity (RLA) driven by various promoters when Hydra proteins are co-expressed. Each data point represents one biologically independent experiment. (A) RLA levels driven by the HySp5 promoter either when 2992 bp long (HySp5-2992), or when deleted from its proximal region (HySp5-2828) that contains five Sp5-binding sites (Sp5BS), or when one of these 5 Sp5BSs is mutated (HySp5-2992-mBS1, HySp5-2992-mBS2, …). Each construct was tested either in the absence of any protein co-expressed (CMV-empty), or in the presence of co-expressed proteins, full-length Sp5 (HySp5-420) or Sp5 lacking its DNA-Binding Domain (HySp5-ΔDBD). (B) RLA levels driven by the HySp5-2992 promoter when the full-length HyZic4 (HyZic4-431) or the truncated HyZic4 lacking its DNA-Binding Domain (HyZic4-ΔDBD) are co-expressed. (C,D) RLA levels driven by the HyZic4-3505 promoter when full-length or truncated HySp5 (HySp5–420, HySp5-ΔDBD in (C)) or full-length or truncated HyZic4 (HyZic4-431, HyZic4-ΔDBD in (D)) are co-expressed. (E,F) RLA levels driven by the TOPFlash or FOPFLASH reporter constructs that contain 6× TCF-binding sites either consensus or mutated when HyZic4-431 (E,F) or HyZic4-ΔDBD (E) are co-expressed. (G) RLA levels driven by the Wnt3-2142 promoter when HyZic4-431 or HyZic4-ΔDBD are co-expressed. (H) Diagram showing the regulations detected in HEK293T cells on the Hydra Wnt3, Sp5 and Zic4 upstream sequences when the human β-catenin and/or HySp5 and HyZic4 proteins are co-expressed (this work, [33,34]). (I) Immunoprecipitation (IP) of HA-tagged HyZic4-431 expressed in HEK293T cells together or not with huTCF1. IP was performed with an anti-HA antibody and co-IP products were detected with the anti-TCF1 antibody. Same results were obtained in two independent experiments. (J,K) Zic4 (J) and Sp5 (K) transcript levels measured by qPCR in Hv_Basel animals exposed twice to scrambled (scr) RNAs or Zic4, Sp5, β-catenin (b-cat), Wnt5 or Wnt8 siRNAs. Levels are normalized to those measured in control animals exposed to scr RNAs. In all panels, error bars indicate Standard Deviations and statistical p values are as indicated in Materials & Methods (unpaired t-test).
Biomedicines 12 01274 g007
Figure 8. Schematic summary of the layer-specific Sp5 regulation along the Hydra body axis. (A) Dot plot view of Zic4, Wnt3, Sp5, TCF, Wnt5A, Wnt8 and β-catenin expression in cells from the epithelial lineages, either epidermal or gastrodermal, and the interstitial lineage as deduced from Hydra single-cell transcriptome analysis [35]. Along the central body column, single-cell sequencing has identified two populations of epithelial stem cells in the epidermis (SC1 and SC2) and three in the gastrodermis (SC1, SC2 and SC3). See other abbreviations in Figure S1. (B,C) Schematic representation of the predicted genetic regulation network (GRN) at work in the epidermal and gastrodermal layers of the hypostome (B) and tentacle (C) regions in Hydra. (D,E) Schematic view of GFP fluorescence (green), Sp5 expression and predicted GRNs at work in the epidermal (D) and gastrodermal (E) layers of the body column (BC) of HySp5-3169:GFP transgenic animals, either maintained in homeostatic conditions (left) or ALP-treated, or knocked-down for Sp5 or β-catenin (right). Bold letters, black arrows and thick red bars indicate a stronger activity.
Biomedicines 12 01274 g008
Table 1. Zic-binding sites present in chordates’ genes and in the upstream sequences of the Sp5, Wnt3 and Zic4 Hydra genes. CI: Ciona intestinalis (ascidian), HR: Halocynthia roretzi (ascidian), HS: Homo sapiens, HV: Hydra vulgaris, MM: mus musculus.
SpeciesTarget GenesZic TFZIC-Binding Site SequenceReferences
MMGli—consensusZic1–5TGGGTGGTC[46,47]
MMLamin A/CZic1CCACCCCCT[48]
MMMath1Zic1GCTCCCCGGGGAGCT[49]
MMApoE_AZic1/2GGACTGTGGGGGGTGGTCAA[50]
_B AAACTGTGGGGGGTGGTCAA
_C GGACTGTGGGGGGTGAAAAA
_D CTATCCCTGGGGGAGGGGGC
HSD1AZIC2CCCCCAGGGCA[51]
MMCamK IIZic2GTGTGGGC[52]
MMPax3Zic2CTGCTGGGG[53]
MMOct4Zic22550~−2430[54]
HSa-ACTINZIC3GGAGGG[55]
MMNanog-C, Nanog-TZic3CC(C/T)GCTGGG CCTGCTGGG[56]
HSE-CADHERIN (CDH1)ZIC5−283~−71[57]
CIBrachyuryZicLCCAGCTGTG[58]
CIE(SPL)/HAIRY-BMacho15′-GCCCCCCGCTG-3′[59]
HRsyntheticMacho1GACCCCCCA[60]
HVSp5672ZicAACCTGGCCTGC[33,34]
383 GGCAGGTGCCGGCthis work (Figure 7 and Figure S2)
HVWnt3−1781ZicGCCCGCGCTCTCCthis work (Figure 7 and Figure S20A)
1177 GACAGCGGGTG
HVZic4−1863Zic4ATCGCCCCCTCTCGCT[34]
−1825 ACGGGCATTGGCGTGAthis work (Figure 7 and Figure S20B)
−1736 GAGGTGACCCATGCTG
−1291 AGGAAAGGGGTGCTACA
−107
+77
TGCTCCCGT
TACCCCGCTA
Disclaimer/Publisher’s Note: The statements, opinions and data contained in all publications are solely those of the individual author(s) and contributor(s) and not of MDPI and/or the editor(s). MDPI and/or the editor(s) disclaim responsibility for any injury to people or property resulting from any ideas, methods, instructions or products referred to in the content.

