
Mitochondrial Genome-Encoded Long Noncoding RNA Cytochrome B (LncCytB) and Mitochondrial Ribonucleases in Diabetic Retinopathy

Abstract
:1. Introduction
2. Methods
3. Results
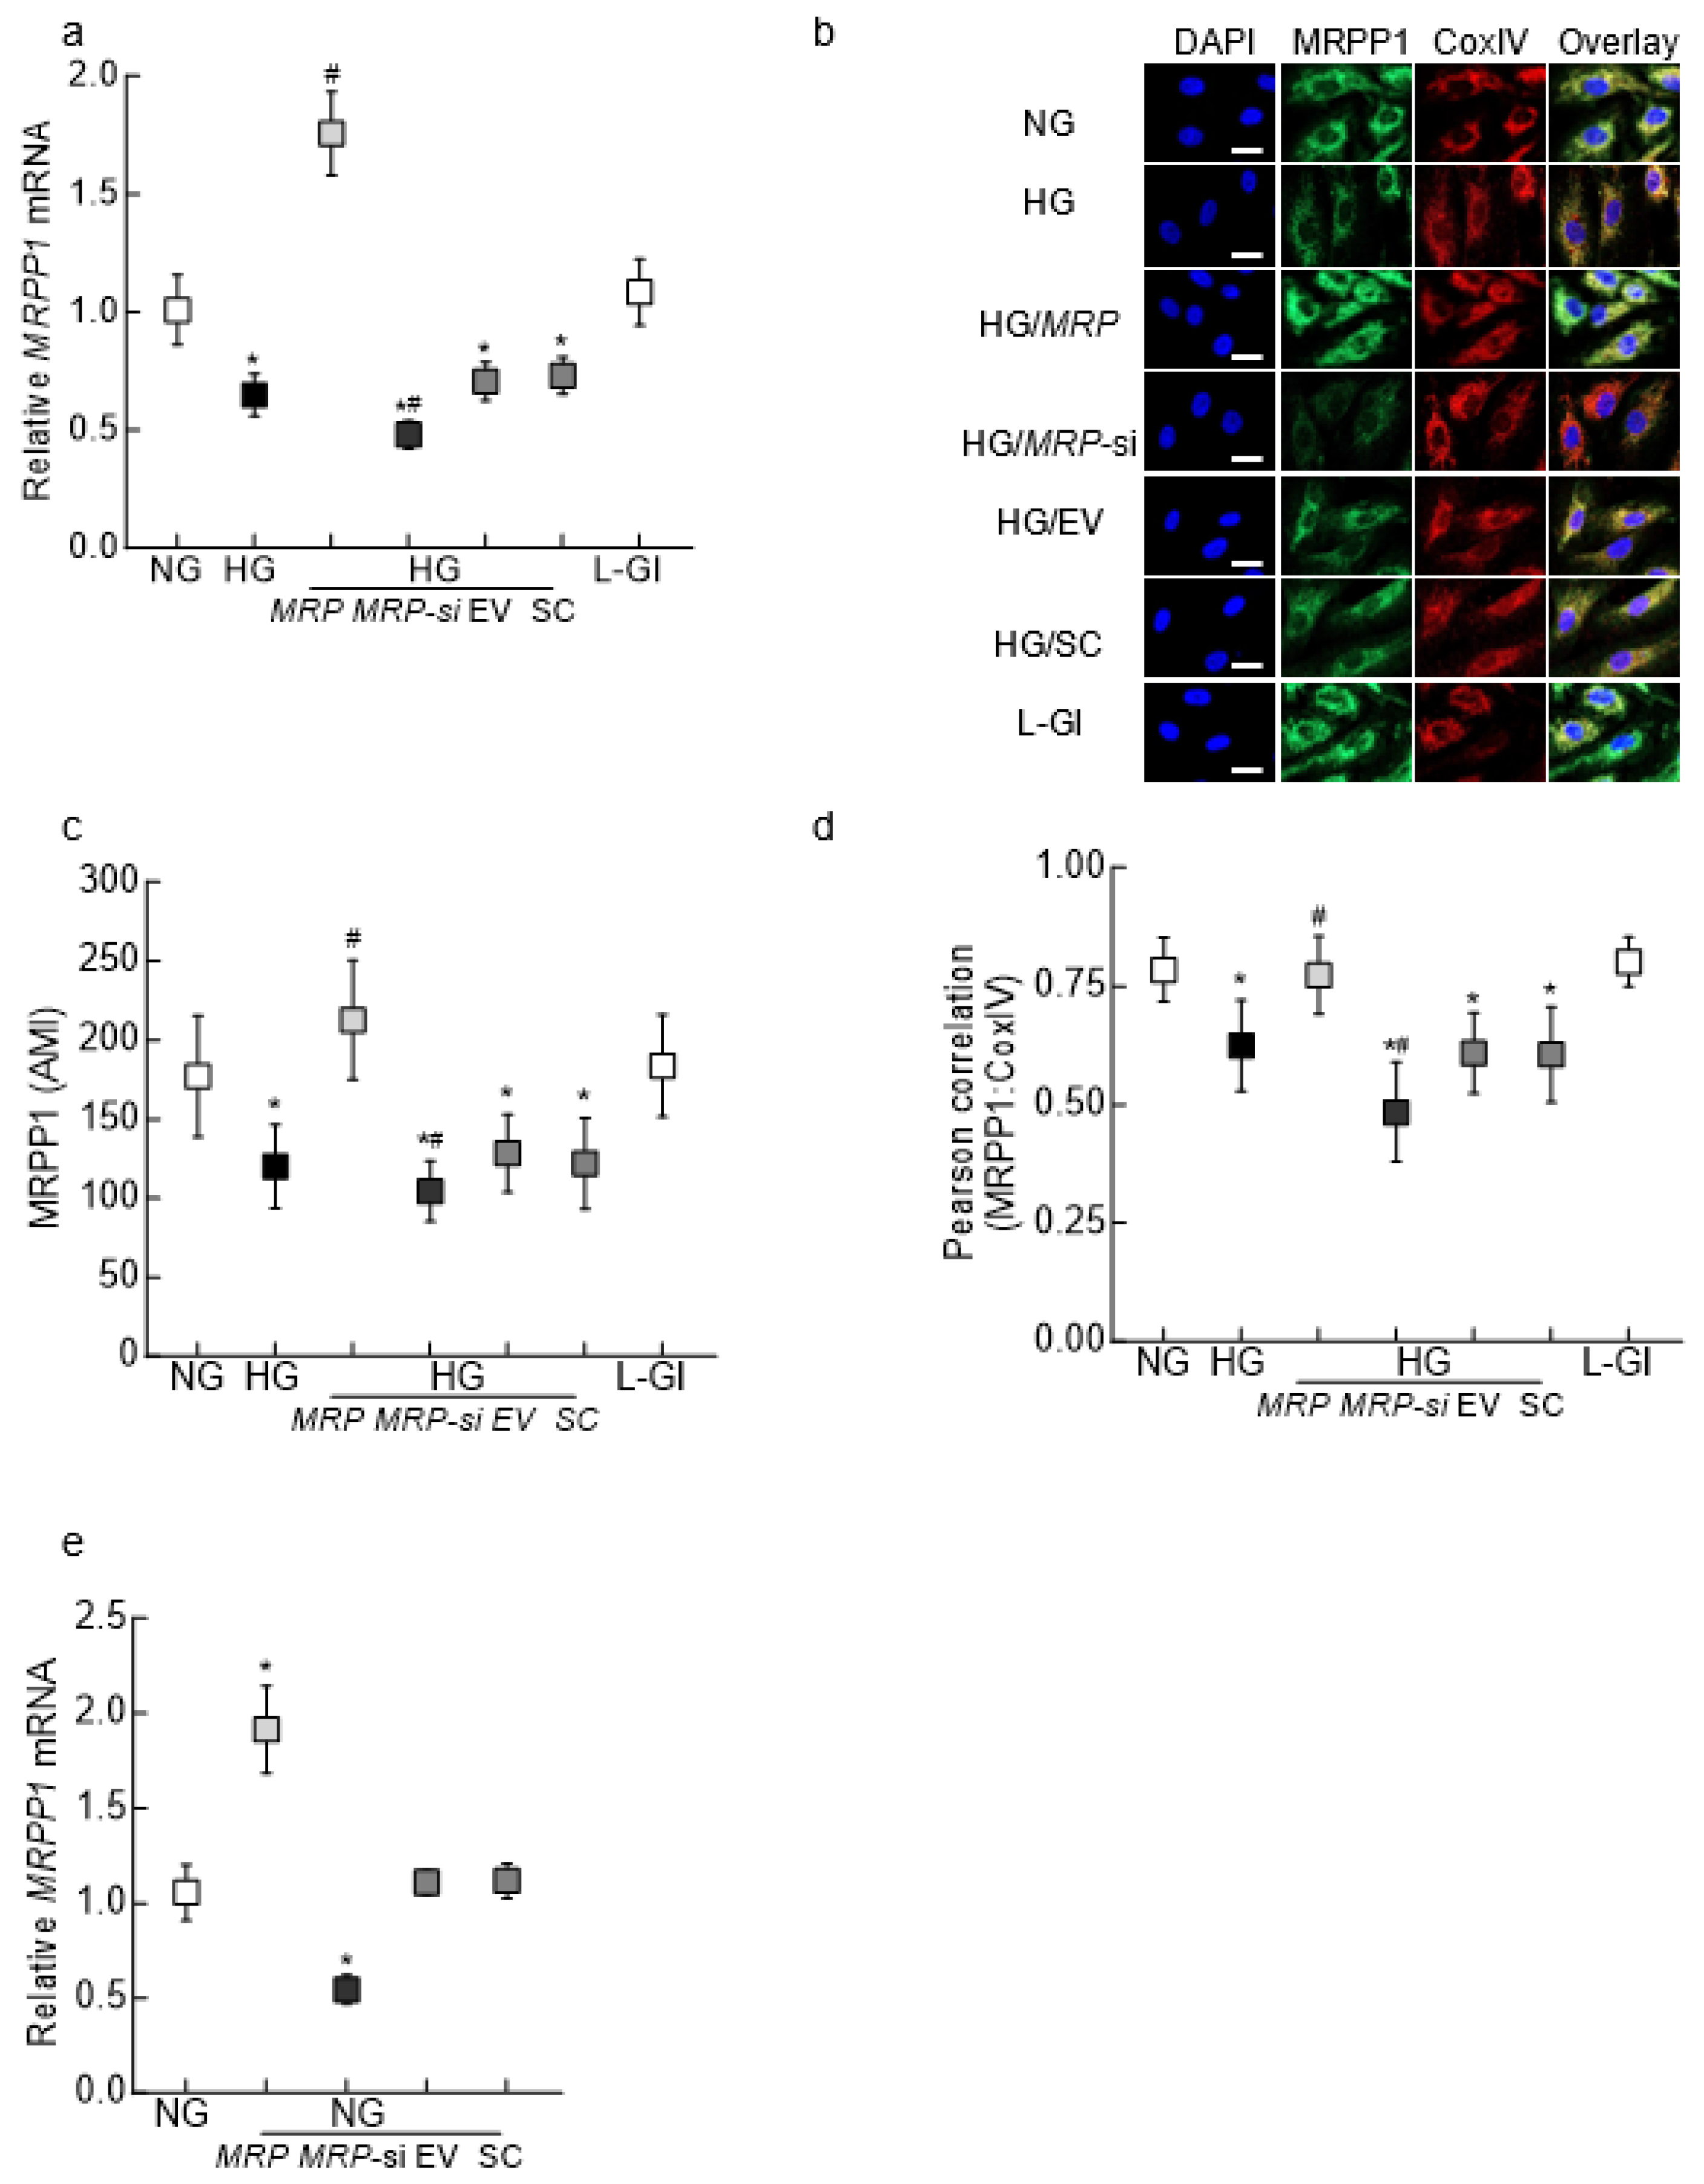
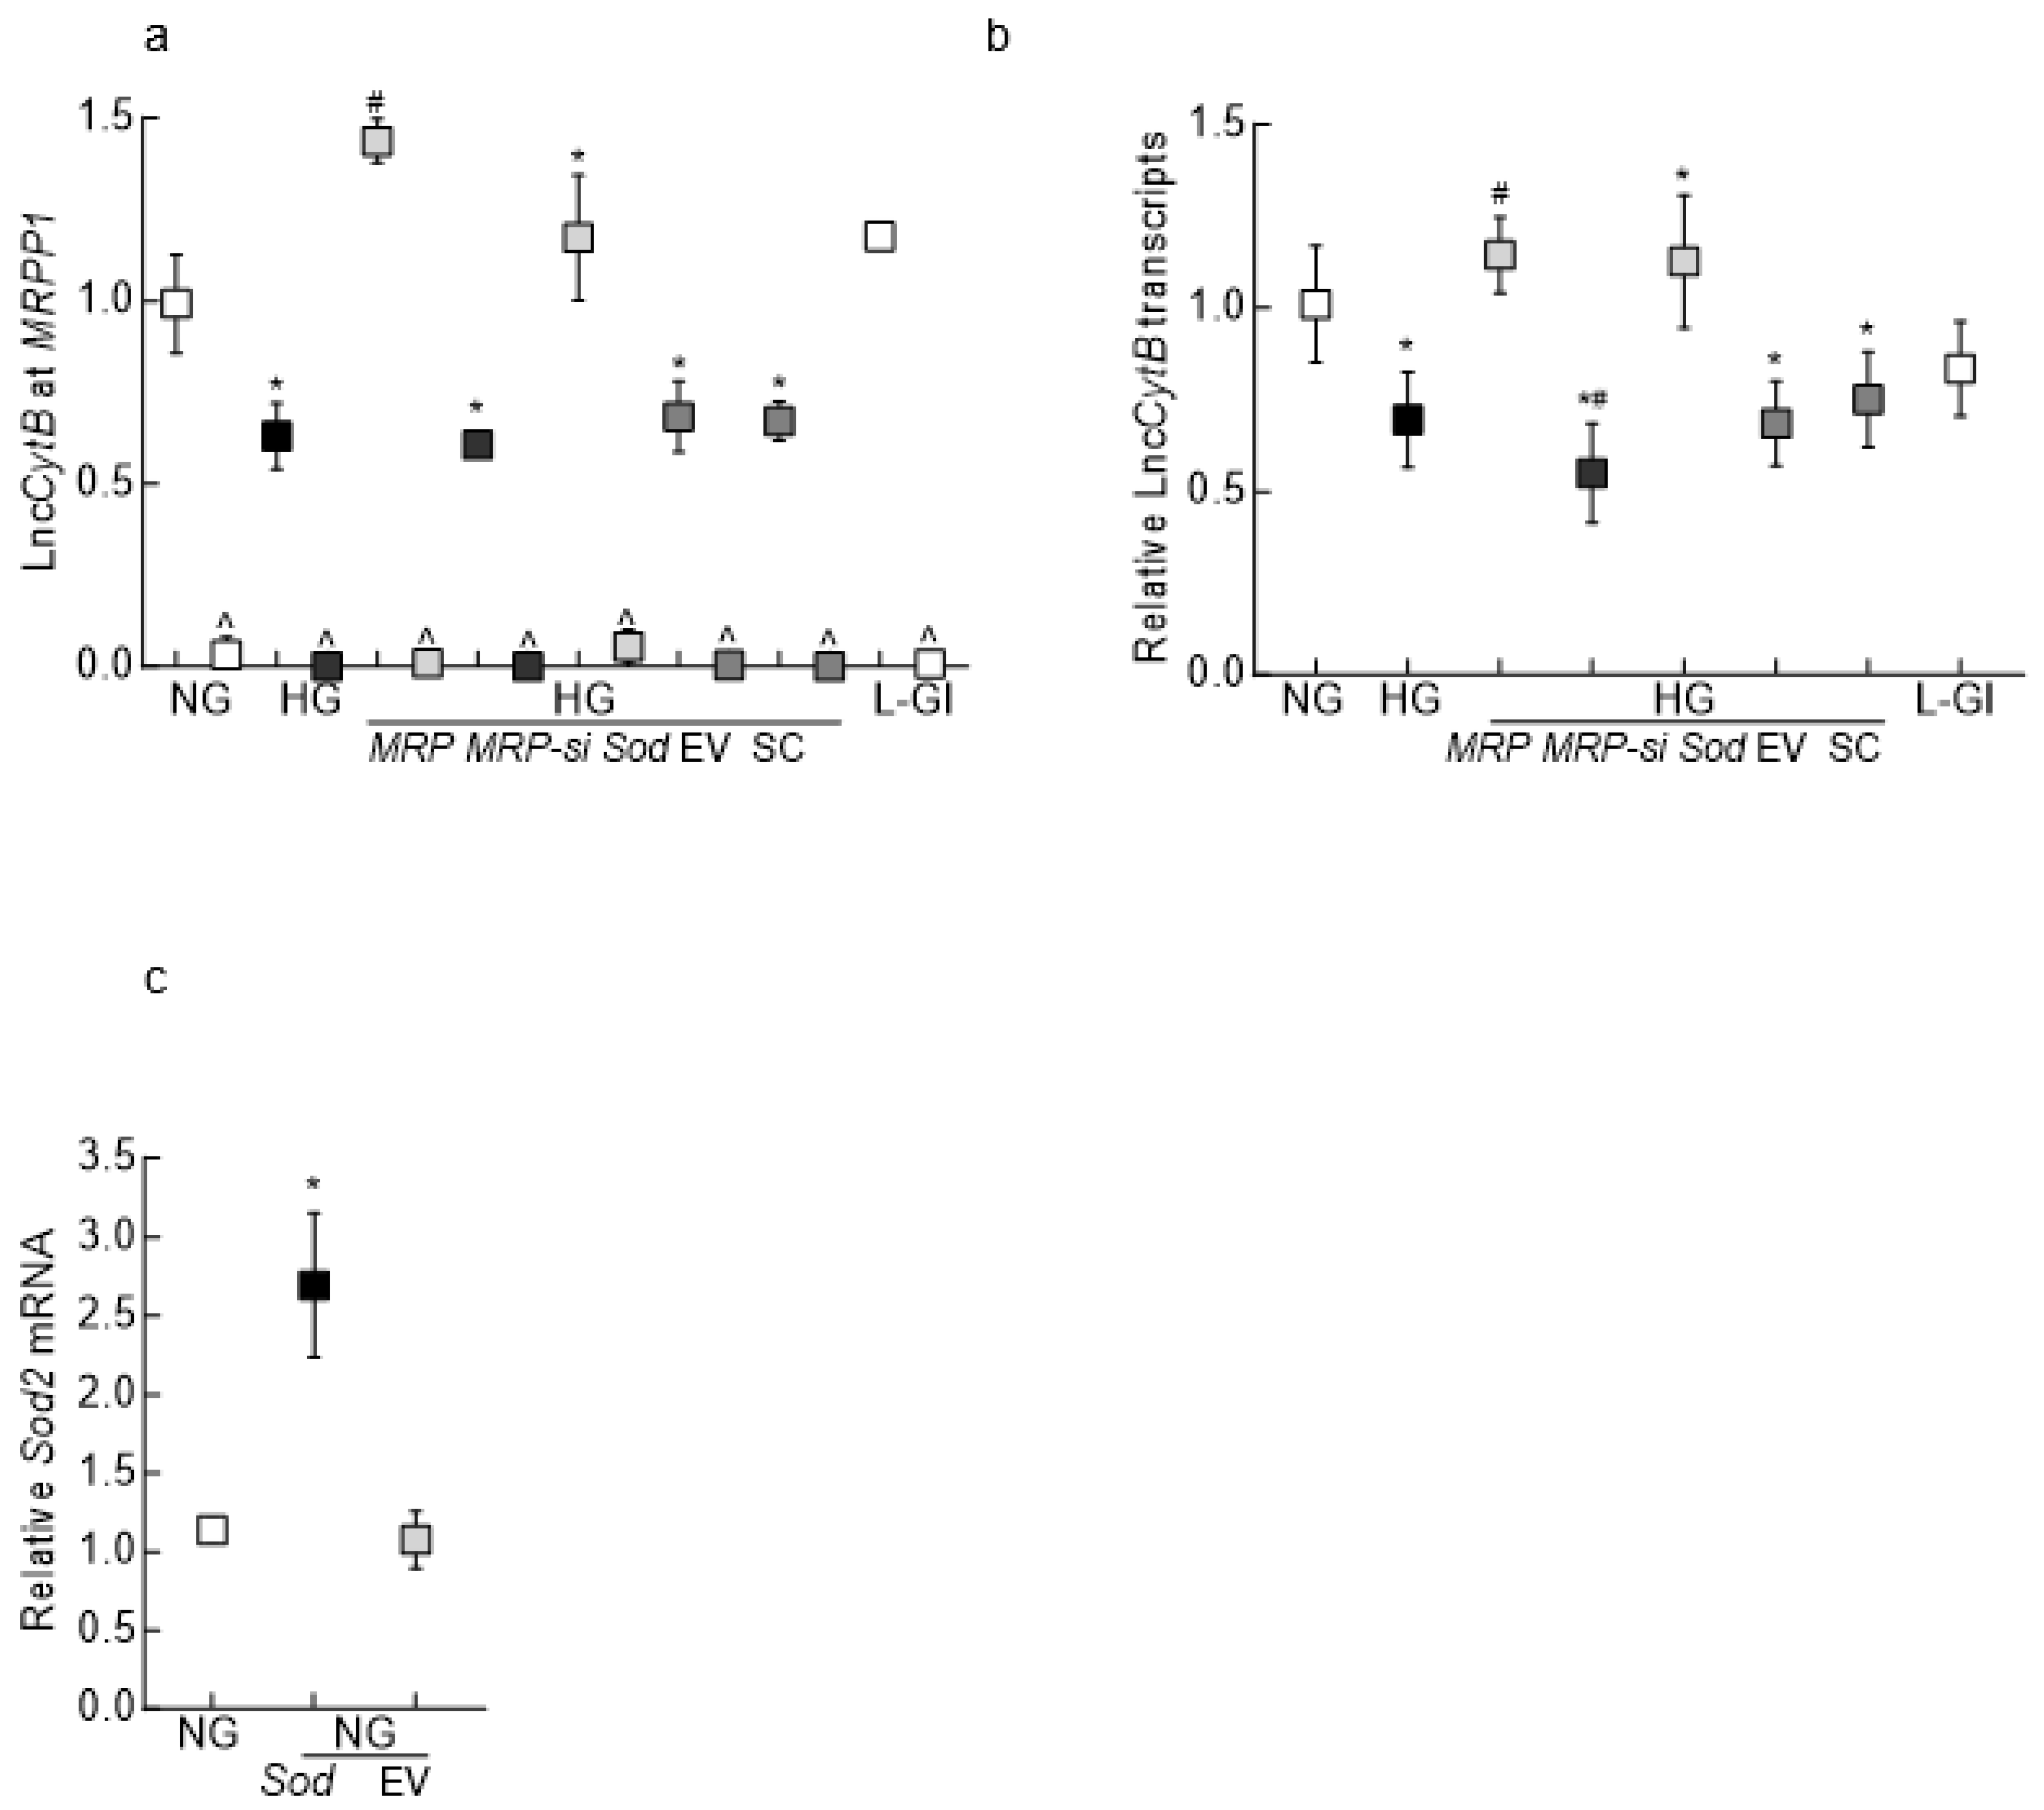
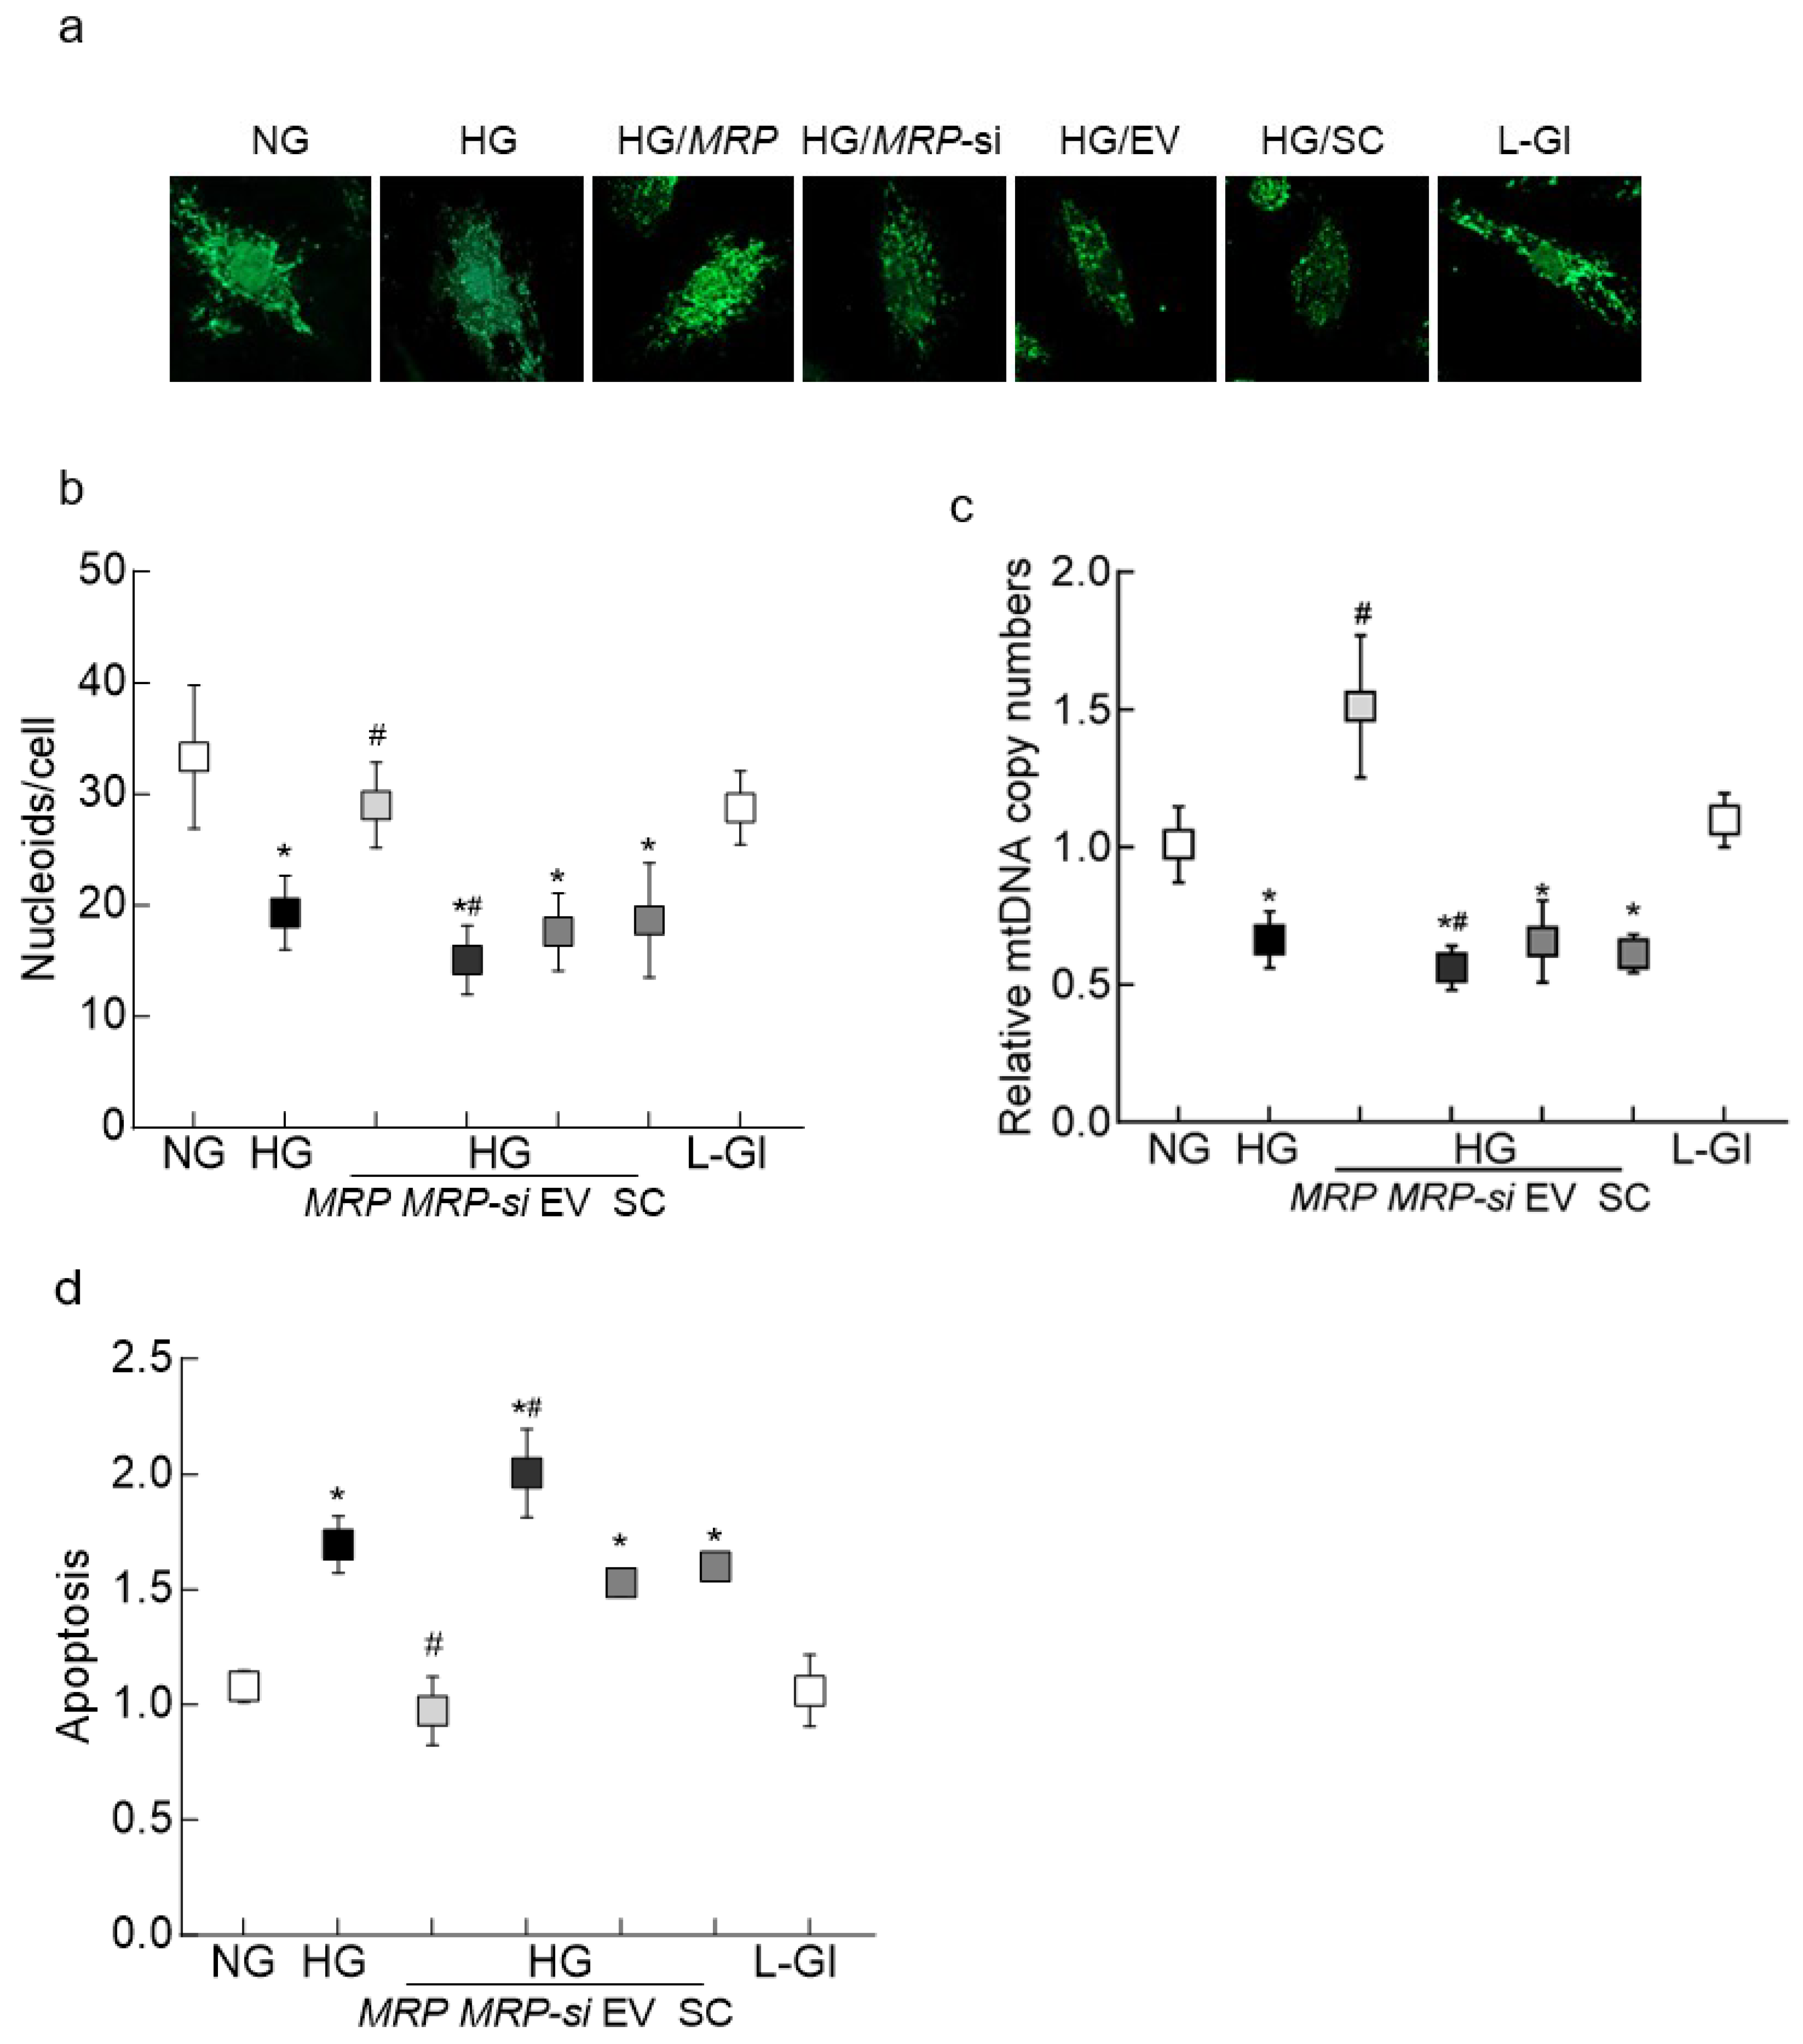
3.1. In Vitro Model
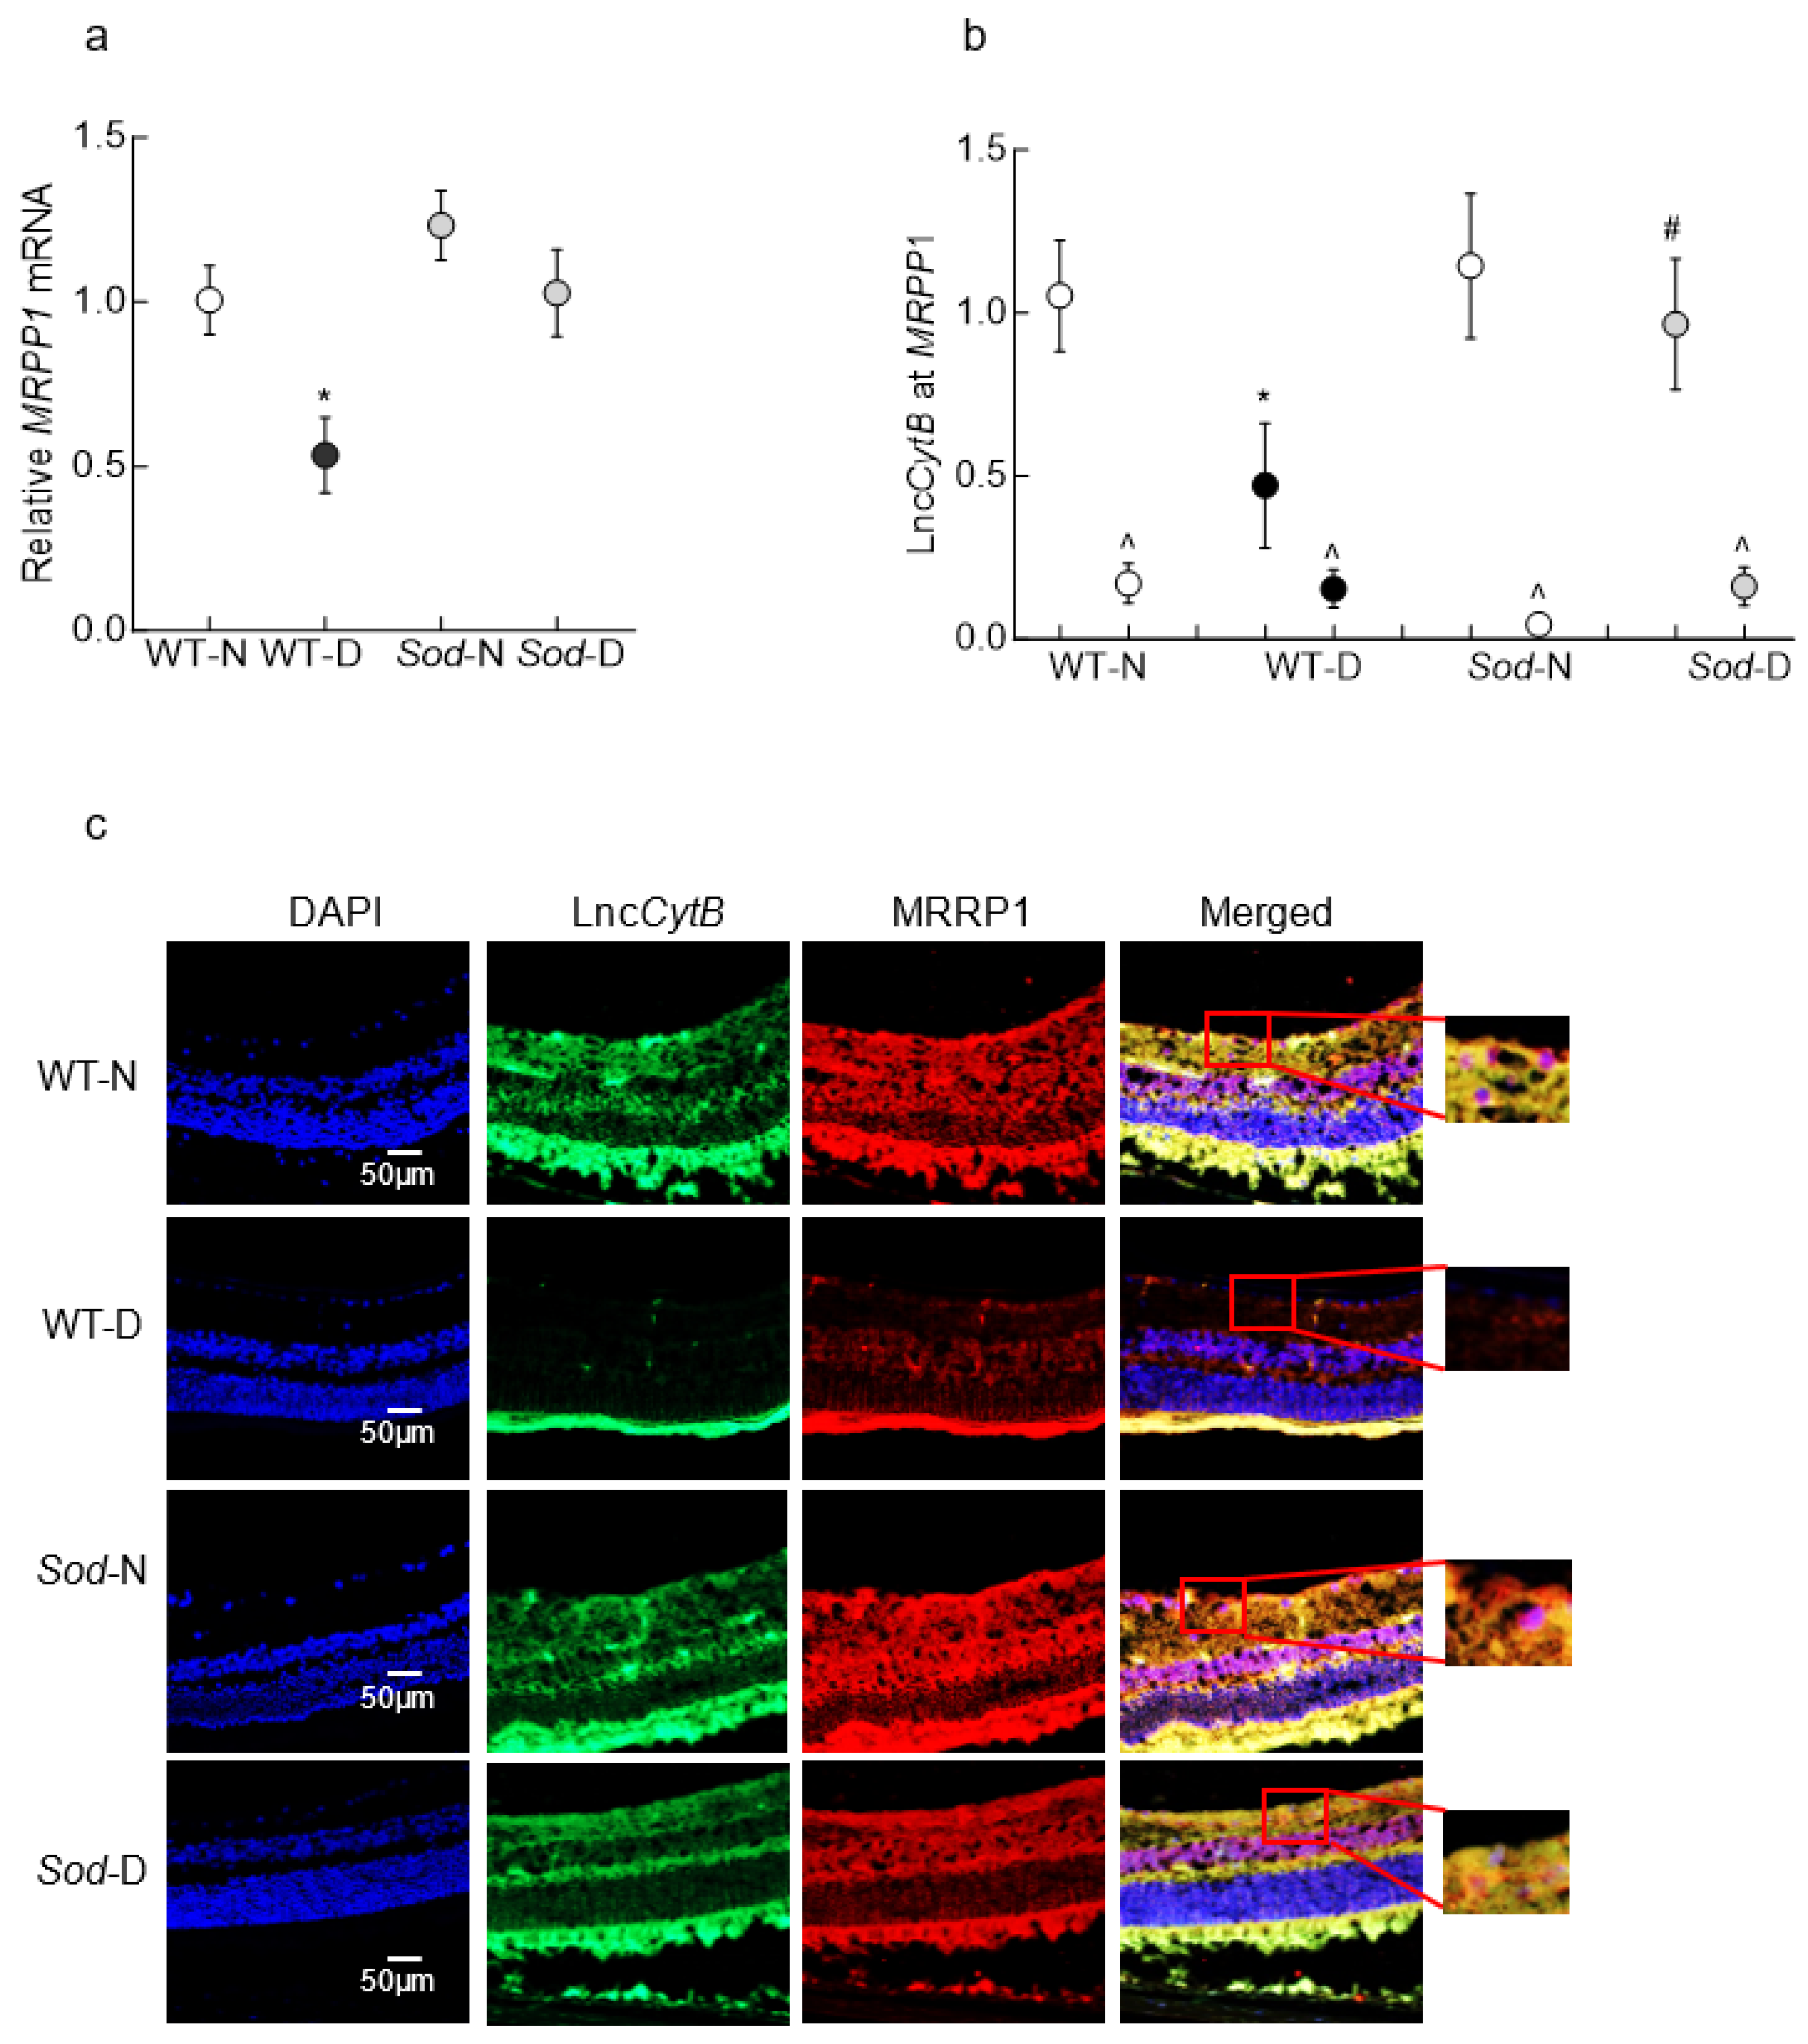
3.2. Mouse Retinal Microvessels
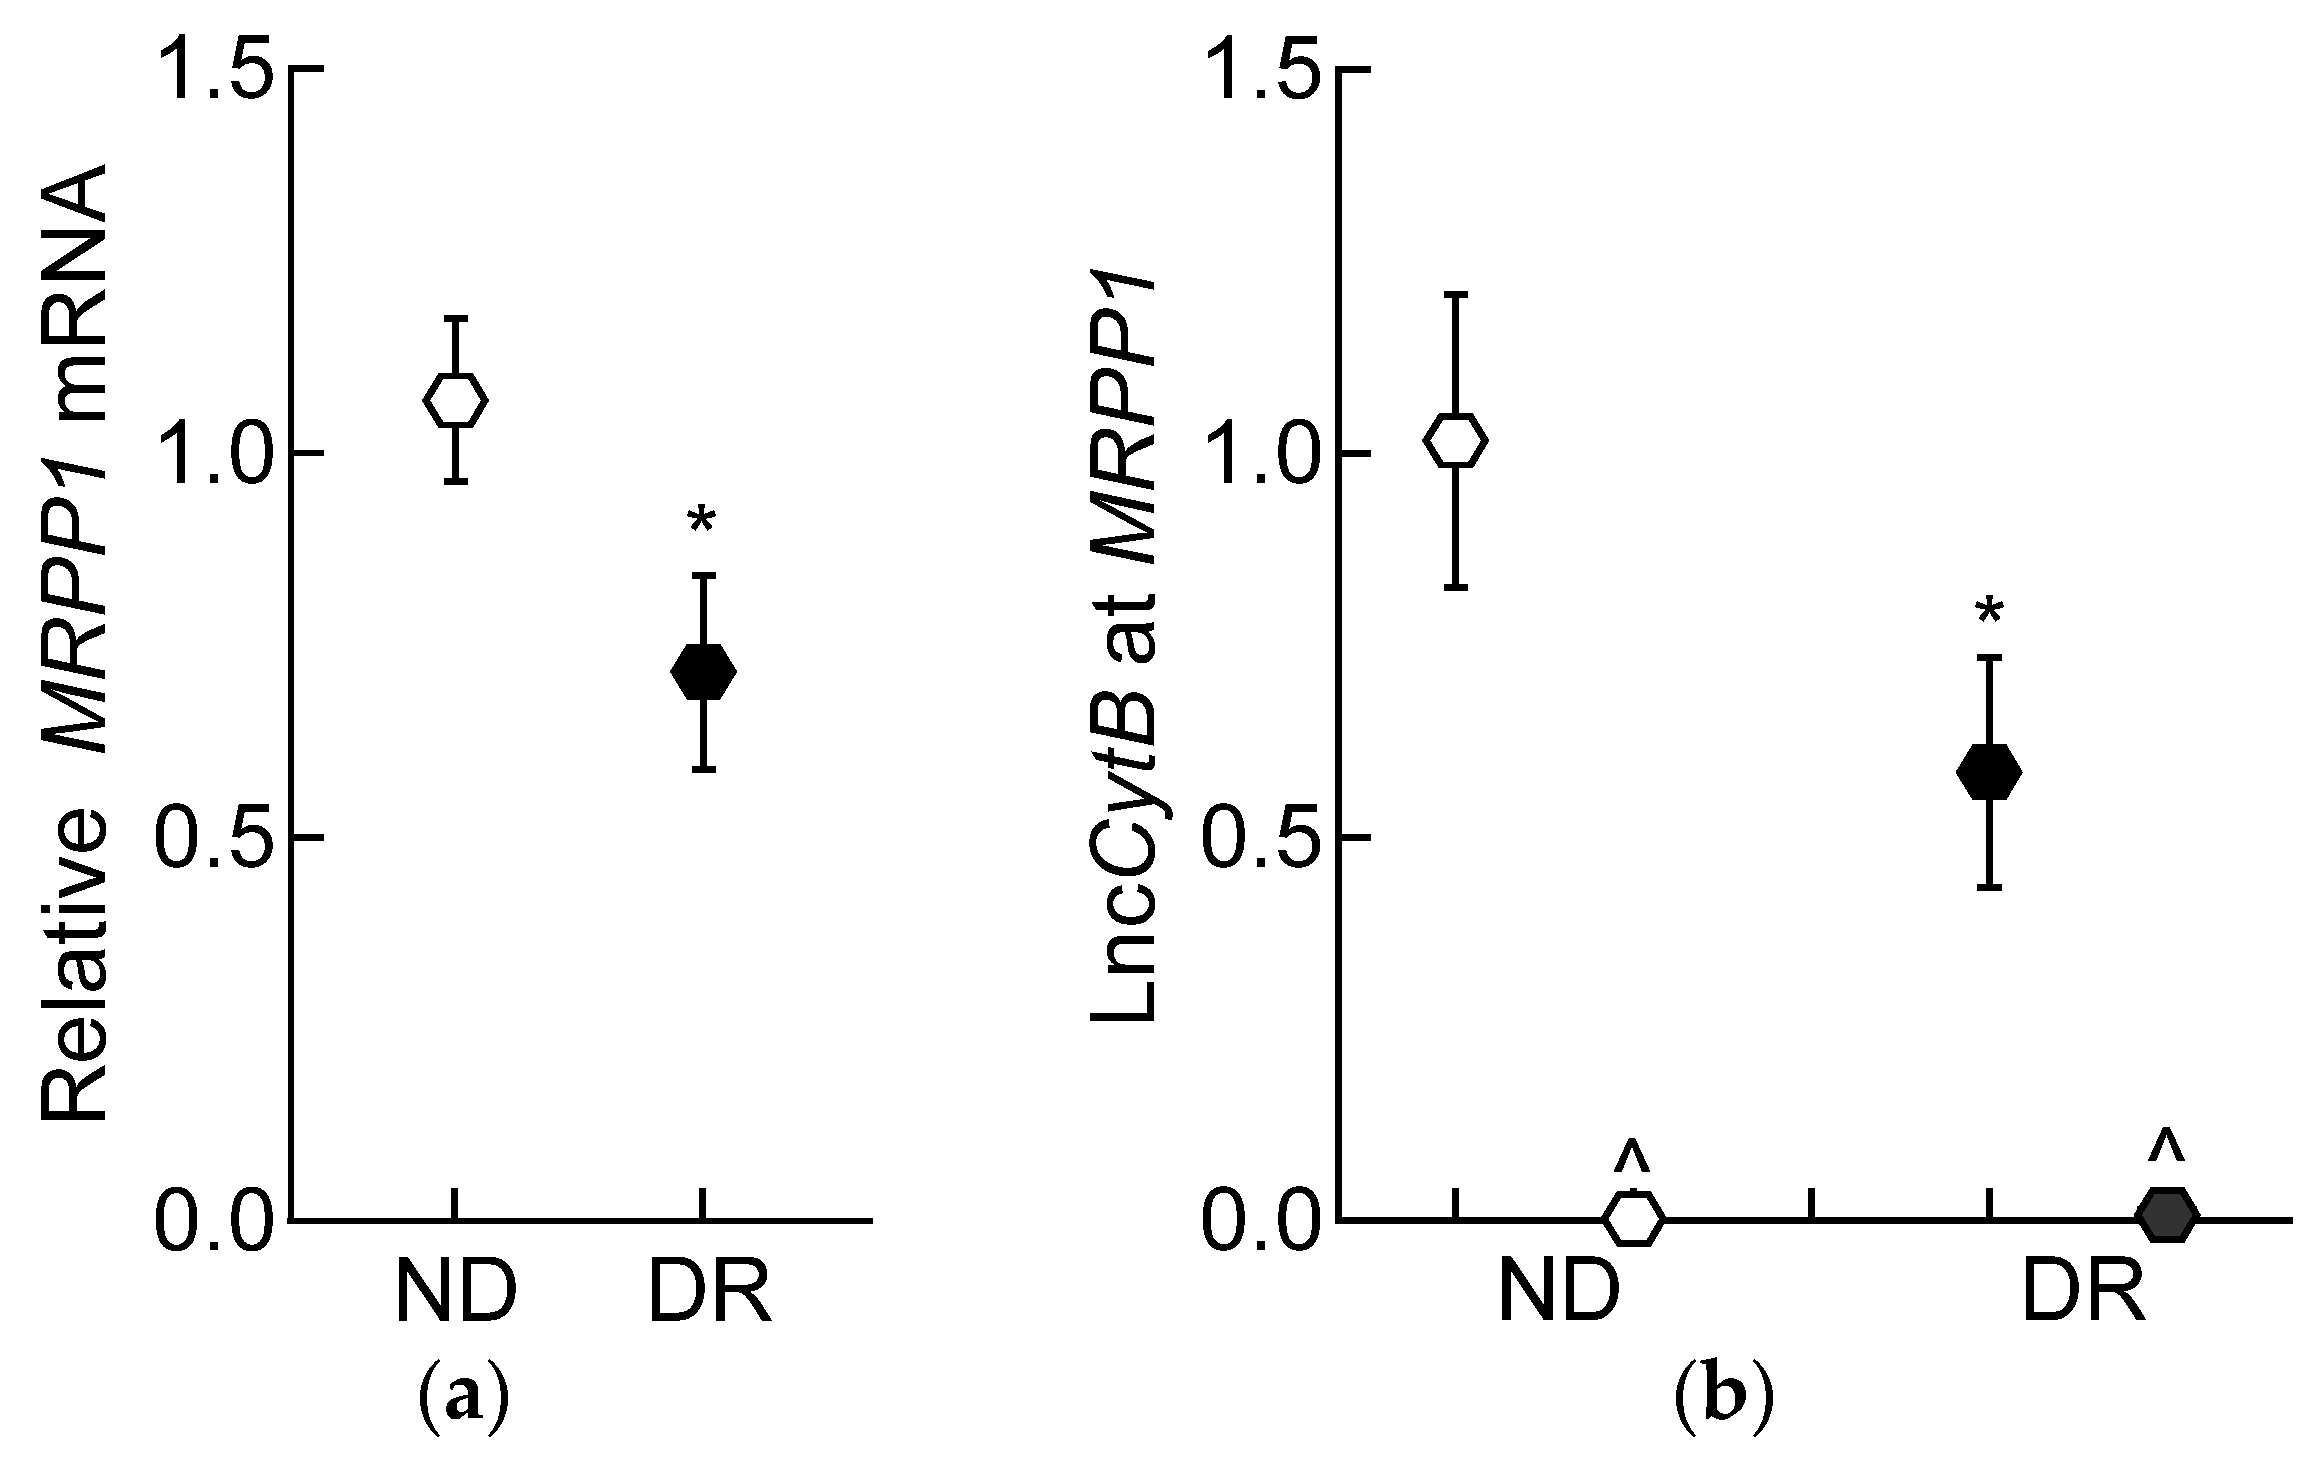
3.3. Human Retinal Microvessels
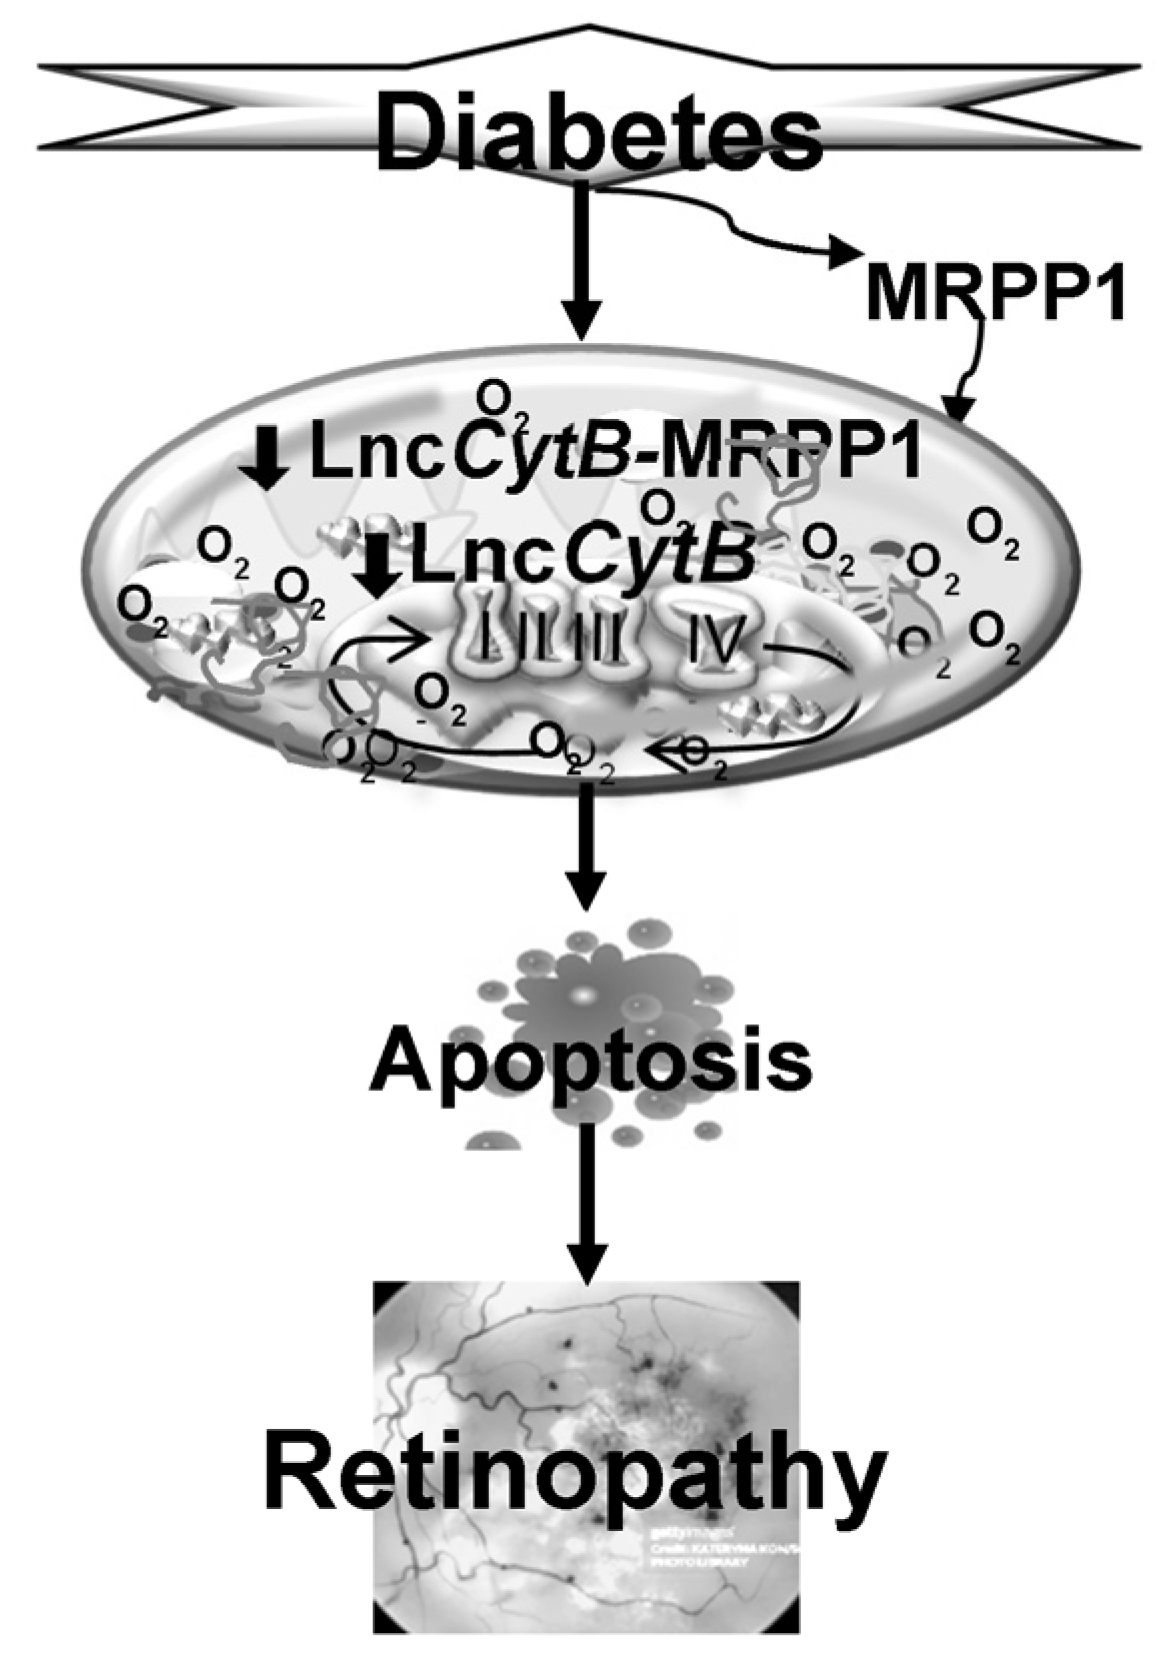
4. Discussion
Author Contributions
Funding
Institutional Review Board Statement
Informed Consent Statement
Data Availability Statement
Acknowledgments
Conflicts of Interest
References
- Lovic, D.; Piperidou, A.; Zografou, I.; Grassos, H.; Pittaras, A.; Manolis, A. The Growing Epidemic of Diabetes Mellitus. Curr. Vasc. Pharmacol. 2020, 18, 104–109. [Google Scholar] [CrossRef] [PubMed]
- Collaborators, G.D. Global, regional, and national burden of diabetes from 1990 to 2021, with projections of prevalence to 2050: A systematic analysis for the Global Burden of Disease Study 2021. Lancet 2023, 402, 203–234. [Google Scholar] [CrossRef]
- Kowluru, R.A.; Mishra, M. Oxidative stress, mitochondrial damage and diabetic retinopathy. Biochim. Biophys. Acta 2015, 1852, 2474–2483. [Google Scholar] [CrossRef] [PubMed]
- Lechner, J.; O’Leary, O.E.; Stitt, A.W. The pathology associated with diabetic retinopathy. Vis. Res. 2017, 139, 7–14. [Google Scholar] [CrossRef]
- Kowluru, R.A. Mitochondrial stability in diabetic retinopathy: Lessons learned from epigenetics. Diabetes 2019, 68, 241–247. [Google Scholar] [CrossRef]
- Mizutani, M.; Kern, T.S.; Lorenzi, M. Accelerated death of retinal microvascular cells in human and experimental diabetic retinopathy. J. Clin. Investig. 1996, 97, 2883–2890. [Google Scholar] [CrossRef] [PubMed]
- Bock, F.J.; Tait, S.W.G. Mitochondria as multifaceted regulators of cell death. Nat. Rev. Mol. Cell Biol. 2020, 21, 85–100. [Google Scholar] [CrossRef] [PubMed]
- Giacomello, M.; Pyakurel, A.; Glytsou, C.; Scorrano, L. The cell biology of mitochondrial membrane dynamics. Nat. Rev. Mol. Cell Biol. 2020, 21, 204–224. [Google Scholar] [CrossRef]
- Murphy, M.P. How mitochondria produce reactive oxygen species. Biochem. J. 2009, 417, 1–13. [Google Scholar] [CrossRef]
- Foutouhi, A.; Meyers, S. Comparative oxidative metabolism in mammalian sperm. Anim. Reprod. Sci. 2022, 247, 107095. [Google Scholar] [CrossRef]
- Finkel, T.; Holbrook, N.J. Oxidants, oxidative stress and the biology of ageing. Nature 2000, 408, 239–247. [Google Scholar] [CrossRef] [PubMed]
- Zhao, R.Z.; Jiang, S.; Zhang, L.; Yu, Z.B. Mitochondrial electron transport chain, ROS generation and uncoupling (Review). Int. J. Mol. Med. 2019, 44, 3–15. [Google Scholar] [CrossRef] [PubMed]
- Kanwar, M.; Chan, P.S.; Kern, T.S.; Kowluru, R.A. Oxidative damage in the retinal mitochondria of diabetic mice: Possible protection by superoxide dismutase. Investig. Ophthalmol. Vis. Sci. 2007, 48, 3805–3811. [Google Scholar] [CrossRef] [PubMed]
- Sharma, P.; Sampath, H. Mitochondrial DNA Integrity: Role in Health and Disease. Cells 2019, 8, 100. [Google Scholar] [CrossRef] [PubMed]
- Yan, C.; Duanmu, X.; Zeng, L.; Liu, B.; Song, Z. Mitochondrial DNA: Distribution, Mutations, and Elimination. Cells 2019, 8, 379. [Google Scholar] [CrossRef] [PubMed]
- Priesnitz, C.; Becker, T. Pathways to balance mitochondrial translation and protein import. Genes. Dev. 2018, 32, 1285–1296. [Google Scholar] [CrossRef] [PubMed]
- Basu, U.; Bostwick, A.M.; Das, K.; Dittenhafer-Reed, K.E.; Patel, S.S. Structure, mechanism, and regulation of mitochondrial DNA transcription initiation. J. Biol. Chem. 2020, 295, 18406–18425. [Google Scholar] [CrossRef] [PubMed]
- Fang, Y.; Fullwood, M.J. Roles, Functions, and Mechanisms of Long Non-coding RNAs in Cancer. Genomics Proteomics Bioinform. 2016, 14, 42–54. [Google Scholar] [CrossRef]
- Bhat, S.A.; Ahmad, S.M.; Mumtaz, P.T.; Malik, A.A.; Dar, M.A.; Urwat, U.; Shah, R.A.; Ganai, N.A. Long non-coding RNAs: Mechanism of action and functional utility. Noncoding RNA Res. 2016, 1, 43–50. [Google Scholar] [CrossRef]
- Bhan, A.; Soleimani, M.; Mandal, S.S. Long Noncoding RNA and Cancer: A New Paradigm. Cancer Res. 2017, 77, 3965–3981. [Google Scholar] [CrossRef]
- Chen, Y.; Li, Z.; Chen, X.; Zhang, S. Long non-coding RNAs: From disease code to drug role. Acta Pharm. Sin. B 2021, 11, 340–354. [Google Scholar] [CrossRef]
- Biswas, S.; Sarabusky, M.; Chakrabarti, S. Diabetic Retinopathy, lncRNAs, and Inflammation: A Dynamic, Interconnected Network. J. Clin. Med. 2019, 8, 1033. [Google Scholar] [CrossRef]
- Kowluru, R.A. Long noncoding RNAs and mitochondrial homeostasis in the development of diabetic retinopathy. Front. Endocrinol. 2022, 13, 915031. [Google Scholar] [CrossRef]
- Rackham, O.; Shearwood, A.-M.J.; Mercer, T.R.; Davies, S.M.K.; Mattick, J.S.; Filipovska, A. Long noncoding RNAs are generated from the mitochondrial genome and regulated by nuclear-encoded proteins. RNA 2011, 17, 2085–2093. [Google Scholar] [CrossRef]
- Kim, K.M.; Noh, J.H.; Abdelmohsen, K.; Gorospe, M. Mitochondrial noncoding RNA transport. BMB Rep. 2017, 50, 164–174. [Google Scholar] [CrossRef] [PubMed]
- Kumar, J.; Mohammad, G.; Alka, K.; Kowluru, R.A. Mitochondrial genome-encoded long noncoding RNA and mitochondrial stability in diabetic retinopathy. Diabetes 2023, 72, 520–531. [Google Scholar] [CrossRef] [PubMed]
- Sanchez, M.I.; Mercer, T.R.; Davies, S.M.; Shearwood, A.M.; Nygård, K.K.; Richman, T.R.; Mattick, J.S.; Rackham, O.; Filipovska, A. RNA processing in human mitochondria. Cell Cycle 2011, 10, 2904–2916. [Google Scholar] [CrossRef]
- Alexeyev, M.; Shokolenko, I.; Wilson, G.; LeDoux, S. The maintenance of mitochondrial DNA integrity--Critical analysis and update. Cold Spring Harb. Perspect. Biol. 2013, 5, a012641. [Google Scholar] [CrossRef]
- Oerum, S.; Roovers, M.; Rambo, R.P.; Kopec, J.; Bailey, H.J.; Fitzpatrick, F.; Newman, J.A.; Newman, W.G.; Amberger, A.; Zschocke, J.; et al. Structural insight into the human mitochondrial tRNA purine N1-methyltransferase and ribonuclease P complexes. J. Biol. Chem. 2018, 293, 12862–12876. [Google Scholar] [CrossRef]
- Reinhard, L.; Sridhara, S.; Hällberg, B.M. Structure of the nuclease subunit of human mitochondrial RNase P. Nucleic Acids Res. 2015, 43, 5664–5672. [Google Scholar] [CrossRef] [PubMed]
- Radhakrishnan, R.; Kowluru, R.A. Long noncoding RNA MALAT1 and regulation of the antioxidant defense system in diabetic retinopathy. Diabetes 2021, 70, 227–239. [Google Scholar] [CrossRef] [PubMed]
- Liu, C.; Fukuhara, C.; Wessel, J.H., 3rd; Iuvone, P.M.; Tosini, G. Localization of Aa-nat mRNA in the rat retina by fluorescence in situ hybridization and laser capture microdissection. Cell Tissue Res. 2004, 315, 197–201. [Google Scholar] [CrossRef] [PubMed]
- Kowluru, R.A.; Alka, K. Mitochondrial quality control and metabolic memory phenomenon associated with continued progression of diabetic retinopathy. Int. J. Mol. Sci. 2023, 24, 8076. [Google Scholar] [CrossRef] [PubMed]
- Kowluru, R.A.; Mohammad, G. Mitochondrial Fragmentation in a High Homocysteine Environment in Diabetic Retinopathy. Antioxidants 2022, 11, 365. [Google Scholar] [CrossRef]
- Mohammad, G.; Kumar, J.; Kowluru, R. Mitochondrial genome-encoded long noncoding RNA Cytochrome B and mitochondrial dysfunction in diabetic retinopathy. Antioxid. Redox Signal 2023, 39, 817–828. [Google Scholar] [CrossRef] [PubMed]
- Mercer, T.R.; Neph, S.; Dinger, M.E.; Crawford, J.; Smith, M.A.; Shearwood, A.M.; Haugen, E.; Bracken, C.P.; Rackham, O.; Stamatoyannopoulos, J.A.; et al. The human mitochondrial transcriptome. Cell 2011, 146, 645–658. [Google Scholar] [CrossRef] [PubMed]
- Tan, B.G.; Gustafsson, C.M.; Falkenberg, M. Mechanisms and regulation of human mitochondrial transcription. Nat. Rev. Mol. Cell Biol. 2024, 25, 119–132. [Google Scholar] [CrossRef]
- Holzmann, J.; Frank, P.; Löffler, E.; Bennett, K.L.; Gerner, C.; Rossmanith, W. RNase P without RNA: Identification and functional reconstitution of the human mitochondrial tRNA processing enzyme. Cell 2008, 135, 462–474. [Google Scholar] [CrossRef] [PubMed]
- Jarrous, N.; Reiner, R.; Wesolowski, D.; Mann, H.; Guerrier-Takada, C.; Altman, S. Function and subnuclear distribution of Rpp21, a protein subunit of the human ribonucleoprotein ribonuclease P. Rna 2001, 7, 1153–1164. [Google Scholar] [CrossRef]
- Saoji, M.; Sen, A.; Cox, R.T. Loss of Individual Mitochondrial Ribonuclease P Complex Proteins Differentially Affects Mitochondrial tRNA Processing In Vivo. Int. J. Mol. Sci. 2021, 22, 6066. [Google Scholar] [CrossRef]
- Vilardo, E.; Toth, U.; Hazisllari, E.; Hartmann, R.K.; Rossmanith, W. Cleavage kinetics of human mitochondrial RNase P and contribution of its non-nuclease subunits. Nucleic Acids Res. 2023, 51, 10536–10550. [Google Scholar] [CrossRef]
- El-Hattab, A.W.; Craigen, W.J.; Scaglia, F. Mitochondrial DNA maintenance defects. Biochim. Biophys. Acta Mol. Basis Dis. 2017, 1863, 1539–1555. [Google Scholar] [CrossRef]
- Sen, A.; Karasik, A.; Shanmuganathan, A.; Mirkovic, E.; Koutmos, M.; Cox, R.T. Loss of the mitochondrial protein-only ribonuclease P complex causes aberrant tRNA processing and lethality in Drosophila. Nucleic Acids Res. 2016, 44, 6409–6422. [Google Scholar] [CrossRef]
- Dhir, A.; Dhir, S.; Borowski, L.S.; Jimenez, L.; Teitell, M.; Rötig, A.; Crow, Y.J.; Rice, G.I.; Duffy, D.; Tamby, C.; et al. Mitochondrial double-stranded RNA triggers antiviral signalling in humans. Nature 2018, 560, 238–242. [Google Scholar] [CrossRef]
- Grochowska, J.; Czerwinska, J.; Borowski, L.S.; Szczesny, R.J. Mitochondrial RNA, a new trigger of the innate immune system. Wiley Interdiscip. Rev. RNA 2022, 13, e1690. [Google Scholar] [CrossRef]
- Tigano, M.; Vargas, D.C.; Tremblay-Belzile, S.; Fu, Y.; Sfeir, A. Nuclear sensing of breaks in mitochondrial DNA enhances immune surveillance. Nature 2021, 591, 477–481. [Google Scholar] [CrossRef] [PubMed]
- Chen, Y.G.; Hur, S. Cellular origins of dsRNA, their recognition and consequences. Nat. Rev. Mol. Cell Biol. 2022, 23, 286–301. [Google Scholar] [CrossRef] [PubMed]


| Human RNA | |
| ssLncCytB antisense | 5′-GGTATCTGGACTTCGAAGGCACGAATGACCAACAGGAGGCTAA-3′ |
| LncCytB | FWD 5′-5′-CCATAGACCTGAAGCTTCCGT-3′ |
| REV 5′-TATTATAAAGCGGGTGATTCG-3′ | |
| MRPP1 | FWD 5′-GGCAGAGAAGTACCAGAACACATC-3′ |
| REV 5′-CCCTTGCTGCTTTCATTTC-3′ | |
| CytB | FWD 5′-ATGGTAGATGTGGCGGGTTT-3′ |
| REV 5′-TCTCCGATCCGTCCCTAACA-3′ | |
| Sod2 | FWD5′-CCTGCTCCCCGCGCTTTCTT-3′ |
| REV 5′-CGGGGAGGCTGTGCTTCTGC-3′ | |
| β-actin | FWD 5′-AGCCTCGCCTTTGCCGATCCG-3′ |
| REV 5′-TCTCTTGCTCTGGGCCTCGTCG-3′ | |
| Human DNA | |
| CytB | FWD 5′-TCACCAGACGCCTCAACCGC-3′ |
| REV 5′-GCCTCGCCCGATGTGTAGGA-3′ | |
| β-actin | FWD 5′-CTTTCCTGCCTGAGCTGACC-3′ |
| REV 5′-CCTAGAAGCATTTGCGGTGG-3′ | |
| Mouse | |
| ssLncCytB antisense | 5′-GGTATCTGGACTTCGAAGGCAACCCACAAGATGACCAACCG-3′ |
| LncCytB | FWD 5′-CCATAGACCTGAAGCTTCCGT-3′ |
| REV 5′-AATCACACAAATTTTGTACTG-3′ | |
| MRPP1 | FWD 5′-ACCCGCCCCATCCAACATCTCAT-3′ |
| REV 5′-ACTTGAGAGCCTCTTCCCAGTTA-3′ | |
| 18S rRNA | FWD 5′-GCCCTGTAATTGGAATGAGTCCACTT-3′ |
| REV 5′-CTCCCCAAGATCCAACTACGAGCTTT-3′ | |
Disclaimer/Publisher’s Note: The statements, opinions and data contained in all publications are solely those of the individual author(s) and contributor(s) and not of MDPI and/or the editor(s). MDPI and/or the editor(s) disclaim responsibility for any injury to people or property resulting from any ideas, methods, instructions or products referred to in the content. |
© 2024 by the authors. Licensee MDPI, Basel, Switzerland. This article is an open access article distributed under the terms and conditions of the Creative Commons Attribution (CC BY) license (https://creativecommons.org/licenses/by/4.0/).
Share and Cite
Kumar, J.; Malaviya, P.; Kowluru, R.A. Mitochondrial Genome-Encoded Long Noncoding RNA Cytochrome B (LncCytB) and Mitochondrial Ribonucleases in Diabetic Retinopathy. Biomedicines 2024, 12, 1637. https://doi.org/10.3390/biomedicines12081637
Kumar J, Malaviya P, Kowluru RA. Mitochondrial Genome-Encoded Long Noncoding RNA Cytochrome B (LncCytB) and Mitochondrial Ribonucleases in Diabetic Retinopathy. Biomedicines. 2024; 12(8):1637. https://doi.org/10.3390/biomedicines12081637
Chicago/Turabian StyleKumar, Jay, Pooja Malaviya, and Renu A. Kowluru. 2024. "Mitochondrial Genome-Encoded Long Noncoding RNA Cytochrome B (LncCytB) and Mitochondrial Ribonucleases in Diabetic Retinopathy" Biomedicines 12, no. 8: 1637. https://doi.org/10.3390/biomedicines12081637