Abstract
The aim of this study was to investigate in vivo and in vitro the effectiveness of the use of fibroblast growth factor (FGF)-2 with carbonate apatite (CO3Ap) on periodontal healing. Periodontal defects created in the maxillary first molars in rats were treated with FGF-2, CO3Ap, FGF-2 + CO3Ap or left unfilled. Healing was evaluated using microcomputed tomography, histological, and immunohistochemical analyses. In vitro experiments were performed to assess cellular behaviors and the expression of osteoblastic differentiation markers in MC3T3-E1 cells. At 4 weeks, the bone volume fraction in the FGF-2 + CO3Ap group was significantly greater than that in the CO3Ap group, but there was no significant difference from the FGF-2 group. The FGF-2 + CO3Ap group demonstrated greater new bone compared with the FGF-2 or CO3Ap group. The FGF-2 + CO3Ap group showed greater levels of osteocalcin-positive cells compared with the CO3Ap group, but there was no significant difference from the FGF-2 group. In vitro, the FGF-2 + CO3Ap group exhibited a greater extent of cell attachment and more elongated cells compared with the CO3Ap group. Compared with the CO3Ap group, the FGF-2 + CO3Ap group showed significantly higher viability/proliferation, but the expressions of Runx2 and Sp7 were reduced. The results indicated that the use of FGF-2 with CO3Ap enhanced healing in the periodontal defects. FGF-2 promoted cell attachment to and proliferation on CO3Ap and regulated osteoblastic differentiation, thereby contributing to novel bone formation.
1. Introduction
Periodontitis is an inflammatory disease that affects susceptible individuals, in part due to reciprocally reinforced interactions between the pathogenic microbiome and host immune and inflammatory responses [1]. Periodontitis can lead to progressive destruction of the periodontal tissues (gingiva, periodontal ligament, cementum, and alveolar bone) and eventual loss of teeth, thus compromising eating ability and esthetics and affecting life quality [1,2]. In cases of moderate to severe periodontitis, surgical intervention is often needed in addition to the non-surgical therapy. The goal of periodontal therapy is to regenerate the lost periodontal structures, and various methods of periodontal regenerative therapy are used for this purpose. Three major factors are important for periodontal tissue engineering: signaling molecules, scaffolds, and stem cells [3,4]. Signaling molecules promote cell proliferation and differentiation, and scaffolds provide three-dimensional structures for host cells to support tissue regeneration [5].
Fibroblast growth factor-2 (FGF-2) is a biological agent that promotes the migration and proliferation of periodontal ligament-derived cells (PDLCs), which play an important role in periodontal regeneration [3]. In Japan, a commercial formulation of 0.3% recombinant human FGF-2 (rhFGF-2) was formally approved as a drug for periodontal regeneration, following extensive clinical trials [6,7,8]. The rhFGF-2 formulation has been clinically used for periodontal regenerative therapy [9,10,11,12,13,14].
Bone graft materials have been used as a scaffold for periodontal regenerative therapy. Currently available bone graft materials include autologous, allogenic, xenogeneic, and artificial bone materials. Ideally, bone graft materials should have osteoconductive, osteoinductive, and osteogenic properties. Autologous bone is reported to have all three properties. However, the amount of bone that can be collected is limited, and harvesting involves patient morbidity. Allogenic bone has a concern for the risk of infection from unknown sources. Xenogeneic bone such as demineralized bovine bone mineral (DBBM) has been shown to have osteoconductive properties [15]. DBBM is absorbed slowly and thus functions long term as a scaffold [16]. There are various artificial bone substitutes such as beta-tricalcium phosphate (β-TCP) and hydroxyapatite (HA). Artificial bone is safer than other materials in terms of risk of infection and has no restrictions on quantity. Therefore, it may be suitable for periodontal regenerative therapy.
Carbonate apatite (CO3Ap) has a composition similar to bone, and it has attracted much attention as an alternative artificial bone graft material in recent years. Recently, the CO3Ap block was produced with a dissolution–precipitation reaction [17]. CO3Ap has morphological characteristics such as a large crystal size and surface area compared with HA and β-TCP [18]. An in vitro study showed that CO3Ap surfaces were more absorbed by rabbit osteoclast cells than HA [19]. In the culture of human bone marrow cells on CO3Ap, the expression level of osteoblast differentiation markers was significantly higher than HA and β-TCP [20]. In vivo studies reported that CO3Ap promoted new bone formation by inducing bone remodeling and angiogenesis [21,22]. The use of the CO3Ap granules was formally approved for implant and periodontal treatment in 2017 in Japan. The clinical effects of CO3Ap granules in dental implant therapy have been reported [23,24].
Combination therapy with signaling molecules and scaffold has been reported in the treatment of periodontitis [25,26,27]. In a randomized clinical trial and its follow-up studies, we have shown the clinical effectiveness of the use of rhFGF-2 and DBBM in the treatment of intrabony periodontal defects [9,10,14]. As for the combined use of FGF-2 and CO3Ap, it has been shown to enhance new bone formation in in vivo studies [28,29]. However, there remain uncertainties about the effectiveness of the combination of FGF-2 and CO3Ap on periodontal healing. Also, information is limited on its impact on cellular dynamics and osteoblast differentiation.
The aim of this study was to investigate in vivo and in vitro the effects of local application of FGF-2 in combination with CO3Ap on the healing of periodontal defects.
2. Materials and Methods
An overview of the conducted experiments is shown in Supplemental Figure S1.
2.1. Animals
Forty-four Wistar rats (10-week-old male, weight of 250–300 g) were used (Sankyo Labo Service, Tokyo, Japan). The animals were housed in individual cages maintained under standard laboratory conditions and were given free access to standard laboratory rat chow and water. The experimental procedures were conformed to the Treatment of Experimental Animals at Tokyo Dental College (approval number 232205). This study adhered to the ARRIVE guidelines (https://arriveguidelines.org/, accessed on 5 January 2022).
2.2. FGF-2 and CO3Ap
Kaken Pharmaceutical (Tokyo, Japan) supplied the FGF-2. The bone substitute used was CO3Ap (Cytrans® Granules, particle size 0.6–1.0 mm; GC, Tokyo, Japan). The FGF-2 used in the in vivo study was diluted with distilled water and hydroxypropyl cellulose (HPC; 3%) (FUJIFILM Wako Pure Chemical, Osaka, Japan) to generate a 0.3% solution of FGF-2. CO3Ap was loosely ground with a sterile mortar and pestle to adjust for filling the defect [30]. CO3Ap was premixed with FGF-2 and used after 10 min in the FGF-2 + CO3Ap group.
2.3. In Vivo Model and Surgical Protocol
The animals were allocated to the following groups: (1) Unfilled (n = 11), (2) FGF-2 (n = 11), (3) CO3Ap (n = 11), and (4) FGF-2 + CO3Ap (n = 11) (Supplementary Figure S2a). The animals underwent anesthesia via an intraperitoneal injection of a blend comprising midazolam (2 mg/kg), medetomidine (0.15 mg/kg), and butorphanol (2.5 mg/kg). Additionally, local infiltration anesthesia was administered. Following a crestal incision and flap elevation, periodontal defects (2.0 × 2.0 × 1.7 mm, width × length × depth) [31] were generated in the mesial aspect of the maxillary first molars (M1) (Figure S2b,c). This was achieved utilizing a surgical template (Figure S2d) [32]. The surgical procedure was implemented using a surgical scope. The root was meticulously stripped of its cementum and PDL. Subsequently, the sites were irrigated and dried. The defects in each group received FGF-2 solution (30 µL), CO3Ap (2 mg), or FGF-2 + CO3Ap or were left unfilled (Figure S2e). The flaps were sutured with 6-0 resorbable sutures (Figure S2f). Acetaminophen was then given.
2.4. Microcomputed Tomography
After 2 or 4 weeks, cardiovascular perfusion was conducted using paraformaldehyde (4%; FUJIFILM Wako Pure Chemical) following the administration of anesthesia to the animals. The maxillae were collected, and the healing of the defect area was assessed using a microcomputed tomography (micro-CT) system (R-mCT; Rigaku, Tokyo, Japan) (magnification, ×10; slice width, 16 µm). The region of interest (ROI) was delineated based on the following criteria: (1) longitudinally, from the alveolar bone crest at M1 mesial root to a depth of 1.7 mm, and (2) horizontally, standardized periodontal defects that included the proximal and buccal/palatal region of the defect. Data from the micro-CT were analyzed by image software (TRI/3D-BON; Ratoc System Engineering, Tokyo, Japan).
The bone mineral density (BMD) was measured as described previously [33]. New bone in the ROI was defined as the region with BMD ranging from 400 to 1000 mg/cm3, while CO3Ap and existing bone were categorized with BMD values exceeding 1000 mg/cm3 [34]. The newly formed bone was calculated by subtracting the regions for CO3Ap and bone from the total region with BMD > 400 mg/cm3.
The analysis focused on the bone volume fraction (BV/TV) in the ROI, excluding CO3Ap granules. In instances of therapy utilizing bone graft materials, assessing novel bone formation alone might lead to an underestimation of clinical success. Therefore, the ratio of the total radiopaque volume (comprising new bone and residual CO3Ap particles) to the total volume (RV/TV) was also examined [35,36].
2.5. Histological and Histomorphometric Analyses
The maxillae were bisected along the palatal median line for histological analysis. Following fixation in buffered 4% paraformaldehyde for 24 h, the samples were demineralized in 10% ethylenediaminetetraacetic acid disodium salt (EDTA-2Na, pH 7.0) (FUJIFILM Wako Pure Chemical) at 4 °C for a duration of 3 weeks and then embedded in paraffin. A microtome was used to cut 5 µm sections, and they underwent hematoxylin-eosin staining.
Histomorphometric analysis of new bone height was carried out using a microscope (UPM Axiophot 2; Carl Zeiss Japan, Tokyo, Japan) and software (Axio Vision 4.7; Carl Zeiss Japan). The relative level of the new bone was determined by the length from the apex to the crown cusp (Lac) of the first molar/the length of the bone gap (Lbg), the most coronal extent of newly formed bone to the level of intact alveolar bone (Supplementary Figure S3) [37].
2.6. Immunohistochemistry
The preparation of the sections and the detection of osterix (Osx) and osteocalcin (OCN) were performed as described previously [36].
For quantitative analysis of the positive cells, an observation area was randomly assigned in each section. This analysis was conducted using image software (Image-Pro Plus 6.2, Media Cybernetics, Rockville, MD, USA) [38].
In each specimen, the quantification sites were categorized into three areas (the Bone side, the Middle area, and the Root side). The ratio of positive cells to total cells at each respective site was calculated [32,36,39].
The micro-CT, histomorphometric, and immunohistochemical data were assessed by one examiner, who was unaware of the grouping, and confirmed by a second examiner.
2.7. In Vitro Cell Culture
MC3T3-E1 cells (RIKEN BioResource Center, Tsukuba, Japan) were incubated in α-MEM (Gibco, Invitrogen, Carlsbad, CA, USA) containing 10% heat-inactivated fetal bovine serum and antimicrobials. The incubation was carried out at 37 °C in 5% CO2 in air.
CO3Ap was pre-incubated in the medium 5 days before to minimize alterations in the medium composition arising from ion leaching [40]. For the assessment of FGF-2-treated CO3Ap, following the complete removal of the medium, a solution of FGF-2 (5 µg/mL) was combined with the CO3Ap. The samples were incubated for 10 min at room temperature, and then the media containing cells were added.
2.8. Evaluation of Cell Behaviors
The morphology and spreading of the cells were evaluated using confocal laser scanning microscopy (CLSM) and scanning electron microscopy (SEM).
The preparation of samples for CLSM was carried out as described previously [36]. The prepared samples were imaged using a CLSM (LSM880, Carl Zeiss, Oberkochen, Germany) and ZEN 2 black software (Carl Zeiss). The samples for SEM were prepared using the method described previously [36]. An SU6600 SEM (Hitachi High-Tech Corporation, Tokyo, Japan) was used to characterize the cells.
2.9. Enzyme-Linked Immunosorbent Assay
The release of FGF-2 from the FGF-2-treated scaffold was assessed by enzyme-linked immunosorbent assay (ELISA). FGF-2 solution (100 µL) and CO3Ap (100 mg) were mixed for 10 min at room temperature. After rinsing, they were vortexed twice to eliminate non-absorbed FGF-2 [41]. They were incubated with PBS (500 µL) in a 24-well plate. The supernatant was collected, replaced with fresh PBS at each time point, and stored at −80 °C. The FGF-2 ELISA kit (R&D System, Minneapolis, MN, USA) was used for the measurements.
2.10. Cell Viability/Proliferation
MC3T3-E1 cells were seeded in 24-well plates (1 × 10⁴ cells/well) containing culture media and CO3Ap (100 mg), either with or without the presence of FGF-2. At 1, 3, and 5 days, the WST-8 (Cell Counting Kit-8; Dojindo Laboratories, Kumamoto, Japan) was performed following the manufacturer’s protocol.
2.11. Quantitative RT-PCR
The expression levels of the osteoblastic differentiation markers, Runx2 and Sp7, were analyzed by quantitative RT-PCR (qRT-PCR) at 7 days. The total RNA of MC3T3-E1 cells cultured on the CO3Ap with/without FGF-2 was isolated with the RNeasy® Mini Kit (Qiagen, Valencia, CA, USA) according to the manufacturer’s instructions. qRT-PCR analysis was performed using the 7500 Fast Real Time PCR system (Thermo Fisher Scientific, Waltham, MA, USA). The used primer sequences are shown in Table 1. The primers were designed using Genbank (https://www.ncbi.nlm.nih.gov/genbank/, accessed on 19 March 2022). Measurement of GAPDH served as an internal control. Relative gene expression levels were estimated using the 2−∆∆Ct method.

Table 1.
Primer sequences used for the qRT-PCR in this study.
2.12. Statistical Analysis
The sample size was estimated based on 90% power with a 0.05 two-sided significance level, given a 10.5% difference in bone volume between groups and a standard deviation of 7% [42]. For each group, a sample size of 10 (defect site) was needed at each time point. Considering the dropout (10%), the final sample size was set at n = 11.
Differences in data from the micro-CT and histomorphometric assessments were sought by analysis of variance (ANOVA) with the Tukey post hoc test. Comparisons for immunohistochemical data were analyzed by the Kruskal–Wallis test with Dunn’s post-test. In the WST-8 assay, intragroup comparisons were performed by the Kruskal–Wallis test with Dunn’s post hoc test. Comparisons for the WST-8 assay and qRT-PCR were performed by the Mann–Whitney U test. A software package (Prism ver 7.05; GraphPad Software, San Diego, CA, USA) was used. A p-value less than 0.05 was considered statistically significant.
3. Results
Four rats died during surgery. Primary wound closure was observed in all animals at 2 weeks postoperatively.
3.1. Micro-CT Analysis
No flap dehiscence was observed after suturing, and the healing process proceeded normally. There was no evidence of CO3Ap leakage.
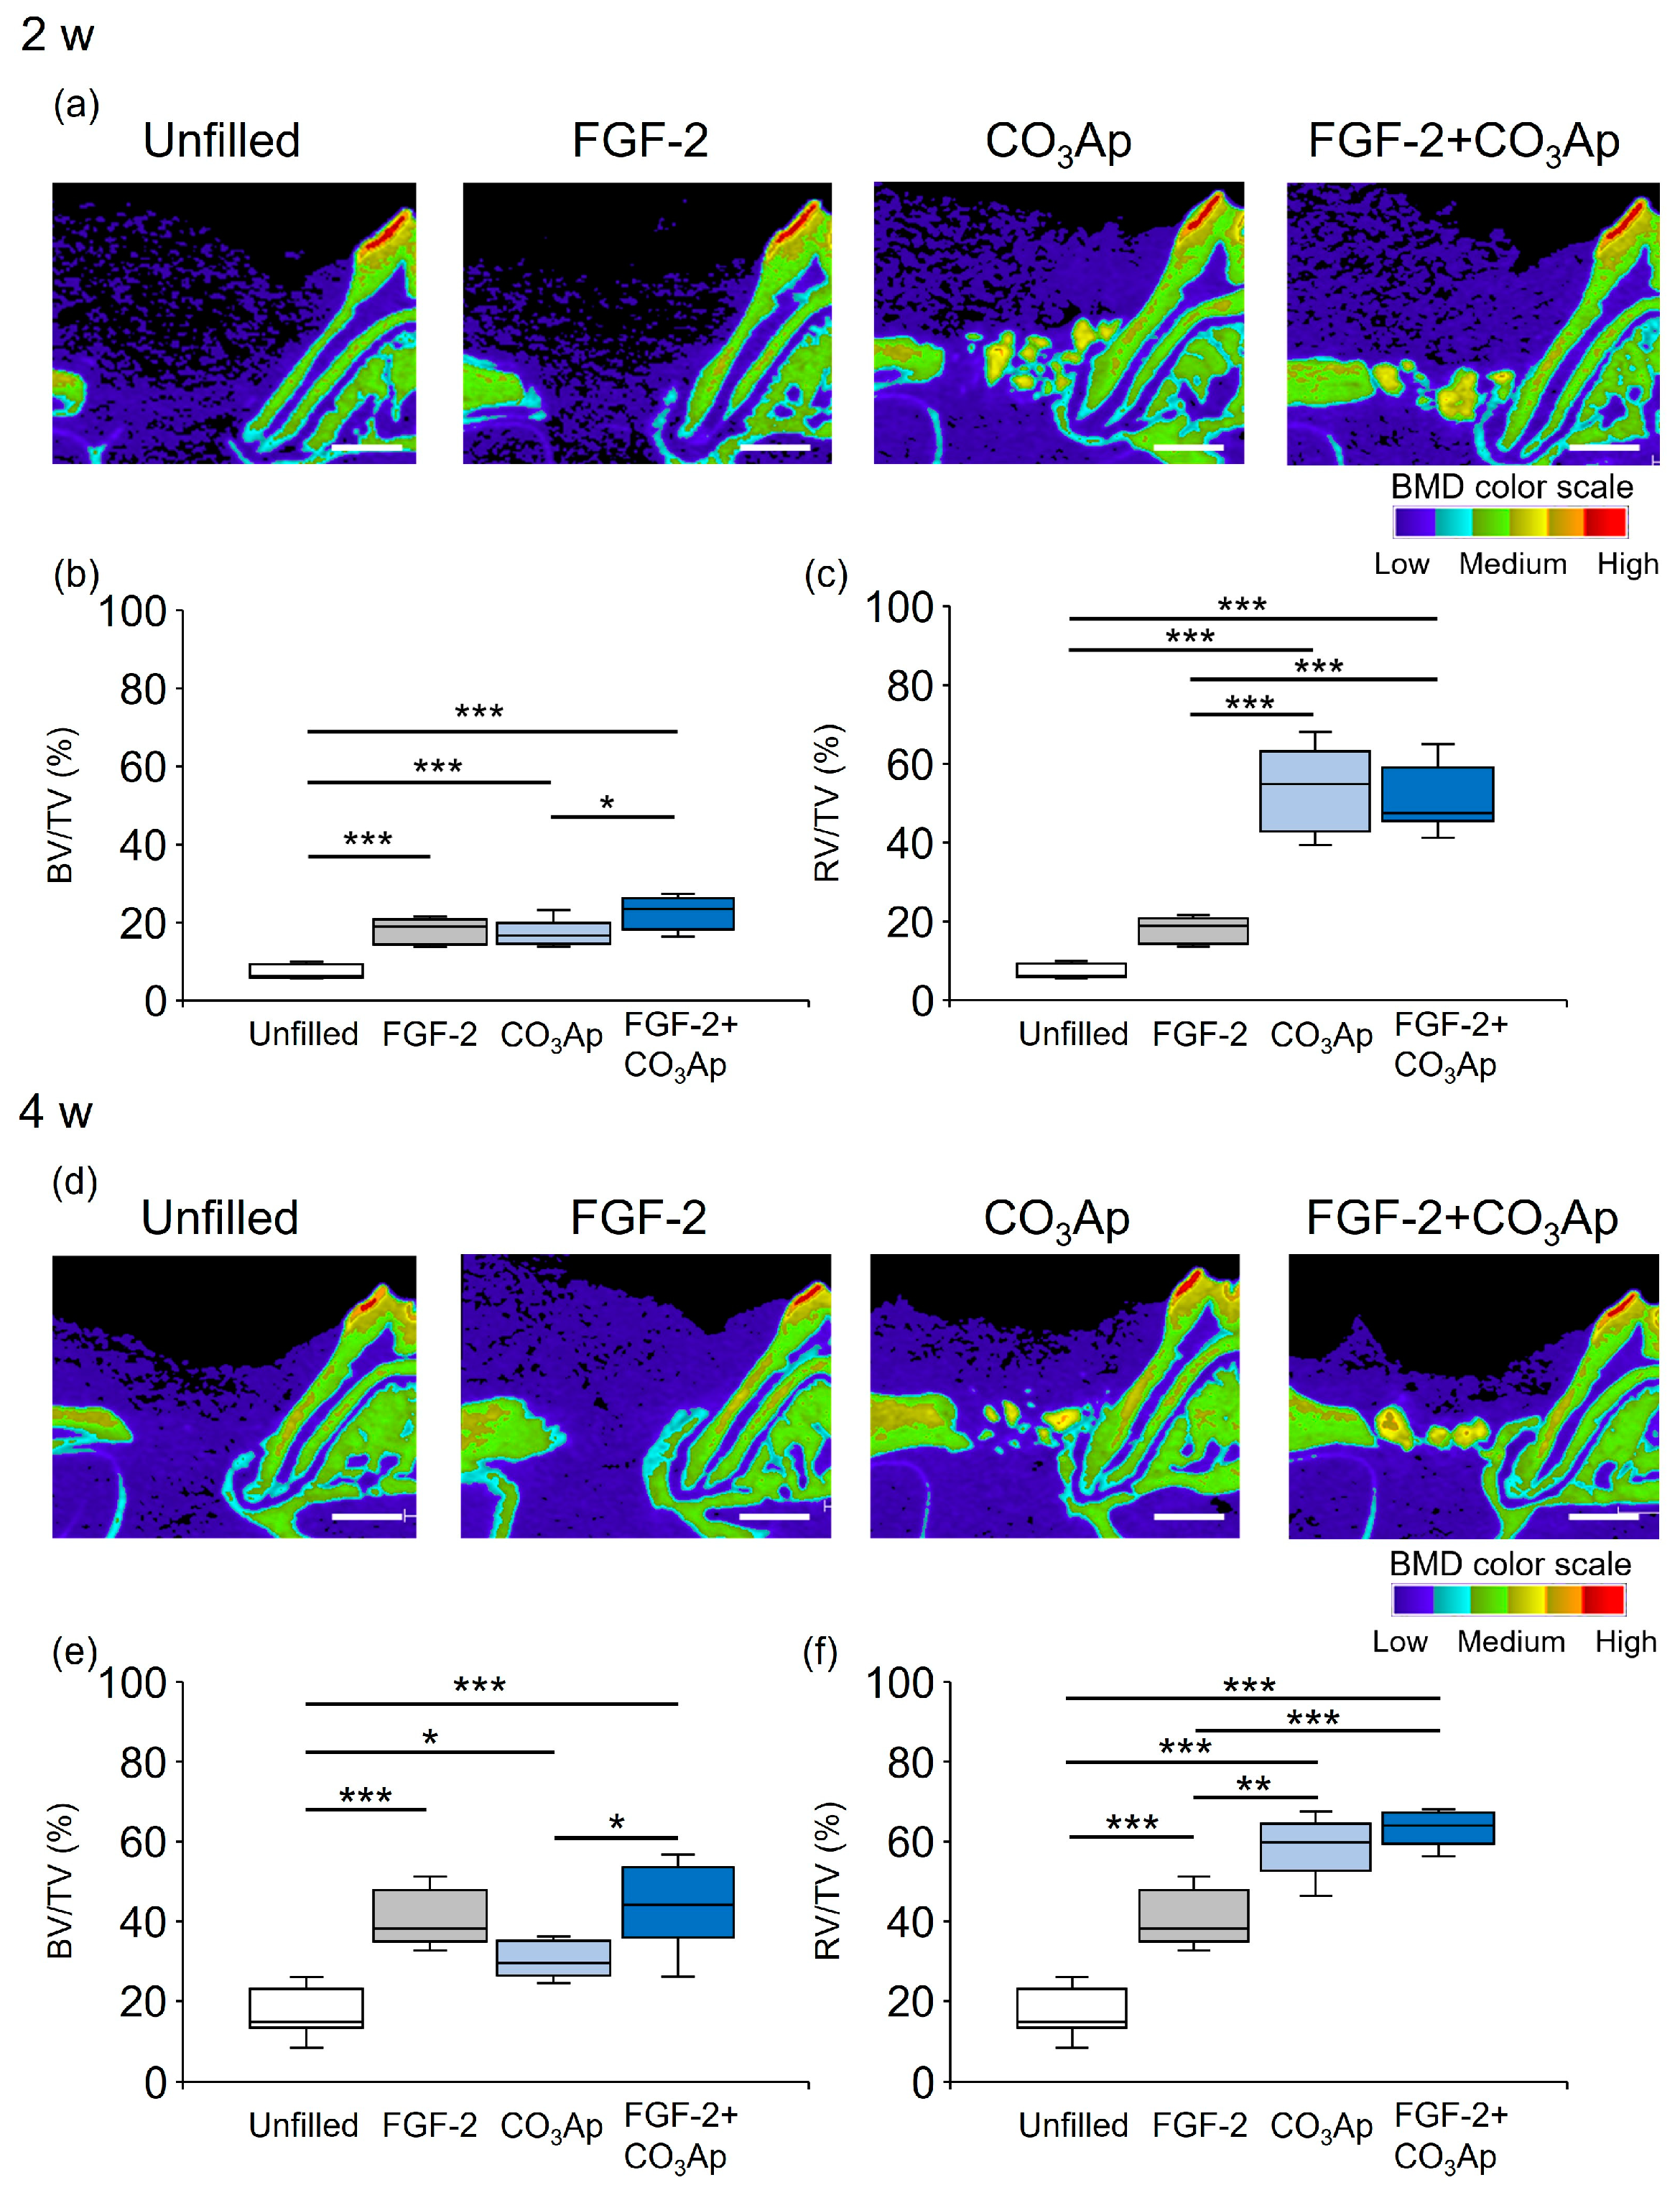
Sagittal slice images from micro-CT obtained at the 2-week mark restricted new bone formation in the Unfilled group, and low BMD structures were observed around the CO3Ap (Figure 1a). Novel bone formation was observed adjacent to the root in the FGF-2 group. The presence of CO3Ap particles and the new bone formation were observed near the root within the CO3Ap and FGF-2 + CO3Ap groups.
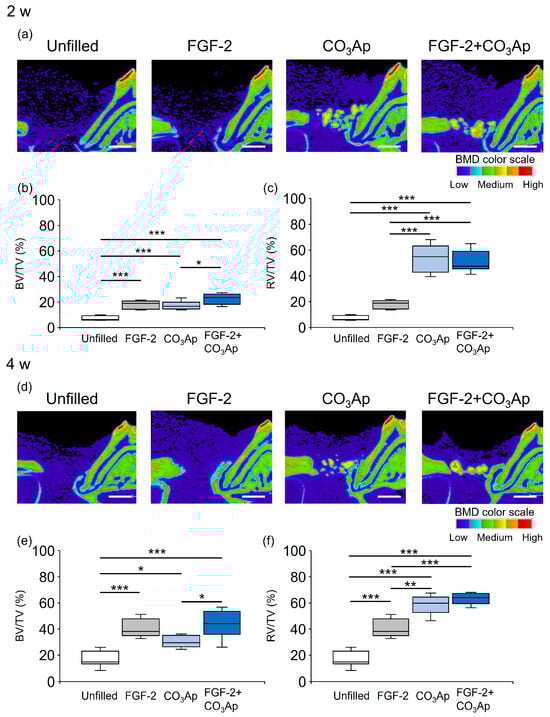
Figure 1.
Micro-CT images and quantification analysis. The color scale indicates bone mineral density (BMD): light blue and purple, low; yellow and green, medium; and red and orange, high. (a,d) Sagittal images from micro-CT (bar = 1000 µm). (b,c,e,f) Quantitative data. Bone volume (BV)/total volume (TV) within the ROI (b,e) and radiopaque volume of newly formed bone and CO3Ap particles (RV)/total volume (TV) (c,f) were compared between groups. Data are presented as box-and-whiskers plots with maximum, median, minimum, and 75th and 25th percentiles (n = 10). * p < 0.05, ** p < 0.01, *** p < 0.001 by ANOVA with Tukey post hoc test.
Figure 1b illustrates the quantitative analysis of the newly formed bone (excluding CO3Ap within the ROI) at 2 weeks. The BV/TV values in the FGF-2 + CO3Ap group were significantly higher than those in the CO3Ap group, but there was no significant difference from the FGF-2 group. The values in the FGF-2, CO3Ap, and FGF-2 + CO3Ap groups were significantly higher than those in the Uunfilled group. The ratio of the total radiopaque volume (newly formed bone and residual CO3Ap) to the total volume (RV/TV) was assessed (Figure 1c). The RV/TV values in the CO3Ap and FGF-2 + CO3Ap groups were higher than those in the Unfilled or FGF-2 groups.
At 4 weeks, new bone formation remained restricted in the Unfilled group, while there was an apparent enhancement in the other experimental groups (Figure 1d). The BV/TV values in the FGF-2 + CO3Ap group were significantly higher than those in the CO3Ap group, but there was no significant difference from the FGF-2 group. The values in the FGF-2, CO3Ap, and FGF-2 + CO3Ap groups were significantly higher than those in the Unfilled group (Figure 1e). The RV/TV values in the CO3Ap and FGF-2 + CO3Ap groups were significantly higher than those in the Unfilled or FGF-2 groups (Figure 1f).
3.2. Histological Analysis
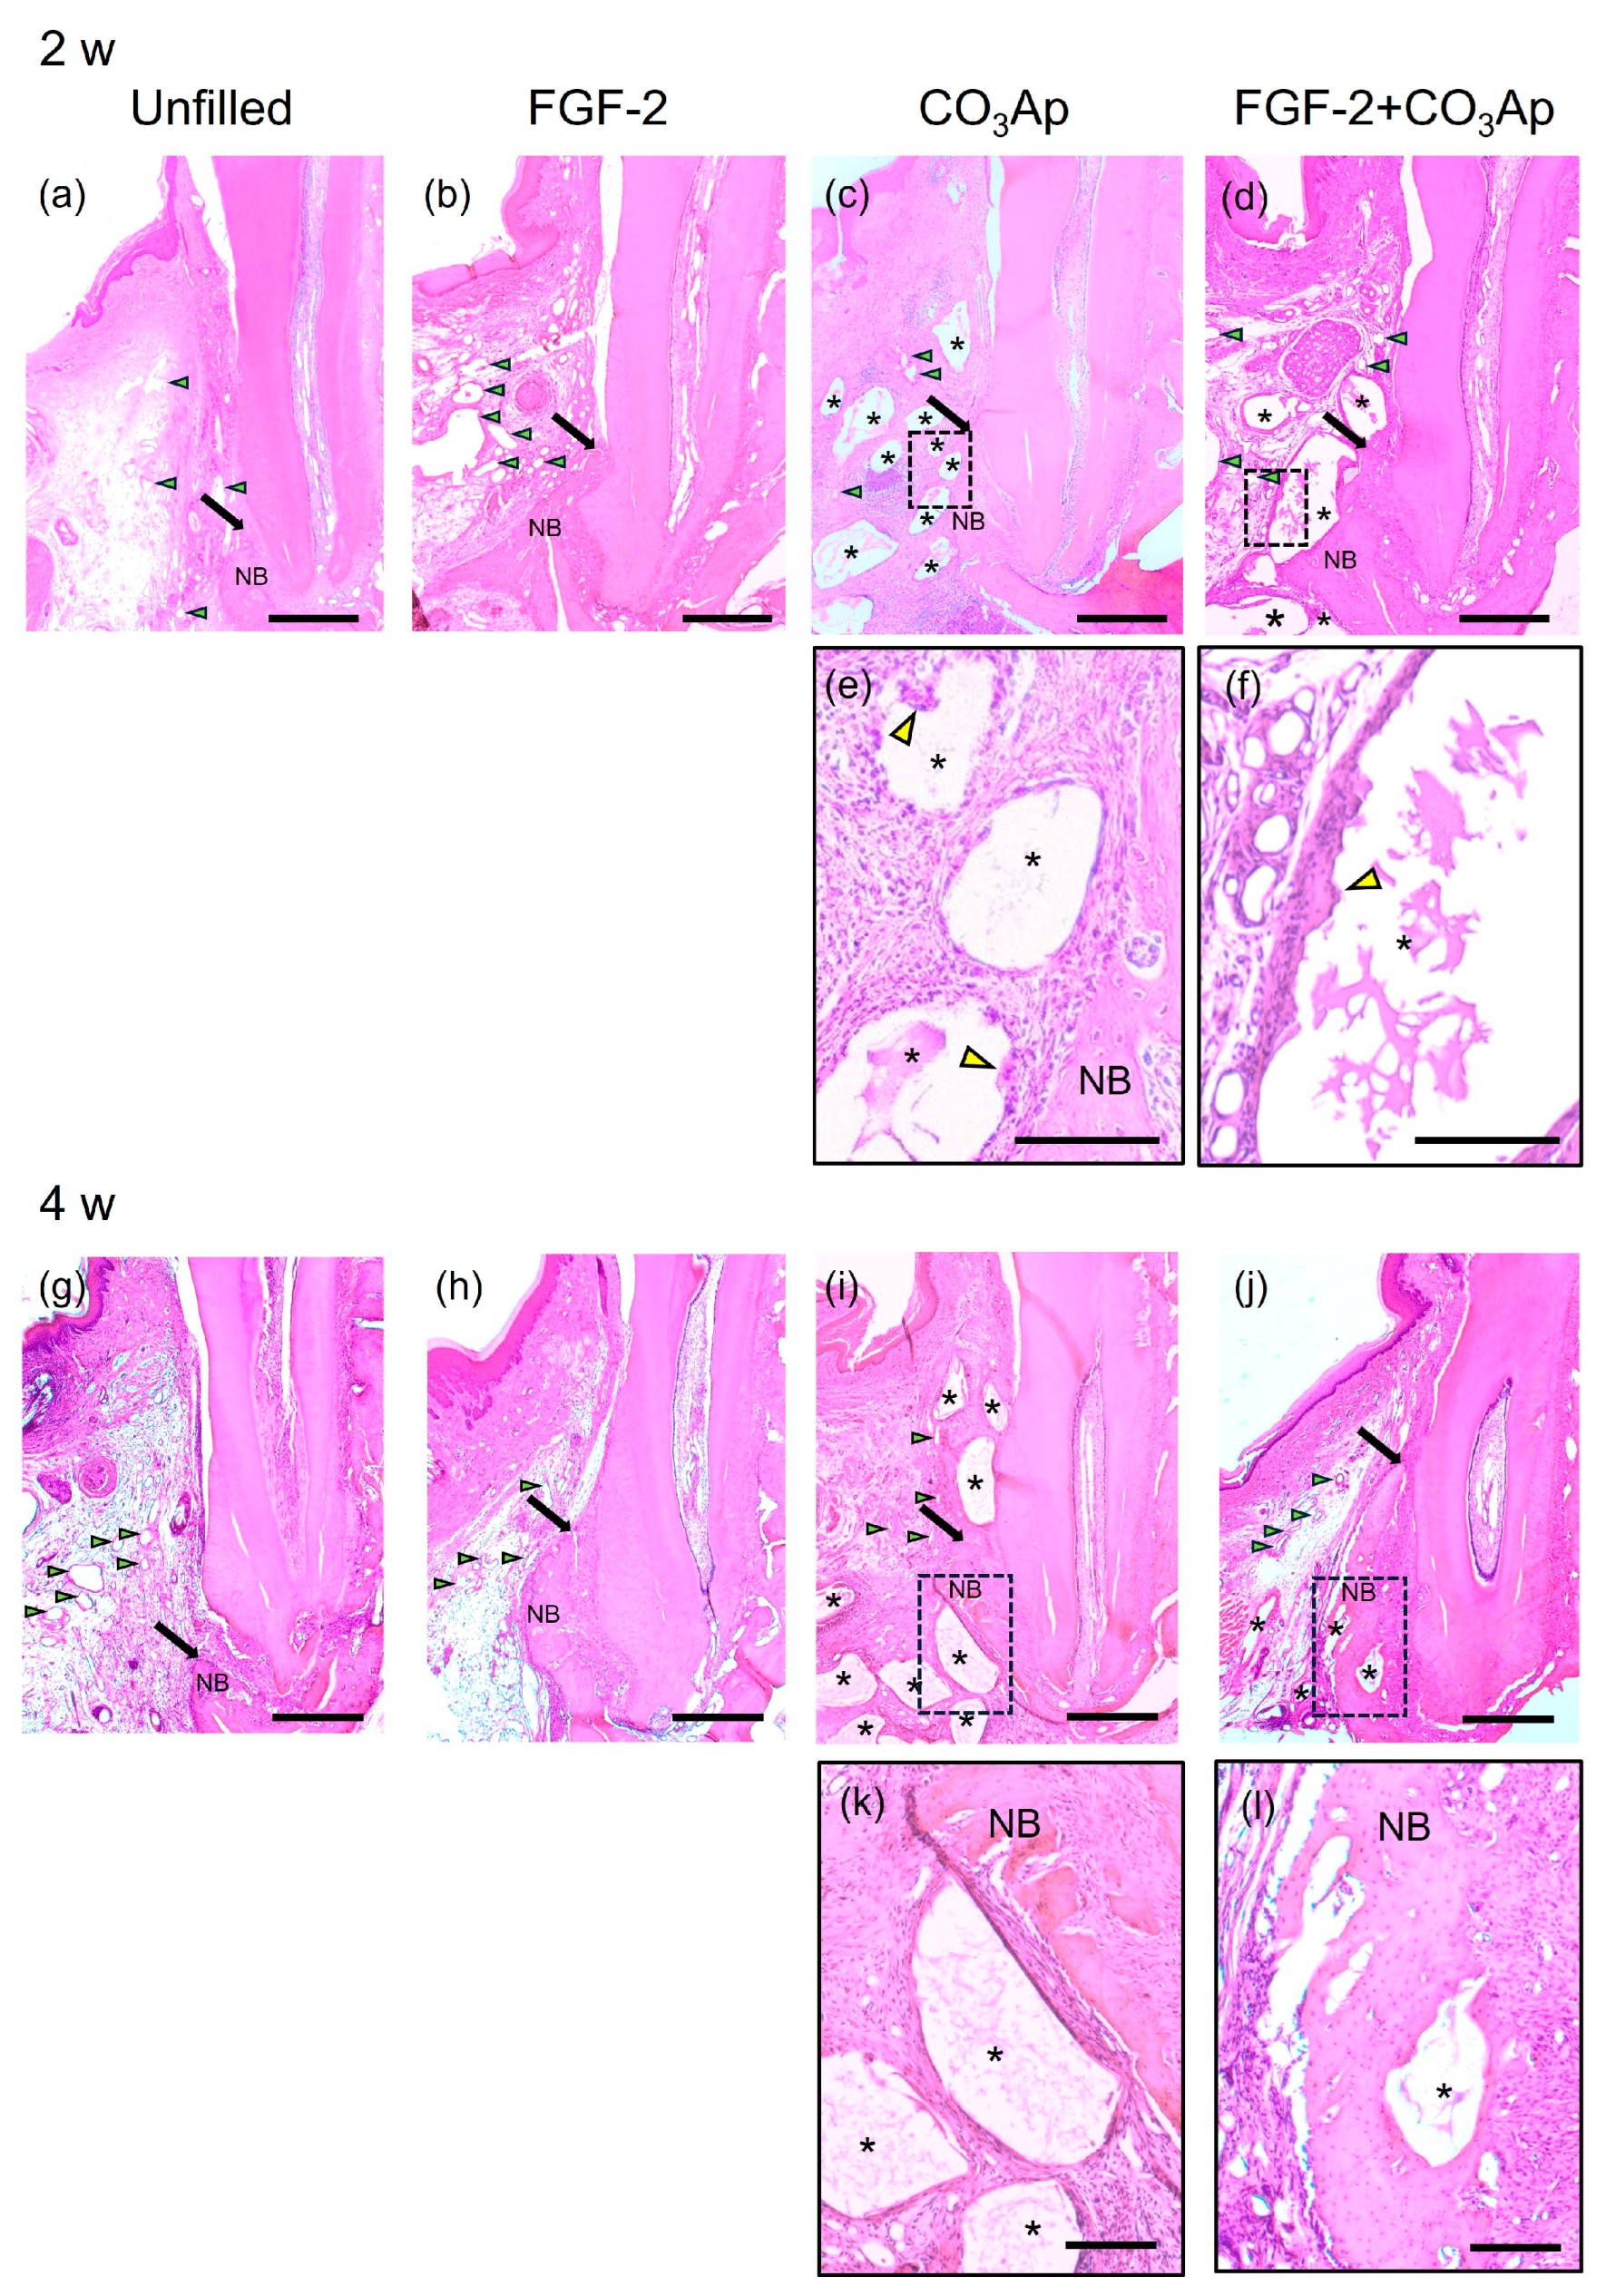
At 2 and 4 weeks postoperatively, in all groups, the previous defect area was filled with newly formed connective tissue and vascular-like structures, while different levels of new bone formation was observed near the Root side(Figure 2). At 2 weeks, CO3Ap granules were observed in the CO3Ap and FGF-2 + CO3Ap groups (Figure 2c,d,i,j). Fibrous connective tissue surrounded the CO3Ap granules, with the presence of multinucleated giant cells (Figure 2e,f). The FGF-2 applied groups showed a tendency for more pronounced vascular-like structures compared with the non-applied groups at 2 weeks (Figure 2a–d).
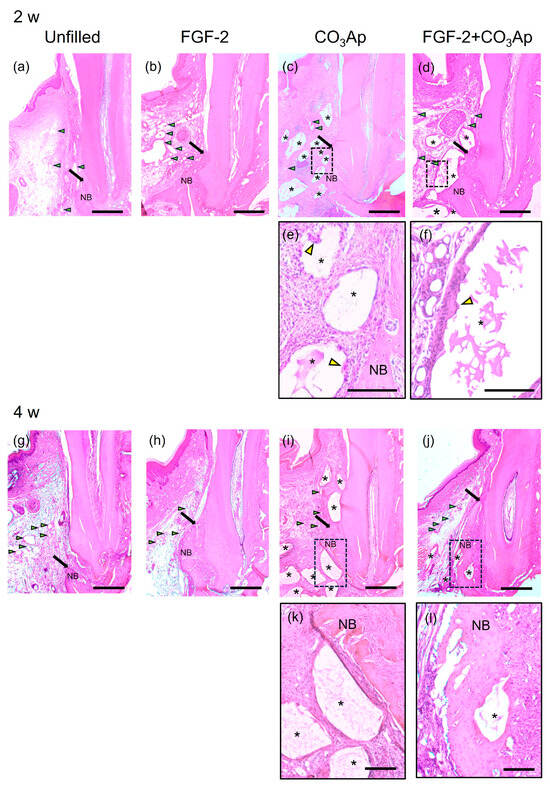
Figure 2.
Histopathological analysis. (a–d) Images at 2 weeks (original magnification ×25; bar = 500 µm; green arrowheads indicate the blood vessels; black arrows indicate the most coronal position of newly formed bone; yellow arrowheads indicate multinucleated giant cell; NB, newly formed bone; asterisk indicates CO3Ap particle). (a) The Unfilled group shows minimal new bone formation. (b–d) In the FGF-2, CO3Ap, and FGF-2 + CO3Ap groups, novel bone can be observed in the Root side of the intrabony defect. (e,f) Higher-magnification images of the framed area in the corresponding group (original magnification ×100; scale bar = 200 µm). Fibrous connective tissue surrounded the CO3Ap granules, with the presence of a multinucleated giant cell observed. (g–j) Images at 4 weeks (original magnification ×25; bar = 500 µm). (e) The Unfilled group exhibits limited new bone formation. (h–j) Newly formed bone in the FGF-2, CO3Ap, and FGF-2 + CO3Ap groups appears to be greater compared with the Unfilled group. (k,l) At 4 weeks, an enlarged image of the framed area was captured (original magnification ×100; scale bar = 200 µm).
In the FGF-2, CO3Ap, and FGF-2 + CO3Ap groups, more progressed new bone formation was observed along the root than the Unfilled group at 2 and 4 weeks (Figure 2a–d,g–j). At 4 weeks, in the FGF-2 + CO3Ap group, the level of newly formed bone was the greatest among groups, and the CO3Ap particles positioned near the root of the previous defect were incorporated in the newly formed bone (Figure 2l). There were no signs of ankylosis.
In the histomorphometric analysis of relative new bone height, the FGF-2, CO3Ap, and FGF-2 + CO3Ap groups exhibited significantly greater values than the Unfilled group at 2 and 4 weeks (Supplementary Figure S4). At 2 weeks, the FGF-2 and FGF-2 + CO3Ap groups showed significantly higher levels than the CO3Ap group (Figure S4a). At 4 weeks, the FGF-2 + CO3Ap group demonstrated significantly higher levels compared with the FGF-2 and CO3Ap groups (Figure S4b).
3.3. Immunohistochemical Analyses
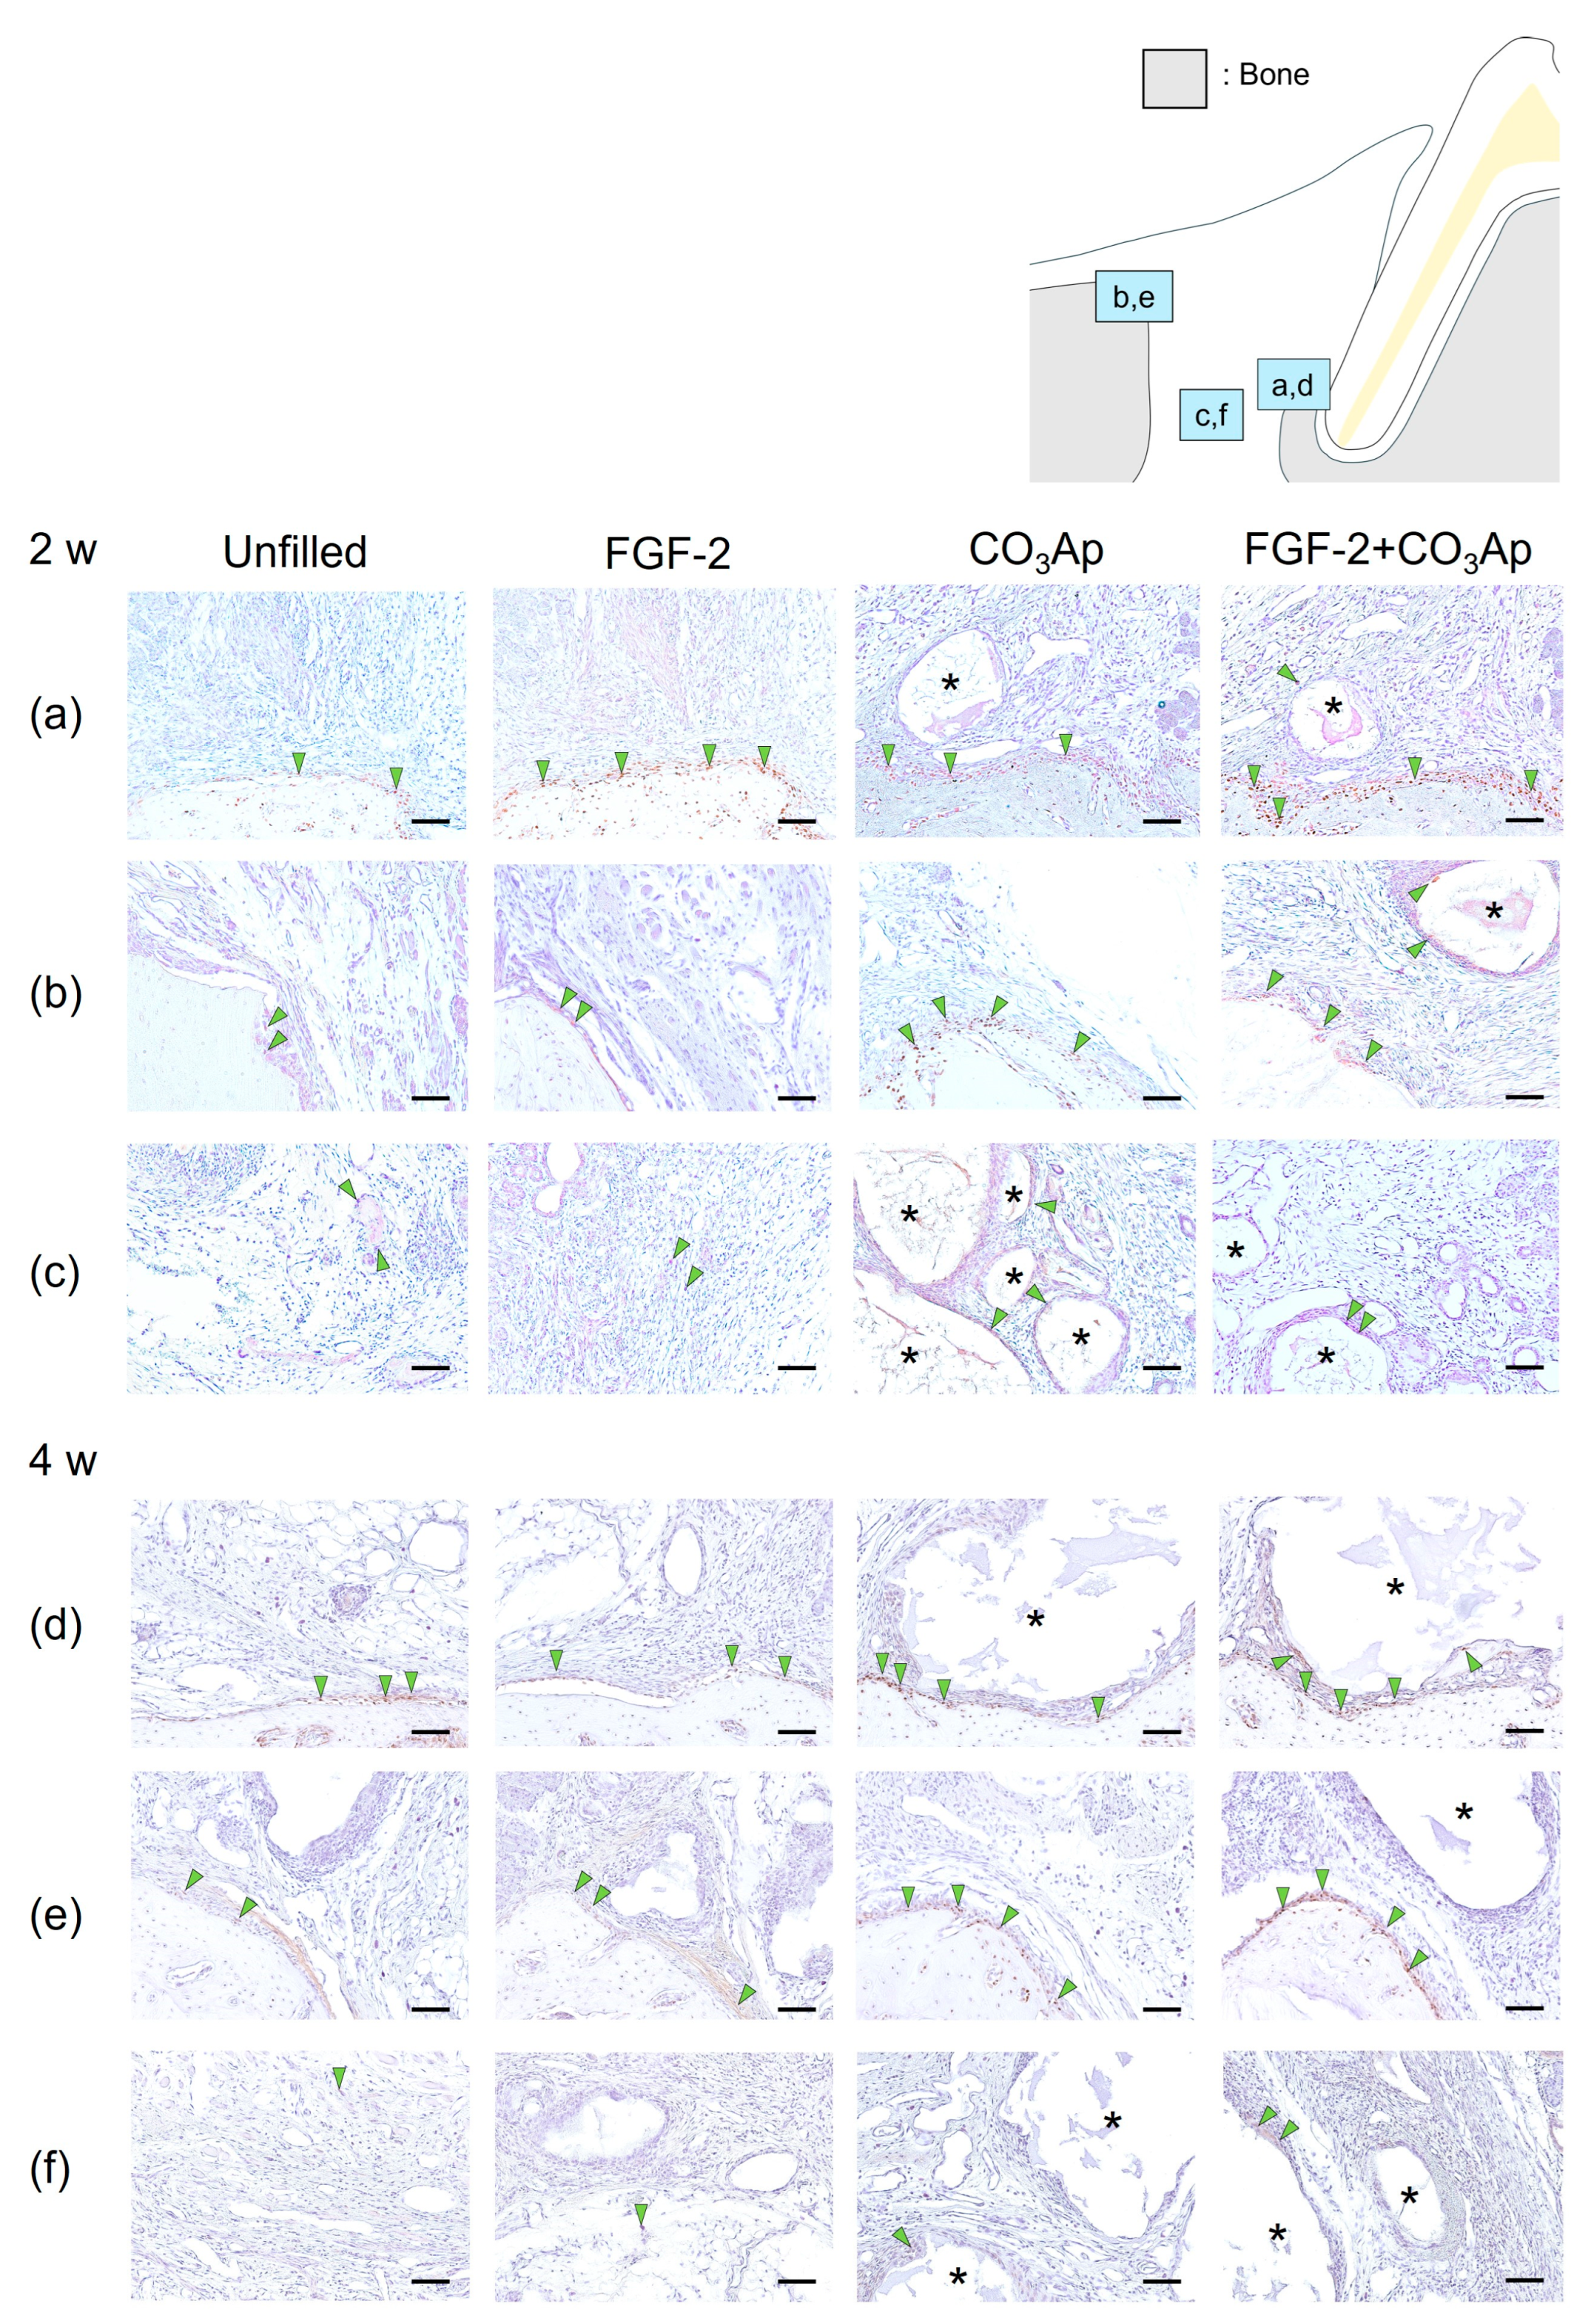
At 2 weeks, Osx-positive cells were frequently observed on the surface of newly formed bonein the Root side (Figure 3a,d), as well as on the existing bone in the Bone side (Figure 3b,e) and around the CO3Ap particles.
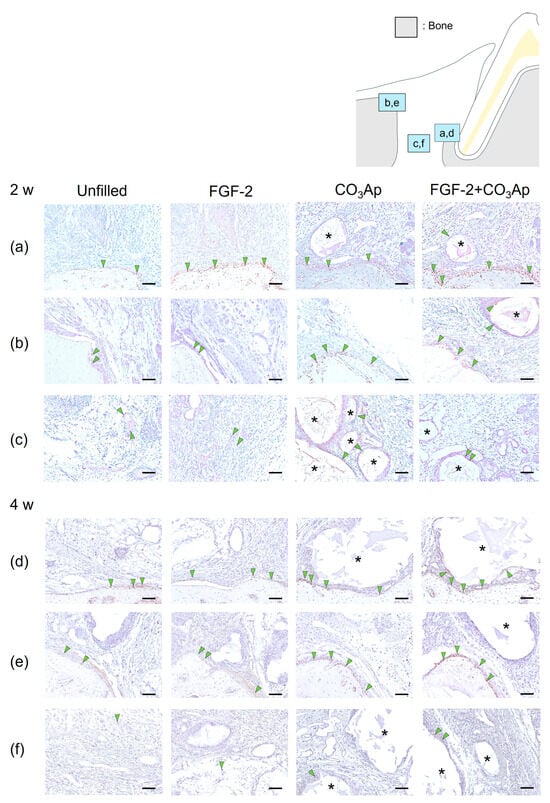
Figure 3.
Immunohistochemistry for Osx. Positive cells are assessed in the Root side (a,d), Bone side (b,e), and Middle area (c,f). A brown coloration shows an Osx-positive reaction (arrowheads indicate the general location of the positive cells). At 2 weeks (a–c), the Osx-positive cells were observed in new bone and existing bone and around CO3Ap. At 4 weeks (d–f), the number of Osx-positive cells in the Root side and Bone side appears to be greater in the FGF-2 + CO3Ap group compared with the Unfilled group. (Osx and counterstaining with Mayer’s hematoxylin stain, original magnification ×200; bar = 50 µm; asterisk shows CO3Ap particles.)
Regarding the results from the quantitative analysis at 2 weeks postoperatively, in the Root side, the ratio of Osx-positive cells in the FGF-2 + CO3Ap group was found to be higher than that in both the Unfilled and CO3Ap groups (Table 2). On the Bone side, the ratio in both the CO3Ap and FGF-2 + CO3Ap groups exceeded that in the Unfilled group.
Table 2.
Quantitative analysis of the Osx and OCN-positive cells.
Within the Middle area (Figure 3c), the FGF-2 + CO3Ap group exhibited a higher ratio compared with the Unfilled group. In intragroup comparisons, within the FGF-2 group, the ratio of Osx-positive cells on the Root side was significantly higher compared with the Bone side and the Middle area. In the CO3Ap and FGF-2 + CO3Ap groups, within the Root side, the ratio was significantly higher compared with the Middle area.
At 4 weeks, there appeared to be a higher presence of Osx-positive cells on the existing bone surface of the Bone side (Figure 3e) compared with that at 2 weeks (Figure 3b). The ratio of Osx-positive cells in the FGF-2 + CO3Ap group was significantly higher than the Unfilled group in the Root side, Bone side, and Middle area (Figure 3f, Table 2). In intragroup comparisons, within the unfilled group, the ratio of Osx-positive cells on the Bone side was significantly higher compared with the Middle area (Table 2). Additionally, in the FGF-2 and CO3Ap groups, the ratio of Osx-positive cells on both the Root side and the Bone side was significantly higher than the Middle area.
Furthermore, in the Unfilled, FGF-2, CO3Ap, and FGF-2 + CO3Ap groups, the ratio of Osx-positive cells exhibited an increasing trend compared with the 2 weeks measurement in all area. The Bone side demonstrated the most pronounced increase in positive cell ratio.
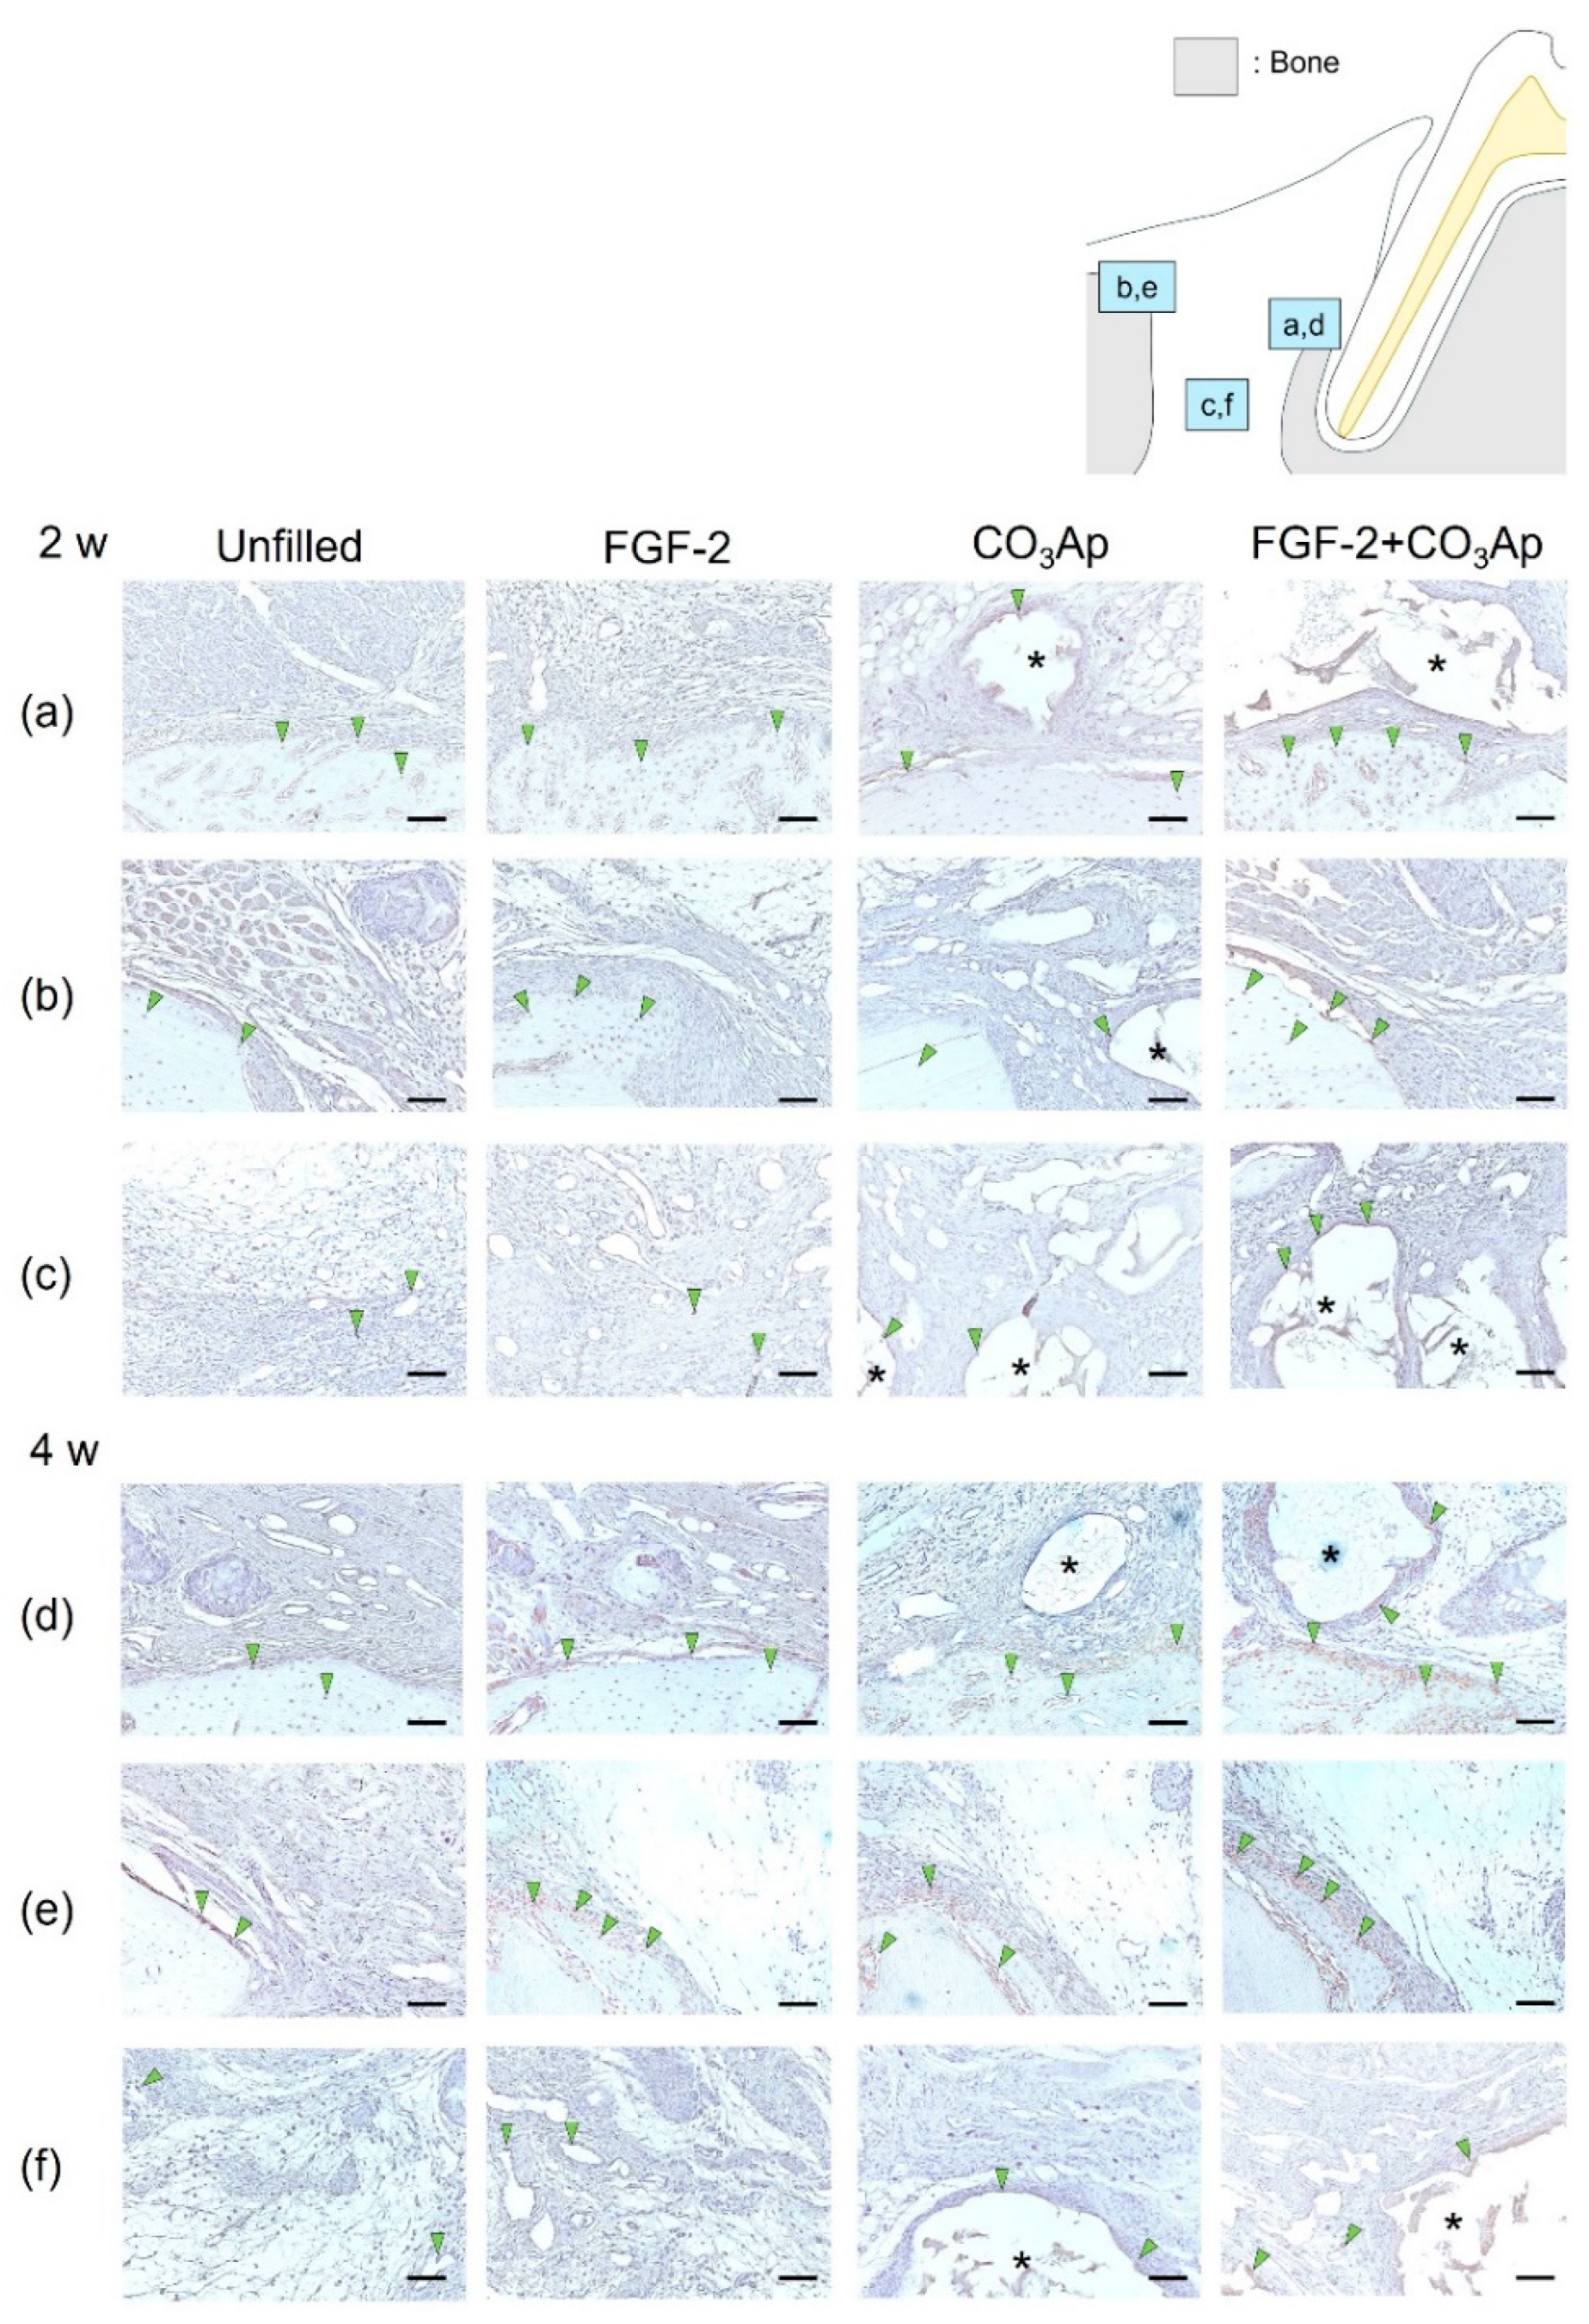
OCN-positive cells were frequently observed within the newly formed bone on the Root side (Figure 4a,d), within the existing bone on the Bone side (Figure 4b,e), and on the surface of the CO3Ap particles. The quantitative analysis revealed that at 2 weeks postoperatively, the ratio of OCN-positive cells in the Root side was significantly higher in the FGF-2 + CO3Ap group compared with the Unfilled group (Table 2). Furthermore, in the Bone side (Figure 4b) and in the Middle area (Figure 4c), the FGF-2 group exhibited a significantly higher the ratio of OCN-positive cells than the Unfilled group (Table 2). The FGF-2 + CO3Ap group showed a significant increase compared with the Unfilled and CO3Ap groups. In intragroup comparisons, in the CO3Ap group, the ratio of OCN-positive cells in the Root side was significantly higher than the Bone side and Middle area (Table 2).
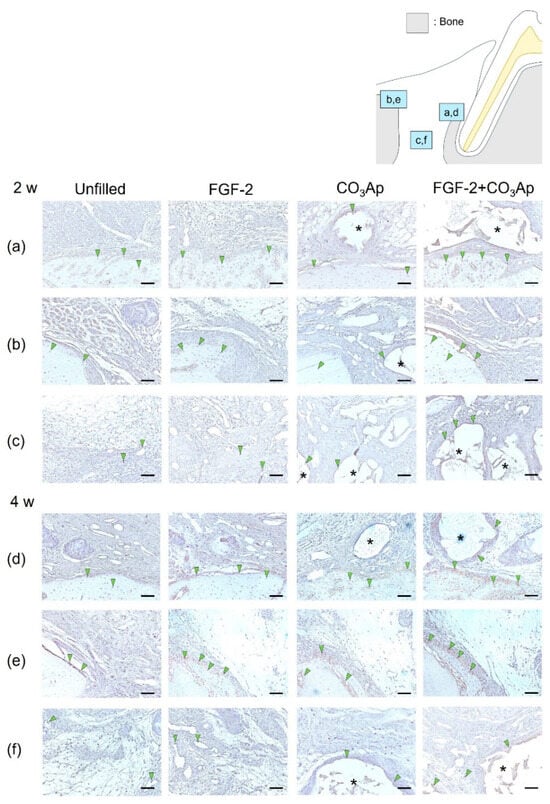
Figure 4.
Immunohistochemical staining for OCN. Prevalence of OCN-positive cells is assessed in the Root side (a,d), Bone side (b,e), and Middle area (c,f). A brown coloration shows an OCN-positive reaction (arrowheads indicate the general location of the positive cells). At 2 weeks (a–c), the OCN-positive cells were observed in new bone, existing bone, and CO3Ap. At 4 weeks (d–f), the number of OCN-positive cells in the Root side and Middle area appears to be greater in the FGF-2 + CO3Ap groups compared with the Unfilled group. (OCN and counterstaining with Mayer’s hematoxylin stain, original magnification ×200; bar = 50 µm; asterisk indicates CO3Ap particles.)
At 4 weeks, in the Root side (Figure 4d), the ratio of OCN-positive cells in the FGF-2 + CO3Ap group was significantly higher than the Unfilled group (Table 2). In the Bone side (Figure 4e), the ratio of OCN-positive cells in the FGF-2 group was significantly higher compared with the Unfilled and CO3Ap groups (Table 2). In the Middle area (Figure 4f), the FGF-2 group showed a significant increase compared with the Unfilled group, while the FGF-2 + CO3Ap group showed a significant increase compared with the Unfilled and CO3Ap groups. In intragroup comparisons, the ratio of OCN-positive cells in the Bone side was significantly higher than the Middle area in the Unfilled and FGF-2 groups. Additionally, for the CO3Ap and FGF-2 + CO3Ap groups, the ratio of OCN-positive cells in the Root side was significantly higher compared with the Middle area. The ratio of OCN-positive cells exhibited an increasing trend at 4 weeks compared with 2 weeks postoperatively. In the CO3Ap and FGF-2 + CO3Ap groups, there was a tendency for a higher OCN-positive ratio in the Root side (Figure 4d), while in the Unfilled and FGF-2 groups, the Bone side (Figure 4e) showed a tendency for a higher OCN-positive ratio.
3.4. In Vitro Cell Morphology and Spreading
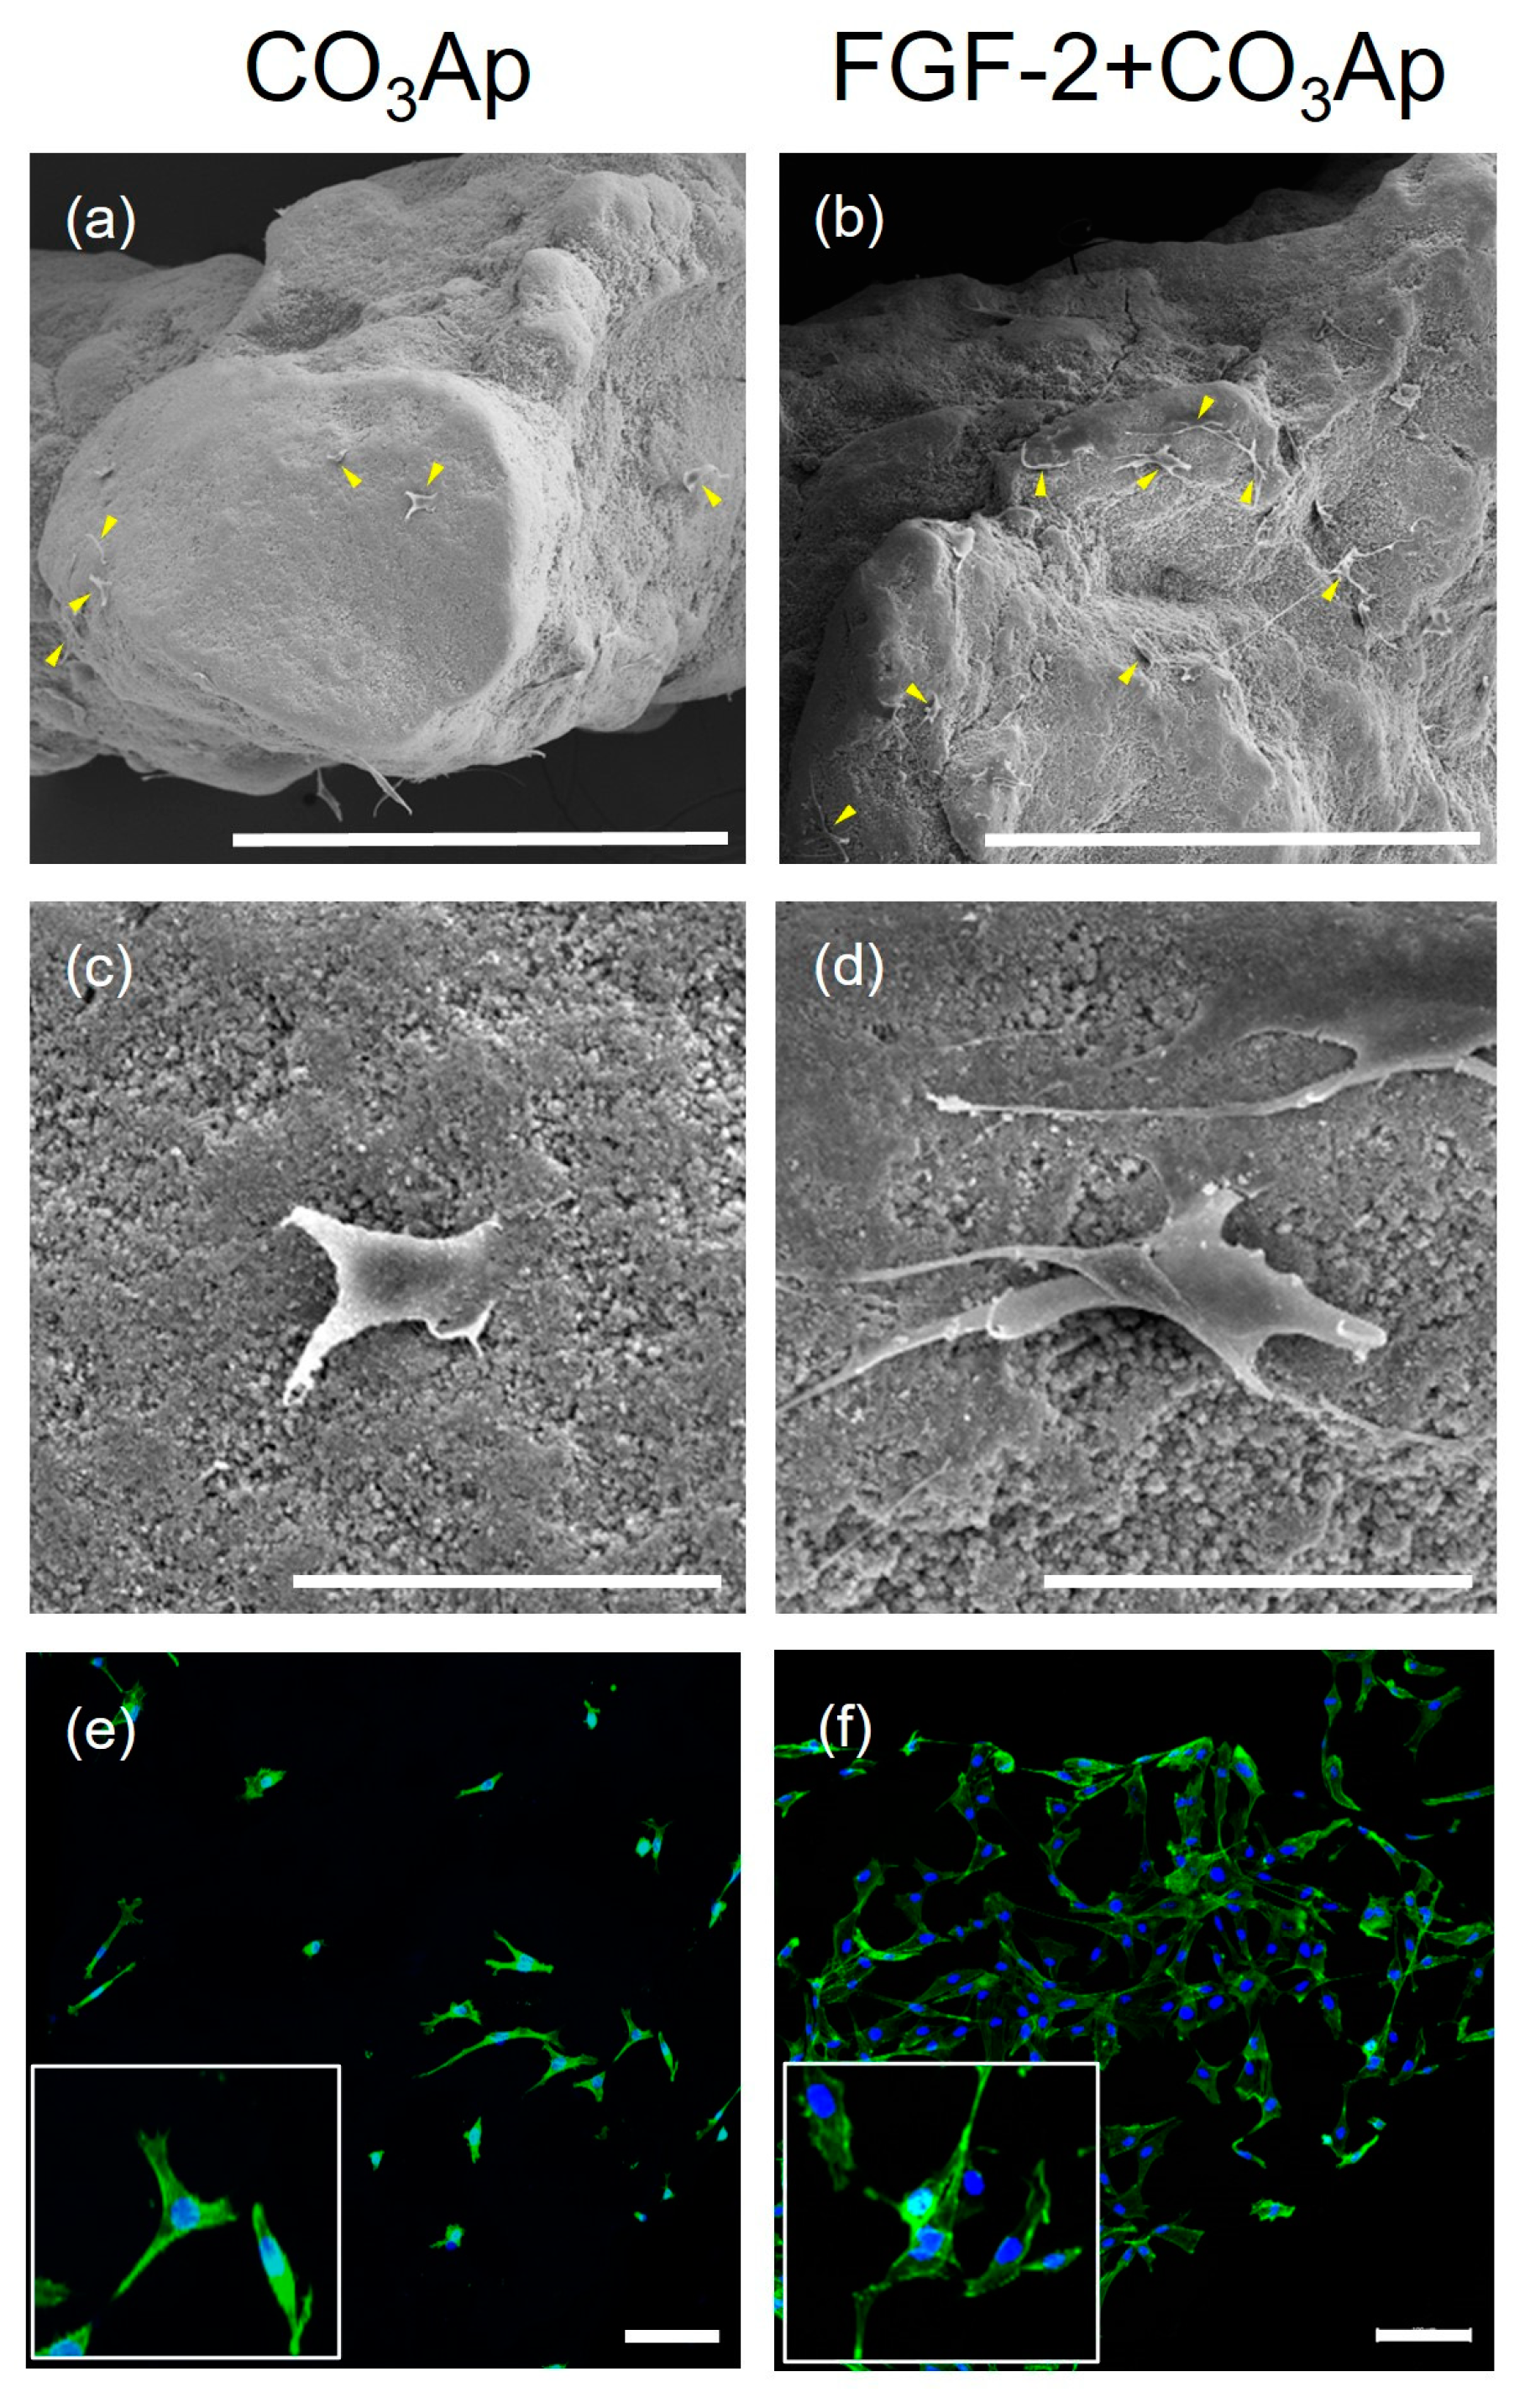
SEM images showed MC3T3-E1 cells adhering to the CO3Ap and FGF-2-treated CO3Ap surfaces (Figure 5a–d). In the FGF-2 + CO3Ap group, a greater level of cell attachment was observed compared with the CO3Ap group. FGF-2 induced a greater level of cell attachment and more elongated cells compared with the non-applied group (Figure 5c,d).
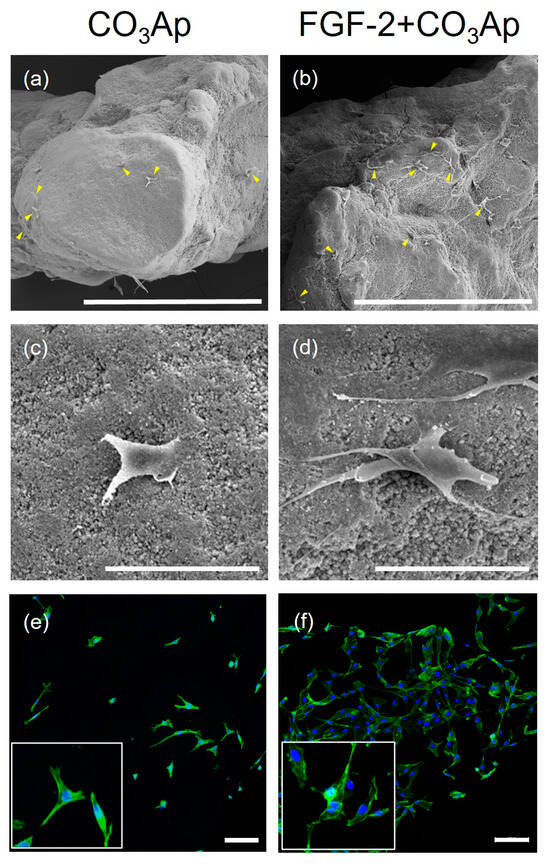
Figure 5.
MC3T3-E1 cells cultured on the CO3Ap with/without FGF-2. SEM images show that MC3T3-E1 attached to the CO3Ap (a,c) and FGF-2 + CO3Ap (b,d) at 24 h. (a–d) A greater number of cells appear to be attached to the FGF-2-treated CO3Ap compared with CO3Ap. In the FGF-2 + CO3Ap group, cell protrusions are more evident compared with the CO3Ap group. (a,b) Original magnification ×130; bar = 400 μm. (c,d) Original magnification ×1000; bar = 50 μm. Yellow arrowheads indicate MC3T3-E1. CLSM images reveal cells stained for actin (green) and the nucleus (blue) at 24 h (e,f). Higher-magnification images are shown in the insets. Compared with the CO3Ap group (e), a greater number of attached cells are observed in the FGF-2 + CO3Ap group (f). (Original magnification ×100; bar = 100 μm.)
Similarly, analysis of CLSM images revealed that a greater number of cells adhered to and spread on the scaffold in the FGF-2 + CO3Ap group, when compared with the CO3Ap group (Figure 5e,f).
3.5. FGF-2 Release
When the FGF-2 release kinetics from the FGF-2-treated CO3Ap was assessed using ELISA, FGF-2 continued to be released up to 120 h, reaching approximately 682 pg/mL in total release (Supplementary Figure S5), which was approximately 92% of the total amount released.
3.6. Cell Viability/Proliferation
The FGF-2 + CO3Ap group exhibited significantly higher viability/proliferation compared with the CO3Ap group at 1, 3, and 5 days of incubation (Figure 6). The CO3Ap and FGF-2 + CO3Ap groups showed a significantly higher viability/proliferation at 5 days compared with one day.
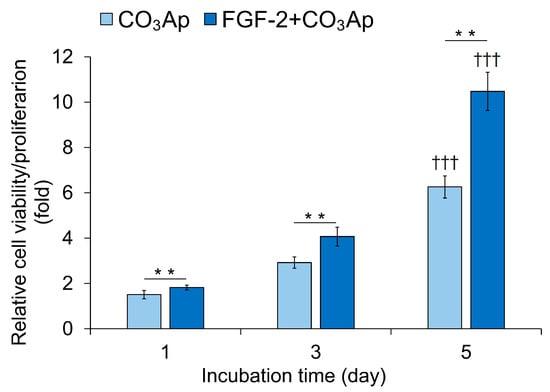
Figure 6.
Viability/proliferation of MC3T3-E1 cells. Cells were seeded onto the CO3Ap with/without FGF-2 in the culture media and allowed to grow for up to 5 days. The WST-8 assay was employed to assess cell viability and proliferation at the indicated time points. The reference absorbance at 450 nm was subtracted from the absorbance of each sample, and the resulting values were expressed relative to those at 0 h. The FGF-2 + CO3Ap group exhibited significantly higher viability/proliferation compared with the CO3Ap group at 1, 3, and 5 days. Data are shown as mean ± SD (n = 6). ** p < 0.01, by Mann–Whitney U test. ††† p < 0.001 significant difference from one day values by Kruskal–Wallis test with Dunn’s post hoc test.
3.7. Expression of Runx2 and Sp7
The CO3Ap group demonstrated significantly higher gene expression levels of Runx2 and Sp7 than the FGF-2 + CO3Ap group at 7 days (Figure 7).
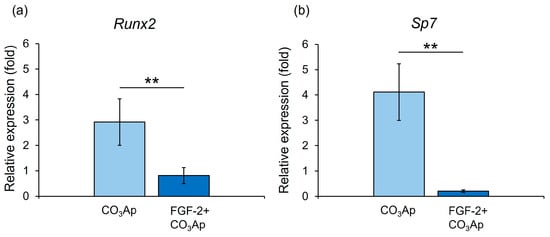
Figure 7.
qRT-PCR assessment of the expression levels of Runx2 and Sp7. Relative Runx2 (a) and Sp7 (b) expression levels in MC3T3-E1 cells on CO3Ap with/without FGF-2 at 7 days. The CO3Ap group demonstrated significantly higher expression levels of Runx2 and Sp7 compared with the FGF-2 + CO3Ap group at 7 days. The resulting values are expressed relative to the control group (control group; culture medium only). Data are presented as mean ± SD (n = 6). ** p < 0.01, by Mann–Whitney U test.
4. Discussion
In micro-CT analysis, FGF-2, CO3Ap, and FGF-2 + CO3Ap groups exhibited significantly higher BV/TV values compared with the Unfilled group. The FGF-2 + CO3Ap group showed significantly higher BV/TV values compared with the CO3Ap group. Histomorphometric observations revealed that the FGF-2 + CO3Ap group exhibited the highest levels of new bone. In previous studies, when CO3Ap was applied to periodontal defects in dogs, the amount of newly formed bone was significantly higher in the applied group compared with the non-applied group [22,29]. These results further support the osteoconductive property of CO3Ap and suggest that the addition of FGF-2 enhances bone formation when combined with CO3Ap.
When employing combination periodontal therapy with bone substitutes, it is important to note that micro-CT analysis of bone formation might underestimate its effect. This is attributed to the fact that the presence of residual material can restrict the volume data of new bone. In clinical studies, both newly formed bone and the remnants of bone substitutes are frequently employed as a metric for assessing outcomes [9,10,14]. Thus, we further assessed the total radiopaque volume (new bone + CO3Ap) per total volume (RV/TV). The RV/TV values were found to be significantly greater in the CO3Ap and FGF-2 + CO3Ap groups compared with the Unfilled and FGF-2 groups. This result was similar to the findings from the previous study using FGF-2 and DBBM [36]. In a preclinical study, the application of CO3Ap to periodontal defects resulted in an increase in the amount of newly formed bone [43]. These results suggest that CO3Ap functions as a scaffold in periodontal healing, and the elevated bone levels in the CO3Ap and FGF-2 + CO3Ap groups were attributed not only to the presence of CO3Ap but also to the initiation of novel bone formation.
Each treated site was divided into three areas to investigate the details of the healing processes by immunohistochemical analyses. At 2 weeks, Osx and OCN-positive cells were frequently seen in the Root side in the CO3Ap and FGF-2 + CO3Ap groups. On the other hand, in the FGF-2 group, Osx-positive cells were most prominently observed on the Root side, while OCN-positive cells were more abundant on the Bone side. Osx is recognized as an early marker for osteoblast differentiation, while OCN is considered a marker for later stages of differentiation [44,45]. At 4 weeks postoperatively, Osx and OCN-positive cells increased in all areas compared with at 2 weeks. Interestingly, Osx-positive cells were highly prevalent on the Bone side, while OCN-positive cells exhibited the highest level on the Root side in the CO3Ap and FGF-2 + CO3Ap groups. In the FGF-2 group, Osx and OCN-positive cells were more prominent on the Bone side compared with other areas, at 2 and 4 weeks. In a canine model, FGF-2 has been demonstrated to enhance cell proliferation and induce osteoblast differentiation after one week [46]. Furthermore, it has been reported that the cultivation of human bone marrow stem cells on CO3Ap results in a higher expression of osteoblast differentiation markers [20]. Based on these findings, it is suggested that CO3Ap has potential as a scaffold as well as carrier for FGF-2 during the observation period. Furthermore, adding CO3Ap to FGF-2 may promote cell proliferation in the periodontal defects, particularly in the Root side, which consequently contributed to osteoblastic differentiation.
In vitro, the addition of FGF-2 led to the observation of a greater number of cells, and these MC3T3-E1 cells appeared more elongated. The cells cultured on the CO3Ap with the addition of FGF-2 exhibited a significantly higher cell viability/proliferation compared with those cultured on CO3Ap. FGF-2 has been reported to enhance cell proliferation by increasing the expression of CD44, which is involved in cell adhesion and proliferation [47]. These findings suggest that FGF-2 promotes initial cell attachment and spreading on CO3Ap, contributing to cell proliferation. In our previous study, PDLCs on the FGF-2-treated DBBM exhibited increased viability/proliferation and showed longer lamellipodia-like cell protrusions than non-treated DBBM [36]. CO3Ap releases calcium ions, which promote the differentiation and proliferation of osteoblasts [48]. Furthermore, the addition of calcium ions to the Ti disk has been reported to increase cell adhesion within 24 h post-addition [49]. The release of calcium ions from CO3Ap may have facilitated the cell attachment. Taken together, it is possible that CO3Ap is a suitable scaffold to be used with FGF-2. Further investigations are needed to identify the most appropriate scaffold or carrier to be used with FGF-2.
The evaluation of FGF-2 release kinetics from FGF-2-treated CO3Ap revealed sustained release, over a period of 120 h. This finding was similar to findings from previous studies that investigated the addition of FGF-2 to bone graft materials [28,36]. The adsorption and sustained release of growth factors onto the surface of biomaterials have a profound influence on cell proliferation and osteoblast differentiation [50]. In vivo, FGF-2 exhibits a short half-life [51]. The increased cell proliferation and osteoblastic differentiation observed in the FGF-2-treated CO3Ap are presumed to be attributable to the release of FGF-2 adsorbed onto CO3Ap.
The addition of FGF-2 resulted in a decreased expression levels of Runx2 and Sp7 in MC3T3-E1 cells cultured on CO3Ap at 7 days. During the early stage of periodontal tissue healing, FGF-2 promotes cell proliferation in PDLCs while inhibiting their differentiation, and in the late phase, it facilitates their differentiation into osteoblast [3]. The in vitro and in vivo experiments conducted in this study yielded similar findings to those from the previous study. Taken together, it is suggested that FGF-2 promoted initial attachment to and proliferation on CO3Ap and regulated osteoblastic differentiation (suppression at the early phase and promotion at the later phase), which contributed to novel bone formation in the previous defect.
This study has several limitations. The grouping of in vivo and in vitro cell experiments was different. This is because the cell behaviors in a two-dimensional (2D) culture are different from those in a three-dimensional (3D) culture. Therefore, only the groups with the scaffold are used for in vitro experiments. Additional in vitro experiments are needed to prove the ability of the combination therapy to promote bone formation. To determine whether the combined use of FGF-2 and CO3Ap promotes overall periodontal regeneration, additional experiments with an extended observation period are necessary. Furthermore, a thorough understanding of the precise mechanism of the combined effects requires more detailed investigations at the molecular and genetic level.
However, the results from this study provide salient insight into the effectiveness of the combination regenerative therapy.
5. Conclusions
The combined application of FGF-2 and CO3Ap yielded enhanced healing in the periodontal defect. The addition of FGF-2 to CO3Ap promoted initial cell attachment to and proliferation on CO3Ap and regulated osteoblastic differentiation, thereby contributing to new bone formation from near the root.
Clinical significance
- ⮚
- Information is still limited regarding the performance of combination regenerative therapy using FGF-2 and CO3Ap.
- ⮚
- Combined use of FGF-2 and CO3Ap yielded enhanced healing in the surgically created periodontal defects.
- ⮚
- Biofunctionalization of CO3Ap with FGF-2 may enhance periodontal healing via promotion of cell proliferation, angiogenesis, and regulation of osteogenic differentiation.
Supplementary Materials
The following supporting information can be downloaded at https://www.mdpi.com/article/10.3390/biomedicines12081664/s1: Figure S1: An overview of the experiments; Figure S2: In vivo protocol and surgical creation of periodontal defects (FGF-2 + CO3Ap group); Figure S3: Measurement method of relative new bone height for histomorphometric analysis; Figure S4: Histomorphometric assessment of relative new bone height; Figure S5: Kinetics of FGF-2 cumulative release from the FGF-2-treated CO3Ap.
Author Contributions
Conceptualization, A.S.; methodology, A.S., T.M., T.B. and F.S.; formal analysis, A.S., N.M. and F.S.; in vivo experiments, N.M., S.M. and T.M.; in vitro experiments, N.M., S.M., T.M. and K.I.; draft preparation, A.S. and N.M.; review and editing, S.M., T.M., K.I., T.B., F.S. and A.S. All authors have read and agreed to the published version of the manuscript.
Funding
This work was supported in part by Japan Society for the Promotion of Science (JSPS) KAKENHI (22K21001).
Institutional Review Board Statement
The experimental procedures conformed to the Treatment of Experimental Animals at Tokyo Dental College (approval number 232205). This study adheres to the ARRIVE guidelines (https://arriveguidelines.org/, accessed on 5 April 2022).
Informed Consent Statement
Not applicable.
Data Availability Statement
The data that support the findings of this study are available from the corresponding author upon reasonable request.
Acknowledgments
The authors are grateful to Daisuke Matsugami and Wataru Yoshida for technical instructions and helpful discussions. The authors thank Katsumi Tadokoro for technical assistance. Special thanks go to the members of Department of Periodontology, Tokyo Dental College, for their support and encouragement.
Conflicts of Interest
Kaken Pharmaceutical Co., Ltd., Tokyo, Japan, supplied FGF-2. The supplier and funders had no role in the study design; in the collection, interpretation, or analyses of data; in the writing of the manuscript; or in the decision to publish the results.
References
- Hajishengallis, G. Interconnection of periodontal disease and comorbidities: Evidence, mechanisms, and implications. Periodontol 2000 2022, 89, 9–18. [Google Scholar] [CrossRef]
- Saito, A.; Hosaka, Y.; Kikuchi, M.; Akamatsu, M.; Fukaya, C.; Matsumoto, S.; Ueshima, F.; Hayakawa, H.; Fujinami, K.; Nakagawa, T. Effect of initial periodontal therapy on oral health–related quality of life in patients with periodontitis in Japan. J. Periodontol. 2010, 81, 1001–1009. [Google Scholar] [CrossRef]
- Murakami, S. Periodontal tissue regeneration by signaling molecule(s): What role does basic fibroblast growth factor (FGF-2) have in periodontal therapy? Periodontol 2000 2011, 56, 188–208. [Google Scholar] [CrossRef]
- Bartold, P.M.; Gronthos, S.; Ivanovski, S.; Fisher, A.; Hutmacher, D.W. Tissue engineered periodontal products. J. Periodontal Res. 2016, 51, 1–15. [Google Scholar] [CrossRef] [PubMed]
- Taba, M.; Jin, Q.; Sugai, J.V.; Giannobile, W.V. Current concepts in periodontal bioengineering. Orthod. Craniofacial Res. 2005, 8, 292–302. [Google Scholar] [CrossRef] [PubMed]
- Kitamura, M.; Nakashima, K.; Kowashi, Y.; Fujii, T.; Shimauchi, H.; Sasano, T.; Furuuchi, T.; Fukuda, M.; Noguchi, T.; Shibutani, T.; et al. Periodontal tissue regeneration using fibroblast growth factor-2: Randomized controlled phase II clinical trial. PLoS ONE 2008, 3, e2611. [Google Scholar] [CrossRef]
- Kitamura, M.; Akamatsu, M.; Machigashira, M.; Hara, Y.; Sakagami, R.; Hirofuji, T.; Hamachi, T.; Maeda, K.; Yokota, M.; Kido, J.; et al. FGF-2 stimulates periodontal regeneration: Results of a multi-center randomized clinical trial. J. Dent. Res. 2011, 90, 35–40. [Google Scholar] [CrossRef]
- Kitamura, M.; Akamatsu, M.; Kawanami, M.; Furuichi, Y.; Fujii, T.; Mori, M.; Kunimatsu, K.; Shimauchi, H.; Ogata, Y.; Yamamoto, M.; et al. Randomized placebo-controlled and controlled non-inferiority phase III trials comparing trafermin, a recombinant human fibroblast growth factor 2, and enamel matrix derivative in periodontal regeneration in intrabony defects. J. Bone Miner. Res. 2016, 31, 806–814. [Google Scholar] [CrossRef] [PubMed]
- Saito, A.; Bizenjima, T.; Takeuchi, T.; Suzuki, E.; Sato, M.; Yoshikawa, K.; Kitamura, Y.; Matsugami, D.; Aoki, H.; Kita, D.; et al. Treatment of intrabony periodontal defects using rhFGF-2 in combination with deproteinized bovine bone mineral or rhFGF-2 alone: A 6-month randomized controlled trial. J. Clin. Periodontol. 2019, 46, 332–341. [Google Scholar] [CrossRef]
- Aoki, H.; Bizenjima, T.; Seshima, F.; Sato, M.; Irokawa, D.; Yoshikawa, K.; Yoshida, W.; Imamura, K.; Matsugami, D.; Kitamura, Y.; et al. Periodontal surgery using rhFGF-2 with deproteinized bovine bone mineral or rhFGF-2 alone: 2-year follow-up of a randomized controlled trial. J. Clin. Periodontol. 2021, 48, 92–100. [Google Scholar] [CrossRef]
- Nakayama, Y.; Matsuda, H.; Itoh, S.; Iwai, Y.; Takai, H.; Mezawa, M.; Yoshino, S.; Ogata, Y. Impact of adjunctive procedures on recombinant human fibroblast growth factor-2–mediated periodontal regeneration therapy: A retrospective study. J. Periodontol. 2021, 92, 983–994. [Google Scholar] [CrossRef]
- Takayama, S.; Murakami, S. Efficacy of FGF-2 in periodontal regeneration in a case of severe intrabony defect and furcation involvement with 15-month follow-up. Clin. Adv. Periodontics 2021, 11, 74–79. [Google Scholar] [CrossRef]
- Mikami, R.; Sudo, T.; Fukuba, S.; Takeda, K.; Matsuura, T.; Kariya, T.; Takeuchi, S.; Ochiai, A.; Kawamoto, S.; Toyoshima, K.; et al. Prognostic factors affecting periodontal regenerative therapy using recombinant human fibroblast growth factor-2: A 3-year cohort study. Regen. Ther. 2022, 21, 271–276. [Google Scholar] [CrossRef]
- Seshima, F.; Bizenjima, T.; Aoki, H.; Imamura, K.; Kita, D.; Irokawa, D.; Matsugami, D.; Kitamura, Y.; Yamashita, K.; Sugito, H.; et al. Periodontal regenerative therapy using rhFGF-2 and deproteinized bovine bone mineral versus rhFGF-2 alone: 4-year extended follow-up of a randomized controlled trial. Biomolecules 2022, 12, 1682. [Google Scholar] [CrossRef]
- Baldini, N.; De Sanctis, M.; Ferrari, M. Deproteinized bovine bone in periodontal and implant surgery. Dent. Mater. J. 2011, 27, 61–70. [Google Scholar] [CrossRef]
- Piattelli, M.; Favero, G.A.; Scarano, A.; Orsini, G.; Piattelli, A. Bone reactions to anorganic bovine bone (Bio-Oss) used in sinus augmentation procedures: A histologic long-term report of 20 cases in humans. Int. J. Oral Maxillofac. Implants 1999, 14, 835–840. [Google Scholar]
- Tsuru, K.; Yoshimoto, A.; Kanazawa, M.; Sugiura, Y.; Nakashima, Y.; Ishikawa, K. Fabrication of carbonate apatite block through a dissolution–precipitation reaction using calcium hydrogen phosphate dihydrate block as a precursor. Materials 2017, 10, 374. [Google Scholar] [CrossRef]
- Ishikawa, K.; Miyamoto, Y.; Tsuchiya, A.; Hayashi, K.; Tsuru, K.; Ohe, G. Physical and histological comparison of hydroxyapatite, carbonate apatite, and β-tricalcium phosphate bone substitutes. Materials 2018, 11, 1993. [Google Scholar] [CrossRef]
- Doi, Y.; Shibutani, T.; Moriwaki, Y.; Kajimoto, T.; Iwayama, Y. Sintered carbonate apatites as bioresorbable bone substitutes. J. Biomed. Mater. Res. 1998, 39, 603–610. [Google Scholar] [CrossRef]
- Nagai, H.; Kobayashi-Fujioka, M.; Fujisawa, K.; Ohe, G.; Takamaru, N.; Hara, K.; Uchida, D.; Tamatani, T.; Ishikawa, K.; Miyamoto, Y. Effects of low crystalline carbonate apatite on proliferation and osteoblastic differentiation of human bone marrow cells. J. Mater. Sci. Mater. Med. 2015, 26, 99. [Google Scholar] [CrossRef]
- Mano, T.; Akita, K.; Fukuda, N.; Kamada, K.; Kurio, N.; Ishikawa, K.; Miyamoto, Y. Histological comparison of three apatitic bone substitutes with different carbonate contents in alveolar bone defects in a beagle mandible with simultaneous implant installation. J. Biomed. Mater. Res. 2020, 108, 1450–1459. [Google Scholar] [CrossRef]
- Sato, N.; Handa, K.; Venkataiah, V.S.; Hasegawa, T.; Njuguna, M.M.; Yahata, Y.; Saito, M. Comparison of the vertical bone defect healing abilities of carbonate apatite, β-tricalcium phosphate, hydroxyapatite and bovine-derived heterogeneous bone. Dent. Mater. J. 2020, 39, 309–318. [Google Scholar] [CrossRef]
- Kudoh, K.; Fukuda, N.; Kasugai, S.; Tachikawa, N.; Koyano, K.; Matsushita, Y.; Ogino, Y.; Ishikawa, K.; Miyamoto, Y. Maxillary sinus floor augmentation using low-crystalline carbonate apatite granules with simultaneous implant installation: First-in-human clinical trial. J. Oral Maxillofac. Surg. 2019, 77, e1–e985. [Google Scholar] [CrossRef]
- Nagata, K.; Fuchigami, K.; Kitami, R.; Okuhama, Y.; Wakamori, K.; Sumitomo, H.; Kim, H.; Okubo, M.; Kawana, H. Comparison of the performances of low-crystalline carbonate apatite and Bio-Oss in sinus augmentation using three-dimensional image analysis. Int. J. Implant Dent. 2021, 7, 24. [Google Scholar] [CrossRef]
- Scheyer, E.T.; Velasquez-Plata, D.; Brunsvold, M.A.; Lasho, D.J.; Mellonig, J.T. A clinical comparison of a bovine-derived xenograft used alone and in combination with enamel matrix derivative for the treatment of periodontal osseous defects in humans. J. Periodontol. 2002, 73, 423–432. [Google Scholar] [CrossRef]
- Zucchelli, G.; Amore, C.; Montebugnoli, L.; De Sanctis, M. Enamel matrix protines bovine porous bone mineral in the treatment of intrabony defects: Comparative controlled clinical trial. J. Periodontol. 2003, 74, 1725–1735. [Google Scholar] [CrossRef]
- Matarasso, M.; Iorio-Siciliano, V.; Blasi, A.; Ramaglia, L.; Salvi, G.E.; Sculean, A. Enamel matrix derivative and bone grafts for periodontal regeneration of intrabony defects. A systematic review and meta-analysis. Clin. Oral Investig. 2015, 19, 1581–1593. [Google Scholar] [CrossRef]
- Shirakata, Y.; Setoguchi, F.; Sena, K.; Nakamura, T.; Imafuji, T.; Shinohara, Y.; Iwata, M.; Noguchi, K. Comparison of periodontal wound healing/regeneration by recombinant human fibroblast growth factor-2 combined with β-tricalcium phosphate, carbonate apatite, or deproteinized bovine bone mineral in a canine one-wall intra-bony defect model. J. Clin. Periodontol. 2022, 49, 599–608. [Google Scholar] [CrossRef]
- Nagayasu-Tanaka, T.; Anzai, J.; Takedachi, M.; Kitamura, M.; Harada, T.; Murakami, S. Effects of combined application of fibroblast growth factor (FGF)-2 and carbonate apatite for tissue regeneration in a beagle dog model of one-wall periodontal defect. Regen. Ther. 2023, 23, 84–93. [Google Scholar] [CrossRef]
- Klein, Y.; Fleissig, O.; Stabholz, A.; Chaushu, S.; Polak, D. Bone regeneration with bovine bone impairs orthodontic tooth movement despite proper osseous wound healing in a novel mouse model. J. Periodontol. 2019, 90, 189–199. [Google Scholar] [CrossRef]
- Oortgiesen, D.A.W.; Plachokova, A.S.; Geenen, C.; Meijer, G.J.; Walboomers, X.F.; van den Beucken, J.J.J.P.; Jansen, J.A. Alkaline phosphatase immobilization onto Bio-Gide® and Bio-Oss® for periodontal and bone regeneration. J. Clin. Periodontol. 2012, 39, 546–555. [Google Scholar] [CrossRef]
- Yoshida, W.; Matsugami, D.; Murakami, T.; Bizenjima, T.; Imamura, K.; Seshima, F.; Saito, A. Combined effects of systemic parathyroid hormone (1–34) and locally delivered neutral self-assembling peptide hydrogel in the treatment of periodontal defects: An experimental in vivo investigation. J. Clin. Periodontol. 2019, 46, 1030–1040. [Google Scholar] [CrossRef]
- Arima, Y.; Uemura, N.; Hashimoto, Y.; Baba, S.; Matsumoto, N. Evaluation of bone regeneration by porous alpha-tricalcium phosphate/atelocollagen sponge composite in rat calvarial defects. Orthod. Waves 2013, 72, 23–29. [Google Scholar] [CrossRef]
- Zhang, P.; Ding, L.; Kasugai, S. Effect of doxycycline doped bone substitute on vertical bone augmentation on rat calvaria. Dent. Mater. J. 2019, 38, 211–217. [Google Scholar] [CrossRef]
- Takeda, Y.; Honda, Y.; Kakinoki, S.; Yamaoka, T.; Baba, S. Surface modification of porous alpha-tricalcium phosphate granules with heparin enhanced their early osteogenic capability in a rat calvarial defect model. Dent. Mater. J. 2018, 37, 575–581. [Google Scholar] [CrossRef]
- Murakami, T.; Matsugami, D.; Yoshida, W.; Imamura, K.; Bizenjima, T.; Seshima, F.; Saito, A. Healing of experimental periodontal defects following treatment with fibroblast growth factor-2 and deproteinized bovine bone mineral. Biomolecules 2021, 11, 805. [Google Scholar] [CrossRef]
- Cai, X.; Yang, F.; Yan, X.; Yang, W.; Yu, N.; Oortgiesen, D.A.W.; Wang, Y.; Jansen, J.A.; Walboomers, X.F. Influence of bone marrow-derived mesenchymal stem cells pre-implantation differentiation approach on periodontal regeneration in vivo. J. Clin. Periodontol. 2015, 42, 380–389. [Google Scholar] [CrossRef]
- Lucarini, G.; Zizzi, A.; Aspriello, S.D.; Ferrante, L.; Tosco, E.; Lo Muzio, L.; Foglini, P.; Mattioli-Belmonte, M.; Di Primio, R.; Piemontese, M. Involvement of vascular endothelial growth factor, CD44 and CD133 in periodontal disease and diabetes: An immunohistochemical study. J. Clin. Periodontol. 2009, 36, 3–10. [Google Scholar] [CrossRef]
- Matsugami, D.; Murakami, T.; Yoshida, W.; Imamura, K.; Bizenjima, T.; Seshima, F.; Saito, A. Treatment with functionalized designer self-assembling peptide hydrogels promotes healing of experimental periodontal defects. J. Periodontal Res. 2021, 56, 162–172. [Google Scholar] [CrossRef]
- Ishikawa, I.; Sawada, R.; Kato, Y.; Tsuji, K.; Shao, J.; Yamada, T.; Kato, R.; Tsuchiya, T. The effectivity of the novel serum-free medium STK2 for proliferating human mesenchymal stem cells. Yakugaku Zasshi 2009, 129, 381–384. [Google Scholar] [CrossRef]
- Draenert, F.G.; Nonnenmacher, A.-L.; Kämmerer, P.W.; Goldschmitt, J.; Wagner, W. BMP-2 and bFGF release and in vitro effect on human osteoblasts after adsorption to bone grafts and biomaterials. Clin. Oral Implants Res. 2013, 24, 750–757. [Google Scholar] [CrossRef]
- Bizenjima, T.; Seshima, F.; Ishizuka, Y.; Takeuchi, T.; Kinumatsu, T.; Saito, A. Fibroblast growth factor-2 promotes healing of surgically created periodontal defects in rats with early, streptozotocin-induced diabetes via increasing cell proliferation and regulating angiogenesis. J. Clin. Periodontol. 2015, 42, 62–71. [Google Scholar] [CrossRef]
- Imber, J.-C.; Imber, L.C.; Roccuzzo, A.; Stähli, A.; Muñoz, F.; Weusmann, J.; Bosshardt, D.D.; Sculean, A. Preclinical evaluation of a new synthetic carbonate apatite bone substitute on periodontal regeneration in intrabony defects. J. Periodontal Res. 2024, 59, 42–52. [Google Scholar] [CrossRef]
- Dirckx, N.; Van Hul, M.; Maes, C. Osteoblast recruitment to sites of bone formation in skeletal development, homeostasis, and regeneration. Birth Defects Res. C Embryo Today 2013, 99, 170–191. [Google Scholar] [CrossRef]
- Nakamura, A.; Dohi, Y.; Akahane, M.; Ohgushi, H.; Nakajima, H.; Funaoka, H.; Takakura, Y. Osteocalcin secretion as an early marker of in vitro osteogenic differentiation of rat mesenchymal stem cells. Tissue Eng. Part C Methods 2009, 15, 169–180. [Google Scholar] [CrossRef]
- Nagayasu-Tanaka, T.; Anzai, J.; Takaki, S.; Shiraishi, N.; Terashima, A.; Asano, T.; Nozaki, T.; Kitamura, M.; Murakami, S. Action mechanism of fibroblast growth factor-2 (FGF-2) in the promotion of periodontal regeneration in beagle dogs. PLoS ONE 2015, 10, e0131870. [Google Scholar] [CrossRef]
- Shimabukuro, Y.; Terashima, H.; Takedachi, M.; Maeda, K.; Nakamura, T.; Sawada, K.; Kobashi, M.; Awata, T.; Oohara, H.; Kawahara, T.; et al. Fibroblast growth factor-2 stimulates directed migration of periodontal ligament cells via PI3K/AKT signaling and CD44/hyaluronan interaction. J. Cell. Physiol. 2011, 226, 809–821. [Google Scholar] [CrossRef]
- Fujioka-Kobayashi, M.; Tsuru, K.; Nagai, H.; Fujisawa, K.; Kudoh, T.; Ohe, G.; Ishikawa, K.; Miyamoto, Y. Fabrication and evaluation of carbonate apatite-coated calcium carbonate bone substitutes for bone tissue engineering. J. Tissue Eng. Regen. Med. 2018, 12, 2077–2087. [Google Scholar] [CrossRef]
- Nayab, S.N.; Jones, F.H.; Olsen, I. Effects of calcium ion implantation on human bone cell interaction with titanium. Biomaterials 2005, 26, 4717–4727. [Google Scholar] [CrossRef]
- Protivínský, J.; Appleford, M.; Strnad, J.; Helebrant, A.; Ong, J.L. Effect of chemically modified titanium surfaces on protein adsorption and osteoblast precursor cell behavior. Int. J. Oral Maxillofac. Implant. 2007, 22, 542–550. [Google Scholar]
- Masuoka, K.; Ishihara, M.; Asazuma, T.; Hattori, H.; Matsui, T.; Takase, B.; Kanatani, Y.; Fujita, M.; Saito, Y.; Yura, H.; et al. The interaction of chitosan with fibroblast growth factor-2 and its protection from inactivation. Biomaterials 2005, 26, 3277–3284. [Google Scholar] [CrossRef] [PubMed]


Disclaimer/Publisher’s Note: The statements, opinions and data contained in all publications are solely those of the individual author(s) and contributor(s) and not of MDPI and/or the editor(s). MDPI and/or the editor(s) disclaim responsibility for any injury to people or property resulting from any ideas, methods, instructions or products referred to in the content. |
© 2024 by the authors. Licensee MDPI, Basel, Switzerland. This article is an open access article distributed under the terms and conditions of the Creative Commons Attribution (CC BY) license (https://creativecommons.org/licenses/by/4.0/).