Article

Characterization of a Novel Oxidative Stress Responsive Transcription Regulator in Mycobacterium bovis

1
College of Life Science and Technology, Huazhong Agricultural University, Wuhan 430070, China
2
College of Veterinary Medicine, Huazhong Agricultural University, Wuhan 430070, China
*
Authors to whom correspondence should be addressed.
Biomedicines 2024, 12(8), 1872; https://doi.org/10.3390/biomedicines12081872
Submission received: 28 July 2024 / Accepted: 14 August 2024 / Published: 16 August 2024
(This article belongs to the Section Microbiology in Human Health and Disease)

Abstract

:
The antioxidant defense is critical for the survival of intracellular pathogens such as Mycobacterium tuberculosis complex (MTBC) species, including Mycobacterium bovis, which are often exposed to an oxidative environment caused by reactive oxygen species (ROS) in hosts. However, the signaling pathway in mycobacteria for sensing and responding to oxidative stress remains largely unclear. In this study, we characterize a TetR-type transcription regulator BCG_3893c, designated AotM, as a novel redox sensor in Mycobacterium bovis that increases mycobacterial tolerance to oxidative stress. AotM is required for the growth of M. bovis in the presence of 1 mM hydrogen peroxide. Loss of the aotM gene leads to altered transcriptional profiles with 352 genes significantly up-regulated and 25 genes significantly down-regulated. AotM recognizes a 14-bp palindrome sequence motif and negatively regulates the expression of a FAD-dependent oxidoreductase encoded by bcg_3892c. Overexpression of BCG_3892c increases intracellular ROS production and reduces the growth of M. bovis. In summary, we propose that AotM enhances the mycobacterial resistance against oxidative stress probably by inhibiting intracellular ROS production. Our findings reveal a novel underlying regulatory mechanism behind mycobacterial oxidative stress adaptation.

1. Introduction

Tuberculosis (TB) is a serious zoonotic disease caused by the Mycobacterium tuberculosis complex (MTBC) that kills millions of people worldwide annually [1,2]. M. tuberculosis and M. bovis are the two major members of the MTBC. They share almost identical genomic sequences (identity > 99.95%) [1,3,4] and, therefore, cause very similar symptoms in humans and animals [5,6]. These pathogens are mainly transmitted by aerosols, which can reach the lungs for bacterial colonization. They could infect a variety of cells, including neutrophils, macrophages, and dendritic cells [7,8], and cause granulomas in the hosts [9]. During the course of infection, these intracellular pathogens are exposed to a variety of host-mediated stresses, in which reactive oxygen species (ROS) is one of the primary antimicrobial agents produced by phagocyte oxidase in macrophages [10]. Excess ROS could induce damage to the essential cellular components such as proteins, lipids, and nucleic acids [11]. Therefore, the antioxidant defense becomes particularly important for the survival of intracellular pathogens such as M. tuberculosis, which has evolved multiple strategies to resist ROS, extracellular and intracellular. For example, the mycobacterial cell wall serves as the first defense barrier against ROS, and the low permeability of the cell wall can block the entry of environmental toxic substances into the bacterial cell [12]. Also, Mtb expresses many antioxidant proteins including superoxide dismutases SodA/SodC [13], catalase KatG [14], peroxidase AhpC [15], thioredoxins (Trx) [16], etc., to eliminate intracellular ROS. In addition, the histone-like Lsr2 with ferroxidase activity was found to be involved in the detoxification of iron and hydrogen peroxide [17]. Although many proteins involved in antioxidant process have been reported in mycobacteria, the molecular mechanism and the signaling pathways by which mycobacteria adaptively promote antioxidant regulation remains largely unclear.
The transcription regulators that can directly sense ROS and regulate bacterial antioxidant growth have been reported in many bacteria. For example, OxyR is a well-studied redox sensor in Escherichia coli. Sensing oxidative signals by the C-terminal cysteine residues, OxyR could form intramolecular disulfide bonds [18,19] and promote expression of the antioxidant genes, including katG, ahpCF, gorA, etc., to protect the cells from the toxicity of hydrogen peroxide [18,20,21]. Similarly, OhrR regulates the expression of organic hydroperoxide reductase (ohrA) in Bacillus subtilis for bacterial survival in toxic environments by the N-terminal cysteine-mediated oxidative signal sensing [22,23,24]. In mycobacterial species, SoxR senses the presence of superoxide via its iron-sulfur cluster (2Fe-2S) [25,26]. SoxR would undergo monovalent oxidation to form a reactive oxidation state, which activates the expression of soxS. SoxS protein would further activate the superoxide dismutase, etc., for detoxification of the superoxide [25]. Recently, CmtR, a Cadmium/Plumbum-sensing transcription regulator, was reported to respond to oxidative signals and regulate the antioxidant growth of M. bovis. It can disarm the zinc uptake regulator Zur, which represses the expression of the esx-3 operon, promoting accumulation of zinc and detoxication of ROS in mycobacterial cells [27].
In this study, we characterized AotM/BCG_3893c, a TetR-type transcription regulator, as a novel redox sensor in Mycobacterium bovis that is required for mycobacterial growth in the presence of hydrogen peroxide. AotM responds to the oxidative signal and promotes the expression of the antioxidant genes. Meanwhile, AotM might restrict intracellular ROS production by repressing the expression of bcg_3892c, which encodes a dehydrogenase. Our findings indicate the existence of a novel antioxidant regulation pathway and provide new insights into mycobacterial adaptation to oxidative stress.

2. Materials and Methods

2.1. Bacterial Strains, Primers and Media

The strains and plasmids used in the experiments are listed in Tables S1 and S2. The primers used in this study are shown in Table S3. LB liquid medium (Sinopharm Chemical Reagent Co., Ltd., Shanghai, China), LB solid medium (Sinopharm Chemical Reagent Co., Ltd., Shanghai, China), 7H9 medium (Becton, Dickinson and Company, Franklin Lakes, NJ, USA), and 7H10 medium (Becton, Dickinson and Company, Franklin Lakes, NJ, USA) were used in this study.

2.2. Protein Expression and Purification

The aotM gene was amplified from the genomic DNA of Mycobacterium bovis BCG by PCR using specific primers (Table S3). Then, the aotM gene was cloned into pET28a vector for protein expression in E. coil BL21 (DE3) strain. One liter of Luria-Bertani (LB) medium containing 30 μg/mL Kanamycin was used for producing the His6-tagged AotM protein. Cells were grown at 37 °C to OD600 were approximately 0.8 to 1.0. Then, 0.5 mM isopropyl thiogalactoside (IPTG) was added into the culture media to induce expression of AotM protein for 4 h. Afterward, cells were harvested by centrifugation and lysed by sonication in ice-cold lysis buffer (150 mM NaCl, 30 mM Tris, 1 mM PMSF [pH 7.5]). Cell lysate was clarified by centrifugation, and the proteins were purified on Ni2+ affinity columns as described previously [28]. The elution was then dialyzed overnight and stored at −80 °C. The protein concentration was determined by Coomassie Brilliant Blue assay.

2.3. Real-Time Fluorescence Quantitative PCR Assay

All the M. bovis BCG strains were cultured in 7H9 medium to OD600 of 0.7, RNA was extracted by RNA extraction kit (Beijing Aidlab Biotechnologies Co., Ltd., Beijing, China), 0.8% agarose gel was used to detect the purity and integrity of RNA samples. Real-time fluorescence quantitative PCRs (RT-qPCRs) were performed using a 20 μL reaction mixture with the following ingredients: 10 μL 2× SYBR qPCR Mix kit (Aidlab, Beijing, China), 200 nM concentration of genes primer pairs (Table S3), and 2 μL volume of the immunoprecipitated and purified DNA samples. Each reaction was performed in triplicate. The reactions were reacted in a CFX96 instrument (Bio-Rad, Hercules, CA, USA) using the following protocol: 95 °C for 5 min; 35 cycles of 95 °C for 30 s, 60 °C for 30 s, and 72 °C for 30 s. The Bio-Rad CFX Manager v.2.1 software was used to analyze the data. The expression levels of different genes were normalized by sigA, and RT-qPCR data were calculated using the 2−ΔΔCt method [29]. For statistical analysis, two-tailed Student’s t-tests were performed.

2.4. Growth Curves Assays

The growth curves of the M. bovis BCG strains were determined as previously described [30]. For the initial culturing, all the strains, including the wild-type BCG (WT BCG), the aotM deletion mutant (ΔaotM), the aotM overexpressing strain (WT/pMV261-aotM), and the aotM complementary strain (ΔaotM + aotM) were grown in 7H9 media till OD600 reached 1.0. Then, all the strains were inoculated into 10 mL of fresh 7H9 medium at an initial OD600 of 0.01 with and without 1 mM H2O2. The OD600 of the cultures was determined every 24 h. For statistical data, growth curves were plotted in Graphpad Prism 8 (8.0.1), three biological replicates were set for each group, and error bars were calculated.

2.5. DNA Substrate Preparation and Electrophoretic Mobility Shift Assay (EMSA)

The DNA fragments, including aotMp, ppsAp, BCG_3892cp, and BCG_3894p for electrophoretic mobility shift assay (EMSA), were amplified by PCR from the genome of M. bovis BCG using the specific primers (Table S3). The oligonucleotides (P1 to P4) were directly synthesized and were mixed with the equal molar concentration of their reverse complementary oligonucleotides (Table S3). Then, the oligonucleotide mixtures were heated at 95 °C for 5 min until annealed by natural cooling. The DNA-binding assays were performed according to a previous procedure [28]. Briefly, the reactions (20 μL) for measuring mobility shift contained labeled DNA substrates and increasing concentrations of the protein (as indicated in the legend of the corresponding figure) and were incubated in EMSA buffer (50 mM Tris–HCl, pH 7.5, 10 mM MgCl2, 1 mM DTT and 50 mM NaCl) at 4 °C for 30 min and then subjected to 5% native PAGE. Electrophoresis was performed at 150 V at room temperature for 1.5 h in 0.5× Trisborate-EDTA buffer. Images of gels were acquired using a Typhoon Scanner (GE Healthcare, Chicago, IL, USA).

2.6. ChIP Assay

The chromatin immunoprecipitation (ChIP) experiment was performed as previously described [31]. The M. bovis BCG cells were grown in 100 mL of 7H9 medium up to an OD600 of 1.0. Then, the cells were fixed with 1% formaldehyde for 20 min, and the reaction was ended with 0.125 M glycine for 5 min. The cross-linked cells were harvested and resuspended in 1 mL of TBSTT (TBS, 0.2% Triton X-100, 0.05% Tween-20). The sample was sonicated on ice, and the average size of the DNA fragments was approximately 0.5 kb. A 100 μL sample of the extract was saved as the input fraction. The remaining 900 μL was then incubated with 10 μL of the AotM antibody or pre-immune serum at 4 °C for 3 h. The complexes were immunoprecipitated with 20 μL 50% Protein A agarose (Becton, Dickinson and Company, Franklin Lakes, NJ, USA) under rotation at 4 °C for 1 h. The immunocomplexs were recovered by centrifugation and resuspended in 100 μL TE buffer (20 mM Tris–HCl pH 7.8, 10 mM EDTA, 0.5% SDS). The cross-linking was reversed at 65 °C for 6 h. The sample DNA was purified and amplified by PCR with Platinum Taq (Invitrogen, Carlsbad, CA, USA). Each experiment was performed in duplicate and was repeated twice. The amplification protocol includes one denaturation step of 5 min at 95 °C, then 32 cycles of 1 min at 95 °C, 1 min at 60 °C, and 1 min at 72 °C.

2.7. DNA Footprinting Assay

The aotMp DNA fragment was amplified with the FAM-labeled primers. The purified DNA fragment was added to the reaction and mixed with the increased amount of AotM at room temperature for 30 min for the EMSA experiment. All of the mixtures were treated with 1 unit DNase I (Fermentas, Beijing, China) at 37 °C for 2 min and 30 s as previously described [32,33]. The results were analyzed with Applied Biosystems 37030XL DNA analyzer (Tsingke, Wuhan, China).

2.8. β-Galactosidase Activity Assay

The galactosidase activity assays were performed in accordance with previously described procedures [30]. The target and control promoters were cloned into pMV261 backbone, and then the reporter gene lacZ was cloned behind the promoters. The plasmids were transformed into the Escherichia coli DH5α strains to obtain their corresponding recombinant reporter strains. The strains containing the lacZ reporter vectors (Table S2) were used in the experiments [34]. All strains were cultured in LB medium at 37 °C to the mid-log phase. Then, the bacterial cells were harvested and washed twice with PBS and afterward were streaked on the LB plates supplemented with 30 μg/mL kanamycin, 0.1% IPTG, and 40 μg/mL X-gal for culturing at 37 °C overnight. The β-galactosidase measurements were performed as described previously [35].

2.9. Determination of Intracellular ROS Content

The intracellular ROS content was determined by the dichloro-dihydro-fluorescein diacetate (DCFH-DA) assay [36] with modifications. The wild-type BCG strain and the BCG_3892c overexpressing strain were cultured in 50 mL of 7H9 medium to an OD600 of 1.2, and then 10 mL of the bacterial culture was centrifuged at 10,000× g for 1 min, and the supernatant was discarded. The cells were washed with 5 mL of PBS three times and then resuspended in 500 μL PBS. Then the cells were incubated with 100 μM DCFH-DA at 37 °C in the dark for 30 min. The cells were washed two times with PBS to remove the extracellular DCFH-DA. Subsequently, the fluorescence signal in the bacteria was detected by flow cytometry. Finally, the level of fluorescence signal detected in the two strains was statistically analyzed and plotted using GraphPad Prism 8 (8.0.1).

2.10. Transcriptomic Analysis

The transcriptomic analysis was conducted as previously described [30]. The strains were grown in 100 mL 7H9 media at 37 °C with 160 rpm shaking. The cells were cultured to the mid-logarithmic phase (optical density at 600 nm [OD600], 1.0) and were harvested. Each strain was cultured in three biological replicates. The total RNA was isolated using RNeasy mini kit (Qiagen, Hilden, Germany). Strand-specific libraries were prepared using the TruSeq stranded total RNA sample preparation kit (Illumina, San Diego, CA, USA) following the manufacturer’s instructions. Library construction and sequencing were performed at Novogene Biotechnology Corporation (Tianjin, China).

3. Results

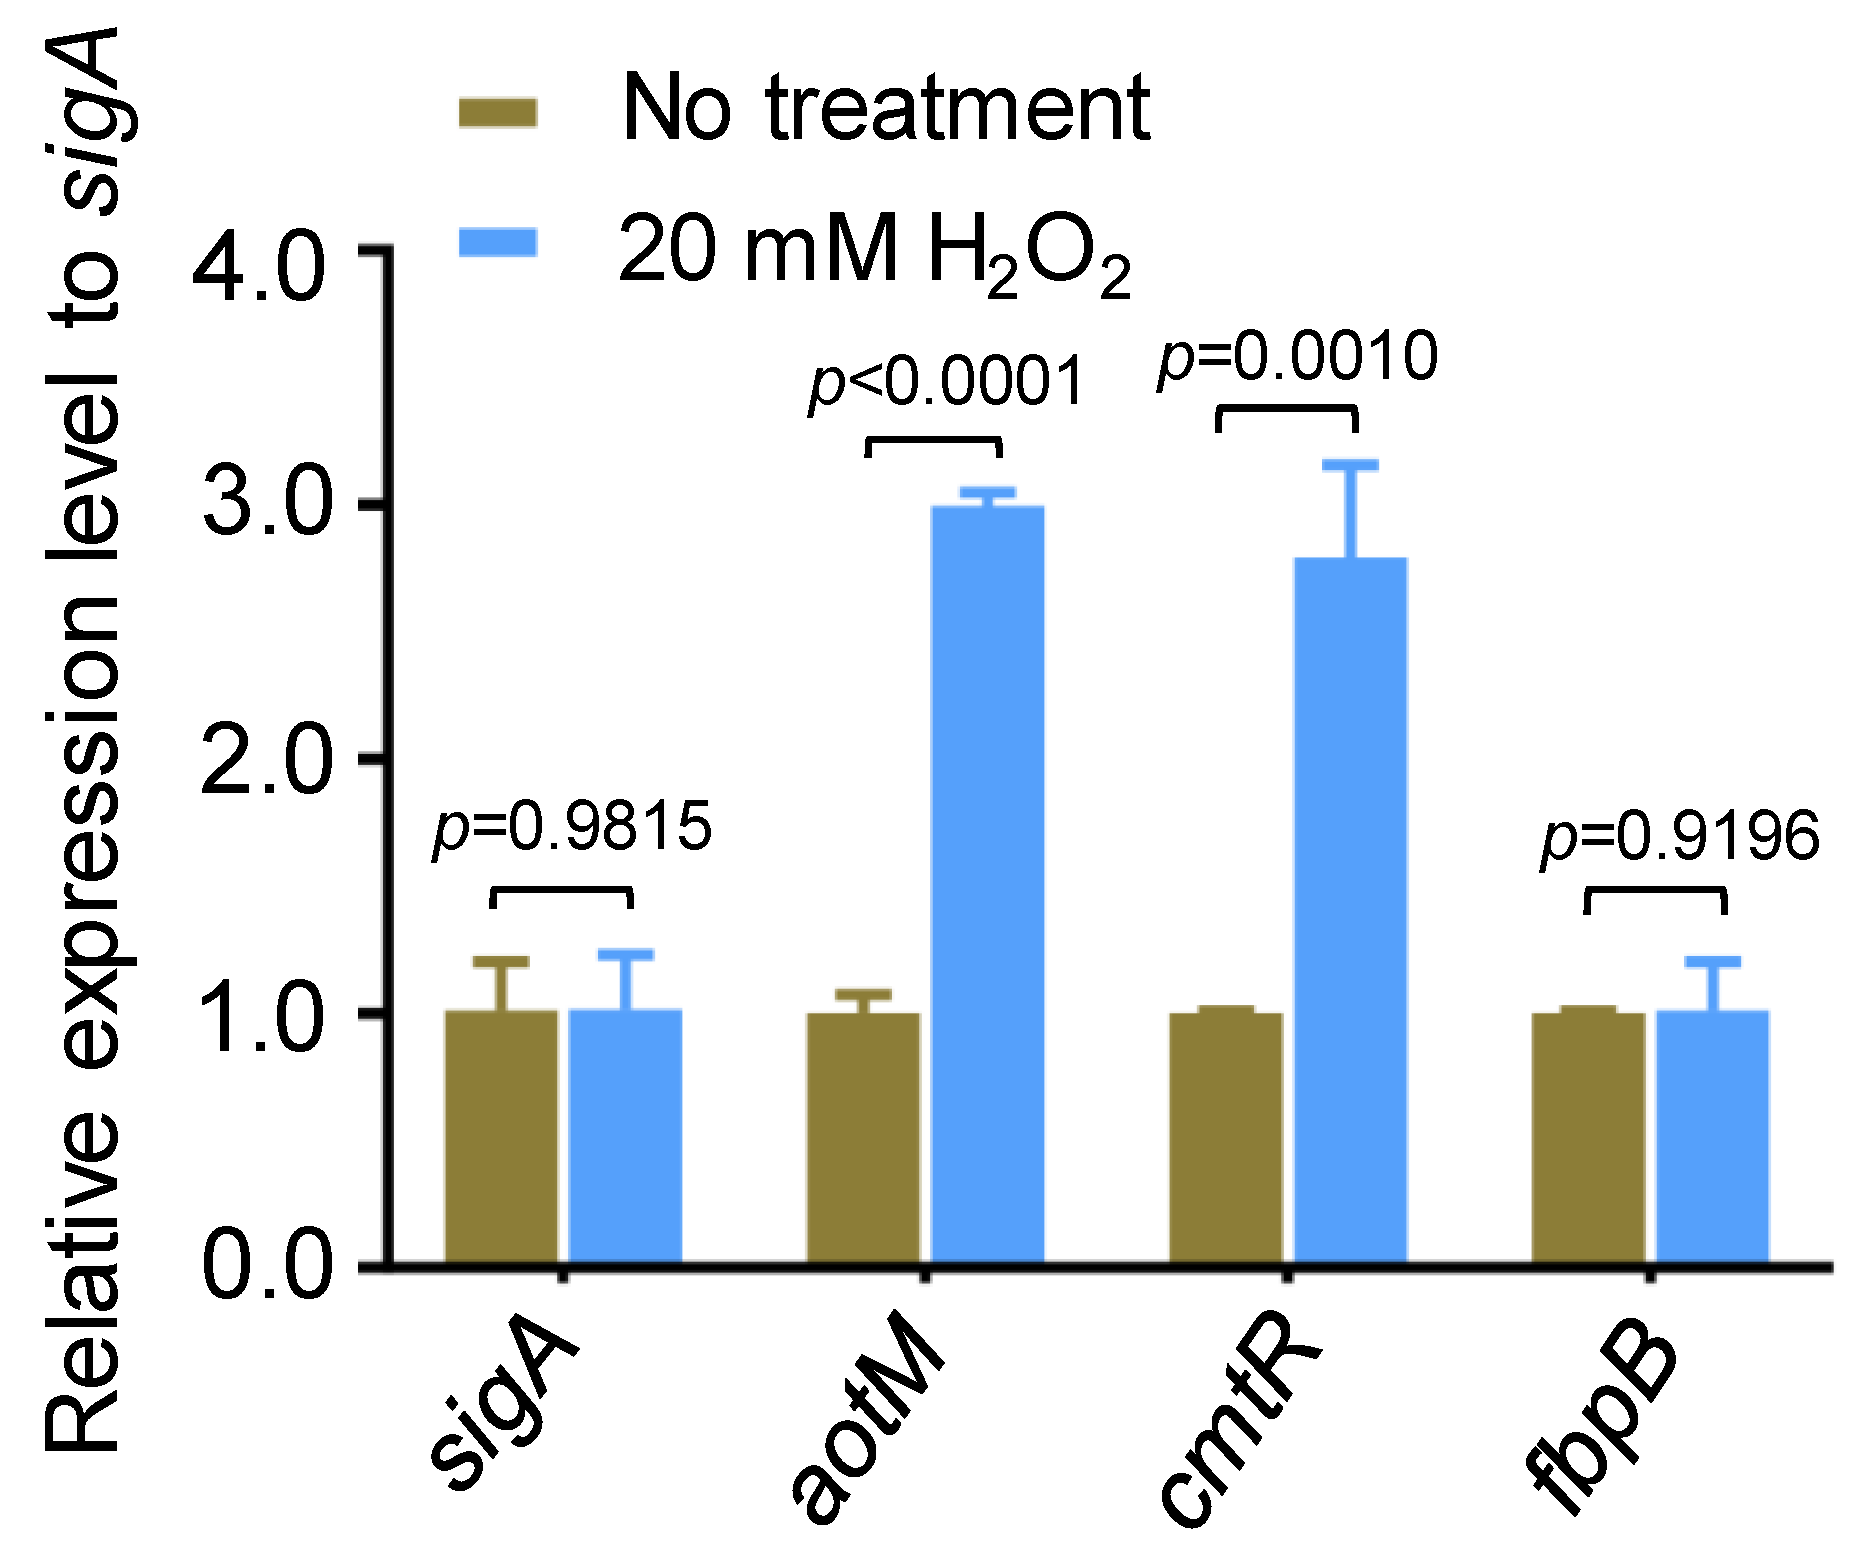
3.1. aotM Gene Is Required for Mycobacterium bovis to Resist Oxidative Stress

In an oxidative stress experiment in Mycobacterium bovis, we noticed that aotM (BCG_3893c), encoding a TetR family transcription regulator, could be induced by hydrogen peroxide. With the treatment of 20 mM H2O2 for 1.5 h, the transcription level of aotM was increased by 3-fold compared with the untreated strain (Figure 1). cmtR, a H2O2-induced transcription regulator [27] as the positive control, was up-regulated approximately 2.7-fold, and the oxidative stress unrelated gene fbpB was unchanged (Figure 1). Our observation suggests that aotM could respond to the oxidative signal in Mycobacterium bovis.
To investigate the role of AotM, we constructed the ΔaotM deletion mutant using Mycobacterium bovis BCG. Deletion of aotM gene did not affect the growth of M. bovis BCG in the Middlebrook 7H9 liquid media (Figure 2A). In the presence of 1 mM H2O2, the growth of the ΔaotM deletion mutant was completely inhibited, while the wild-type M. bovis BCG strain, as well as the aotM complemented strain, were able to grow (Figure 2A), indicating that aotM gene is required for M. bovis BCG to resist H2O2 stress. Furthermore, overexpression of aotM gene in the WT BCG via hsp60 promoter from the mycobacterial expression vector pMV261 (Figure S1) showed significantly increased growth in contrast to the WT BCG strain with the empty vector as the control in the presence of 1 mM H2O2 (Figure 2B), suggesting that aotM gene enhances H2O2 resistance of M. bovis BCG. Taken together, these results suggest that the transcription regulator AotM is required for the resistance of M. bovis to oxidative stress.

3.2. AotM Specifically Binds to Its Own Promoter Region

To test the DNA binding activity of AotM, we performed an electrophoretic mobility shift assay (EMSA). The purified hexahistidine-tagged AotM protein was incubated with aotM upstream DNA (aotMp) or ppsA upstream DNA (ppsAp). As shown in Figure 3A, when 100 ng aotMp DNA fragment was co-incubated with increasing concentrations of AotM protein (0, 0.1, 0.2, and 0.3 μM), a specific and clear shift in the bands was observed (lanes 1–4). In contrast, AotM protein failed to cause shifts in the ppsAp DNA as the negative control (lanes 5–8), indicating that AotM specifically binds to its own promoter DNA region in vitro. Furthermore, in the chromatin immunoprecipitation (ChIP) assay, the complex of AotM protein and the aotMp DNA could be captured by the AotM antibody in the wild-type BCG strain but not in the aotM deletion strain (Figure 3B). The negative control ppsAp DNA could not be captured by the antibody in either WT BCG or aotM deletion mutant (Figure 3B). Taken together, AotM specifically binds to its promoter DNA region in M. bovis BCG in vivo and in vitro.

3.3. AotM Recognizes a 14-bp Palindrome Sequence Motif

To further identify the DNA-binding site of AotM, we performed a DNase I footprinting assay. The 1 μM purified AotM protein was co-incubated with the FAM-labeled fluorescent DNA probe aotMp, and then digested with DNase I. The DNA sequence located in the region −46 to −1 on the coding strand was clearly protected (Figure 3C). Interestingly, this region contains a 14-bp palindromic sequence (TGTCAATGTTGACA) formed by two inverted repeats (IR, 5′-TGTCAA-3′) (Figure 3D). Further EMSA assays confirmed the significance of this motif for specific recognition by AotM (Figure 3E, F). A series of DNA substrates in which one of the inverted repeats or both inverted repeats were mutated (Figure 3E). AotM was incapable of binding to the DNA substrates mutated within either of the inverted repeats (Figure 3F). A competition assay further confirmed the specificity of AotM binding with the core motif region. The cold (unlabeled) DNA substrate (P1) with the complete core motifs (Figure 3E) could competitively inhibit the binding of AotM to the FAM-labeled DNA substrate (P1) (Figure 3E and Figure S2). While, the DNA substrate (P2) mutated within the core motifs was failed to inhibit the binding of AotM to the FAM-labeled DNA substrate P1. Taken together, these results demonstrated that AotM recognizes a specific palindrome sequence motif.

3.4. AotM Affects the Expression of Genes Involved in Antioxidation in Mycobacterium bovis

To identify the AotM-affected genes, we analyzed the differences in transcriptome between the ΔaotM deletion mutant and the WT strain. 377 genes were identified with significantly altered expression levels via filtering for differential genes with fold change (FC) values greater than 2. Of these, 352 genes were up-regulated, and 25 genes were down-regulated more than twofold (Figure 4A), suggesting a broad regulatory role of AotM in Mycobacterium bovis. Importantly, 19 genes involved in antioxidation, including katG, pknE, sigE, BCG_0286c, and BCG_0287c were significantly down-regulated in the ΔaotM deletion strains (Figure 4B and Table S4), suggesting that AotM might promote the expression of genes involved in antioxidation in Mycobacterium bovis.
In addition, the genes between BCG_3890c and BGC_3894 loci (Figure 4C) were significantly up-regulated in the ΔaotM deletion strain (Figure 4B), which is consistent with the results in the RT-qPCR experiment (Figure 4D). Notably, BGC_3892c encoding a FAD-dependent oxidoreductase was up-regulated by approximately 40-fold in the ΔaotM deletion strain (Figure 4D), suggesting that AotM inhibits the expression of BCG_3892c.

3.5. AotM Negatively Regulates the Expression of the Adjacent Genes

Genomic location analysis showed that aotM is spaced 47-bp and 71-bp to the downstream adjacent gene bcg_3892c and the upstream adjacent gene bcg_3894 (Figure 4C), respectively. Then, we tested whether AotM could bind to the promoter DNA of the adjacent genes in vitro. In the EMSA experiments, the increased shifted bands were clearly observed when the increasing concentrations of AotM were incubated with the promoters DNA aotMp, bcg_3892cp, or bcg_3894p (Figure 5A), indicating that AotM protein binds to the promoters of the adjacent target genes. Furthermore, we examined the in vivo DNA-binding ability of AotM to the promoters of adjacent genes by ChIP assay. In the wild-type BCG strain, the AotM antibody could capture both the complex of AotM with bcg_3892cp (Figure 5B, left panel) and the complex of AotM with bcg_3894p (Figure 5B, right panel). While the AotM antibody could not capture bcg_3892cp and bcg_3894p in the knockout strain, indicating that AotM indeed binds to bcg_3892cp and bcg_3894p in vivo. Taken together, these results suggest that transcription regulator AotM binds to the upstream regions of the adjacent target genes bcg_3892c and bcg_3894 and exerts its regulatory functions.
Next, we wanted to know whether AotM acts as a repressor of the adjacent target genes. We performed the β-galactosidase assays using lacZ reporter plasmids. The lacZ gene was placed under the control of the promoter regions from the potential target genes, including bcg_3892c and bcg_3894. In the absence of aotM, both reporter strains showed high β-galactosidase activities. The β-galactosidase activities were significantly inhibited when aotM was expressed (Figure 4E), suggesting AotM negatively regulates the expression of the adjacent target genes. Taken together, AotM acts as a repressor to the adjacent genes.

3.6. Overexpression of BCG_3892c Leads to Increased Intracellular ROS Level and Reduced Growth of M. bovis

AotM strongly inhibits the expression of bcg_3892c gene (Figure 4D,E). Then, we were curious about the effects of the dysfunctional expression of bcg_3892c. To test this, we overexpressed bcg_3892c in the WT BCG strain using the replicative vector pMV261. An approximately 22-fold upregulation of the transcription level of bcg_3892c was confirmed in the overexpression strain by the RT-qPCR experiment (Figure S3). Interestingly, overexpression of bcg_3892c partially inhibited the growth of M. bovis (Figure 6A). The bcg_3892c gene encodes a putative FAD-dependent oxidoreductase. Oxidation processes could usually affect intracellular ROS levels [37,38]. To test whether the intracellular ROS levels were changed, we performed a dichloro-dihydro-fluorescein diacetate (DCFH-DA) assay, which is widely used in the detection of reactive oxygen species (ROS) [36]. The fluorescent probe DCFH-DA was incubated with the active bacterial cells, and then the intracellular ROS levels were indicated by the intensity of the fluorescent signal (FITC-A). Interestingly, we found that the fluorescence signal was increased by 41% in the BCG_3892c overexpression strain compared to the control strain with the same bacterial population (Figure 6B,C), suggesting that overexpression of BCG_3892c increases the intracellular ROS production. In conclusion, these results suggest that overexpression of BCG_3892c could reduce the growth of M. bovis, probably due to the increased intracellular ROS production.

4. Discussion

Antioxidation is particularly important for the survival of intracellular pathogens, including Mtb, which is often exposed to ROS in the host cells during infection. In this study, we identified M. bovis AotM as a novel redox sensor required for mycobacterial growth in the presence of hydrogen peroxide. The transcriptome data showed that AotM broadly affects the expression of genes in M. bovis. Loss of aotM gene leads to altered transcriptional profiles, with 352 genes significantly up-regulated and 25 genes significantly down-regulated. Interestingly, we found that 19 genes involved in antioxidation, including katG, pknE, sigE, bcg_0286c, and bcg_0287c, were significantly down-regulated in the ΔaotM deletion strains (Figure 4B). In bacteria, KatG proteins have peroxidase activity and are considered to be involved in the antioxidant process. In Mtb, the katG gene could be induced under oxidative stress. The Mtb KatG has peroxidase activity [39], which facilitates the degradation of peroxides produced by NADPH oxidases in macrophages during Mtb infection [14]. PknE, a serine/threonine protein kinase (STPK), plays a very important role in mycobacteria facing nitrogen and ROS stress [40]. PknE could respond to the oxidative stress of NO in the environment, which helps the bacteria clear intracellular free radicals. The loss of pknE leads to the increased resistance of Mtb to NO [41]. Also, the sigma factor E encoded by sigE could be induced by the oxidative stress during bacterial replication. SigE could regulate mycobacterial cells to maintain intracellular redox potential [42]. BCG_0286c and BCG_0287c encode succinate dehydrogenases, which promote the antioxidant growth of the bacterium in concert with the Fgd-F420 system [43,44]. In this study, we found that M. bovis BCG_3892c, a putative oxidoreductase, is involved in intracellular ROS production. Overexpression of BCG_3892c leads to increased intracellular ROS levels and reduced bacterial growth (Figure 6). However, the specific function and metabolic pathway of BCG_3892c are not clear, while AotM indeed acts as a repressor to BCG_3892c. In the absence of AotM, BCG_3892c was up-regulated by 40-fold. Our findings suggest that some of the metabolic enzymes associated with ROS production could be strictly regulated in mycobacteria. Interestingly, a recent study showed that M. smegmatis SdrR, a LysR-type regulator, was able to modulate the mycobacterial tolerance to oxidative stress via regulating the expression of a short-chain oxidoreductase SDR encoded by MSMEG_5714 [45]. Unlike AotM, which plays an essential role in the mycobacterial resistance to hydrogen peroxide, SdrR exhibits a negative effect on the resistance of M. smegmatis to hydrogen peroxide. Loss of sdrR indeed leads to increased expression of the short-chain oxidoreductase SDR, which facilitates the survival of M. smegmatis in the presence of hydrogen peroxide [45]. These results imply that mycobacteria might use multiple regulatory pathways to control the oxidoreductases and promote bacterial growth under oxidative stress.
In bacteria, transcription regulators containing cysteine residues could be used to sense oxidative signals. For example, MosR senses H2O2 stress via its N-terminal two cysteines (Cys10 and Cys12) in Mtb, and the oxidized MosR regulates the expression of a short-chain dehydrogenase encoded by rv1050 [11]. Similarly, OxyS in Mtb senses H2O2 via cysteines (Cys25) and subsequently regulates the expression of the catalase KatG [11,46]. Also, CmtR senses H2O2 stress via cysteine (Cys24), and it physically interacts with the zinc uptake regulator Zur to promote the expression of esx-3 operon, thereby enhancing the accumulation of Zn2+ in M. bovis and triggering the detoxification of ROS [27]. AotM protein contains three cysteines at positions 142, 160, and 187. Then, we hypothesized that AotM might also sense oxidative stress via the formation of a disulfide bond. However, we could not observe any changes to the DNA-binding activity of AotM in the EMSA experiments using the cysteine-mutated AotM protein in the presence of hydrogen peroxide, suggesting that AotM sensing oxidative signals could be cysteine-independent. In addition, some oxidative stress transcription factors could sense ROS in other ways. For example, the iron-sulfur [2Fe-2S] cluster in SoxR of P. aeruginosa [26] and the histidines in PerR of B. subtilis [47,48] were used for sensing the oxidative signals. In some cases, methionine could regulate oxidative stress in nitrogen metabolism in S. cerevisiae [49]. Therefore, the key residues of AotM for sensing oxidative stress need to be further identified in the future.

5. Conclusions

ROS plays a very important role in resisting the invasion of pathogens in the organism. When the pathogens invade the hosts and form foci, the local level of ROS in the foci will increase dramatically to cause oxidative damage to the pathogens as a way of resisting the further invasion of the pathogens [50]. Mycobacterium tuberculosis complex species (MTBC), including M. bovis, as successful intracellular pathogens, have evolved unique antioxidant growth strategies with many oxidative stress-responsive transcription regulators, which usually play important roles in coping with the oxidative environment of host cells. In this study, we characterized a novel oxidative stress-responsive transcription regulator AotM, which is required for the survival of M. bovis in the presence of hydrogen peroxide. AotM specifically recognizes a 14-bp palindrome sequence motif and negatively regulates the expression of the target gene BCG_3892c encoding a FAD-dependent oxidoreductase (Figure 7). Overexpression of the oxidoreductase leads to increased intracellular ROS levels and reduced bacterial growth. Therefore, AotM might restrict intracellular ROS production by repressing the expression of the oxidoreductase, facilitating M. bovis to survive under oxidative stress (Figure 7). Our findings indicate the existence of a novel antioxidant regulation pathway and provide new insights into mycobacterial adaptation to oxidative stress.

Supplementary Materials

The following supporting information can be downloaded at: https://www.mdpi.com/article/10.3390/biomedicines12081872/s1, Figure S1: aotM expression in recombinant strains; Figure S2: AotM specifically binds to the core motif region; Figure S3: BCG_3892c expression in recombinant strains; Table S1: Bacterial strains used in this work; Table S2: Plasmids used in this work; Table S3: Oligonucleotides used in this work; Table S4: Functional presentation of antioxidant genes affected by AotM deletion. References [51,52,53,54,55,56,57,58,59,60,61,62,63,64,65,66,67] are cited in the supplementary materials.

Author Contributions

H.Z. and Q.J. conceived the study. Q.J., R.H. and F.L. performed the experiments. H.Z., L.Z. and F.H. directed research. H.Z., L.Z., F.H. and Q.J. analyzed the data. Q.J., L.Z. and H.Z. wrote the manuscript with input from all authors. All authors have read and agreed to the published version of the manuscript.

Funding

This work was supported by the National Natural Science Foundation of China (Grant 31771379 to H.Z.), the Fundamental Research Funds for the Central Universities (Project 2662023DKQD001 to L.Z.), and the Talent Start-up Funds of Huazhong Agricultural University (Project 11042310008 to L.Z.).

Institutional Review Board Statement

Not appliable.

Informed Consent Statement

Not applicable.

Data Availability Statement

The original contributions presented in the study are included in the article/Supplementary Materials, further inquiries can be directed to the corresponding authors.

Conflicts of Interest

The authors declare no competing interests.

References

  1. Sabio, Y.G.J.; Bigi, M.M.; Klepp, L.I.; García, E.A.; Blanco, F.C.; Bigi, F. Does Mycobacterium bovis persist in cattle in a non-replicative latent state as Mycobacterium tuberculosis in human beings? Vet. Microbiol. 2020, 247, 108758. [Google Scholar]
  2. Freschi, L.; Vargas, R., Jr.; Husain, A.; Kamal, S.M.M.; Skrahina, A.; Tahseen, S.; Ismail, N.; Barbova, A.; Niemann, S.; Cirillo, D.M.; et al. Population structure, biogeography and transmissibility of Mycobacterium tuberculosis. Nat. Commun. 2021, 12, 6099. [Google Scholar] [CrossRef]
  3. Jia, X.; Yang, L.; Dong, M.; Chen, S.; Lv, L.; Cao, D.; Fu, J.; Yang, T.; Zhang, J.; Zhang, X.; et al. The Bioinformatics Analysis of Comparative Genomics of Mycobacterium tuberculosis Complex (MTBC) Provides Insight into Dissimilarities between Intraspecific Groups Differing in Host Association, Virulence, and Epitope Diversity. Front. Cell. Infect. Microbiol. 2017, 7, 88. [Google Scholar] [CrossRef]
  4. Garnier, T.; Eiglmeier, K.; Camus, J.C.; Medina, N.; Mansoor, H.; Pryor, M.; Duthoy, S.; Grondin, S.; Lacroix, C.; Monsempe, C.; et al. The complete genome sequence of Mycobacterium bovis. Proc. Natl. Acad. Sci. USA 2003, 100, 7877–7882. [Google Scholar] [CrossRef] [PubMed]
  5. Mitermite, M.; Elizari, J.M.U.; Ma, R.; Farrell, D.; Gordon, S.V. Exploring virulence in Mycobacterium bovis: Clues from comparative genomics and perspectives for the future. Ir. Vet. J. 2023, 76, 26. [Google Scholar] [CrossRef]
  6. Byrne, A.W.; Graham, J.; Brown, C.; Donaghy, A.; Guelbenzu-Gonzalo, M.; McNair, J.; Skuce, R.A.; Allen, A.; McDowell, S.W. Modelling the variation in skin-test tuberculin reactions, post-mortem lesion counts and case pathology in tuberculosis-exposed cattle: Effects of animal characteristics, histories and co-infection. Transbound. Emerg. Dis. 2018, 65, 844–858. [Google Scholar] [CrossRef]
  7. Lerner, T.R.; Borel, S.; Gutierrez, M.G. The innate immune response in human tuberculosis. Cell. Microbiol. 2015, 17, 1277–1285. [Google Scholar] [CrossRef]
  8. Liu, C.H.; Liu, H.; Ge, B. Innate immunity in tuberculosis: Host defense vs. pathogen evasion. Cell. Mol. Immunol. 2017, 14, 963–975. [Google Scholar] [CrossRef] [PubMed]
  9. Bussi, C.; Gutierrez, M.G. Mycobacterium tuberculosis infection of host cells in space and time. FEMS Microbiol. Rev. 2019, 43, 341–361. [Google Scholar] [CrossRef]
  10. Kumar, A.; Farhana, A.; Guidry, L.; Saini, V.; Hondalus, M.; Steyn, A.J. Redox homeostasis in mycobacteria: The key to tuberculosis control? Expert Rev. Mol. Med. 2011, 13, e39. [Google Scholar] [CrossRef] [PubMed]
  11. Brugarolas, P.; Movahedzadeh, F.; Wang, Y.; Zhang, N.; Bartek, I.L.; Gao, Y.N.; Voskuil, M.I.; Franzblau, S.G.; He, C. The oxidation-sensing regulator (MosR) is a new redox-dependent transcription factor in Mycobacterium tuberculosis. J. Biol. Chem. 2012, 287, 37703–37712. [Google Scholar] [CrossRef] [PubMed]
  12. Maitra, A.; Munshi, T.; Healy, J.; Martin, L.T.; Vollmer, W.; Keep, N.H.; Bhakta, S. Cell wall peptidoglycan in Mycobacterium tuberculosis: An Achilles’ heel for the TB-causing pathogen. FEMS Microbiol. Rev. 2019, 43, 548–575. [Google Scholar] [CrossRef] [PubMed]
  13. Edwards, K.M.; Cynamon, M.H.; Voladri, R.K.; Hager, C.C.; DeStefano, M.S.; Tham, K.T.; Lakey, D.L.; Bochan, M.R.; Kernodle, D.S. Iron-cofactored superoxide dismutase inhibits host responses to Mycobacterium tuberculosis. Am. J. Respir. Crit. Care Med. 2001, 164, 2213–2219. [Google Scholar] [CrossRef] [PubMed]
  14. Ng, V.H.; Cox, J.S.; Sousa, A.O.; MacMicking, J.D.; McKinney, J.D. Role of KatG catalase-peroxidase in mycobacterial pathogenesis: Countering the phagocyte oxidative burst. Mol. Microbiol. 2004, 52, 1291–1302. [Google Scholar] [CrossRef]
  15. Springer, B.; Master, S.; Sander, P.; Zahrt, T.; McFalone, M.; Song, J.; Papavinasasundaram, K.G.; Colston, M.J.; Boettger, E.; Deretic, V. Silencing of oxidative stress response in Mycobacterium tuberculosis: Expression patterns of ahpC in virulent and avirulent strains and effect of ahpC inactivation. Infect. Immun. 2001, 69, 5967–5973. [Google Scholar] [CrossRef] [PubMed]
  16. Akif, M.; Khare, G.; Tyagi, A.K.; Mande, S.C.; Sardesai, A.A. Functional studies of multiple thioredoxins from Mycobacterium tuberculosis. J. Bacteriol. 2008, 190, 7087–7095. [Google Scholar] [CrossRef] [PubMed]
  17. Colangeli, R.; Haq, A.; Arcus, V.L.; Summers, E.; Magliozzo, R.S.; McBride, A.; Mitra, A.K.; Radjainia, M.; Khajo, A.; Jacobs, W.R., Jr.; et al. The multifunctional histone-like protein Lsr2 protects mycobacteria against reactive oxygen intermediates. Proc. Natl. Acad. Sci. USA 2009, 106, 4414–4418. [Google Scholar] [CrossRef]
  18. Juttukonda, L.J.; Green, E.R.; Lonergan, Z.R.; Heffern, M.C.; Chang, C.J.; Skaar, E.P. Acinetobacter baumannii OxyR Regulates the Transcriptional Response to Hydrogen Peroxide. Infect. Immun. 2019, 87, e00413-18. [Google Scholar] [CrossRef]
  19. Dubbs, J.M.; Mongkolsuk, S. Peroxide-sensing transcriptional regulators in bacteria. J. Bacteriol. 2012, 194, 5495–5503. [Google Scholar] [CrossRef]
  20. Chiang, S.M.; Schellhorn, H.E. Regulators of oxidative stress response genes in Escherichia coli and their functional conservation in bacteria. Arch. Biochem. Biophys. 2012, 525, 161–169. [Google Scholar] [CrossRef]
  21. Lehman, A.P.; Long, S.R. OxyR-Dependent Transcription Response of Sinorhizobium meliloti to Oxidative Stress. J. Bacteriol. 2018, 200, e00622-17. [Google Scholar] [CrossRef]
  22. Lee, H.N.; Ji, C.J.; Lee, H.H.; Park, J.; Seo, Y.S.; Lee, J.W.; Oh, J.I. Roles of three FurA paralogs in the regulation of genes pertaining to peroxide defense in Mycobacterium smegmatis mc(2) 155. Mol. Microbiol. 2018, 108, 661–682. [Google Scholar] [CrossRef] [PubMed]
  23. Hillion, M.; Antelmann, H. Thiol-based redox switches in prokaryotes. Biol. Chem. 2015, 396, 415–444. [Google Scholar] [CrossRef]
  24. Soonsanga, S.; Lee, J.W.; Helmann, J.D. Oxidant-dependent switching between reversible and sacrificial oxidation pathways for Bacillus subtilis OhrR. Mol. Microbiol. 2008, 68, 978–986. [Google Scholar] [CrossRef]
  25. Watanabe, S.; Kita, A.; Kobayashi, K.; Miki, K. Crystal structure of the [2Fe-2S] oxidative-stress sensor SoxR bound to DNA. Proc. Natl. Acad. Sci. USA 2008, 105, 4121–4126. [Google Scholar] [CrossRef]
  26. Kobayashi, K. Sensing Mechanisms in the Redox-Regulated, [2Fe-2S] Cluster-Containing, Bacterial Transcriptional Factor SoxR. Acc. Chem. Res. 2017, 50, 1672–1678. [Google Scholar] [CrossRef] [PubMed]
  27. Li, X.; Chen, L.; Liao, J.; Hui, J.; Li, W.; He, Z.G. A novel stress-inducible CmtR-ESX3-Zn(2+) regulatory pathway essential for survival of Mycobacterium bovis under oxidative stress. J. Biol. Chem. 2020, 295, 17083–17099. [Google Scholar] [CrossRef]
  28. Yang, M.; Gao, C.; Cui, T.; An, J.; He, Z.G. A TetR-like regulator broadly affects the expressions of diverse genes in Mycobacterium smegmatis. Nucleic Acids Res. 2012, 40, 1009–1020. [Google Scholar] [CrossRef] [PubMed]
  29. Livak, K.J.; Schmittgen, T.D. Analysis of relative gene expression data using real-time quantitative PCR and the 2(-Delta Delta C(T)) Method. Methods 2001, 25, 402–408. [Google Scholar] [CrossRef] [PubMed]
  30. Li, W.; Li, M.; Hu, L.; Zhu, J.; Xie, Z.; Chen, J.; He, Z.G. HpoR, a novel c-di-GMP effective transcription factor, links the second messenger’s regulatory function to the mycobacterial antioxidant defense. Nucleic Acids Res. 2018, 46, 3595–3611. [Google Scholar] [CrossRef] [PubMed]
  31. Frank, S.R.; Schroeder, M.; Fernandez, P.; Taubert, S.; Amati, B. Binding of c-Myc to chromatin mediates mitogen-induced acetylation of histone H4 and gene activation. Genes Dev. 2001, 15, 2069–2082. [Google Scholar] [CrossRef] [PubMed]
  32. Yang, M.; Gao, C.H.; Hu, J.; Zhao, L.; Huang, Q.; He, Z.G. InbR, a TetR family regulator, binds with isoniazid and influences multidrug resistance in Mycobacterium bovis BCG. Sci. Rep. 2015, 5, 13969. [Google Scholar] [CrossRef] [PubMed]
  33. Li, Y.; Zeng, J.; Zhang, H.; He, Z.G. The characterization of conserved binding motifs and potential target genes for M. tuberculosis MtrAB reveals a link between the two-component system and the drug resistance of M. smegmatis. BMC Microbiol. 2010, 10, 242. [Google Scholar] [CrossRef] [PubMed]
  34. Stover, C.K.; de la Cruz, V.F.; Fuerst, T.R.; Burlein, J.E.; Benson, L.A.; Bennett, L.T.; Bansal, G.P.; Young, J.F.; Lee, M.H.; Hatfull, G.F.; et al. New use of BCG for recombinant vaccines. Nature 1991, 351, 456–460. [Google Scholar] [CrossRef] [PubMed]
  35. Miller, J.H. Experiments in Molecular Genetics; Harbor Laboratory Press: Cold Spring, NY, USA, 1972; pp. 352–355. [Google Scholar]
  36. Aranda, A.; Sequedo, L.; Tolosa, L.; Quintas, G.; Burello, E.; Castell, J.V.; Gombau, L. Dichloro-dihydro-fluorescein diacetate (DCFH-DA) assay: A quantitative method for oxidative stress assessment of nanoparticle-treated cells. Toxicol. Vitr. Int. J. Publ. Assoc. BIBRA 2013, 27, 954–963. [Google Scholar] [CrossRef]
  37. Sassetti, E.; Clausen, M.H.; Laraia, L. Small-Molecule Inhibitors of Reactive Oxygen Species Production. J. Med. Chem. 2021, 64, 5252–5275. [Google Scholar] [CrossRef] [PubMed]
  38. Bortolotti, M.; Polito, L.; Battelli, M.G.; Bolognesi, A. Xanthine oxidoreductase: One enzyme for multiple physiological tasks. Redox Biol. 2021, 41, 101882. [Google Scholar] [CrossRef]
  39. Milano, A.; Forti, F.; Sala, C.; Riccardi, G.; Ghisotti, D. Transcriptional regulation of furA and katG upon oxidative stress in Mycobacterium smegmatis. J. Bacteriol. 2001, 183, 6801–6806. [Google Scholar] [CrossRef] [PubMed]
  40. Kumar, D.; Palaniyandi, K.; Challu, V.K.; Kumar, P.; Narayanan, S. PknE, a serine/threonine protein kinase from Mycobacterium tuberculosis has a role in adaptive responses. Arch. Microbiol. 2013, 195, 75–80. [Google Scholar] [CrossRef]
  41. Jayakumar, D.; Jacobs, W.R., Jr.; Narayanan, S. Protein kinase E of Mycobacterium tuberculosis has a role in the nitric oxide stress response and apoptosis in a human macrophage model of infection. Cell. Microbiol. 2008, 10, 365–374. [Google Scholar] [CrossRef]
  42. Manganelli, R.; Cioetto-Mazzabò, L.; Segafreddo, G.; Boldrin, F.; Sorze, D.; Conflitti, M.; Serafini, A.; Provvedi, R. SigE: A master regulator of Mycobacterium tuberculosis. Front. Microbiol. 2023, 14, 1075143. [Google Scholar] [CrossRef]
  43. Hasan, M.R.; Rahman, M.; Jaques, S.; Purwantini, E.; Daniels, L. Glucose 6-phosphate accumulation in mycobacteria: Implications for a novel F420-dependent anti-oxidant defense system. J. Biol. Chem. 2010, 285, 19135–19144. [Google Scholar] [CrossRef]
  44. Nambi, S.; Long, J.E.; Mishra, B.B.; Baker, R.; Murphy, K.C.; Olive, A.J.; Nguyen, H.P.; Shaffer, S.A.; Sassetti, C.M. The Oxidative Stress Network of Mycobacterium tuberculosis Reveals Coordination between Radical Detoxification Systems. Cell Host Microbe 2015, 17, 829–837. [Google Scholar] [CrossRef]
  45. Zhu, C.; Wei, W.P.; An, J.N.; Hu, J.L.; Gao, C.H.; Yang, M. SdrR, a LysR-Type Regulator, responds to the mycobacterial antioxidant defense. J. Biochem. 2024, 176, 43–54. [Google Scholar] [CrossRef] [PubMed]
  46. Li, W.; He, Z.G. LtmA, a novel cyclic di-GMP-responsive activator, broadly regulates the expression of lipid transport and metabolism genes in Mycobacterium smegmatis. Nucleic Acids Res. 2012, 40, 11292–11307. [Google Scholar] [CrossRef]
  47. Duarte, V.; Latour, J.M. PerR vs. OhrR: Selective peroxide sensing in Bacillus subtilis. Mol. Biosyst. 2010, 6, 316–323. [Google Scholar] [CrossRef]
  48. Sudharsan, M.N.; Rajendra, P.; Rajendrasozhan, S. Bacterial redox response factors in the management of environmental oxida-tive stress. World J. Microbiol. Biotechnol. 2022, 39, 11. [Google Scholar]
  49. Fang, W.; Jiang, L.; Zhu, Y.; Yang, S.; Qiu, H.; Cheng, J.; Liang, Q.; Tu, Z.C.; Ye, C. Methionine restriction constrains lipoylation and activates mitochondria for nitrogenic synthesis of amino acids. Nat. Commun. 2023, 14, 2504. [Google Scholar] [CrossRef] [PubMed]
  50. Yang, S.; Lian, G. ROS and diseases: Role in metabolism and energy supply. Mol. Cell. Biochem. 2020, 467, 1–12. [Google Scholar] [CrossRef] [PubMed]
  51. Saini, V.; Farhana, A.; Steyn, A.J. Mycobacterium tuberculosis WhiB3: A novel iron-sulfur cluster protein that regulates redox homeostasis and virulence. Antioxid Redox Signal. 2012, 16, 687–697. [Google Scholar] [CrossRef]
  52. Wu, J.; Ru, H.-W.; Xiang, Z.-H.; Jiang, J.; Wang, Y.-C.; Zhang, L.; Liu, J. WhiB4 Regulates the PE/PPE Gene Family and is Essential for Virulence of Mycobacterium marinum. Sci. Rep. 2017, 7, 3007. [Google Scholar] [CrossRef]
  53. Burian, J.; Ramón-García, S.; Sweet, G.; Gómez-Velasco, A.; Av-Gay, Y.; Thompson, C.J. The mycobacterial transcriptional regulator whiB7 gene links redox homeostasis and intrinsic antibiotic resistance. J. Biol. Chem. 2012, 287, 299–310. [Google Scholar] [CrossRef] [PubMed]
  54. Machado, P.; Bizarro, C.V.; Basso, L.A. Resistance Reversed in KatG Mutants of Mycobacterium tuberculosis. Trends Microbiol. 2019, 27, 655–656. [Google Scholar] [CrossRef]
  55. Hillas, P.J.; del Alba, F.S.; Oyarzabal, J.; Wilks, A.; de Montellano, P.R.O. The AhpC and AhpD antioxidant defense system of Mycobacterium tuberculosis. J. BiolChem. 2000, 275, 18801–18809. [Google Scholar] [CrossRef] [PubMed]
  56. Lee, H.N.; Lee, N.O.; Han, S.J.; Ko, I.J.; Oh, J.I. Regulation of the ahpC gene encoding alkyl hydroperoxide reductase in Mycobacterium smegmatis. PLoS ONE 2014, 9, e111680. [Google Scholar] [CrossRef]
  57. Jaeger, T. Peroxiredoxin systems in mycobacteria. Subcell. Biochem. 2007, 44, 207–217. [Google Scholar]
  58. Perkins, A.; Nelson, K.J.; Parsonage, D.; Poole, L.B.; Karplus, P.A. Peroxiredoxins: Guardians against oxidative stress and modulators of peroxide signaling. Trends Biochem. Sci. 2015, 40, 435–445. [Google Scholar] [CrossRef]
  59. Gengenbacher, M.; Nieuwenhuizen, N.; Vogelzang, A.; Liu, H.; Kaiser, P.; Schuerer, S.; Lazar, D.; Wagner, I.; Mollenkopf, H.J.; Kaufmann, S.H. Deletion of nuoG from the Vaccine Candidate Mycobacterium bovis BCG ΔureC::hly Improves Protection against Tuberculosis. mBio 2016, 7, 00679-16. [Google Scholar] [CrossRef]
  60. Punetha, A.; Ngo, H.X.; Holbrook, S.Y.; Green, K.D.; Willby, M.J.; Bonnett, S.A.; Krieger, K.; Dennis, E.K.; Posey, J.E.; Parish, T.; et al. Structure-Guided Optimization of Inhibitors of Acetyltransferase Eis from Mycobacterium tuberculosis. ACS Chem. Biol. 2020, 15, 1581–1594. [Google Scholar] [CrossRef] [PubMed]
  61. Köster, S.; Upadhyay, S.; Chandra, P.; Papavinasasundaram, K.; Yang, G.; Hassan, A.; Grigsby, S.J.; Mittal, E.; Park, H.S.; Jones, V.; et al. Mycobacterium tuberculosis is protected from NADPH oxidase and LC3-associated phagocytosis by the LCP protein CpsA. Proc Natl Acad Sci USA 2017, 114, E8711–E8720. [Google Scholar] [CrossRef]
  62. Jia, Q.; Hu, X.; Shi, D.; Zhang, Y.; Sun, M.; Wang, J.; Mi, K.; Zhu, G. Universal stress protein Rv2624c alters abundance of arginine and enhances intracellular survival by ATP binding in mycobacteria. Sci. Rep. 2016, 6, 35462. [Google Scholar] [CrossRef]
  63. Knapp, G.S.; Lyubetskaya, A.; Peterson, M.W.; Gomes, A.L.; Ma, Z.; Galagan, J.E.; McDonough, K.A. Role of intragenic binding of cAMP responsive protein (CRP) in regulation of the succinate dehydrogenase genes Rv0249c-Rv0247c in TB complex mycobacteria. Nucleic Acids Res. 2015, 43, 5377–5393. [Google Scholar] [CrossRef]
  64. Gurumurthy, M.; Rao, M.; Mukherjee, T.; Rao, S.P.; Boshoff, H.I.; Dick, T.; Barry, C.E., 3rd; Manjunatha, U.H. A novel F420-dependent anti-oxidant mechanism protects Mycobacterium tuberculosis against oxidative stress and bactericidal agents. Mol. Microbiol. 2013, 87, 744–755. [Google Scholar] [CrossRef] [PubMed]
  65. Nguyen, Q.T.; Trinco, G.; Binda, C.; Mattevi, A.; Fraaije, M.W. Discovery and characterization of an F420-dependent glucose-6-phosphate dehydrogenase (Rh-FGD1) from Rhodococcus jostii RHA1. Appl. Microbiol. Biotechnol. 2017, 101, 2831–2842. [Google Scholar] [CrossRef] [PubMed]
  66. Rodrigue, S.; Provvedi, R.; Jacques, P.E.; Gaudreau, L.; Manganelli, R. The sigma factors of Mycobacterium tuberculosis. FEMS Microbiol. Rev. 2006, 30, 926–941. [Google Scholar] [CrossRef] [PubMed]
  67. Raman, S.; Hazra, R.; Dascher, C.C.; Husson, R.N. Transcription regulation by the Mycobacterium tuberculosis alternative sigma factor SigD and its role in virulence. J. Bacteriol. 2004, 186, 6605–6616. [Google Scholar] [CrossRef]
Figure 1. The expression of aotM gene is induced by H2O2 stress. RT-qPCR was performed to detect the expression of aotM in wild-type M. bovis BCG strains treated with 20 mM H2O2. The relative gene expression levels were normalized using the sigA gene as the internal reference. cmtR and fbpB were used as the positive control and the negative control, respectively. Error bars represent the standard deviation of the three biological replicates. A two-tailed unpaired Student’s t-test was used for statistical analysis using GraphPad Prism 8. p-values are indicated.
Biomedicines 12 01872 g001
Figure 2. Growth assays of the M. bovis strains under H2O2 stress. (A) The wild-type M. bovis BCG strain (WT BGC), the aotM deletion mutant (ΔaotM) and the aotM complementary strain (ΔaotM + aotM) were grown in 7H9 media with (right) and without (left) 1 mM H2O2. (B) The WT strain (WT/pMV261) and the aotM overexpressing strain (WT/pMV261-aotM) were grown in 7H9 media with (right) and without (left) 1 mM H2O2. The initial OD600 of all cultures was 0.01. Error bars represent standard deviations from the mean values of three biological replicates.
Biomedicines 12 01872 g002
Figure 3. Analyses of the AotM binding motif. (A) EMSA assay for the DNA binding activity of AotM. The mixtures were electrophoresed in a 5% native polyacrylamide gel. The 100 ng aotM promoter (aotMp, 500 bp, lanes 1–4) and 100 ng negative control gene promoter (ppsAp, 500 bp, lanes 5–8) were incubated with different concentrations (0–0.3 µM) of AotM protein. (B) ChIP assays. The pre-immune (P) serum and the post-immune (I) serum were used in the ChIP. An mycobacterial promoter ppsAp was used as a negative control. (C) The DNase I footprinting assay. The protection of the aotM promoter DNA against DNaseI digestion by increasing amounts of AotM was evaluated. The sequences of the protected regions on the non-coding strand are marked in the box in the figures. (D) Sequence and structural characteristics of the promoter region protected by AotM. The regions protected by AotM are indicated with underlines; the translation start codon of AotM is indicated in bold. (E) The DNA binding motif with the designed IR mutated regions. The mutated regions are indicated in red. (F) EMSA of the short DNA substrates (34 bp), with or without the IR sequence. The mixtures were electrophoresed in a 5% native polyacrylamide gel. Each DNA substrate was co-incubated with 0–0.6 µM AotM protein.
Biomedicines 12 01872 g003
Figure 4. AotM regulates the expression of the adjacent genes. (A) The transcriptome difference between the wild-type M. bovis BCG and the aotM deletion mutant determined by RNA-seq was shown in the volcanic diagram. The significantly up-regulated- and the significantly downregulated genes were shown by red and blue spots, respectively. Genes that were not significantly changed were shown by black spots. (B) Heat map of the AotM-regulated differential expression profile for the antioxidant genes and adjacent genes. WT1, WT2, and WT3 represent separately three biological replicates of the genes in the wild-type strain. KO1, KO2, and KO3 represent separately three biological replicates of differentially expressed genes in the aotM knockout strain. Adjacent genes of aotM are indicated in the blue boxes. (C) Localization of the aotM on the genome in M. bovis BCG. The number at the bottom represents the number of separated bases between adjacent genes. (D) RT-qPCR was performed to detect the expression of the target gene in the ΔaotM deletion mutant and wild-type control strains. The relative gene expression levels were normalized using the sigA gene as an internal reference. The error bars represent the standard deviation of three biological replicates. A two-tailed unpaired Student’s t-test was used for statistical analysis using GraphPad Prism 8. P-values are indicated. (E) β-galactosidase activity assay. Schematic diagram of plasmids containing promoter-lacZ and promoter-aotM-lacZ, no promoter as negative control (CK−) and hsp60 promoter as a positive control (CK+). All the plasmids were transformed into the Escherichia coli. The activity of β-galactosidase is expressed as Miller units. Data are expressed as the mean ± standard deviations of three independent replicates.
Biomedicines 12 01872 g004
Figure 5. AotM binds to the promoters of the target genes. (A) EMSA of AotM binding to the promoters of the target genes. The mixtures were electrophoresed in a 5% native polyacrylamide gel. The 100 ng aotM promoter (aotMp, 500 bp, lanes 1–4), 100 ng BCG_3892c promoter (BCG_3892cp, 500 bp, lanes 5–8) and 100 ng BCG_3894 promoter (BCG_3894p, 500 bp, lanes 9–12) were incubated with different concentrations (0–0.25 µM) of AotM protein. (B) ChIP assays for intracellular binding of AotM to the promoters of the target genes. The experiment was performed in wild-type and aotM knockout strains with post-immune serum (I) and pre-immune serum (P) to capture the complexes of protein and the promoters of the target genes.
Biomedicines 12 01872 g005
Figure 6. Overexpression of BCG_3892c increases the intracellular ROS levels in M. bovis BCG. (A) Detection of Wild-type M. bovis BCG strain with pMV261 (WT/pMV261) and the BCG_3892c overexpressing strain (WT/pMV261-BCG_3892c) growth in the 7H9 media. The results show the mean of three biological replicates, and the error bars indicate the standard deviation of three biological replicates. (B) The intracellular ROS levels of the strains were analyzed by flow cytometry. The horizontal coordinate FITC-A represents the detected fluorescence value, and the vertical coordinate represents the detected number of bacteria in each sample. (C) The fluorescence signal levels detected in the strains were statistically analyzed. The error bars represent the standard deviation of the three biological replicates. A two-tailed unpaired Student’s t-test was used for statistical analysis using GraphPad Prism 8. P-values are indicated.
Biomedicines 12 01872 g006
Figure 7. Model of AotM regulation. aotM gene could respond to the oxidative signals. The transcription regulator AotM promotes the expression of the antioxidant genes, including katG, sigE, etc., facilitating the survival of M bovis under oxidative stress. Meanwhile, AotM inhibits the expression of BCG_3892c, which encodes a dehydrogenase. Overexpression of BCG_3892c leads to the increased production of ROS, which inhibits mycobacterial growth. The dashed arrow or line represent the intricate correlation which remains to be further investigated.
Biomedicines 12 01872 g007
Disclaimer/Publisher’s Note: The statements, opinions and data contained in all publications are solely those of the individual author(s) and contributor(s) and not of MDPI and/or the editor(s). MDPI and/or the editor(s) disclaim responsibility for any injury to people or property resulting from any ideas, methods, instructions or products referred to in the content.

