

Thiamine and METTL14 in Diabetes Management with Intensive Insulin Therapy

 , and
, and
Abstract
:
1. Introduction
2. Materials and Methods
2.1. Collection of Clinical Samples
2.2. Patient Characteristics
2.3. MeRIP-Seq and RNA-Seq
2.4. Gene Ontology (GO) and Kyoto Encyclopedia of Genes and Genomes (KEGG) Analysis
2.5. Cell Culture and Transfection
2.6. Quantitative Real-Time PCR (RT-qPCR)
2.7. Western Blot
2.8. m6A Dot Blot Assay
2.9. Statistical Analysis
3. Results
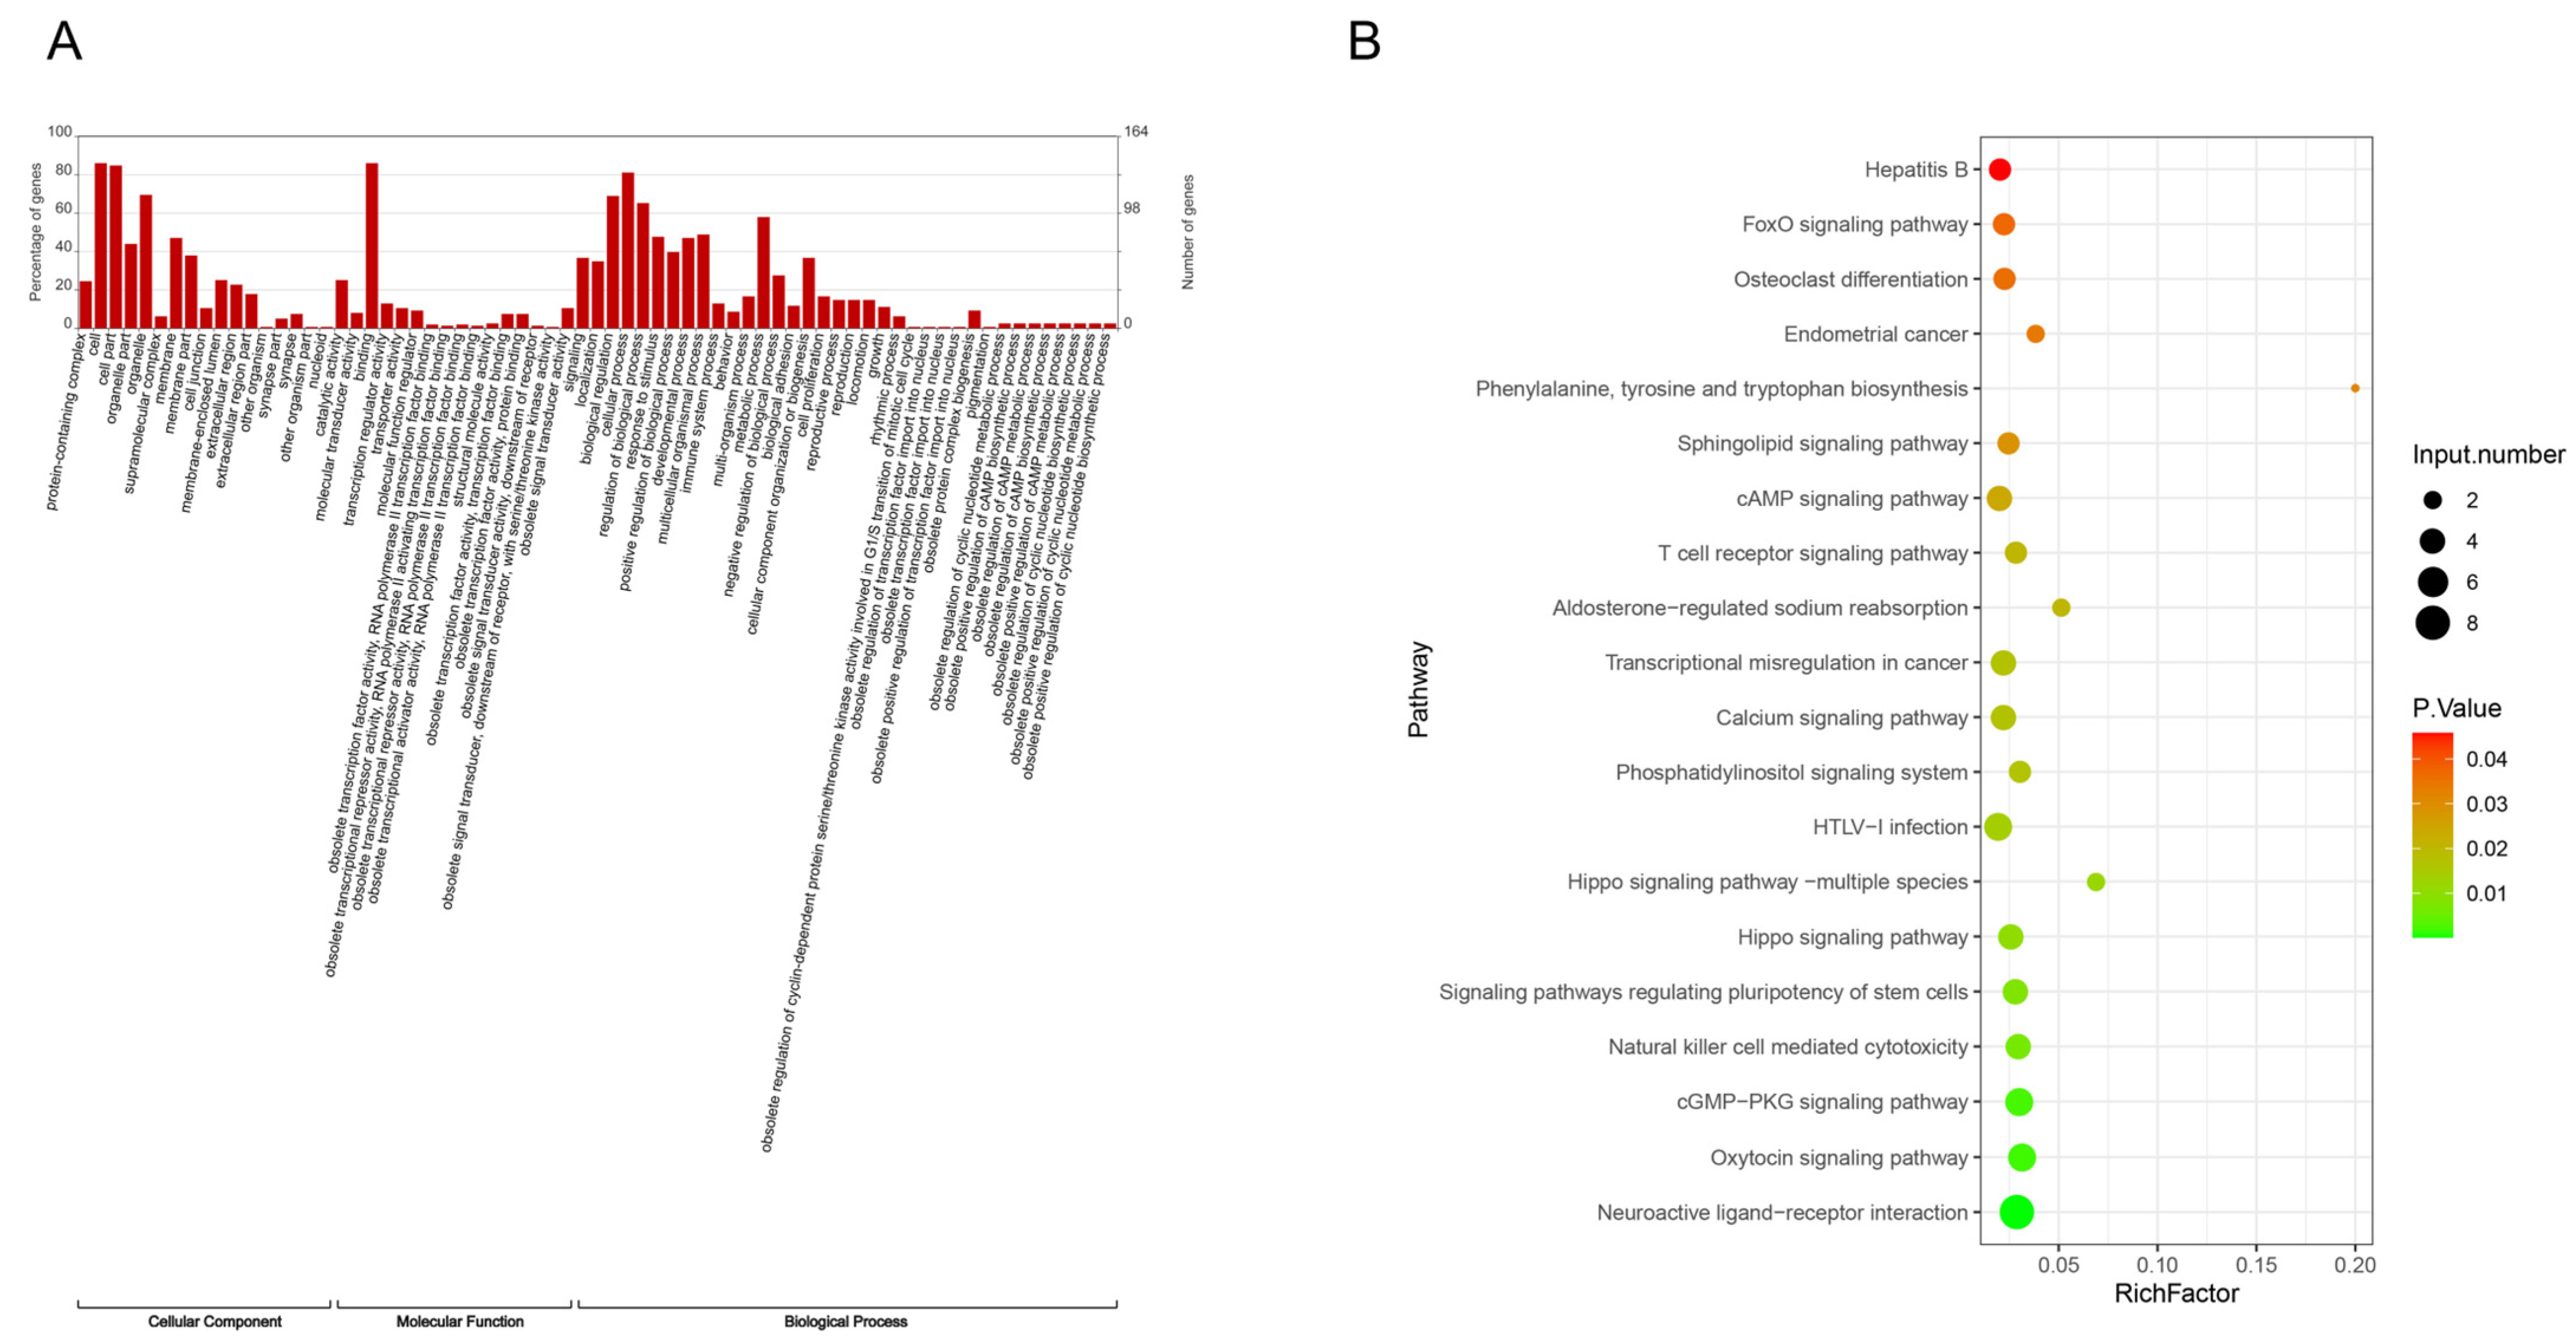
3.1. Distribution of Total m6A Modification Sites in People with Diabetes
3.2. Analysis of Differential Genes in m6A Modification Sites Before and After Intensive Insulin Therapy
3.3. Analysis of Differential mRNAs in People with Diabetes Before and After Intensive Insulin Therapy
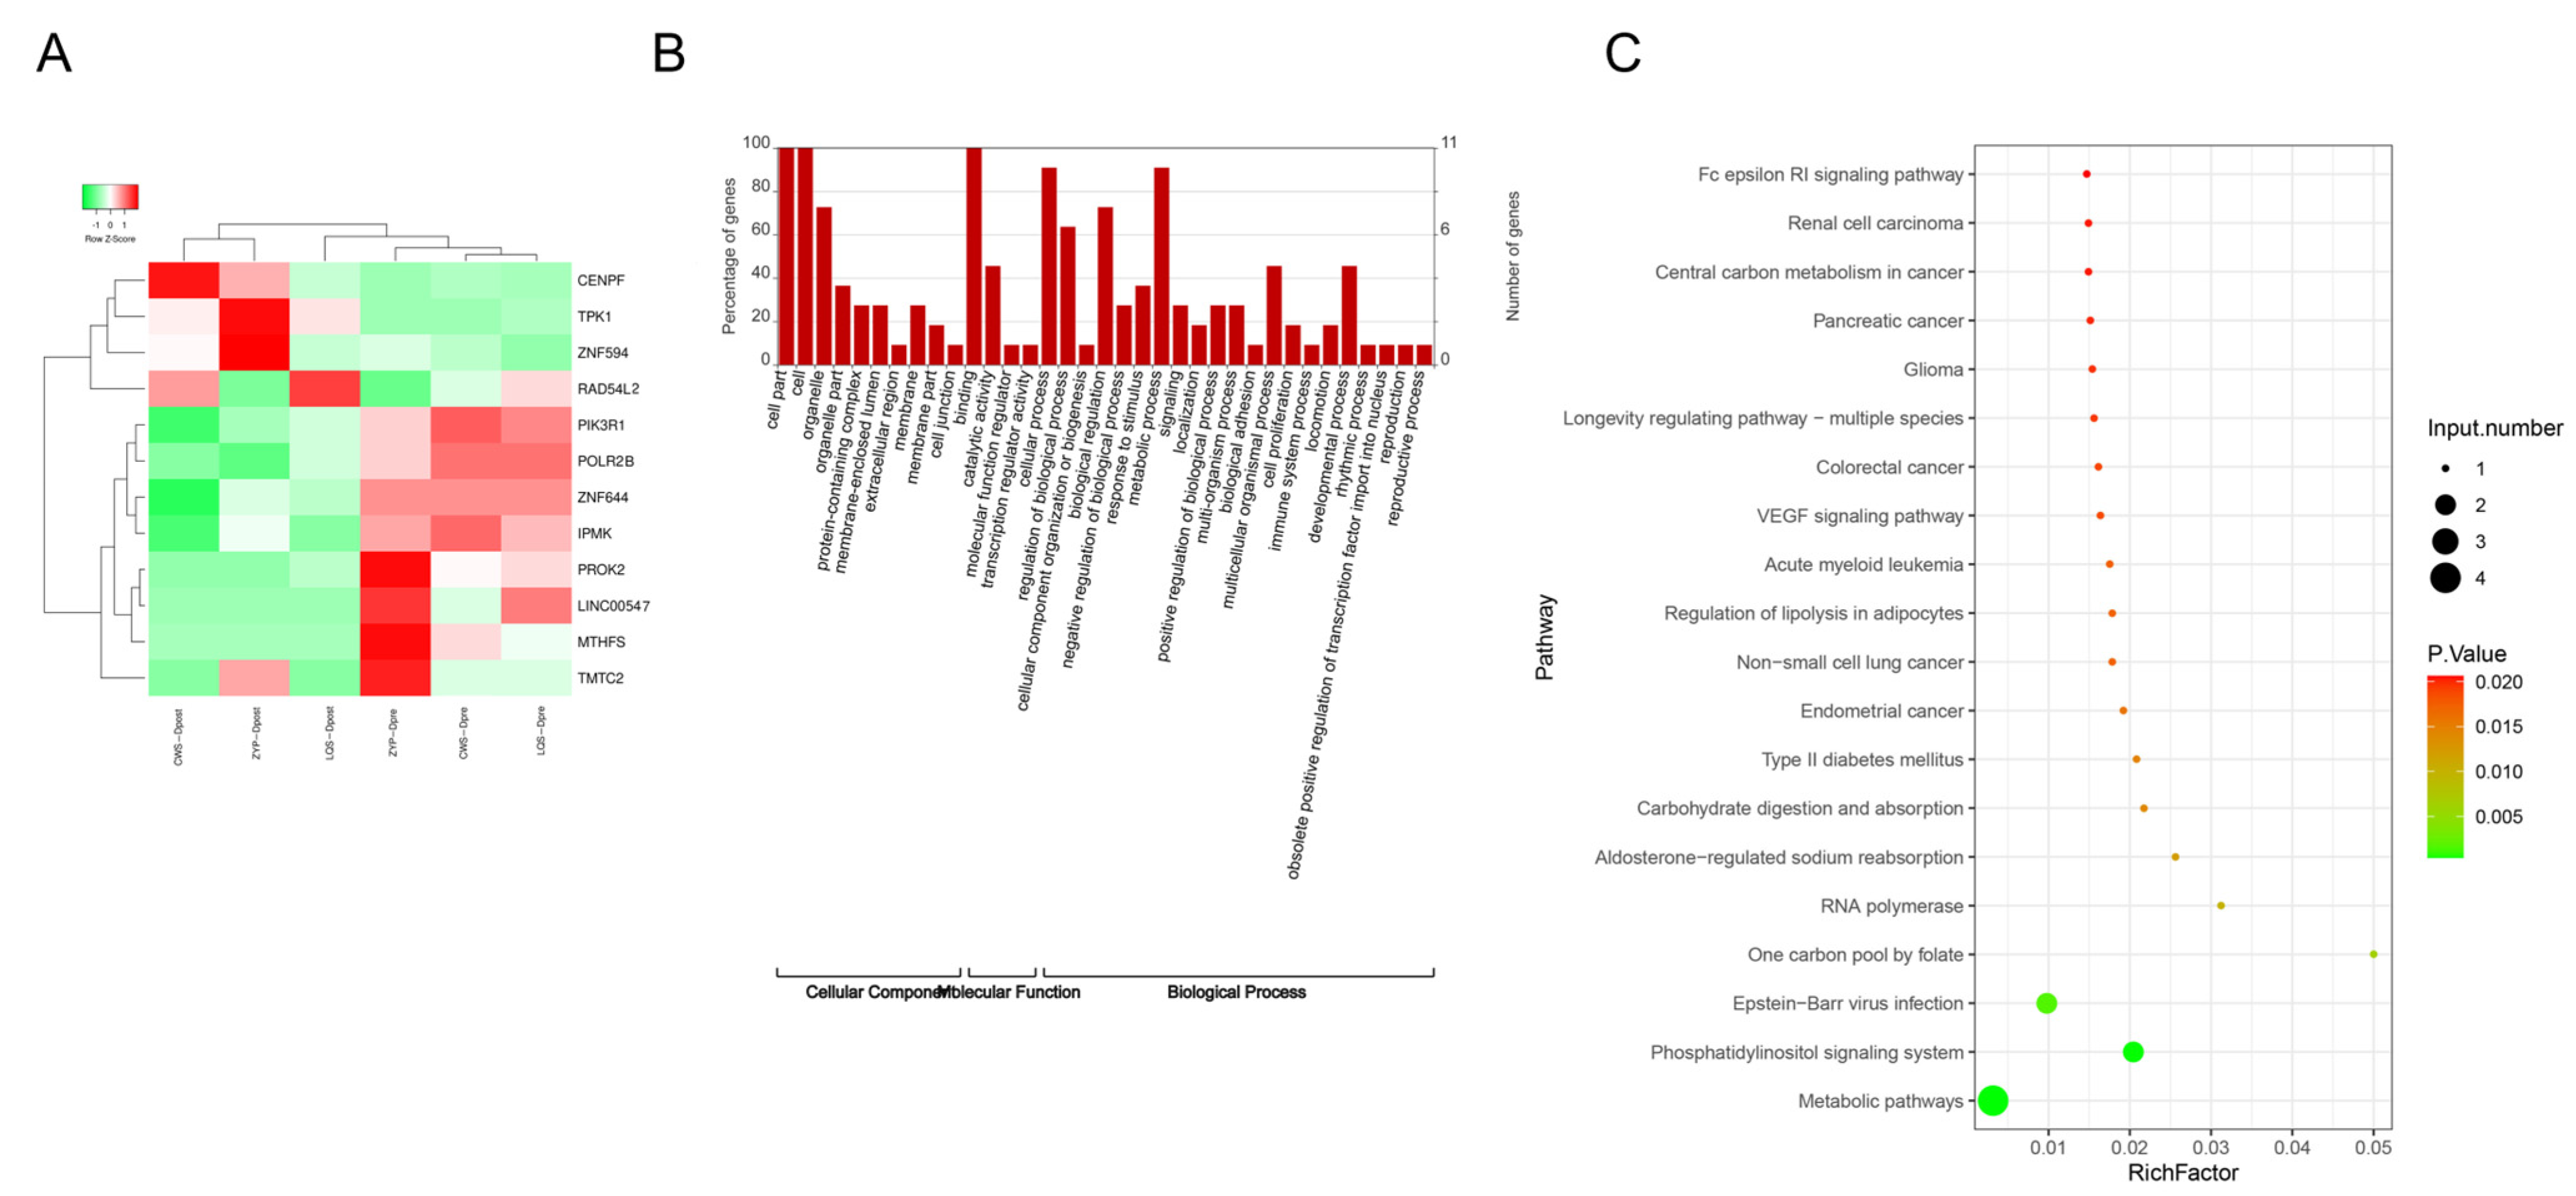
3.4. Analysis of Intersection Genes of Differential Genes in m6A Modification Sites and Differential mRNAs
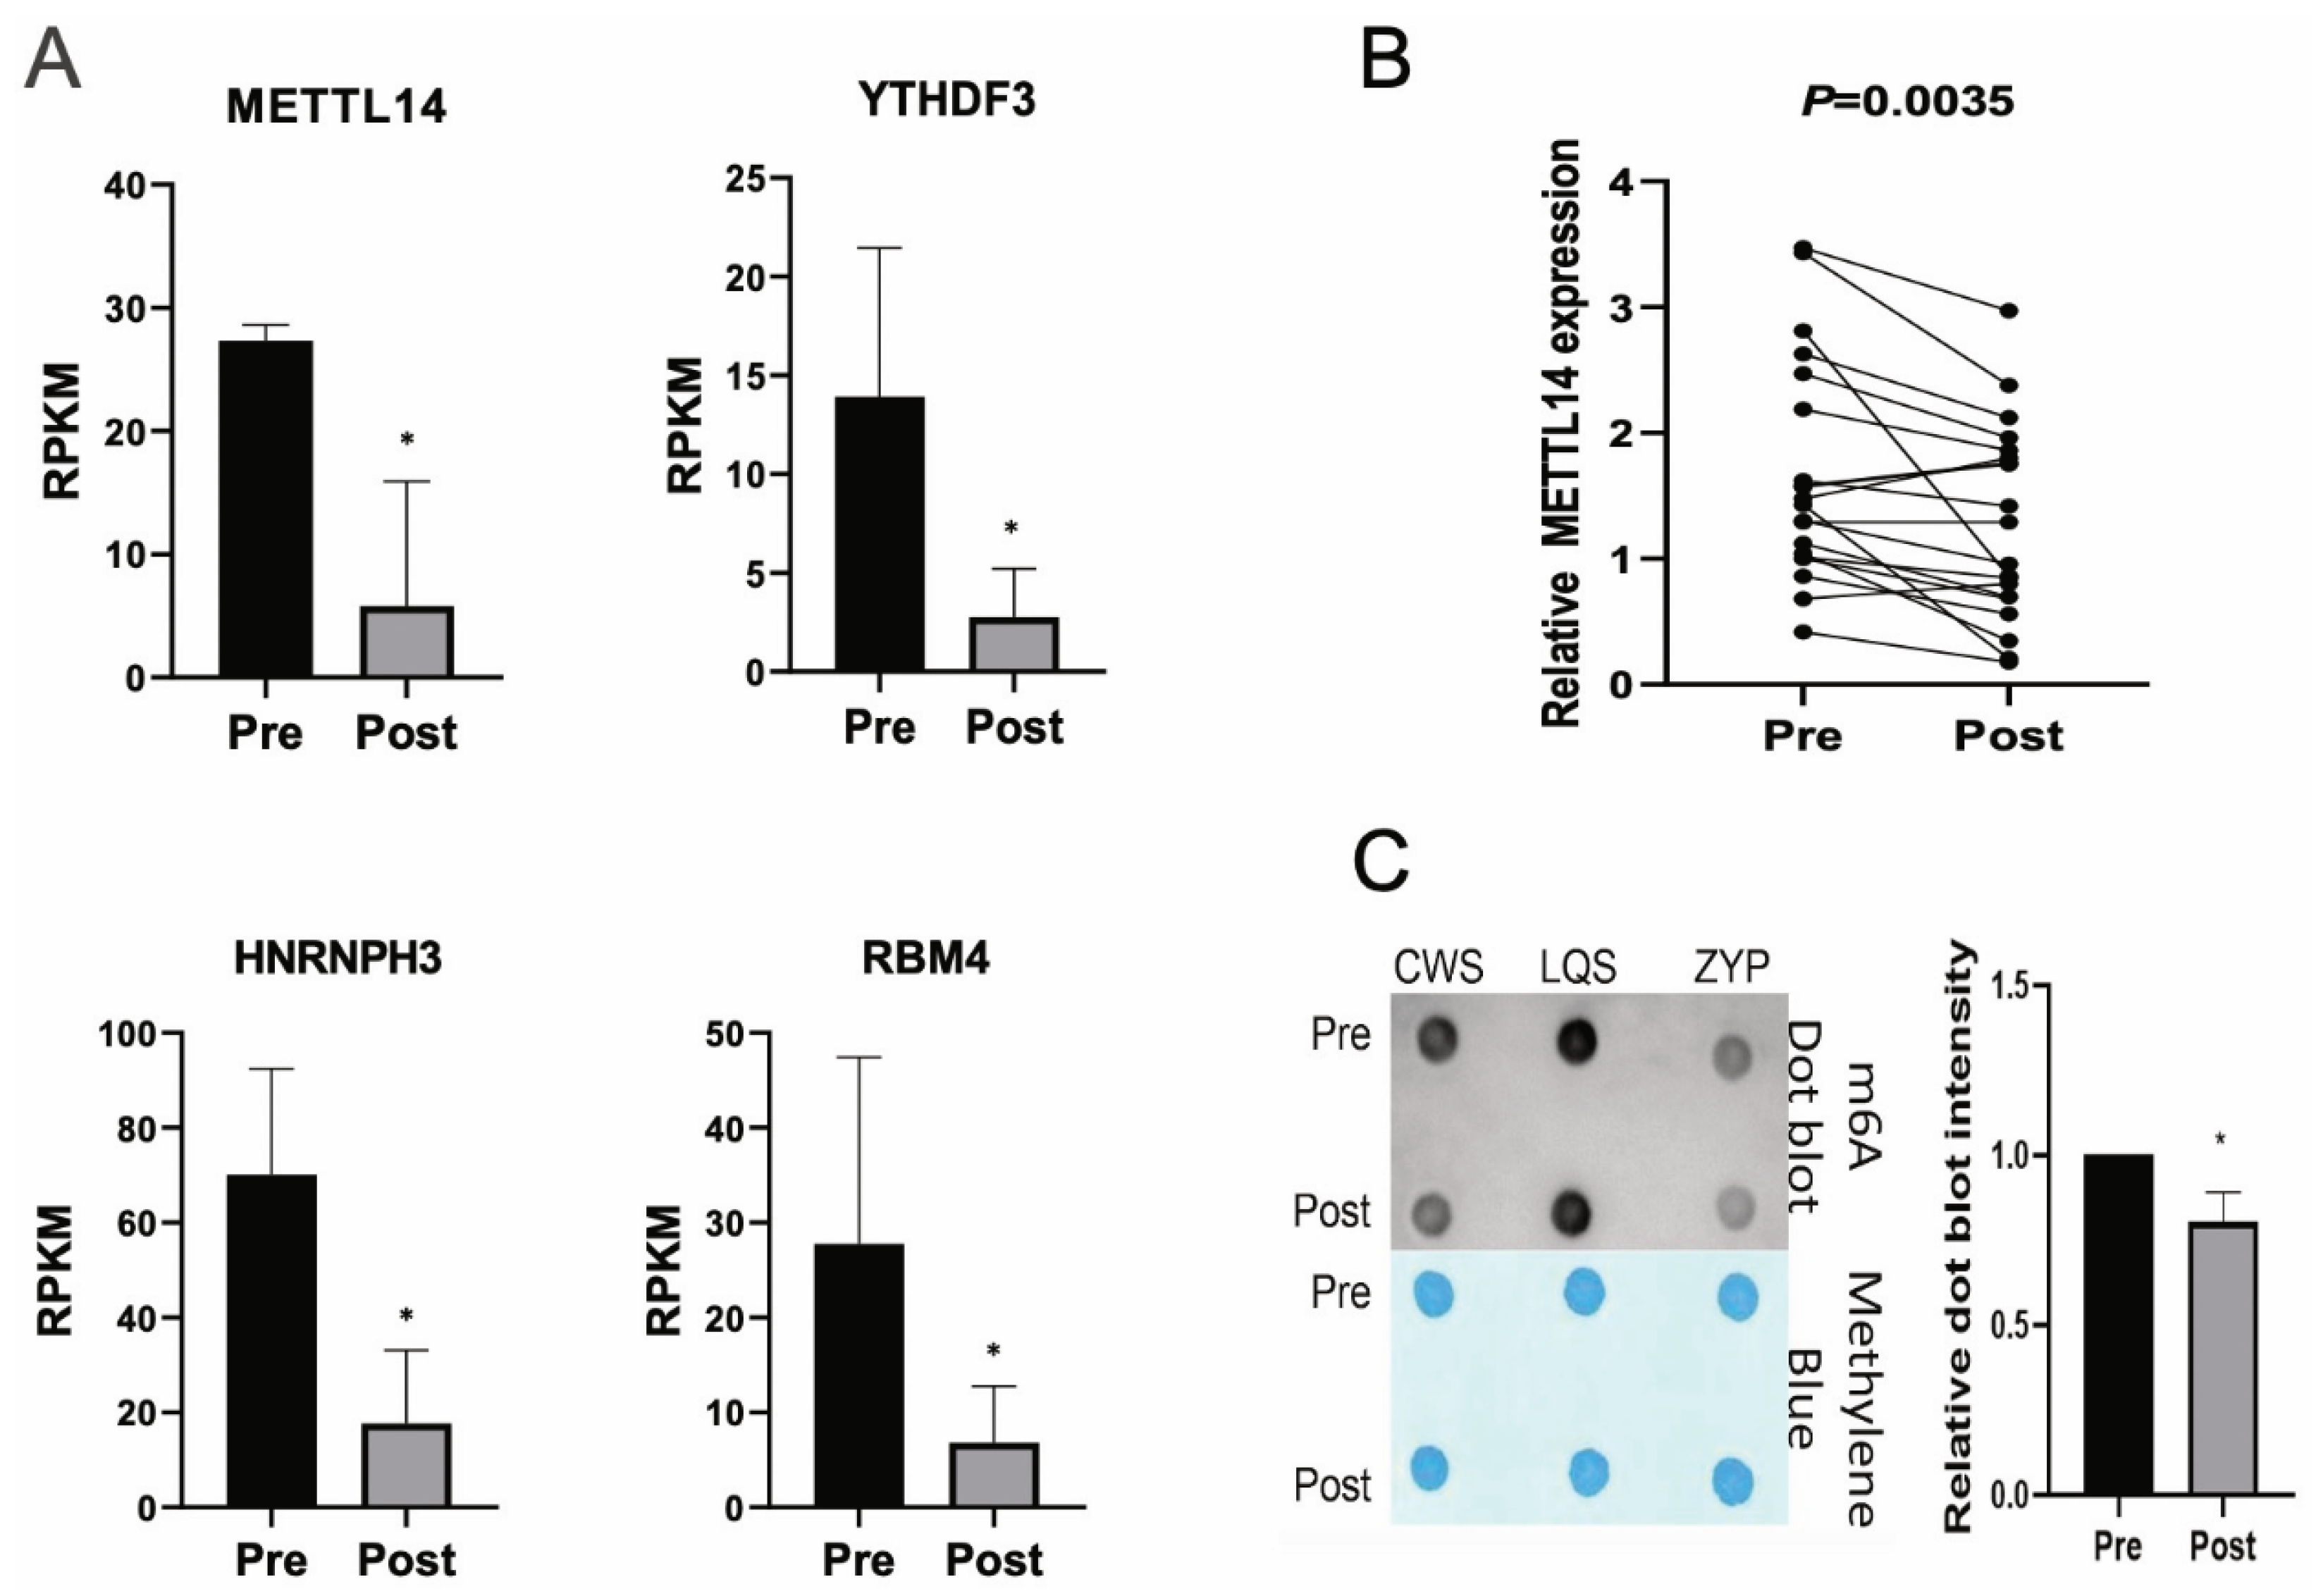
3.5. Analysis of m6A Alteration-Related Genes in Cutover Genes Before and After Intensive Insulin Therapy
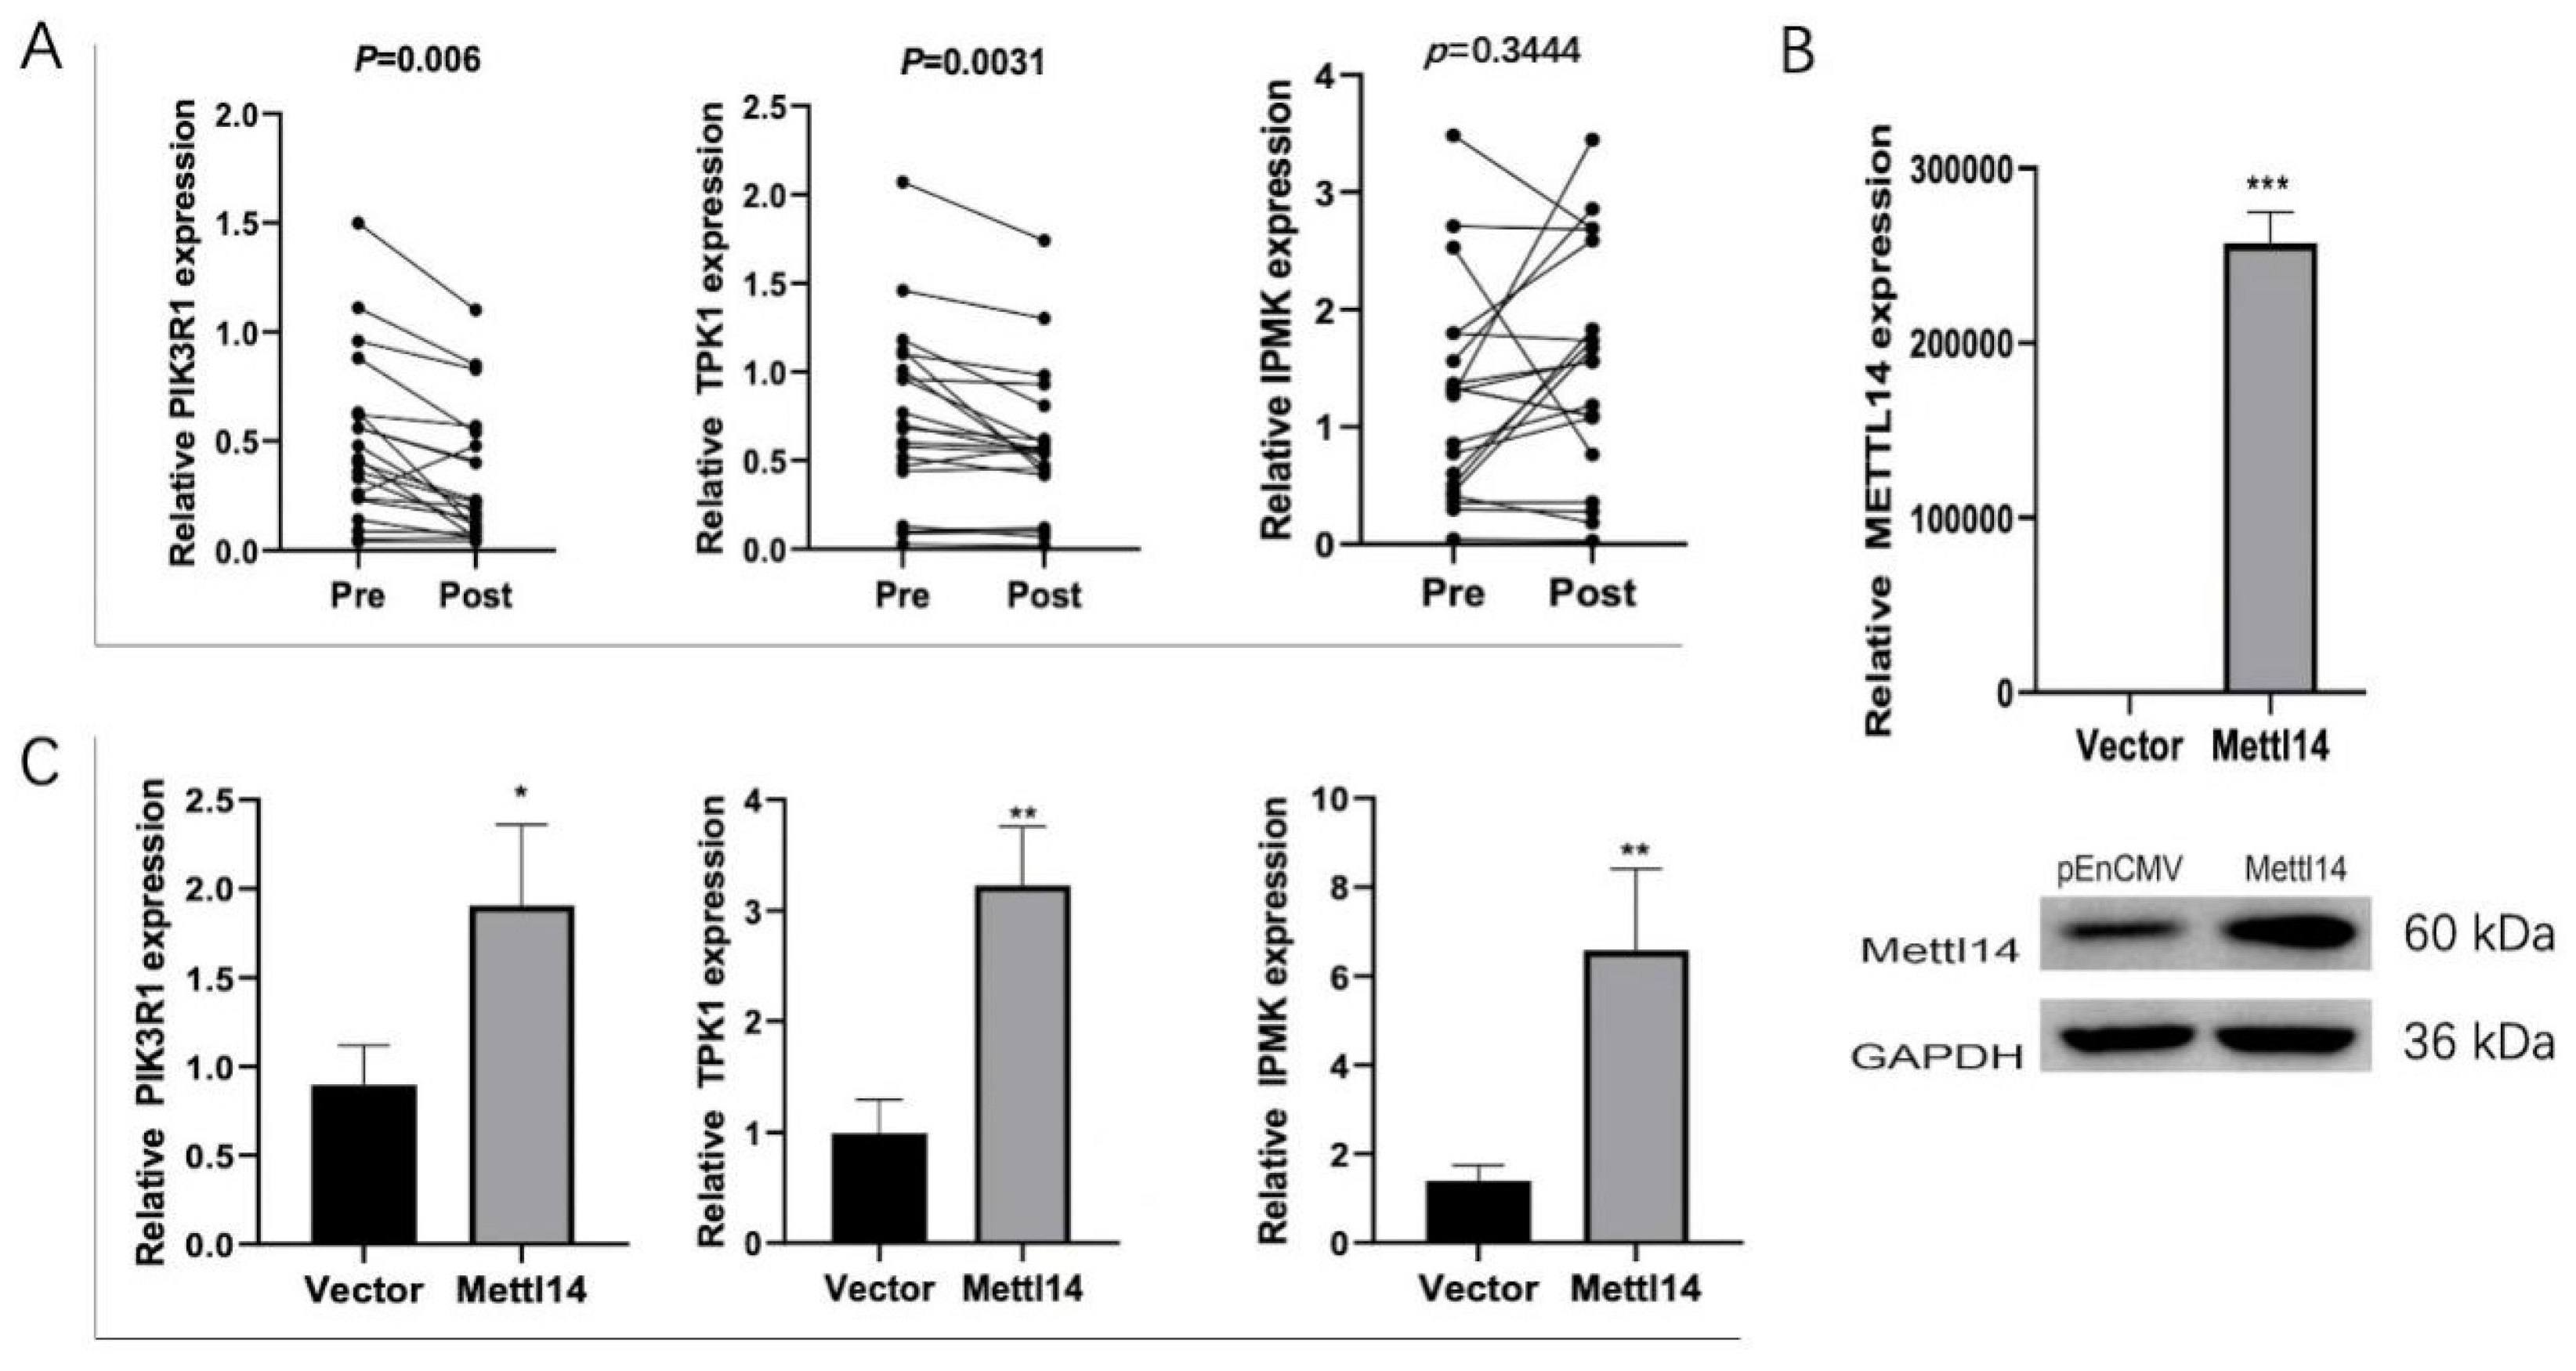
3.6. METTL14 Regulates the Expression of TPK1, IPMK and PIK3R1
4. Discussion
5. Conclusions
Author Contributions
Funding
Institutional Review Board Statement
Informed Consent Statement
Data Availability Statement
Acknowledgments
Conflicts of Interest
References
- Ortiz-Martínez, M.; González-González, M.; Martagón, A.J.; Hlavinka, V.; Willson, R.C.; Rito-Palomares, M. Recent Developments in Biomarkers for Diagnosis and Screening of Type 2 Diabetes Mellitus. Curr. Diabetes Rep. 2022, 22, 95–115. [Google Scholar] [CrossRef] [PubMed]
- Jiang, H.; Xia, C.; Lin, J.; Garalleh, H.A.; Alalawi, A.; Pugazhendhi, A. Carbon nanomaterials: A growing tool for the diagnosis and treatment of diabetes mellitus. Environ. Res. 2023, 221, 115250. [Google Scholar] [CrossRef] [PubMed]
- Mohiuddin, M.S.; Himeno, T.; Yamada, Y.; Morishita, Y.; Kondo, M.; Tsunekawa, S.; Kato, Y.; Nakamura, J.; Kamiya, H. Glucagon Prevents Cytotoxicity Induced by Methylglyoxal in a Rat Neuronal Cell Line Model. Biomolecules 2021, 11, 287. [Google Scholar] [CrossRef] [PubMed]
- Sasako, T.; Yamauchi, T.; Ueki, K. Intensified Multifactorial Intervention in Patients with Type 2 Diabetes Mellitus. Diabetes Metab. J. 2023, 47, 185–197. [Google Scholar] [CrossRef]
- Elsayed, A.; Al-Remawi, M.; Jaber, N.; Abu-Salah, K.M. Advances in buccal and oral delivery of insulin. Int. J. Pharm. 2023, 633, 122623. [Google Scholar] [CrossRef]
- Lee, S.H.; Yoon, K.H. A Century of Progress in Diabetes Care with Insulin: A History of Innovations and Foundation for the Future. Diabetes Metab. J. 2021, 45, 629–640. [Google Scholar] [CrossRef]
- Seetharaman, R.; Pawar, S.; Advani, M. One hundred years since insulin discovery: An update on current and future perspectives for pharmacotherapy of diabetes mellitus. Br. J. Clin. Pharmacol. 2022, 88, 1598–1612. [Google Scholar] [CrossRef]
- Geng, X.; Li, Z.; Yang, Y. Emerging Role of Epitranscriptomics in Diabetes Mellitus and Its Complications. Front. Endocrinol. 2022, 13, 907060. [Google Scholar] [CrossRef]
- Sadeghi, M.; Dehnavi, S.; Shohan, M.; Jamialahmadi, T.; Sathyapalan, T.; Sahebkar, A. Potential Role of SUMO and SUMOylation in the Pathogenesis of Diabetes Mellitus. Curr. Med. Chem. 2023, 30, 1623–1637. [Google Scholar] [CrossRef]
- Wang, J.; Wang, K.; Liu, W.; Cai, Y.; Jin, H. m6A mRNA methylation regulates the development of gestational diabetes mellitus in Han Chinese women. Genomics 2021, 113, 1048–1056. [Google Scholar] [CrossRef]
- Ni, Y.; Zhang, H.; Chu, L.; Zhao, Y. m6A Modification-Association with Oxidative Stress and Implications on Eye Diseases. Antioxidants 2023, 12, 510. [Google Scholar] [CrossRef] [PubMed]
- Zhu, Y.; Li, J.; Yang, H.; Yang, X.; Zhang, Y.; Yu, X.; Li, Y.; Chen, G.; Yang, Z. The potential role of m6A reader YTHDF1 as diagnostic biomarker and the signaling pathways in tumorigenesis and metastasis in pan-cancer. Cell Death Discov. 2023, 9, 34. [Google Scholar] [CrossRef] [PubMed]
- Chen, C.; Xiang, Q.; Liu, W.; Liang, S.; Yang, M.; Tao, J. Co-expression Network Revealed Roles of RNA m6A Methylation in Human β-Cell of Type 2 Diabetes Mellitus. Front. Cell Dev. Biol. 2021, 9, 651142. [Google Scholar] [CrossRef]
- Kumari, N.; Karmakar, A.; Ahamad Khan, M.M.; Ganesan, S.K. The potential role of m6A RNA methylation in diabetic retinopathy. Exp. Eye Res. 2021, 208, 108616. [Google Scholar] [CrossRef]
- Yang, Y.; Shen, F.; Huang, W.; Qin, S.; Huang, J.T.; Sergi, C.; Yuan, B.F.; Liu, S.M. Glucose Is Involved in the Dynamic Regulation of m6A in Patients With Type 2 Diabetes. J. Clin. Endocrinol. Metab. 2019, 104, 665–673. [Google Scholar] [CrossRef]
- De Jesus, D.F.; Zhang, Z.; Kahraman, S.; Brown, N.K.; Chen, M.; Hu, J.; Gupta, M.K.; He, C.; Kulkarni, R.N. m6A mRNA Methylation Regulates Human β-Cell Biology in Physiological States and in Type 2 Diabetes. Nat. Metab. 2019, 1, 765–774. [Google Scholar] [CrossRef]
- Agarawal, K.; Anant Kulkarni, Y.; Wairkar, S. Nanoformulations of flavonoids for diabetes and microvascular diabetic complications. Drug Deliv. Transl. Res. 2023, 13, 18–36. [Google Scholar] [CrossRef]
- Hoca, M.; Becer, E.; Vatansever, H.S. The role of resveratrol in diabetes and obesity associated with insulin resistance. Arch. Physiol. Biochem. 2023, 129, 555–561. [Google Scholar] [CrossRef]
- Zhong, H.; Tang, H.F.; Kai, Y. N6-methyladenine RNA Modification (m6A): An Emerging Regulator of Metabolic Diseases. Curr. Drug Targets 2020, 21, 1056–1067. [Google Scholar] [CrossRef]
- Jia, G.; Fu, Y.; Zhao, X.; Dai, Q.; Zheng, G.; Yang, Y.; Yi, C.; Lindahl, T.; Pan, T.; Yang, Y.G.; et al. N6-methyladenosine in nuclear RNA is a major substrate of the obesity-associated FTO. Nat. Chem. Biol. 2011, 7, 885–887. [Google Scholar] [CrossRef]
- Chen, J.; Fang, Y.; Xu, Y.; Sun, H. Role of m6A modification in female infertility and reproductive system diseases. Int. J. Biol. Sci. 2022, 18, 3592–3604. [Google Scholar] [CrossRef] [PubMed]
- Chen, Y.S.; Ouyang, X.P.; Yu, X.H.; Novák, P.; Zhou, L.; He, P.P.; Yin, K. N6-Adenosine Methylation (m6A) RNA Modification: An Emerging Role in Cardiovascular Diseases. J. Cardiovasc. Transl. Res. 2021, 14, 857–872. [Google Scholar] [CrossRef]
- Edhager, A.V.; Povlsen, J.A.; Løfgren, B.; Bøtker, H.E.; Palmfeldt, J. Proteomics of the Rat Myocardium during Development of Type 2 Diabetes Mellitus Reveals Progressive Alterations in Major Metabolic Pathways. J. Proteome Res. 2018, 17, 2521–2532. [Google Scholar] [CrossRef] [PubMed]
- Gardi, N.; Ketkar, M.; McKinnon, R.A.; Pandol, S.J.; Dutt, S.; Barreto, S.G. Down-regulation of metabolic pathways could offset the poor prognosis conferred by co-existent diabetes mellitus in pancreatic (head) adenocarcinoma. ANZ J. Surg. 2021, 91, 2466–2474. [Google Scholar] [CrossRef] [PubMed]
- Li, X.; Yang, Y.; Chen, Z. Downregulation of the m6A reader protein YTHDC1 leads to islet β-cell failure and diabetes. Metabolism 2023, 138, 155339. [Google Scholar] [CrossRef]
- Li, M.; Deng, L.; Xu, G. METTL14 promotes glomerular endothelial cell injury and diabetic nephropathy via m6A modification of α-klotho. Mol. Med. 2021, 27, 106. [Google Scholar] [CrossRef]
- Marcé-Grau, A.; Martí-Sánchez, L.; Baide-Mairena, H.; Ortigoza-Escobar, J.D.; Pérez-Dueñas, B. Genetic defects of thiamine transport and metabolism: A review of clinical phenotypes, genetics, and functional studies. J. Inherit. Metab. Dis. 2019, 42, 581–597. [Google Scholar] [CrossRef]
- Ortigoza-Escobar, J.D.; Molero-Luis, M.; Arias, A.; Martí-Sánchez, L.; Rodriguez-Pombo, P.; Artuch, R.; Pérez-Dueñas, B. Treatment of genetic defects of thiamine transport and metabolism. Expert Rev. Neurother. 2016, 16, 755–763. [Google Scholar] [CrossRef]
- Jung, I.R.; Anokye-Danso, F.; Jin, S.; Ahima, R.S.; Kim, S.F. IPMK modulates hepatic glucose production and insulin signaling. J. Cell. Physiol. 2022, 237, 3421–3432. [Google Scholar] [CrossRef]
- Kwok, A.; Zvetkova, I.; Virtue, S.; Luijten, I.; Huang-Doran, I.; Tomlinson, P.; Bulger, D.A.; West, J.; Murfitt, S.; Griffin, J.; et al. Truncation of Pik3r1 causes severe insulin resistance uncoupled from obesity and dyslipidaemia by increased energy expenditure. Mol. Metab. 2020, 40, 101020. [Google Scholar] [CrossRef]
- Karadoğan, A.H.; Arikoglu, H.; Göktürk, F.; İşçioğlu, F.; İpekçi, S.H. PIK3R1 gene polymorphisms are associated with type 2 diabetes and related features in the Turkish population. Adv. Clin. Exp. Med. 2018, 27, 921–927. [Google Scholar] [CrossRef]
- Okabayashi, T.; Ichikawa, K.; Namikawa, T.; Sugimoto, T.; Kobayashi, M.; Hanazaki, K. Effect of perioperative intensive insulin therapy for liver dysfunction after hepatic resection. World J. Surg. 2011, 35, 2773–2778. [Google Scholar] [CrossRef] [PubMed]


| Characteristic | Three Diabetic Patients | Twenty Diabetic Patients | Twenty-Three Diabetic Patients with Thiamine (Group A) | Seventy Diabetic Patients Without Thiamine as Control (Group B) | Group A vs. Group B | |
|---|---|---|---|---|---|---|
| t or χ2 | p-Value | |||||
| Age, years | 53.67 (7.51) | 51.4 (11.32) | 55.76 (8.93) | 54.49 (8.29) | 4.57 | 0.79 |
| Gender *: | ||||||
| Male | 2 | 12 | 15 | 46 | 0.00 | 0.97 |
| Female | 1 | 8 | 8 | 24 | ||
| Estimated disease duration, months | 6.33 (2.89) | 4.47 (4.60) | 10.36 (3.95) | 10.10 (4.33) | 0.69 | 0.49 |
| Systolic blood pressure, mm Hg | 135.33 (9.61) | 137.05 (17.79) | 132.54 (20.31) | 132.85 (13.70) | −0.95 | 0.34 |
| Diastolic blood pressure, mm Hg | 92.00 (10.39) | 86.80 (10.12) | 88.15 (12.38) | 87.76 (11.47) | 1.28 | 0.20 |
| Body mass index | 29.67 (9.23) | 24.84 (2.99) | 25.5 (3.78) | 25.46 (4.06) | 1.51 | 0.13 |
| Waist circumference, cm | 90.00 (3.61) | 92.10 (7.98) | 93.23 (8.89) | 93.29 (6.98) | −2.71 | 0.79 |
| Waist-to-hip ratio | 0.92 (0.03) | 0.96 (0.06) | 0.97 (0.06) | 0.98 (0.07) | −0.92 | 0.36 |
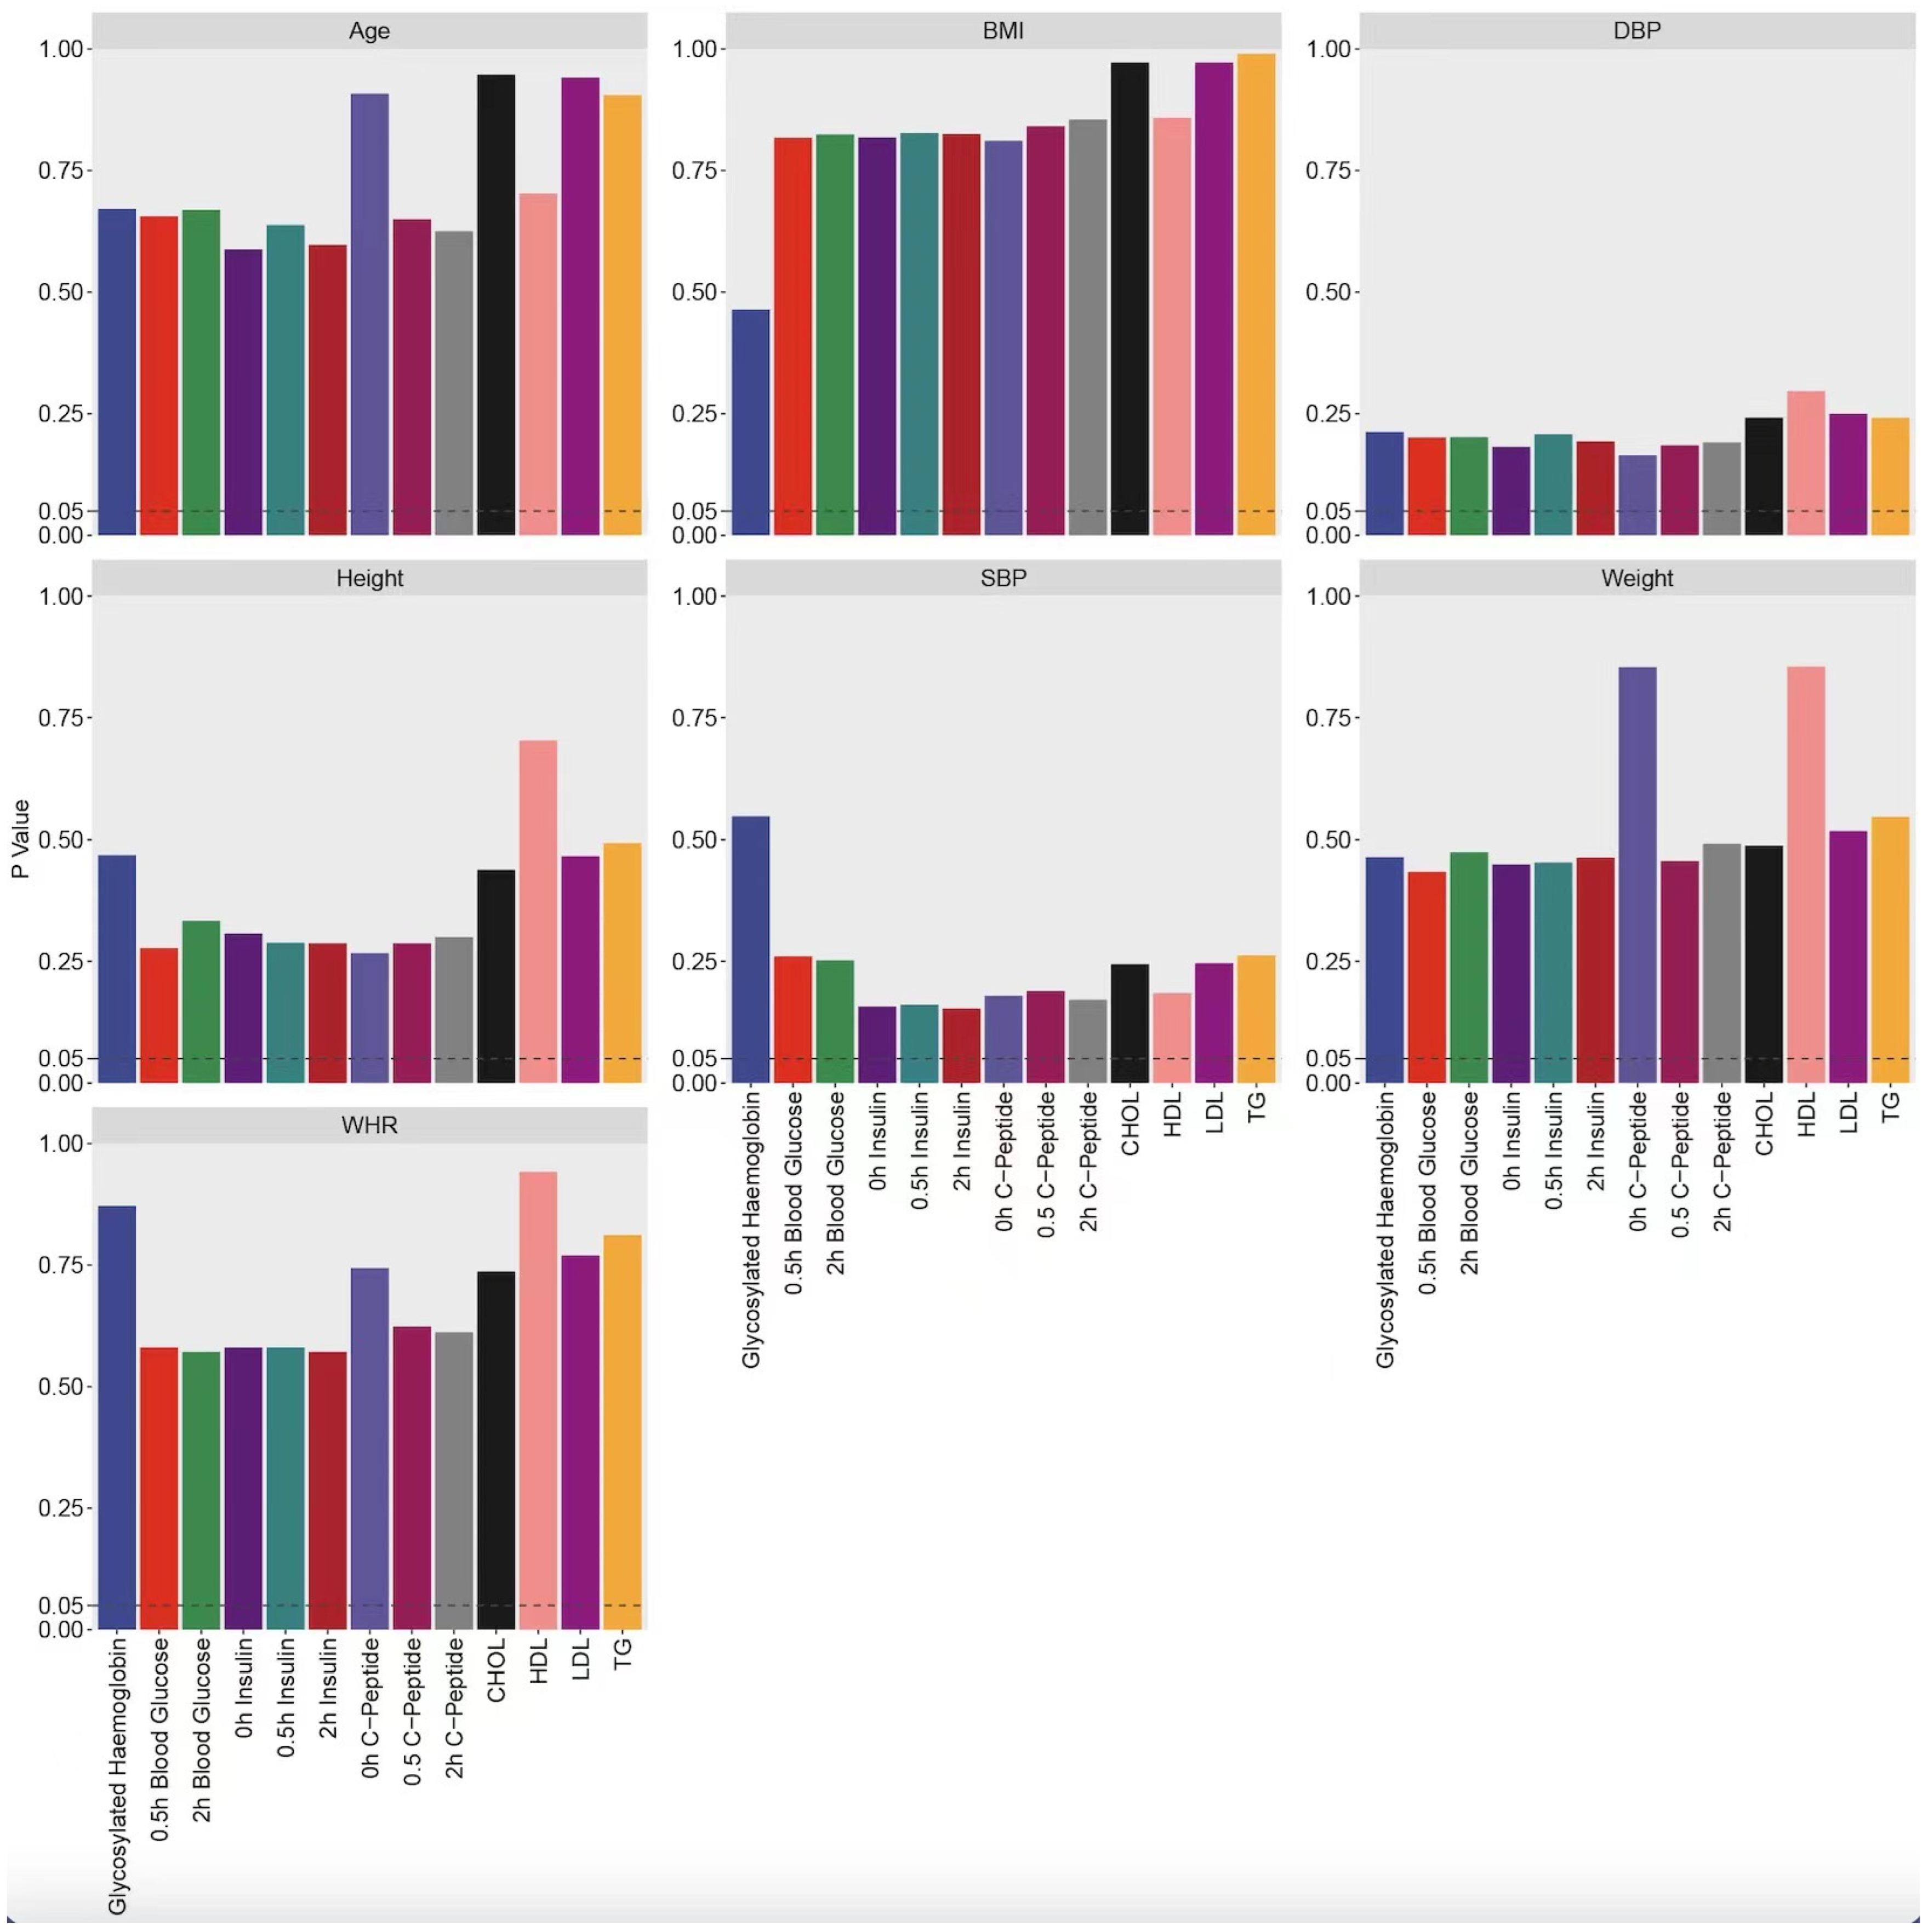
| Indicator | n | Normal Test | Detection of Difference Significance | ||
|---|---|---|---|---|---|
| p-Value (Pre-Treatment) | p-Value (Difference) | p-Value (Post-Treatment) | p-Value (Difference) | ||
| glycosylated hemoglobin | 82 | 0.000 | 0.000 | 0.285 | 0.306 |
| 2 h blood glucose | 96 | 0.067 | 0.000 | 0.972 | 0.890 |
| 0.5 h blood glucose | 95 | 0.006 | 0.038 | 0.126 | 0.625 |
| 0 h insulin | 97 | 0.000 | 0.001 | 0.950 | 0.490 |
| 0.5 h insulin | 95 | 0.000 | 0.000 | 0.844 | 0.746 |
| 2 h insulin | 97 | 0.000 | 0.000 | 0.995 | 0.490 |
| 0 h C-Peptide | 100 | 0.000 | 0.000 | 0.411 | 0.805 |
| 0.5 h C-Peptide | 97 | 0.000 | 0.000 | 0.551 | 0.886 |
| 2 h C-Peptide | 100 | 0.000 | 0.001 | 0.928 | 0.339 |
| CHOL | 91 | 0.291 | 0.422 | 0.108 | 0.097 |
| TG | 91 | 0.000 | 0.000 | 0.034 | 0.003 |
| HDL | 88 | 0.000 | 0.000 | 0.278 | 0.274 |
| LDL | 92 | 0.200 | 0.309 | 0.103 | 0.133 |
Disclaimer/Publisher’s Note: The statements, opinions and data contained in all publications are solely those of the individual author(s) and contributor(s) and not of MDPI and/or the editor(s). MDPI and/or the editor(s) disclaim responsibility for any injury to people or property resulting from any ideas, methods, instructions or products referred to in the content. |
© 2025 by the authors. Licensee MDPI, Basel, Switzerland. This article is an open access article distributed under the terms and conditions of the Creative Commons Attribution (CC BY) license (https://creativecommons.org/licenses/by/4.0/).
Share and Cite
Peng, M.; Zhang, Y.; Weng, X.; Wu, J.; Luo, T.; Dong, Y.; Wen, S.; Liang, N.; Zhong, L.; Zhai, Y.; et al. Thiamine and METTL14 in Diabetes Management with Intensive Insulin Therapy. Biomedicines 2025, 13, 980. https://doi.org/10.3390/biomedicines13040980
Peng M, Zhang Y, Weng X, Wu J, Luo T, Dong Y, Wen S, Liang N, Zhong L, Zhai Y, et al. Thiamine and METTL14 in Diabetes Management with Intensive Insulin Therapy. Biomedicines. 2025; 13(4):980. https://doi.org/10.3390/biomedicines13040980
Chicago/Turabian StylePeng, Miaoguan, Yingying Zhang, Xiaoshi Weng, Jianfeng Wu, Taizhen Luo, Yanmei Dong, Shiyun Wen, Naifeng Liang, Liangying Zhong, Yaojie Zhai, and et al. 2025. "Thiamine and METTL14 in Diabetes Management with Intensive Insulin Therapy" Biomedicines 13, no. 4: 980. https://doi.org/10.3390/biomedicines13040980
APA StylePeng, M., Zhang, Y., Weng, X., Wu, J., Luo, T., Dong, Y., Wen, S., Liang, N., Zhong, L., Zhai, Y., Xie, Y., Xie, Y., & Chen, Y. (2025). Thiamine and METTL14 in Diabetes Management with Intensive Insulin Therapy. Biomedicines, 13(4), 980. https://doi.org/10.3390/biomedicines13040980