1. Introduction
Metastases remain the leading cause of cancer-related deaths and one of the biggest challenges in oncology [
1,
2]. During the metastatic cascade, cancer cells shed from the primary tumor and travel through the blood and lymphatic vessels. Circulating tumor cells can escape from the vasculature (extravasation) in a distant organ and attach there (arrest/homing) to form a secondary colony [
3]. These colonies are avascular groups of cancer cells, 0.2–2 mm in size, termed micrometastases [
4]. If not destroyed by the immune system, micrometastases may either stay dormant or progress to bigger, blood-perfused macrometastases (>2 mm) [
4,
5,
6]. This conversion from micrometastases to massive secondary neoplasms is driven by a tumor-induced acceleration of blood vessel growth in the vicinity of the cancer cell colony (“the angiogenic switch”) [
7,
8].
A fundamental question in cancer biology that is intrinsically coupled with the understanding of the mechanisms of micrometastases is the preferential metastatic organotropism [
3,
9,
10]. This phenomenon of the more frequent formation of metastases of certain types of tumors in certain organs is well-known by Paget’s “seed and soil” metaphor [
11]. Notably, the modern vision of the “seeds and soils” principle does not deny the role of the differential blood supply patterns of various organs [
12]. In fact, it emphasizes the contribution of the initial interactions between extravasated cancer cells (“the seeds”) and the host microenvironments of distant organs (“the soils”) to the formation of the micrometastatic colonies [
13,
14]. Then, the effects of the organ-specific “soil” on the early metastatic colonization competency [
6] and the ability of the newly formed colonies to induce angiogenic switch [
7] are the key aspects of cancer progression from the micro- to the macrometastatic stage [
15,
16]. As these factors eventually define the chances of cancer patients to survive, micrometastases are considered a promising treatment target [
12].
In contrast to macrometastases, the early stages of the metastatic cascade, from homing to the angiogenic switch, are extremely difficult to detect and study under natural conditions, and even more so in the lab for several reasons [
17,
18]. Clinically, micrometastases are mostly asymptomatic [
8]. At the same time, their size is mostly below the detection threshold of the current clinical non-invasive methods (~2 mm) [
19]. Moreover, because of their small size and sparse distribution in the body, micrometastases can be easily missed, even by histology, particularly in the distant organs beyond the sentinel lymph nodes [
8,
17,
18]. As a result, studies of such latent, early-stage post-extravasation cancer events are rare [
6] and experimentally challenging [
18,
20]. This gap in micrometastases research cannot be bridged without reproducible and sustainable models of early metastatic colonization. For biological accuracy, these models should reflect several essential aspects of the micrometastases formation that are briefly discussed below.
The metastatic colonization of distant organs starts from and is particularly affected by the interactions between extravasated cancer cells and the resident extracellular matrix (ECM) [
10,
21,
22]. A growing body of literature indicates the prominent role of the ECM’s composition and physical properties in controlling tumor progression (see [
23] for a comprehensive review). The availability and size of cellular adhesion sites and stiffness [
24], as well as confinement and porosity [
25,
26], significantly contribute to this regulation. These ECM properties vary greatly between different organs [
22,
27,
28,
29]. Then, the biologically relevant models of micrometastases should integrate cancer cells with the native organ-specific ECM [
30,
31,
32]. Seemingly, such environments could be available via animal models. However, animal models of experimental or spontaneous metastases are rather suitable for the induction of macrometastases [
13,
33,
34] that are amenable to contrast-enhanced medical imaging modalities [
35]. Experimental metastases (induced by injections of cancer cells suspensions into the bloodstream) poorly reflect the human patterns of metastatic cancer organotropism [
33]. Spontaneous (derived from the transplanted tumors) or genetically engineered animal models of metastases possess many limitations linked to the contribution of the immunocompromised microenvironment, the animal origin of the tumors, or the time course of the metastatic disease development. Overall, animal modeling is not ideal for the micrometastases simulation due to the low throughput capacity [
36] (vs. a high cost). This is especially notable in drug development research, where large and reproducible numbers of representative colonies are needed. On the contrary, in vitro models such as conventional monolayers and 3D multicellular spheroids cannot reflect the micrometastatic biology and are missing the role of the ECM as the homing niche [
37].
Tissue engineering provides a valuable tool for the reconstruction of organ-specific environments by using organ-derived ECMs as three-dimensional (3D) scaffolds for cell culture. Such scaffolds are obtained by decellularization (DCL). DCL involves the removal of cells from native organs, tissues, or cultured cell sheets [
38,
39,
40,
41,
42]. Decellularized tissues are among the most clinically successful biomaterials in regenerative medicine, because they preserve three essential organ-specific features of the ECM: The composition, architecture, and biomechanical properties that support the desired tissue regrowth [
43]. In vitro 3D tumor models on decellularized scaffolds hold great promise for cancer biology research, drug development, and nanomedicine [
44,
45,
46].
The best quality of DCL (implying a low level of cellular residuals and a minimally affected ECM [
47]) can be achieved by perfusion of whole organs via natural vasculature (whole-organ DCL, or WO-DCL) in a bioreactor [
41,
48] or in situ [
49,
50]. This requires a precise surgical technique with cannulation of the blood vessels in a live anesthetized animal, followed by ex vivo processing/preparation of the cannulated and extirpated organ. Unfortunately, WO-DCL is almost non-scalable (i.e., one animal, one organ, and one bioreactor place at a time) and therefore non-applicable in high-throughput applications. Alternatively, small fragments of organs and tissues can be decellularized by immersion in static or shaking baths, with the solutions able to destroy cellular membranes and remove cellular debris from tissues [
42]. This well-established technology is widely used to prepare highly biocompatible collagen-based biomaterials for clinical applications [
51]. However, further processing (e.g., freeze-drying and solubilization) of the decellularized materials obtained by immersion DCL is usually required to achieve reproducibility and scalability of biomaterial production [
51,
52,
53,
54]. Such processing destroys the tissue-specific architecture of the ECM, transforming it into a handy but artificial substrate. In addition, the sourcing of tissues for DCL remains an ethical, economic, and biosafety problem. In regenerative medicine, human cadaveric and discarded organs and tissues are the preferred but low-available materials for DCL [
47]. As the ECM is evolutionary conservative across many animal species [
55,
56,
57], there is an option to use organs and tissues, for example, from cows and pigs, to produce DCL scaffolds [
52,
58].
In the current study, we employed a DCL-based tissue engineering methodology to create a new organ-specific model of micrometastases applicable in vitro and in vivo. First, we reconciled the advantages of the WO-DCL and immersion DCL methods by introducing a new source of organs for DCL, such as chick embryos (CEs). The small size of the CE organs (up to 2–3 cm) allowed to achieve high-quality whole-organ DCL by immersion, while avoiding the need of laborious and time-consuming operations in conventional WO-DCL. We named our protocol iWO-DCL (“immersion–agitation whole-organ DCL”). It uses the same set of solutions for different organs of CEs, with parallel processing in shaking baths at room temperature under organ-specific time and shaking speed. The protocol does not require complex equipment and relies on the industry supplied poultry product (CEs) as a highly controllable, reproducible, and affordable source of organs for DCL. This allows ethical, labor-, and cost-efficient modeling of tumor micrometastases for cancer biology research and drug/nanomedicine development.
Herein, we applied iWO-DCL to create acellular organ-specific scaffolds (AOSSs) of CE brains, lungs, livers, hearts, small intestines, proventriculi and ventriculi, breast muscles, and spleens. Next, we seeded the obtained panel of AOSSs with the cells of one of the most metastatically aggressive human tumors, triple-negative breast cancer (TNBC). The obtained 3D tissue engineering constructs (TECs) were cultured in vitro for 1–4 weeks, simulating the formation of avascular micrometastases. Using TECs, we analyzed the role of organ-specific ECMs in the metastatic organotropism of TNBC and the mechanisms of the colonization of hepatic ECMs by breast cancer cells. Next, using a chick embryo chorioallantoic membrane (CAM) assay, we confirmed that the liver ECM-TNBC TECs could induce angiogenic switch in vivo. Finally, we evaluated the feasibility of our 3D tissue-engineered model of TNBC hepatic micrometastases as a testbed for drug and nanomedicine development.
2. Materials and Methods
2.1. Study Design
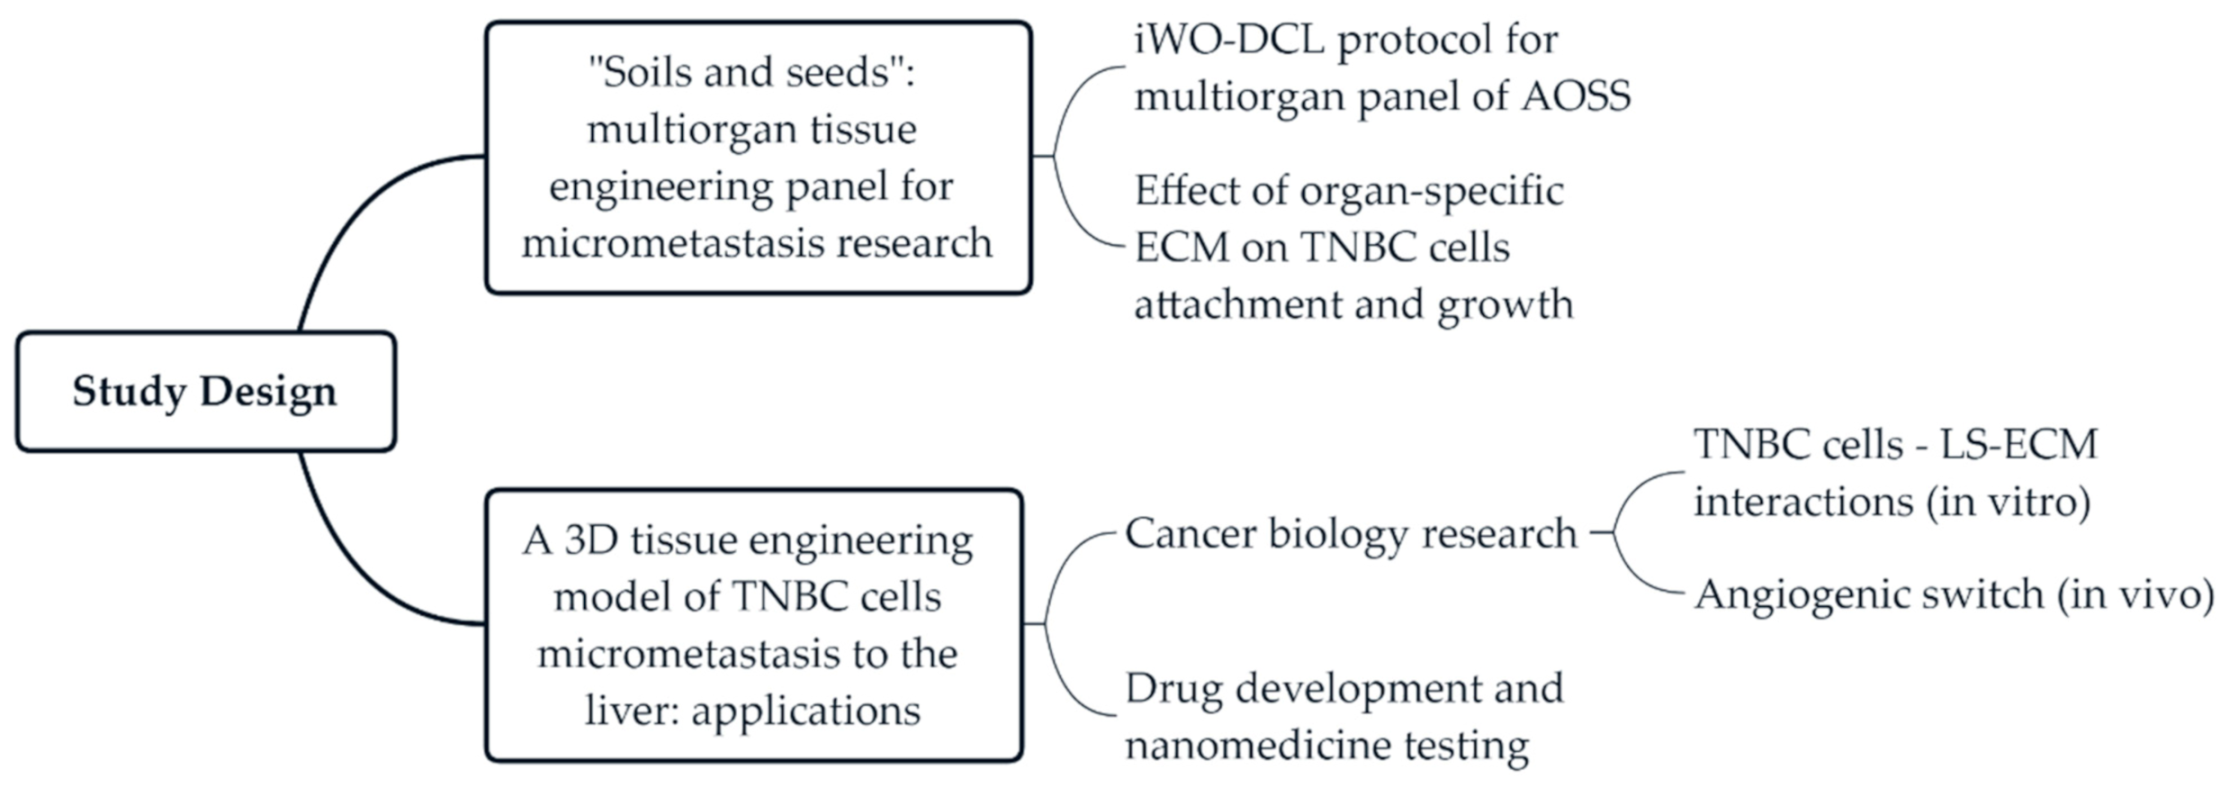
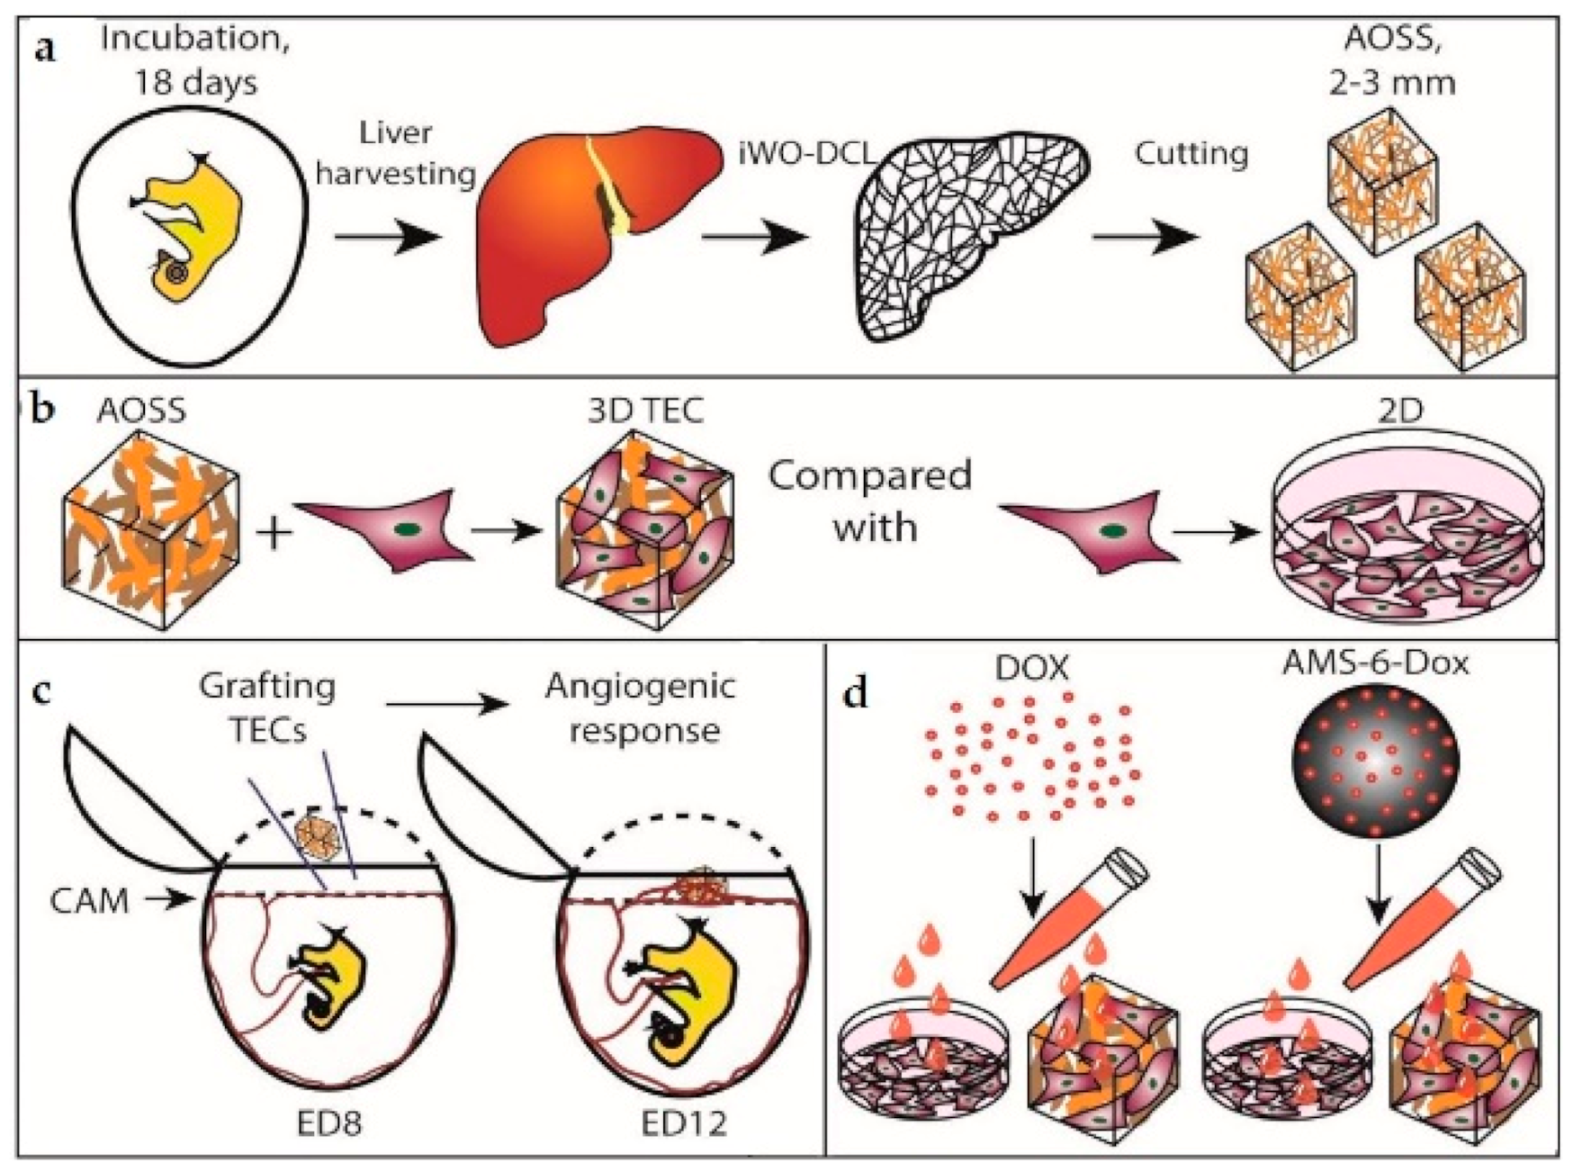
The current study includes two series of experiments (
Figure 1). In the first series, we developed a protocol of DCL that is applicable to multiple CE whole organs, and tested the in vitro biocompatibility of the obtained AOSSs by seeding them with human TNBC cells. Next, to explore the “seeds and soil” hypothesis regarding the contribution of organ-specific ECMs to the preferential metastatic spreading of breast cancer cells to certain organs, we applied digital analysis of the histological images to examine and quantify the organ-specific patterns of cellular attachment and colonization of the AOSSs. The second stage of the study was focused on the interactions between TNBC cells and liver-specific ECMs presented as CE liver-derived AOSSs. This experimental series included evaluation of the feasibility of the proposed 3D tissue engineering model of TNBC micrometastasis to the liver for cancer biology research and for drug and nanomedicine testing. The detailed design of the second series of experiments is presented in Section
Appendix A.1 and
Figure A1 (
Appendix A.1).
2.2. Chick Embryo Incubation and Organ Collection
This study was approved by the animal ethics committee protocols of Macquarie University (ARA # 2015/006) and the University of New South Wales (ACEC #19/103B). Fertilized chicken (
Gallus domesticus, the broiler breed
Ross 308) eggs were delivered from a local hatchery. After delivery, the eggs were rested for 3–4 h at room temperature and then incubated in a standard cradle-type laboratory poultry incubator (R Com MARU Max 190, Autoelex Co., LTD, Andong, South Korea) at 37.5 °C and 65%–70% humidity with hourly turn over until embryonic day 18 (ED18), which is 3 days before natural hatching. This period was sufficient for the histoanatomical development of the organ structure of a chick. On ED18, eggshells were opened by a cut on the blunt ends of eggs, and the embryo with embryonic membranes was extracted using forceps and immediately decapitated (this method of culling keeps the high quality of the tissues of the chicks [
59]). Then, feathers were removed from the abdominal walls and thoraxes of the CEs, and the organs of interest were carefully extracted through a central section. The animal procedure used for the angiogenic assay on the CE chorioallantoic membrane (CAM) is described below in
Appendix A (Section
Appendix A.3.4).
2.3. Immersion Whole-Organ Decellularization (iWO-DCL)
The iWO-DCL was performed by our original immersion DCL method [
36,
60] with some modifications. The extracted CE organs, including the livers, lungs, hearts, ventriculi and proventriculi, brains, small intestines, spleens, breast muscles, and skins, were washed in sterile PBS and placed in 50 mL Falcone tubes, with 5–15 organs/per tube (depending on the organ’s size, for example, up to 5 livers per tube) filled with 35 mL of 0.1% solution of sodium dodecyl sulphate (SDS) in phosphate-buffered saline (PBS), then closed tightly and fixed horizontally on the platform of an orbital shaker. Then, the organs underwent shaking at a speed of 90–150 rotations per minute (rpm) with periodic aseptic changes of washing media for a fresh portion every 3 h during the first 12 h, and then every 6 h during the next 12 h. Afterward, the solution was changed daily until the organs became translucent, and the liquid media turned colorless and transparent. The total processing time ranged from 2 to 21 days depending on the organ (approximately 14–21 days for the livers, and 2–4 days for smaller organs and the embryo batch). Next, the processed organs were aseptically placed in sterile containers and washed with a 1% antibiotic–antimycotic solution (A-A) (#A5955, Sigma-Aldrich, North Ryde, NSW, Australia) in PBS (pH 7.0) under shaking (30–90 rpm) with periodical changing of A-A/PBS with fresh portions, until the washing media became transparent and colorless, with no observable tissue components or foam. The processing was performed at room temperature. An overview and the technical notes explaining further details of the iWO-DCL protocol are shown in
Table A1 in
Appendix A.2, and
Supplementary Video S1 in Supplementary Materials.
The as-obtained scaffolds were stored in a fresh sterile 1% A-A/PBS solution in a fridge (+4 °C) until further use, which preserved their functionality as 3D culture substrates for at least one year. The iWO-DCL protocol presented here was tested for the Ross 308, Cobb 500, and several Rhode Island × White Leghorn crossbreed CEs (on at least a hundred eggs of each type). The best and most robust performance was achieved when using the broiler breeds (Cobb 500 and Ross 308), while individual stage- and organ-specific adaptations were required for the others, e.g., the layer chicken eggs.
2.4. Cell Culture
MDA-MB-231 (ECACC 92020424) cells were expanded by culture in complete culture medium (CCM) prepared from Dulbecco’s Modified Eagle’s Medium (#D8437, DMEM/F12/Ham medium, Sigma-Aldrich, North Ryde, NSW, Australia) supplemented with 10% fetal bovine serum (#12003C, FBS; Sigma-Aldrich, North Ryde, NSW, Australia) and 1% penicillin–streptomycin (PS; 10,000 U/mL; #15140122, Gibco) under standard conditions (37 °C, humidified, 5% CO2 gas atmosphere). The culture medium was changed every two days, and the cellular growth was controlled using a phase-contrast microscope and cell counting. According to the cell counting data, the average population doubling time of MDA-MB-231 cells (used in the experiments in passages 4 to 6) was approximately 34 h, with an average viability of ~98%. The same culture medium was used for all in vitro experiments, unless otherwise specified.
2.5. Recellularization of CE Acellular Organ-Sepcific Scaffolds (AOSSs) with MDA-MB- 231 Cells
Small fragments (approximately 2 × 3 mm) of decellularized CE organs/tissues were cut by a scalpel and put into 24-well flat-bottom tissue culture plates (#3524Costar, Corning, Cambridge, MA, USA). One milliliter of 0.1% peracetic acid solution (#77240, Sigma-Aldrich, North Ryde, NSW, Australia) in 4% ethanol was added to every well for 2 h. Then, this solution was removed, and the AOSSs were washed with sterile PBS (0.4 mL per well) twice and sterilized by ultraviolet light in a tissue culture hood for 45 min (with turning the scaffolds with sterile tweezer twice to expose different sides). Next, each well was refilled with 1 mL of CCM. Following this, the plates with the AOSSs were placed into a tissue culture incubator and conditioned overnight under a humidified atmosphere with 5% CO2 at 37 °C. This step served for the scaffolds’ conditioning and an additional check of sterility.
MDA-MB-231 cells (1 × 10⁵ cells in a 20 µL drop of CCM) were seeded on the top of the AOSSs obtained by iWO-DCL of the CE livers, lungs, hearts, ventriculi and proventriculi, brains, small intestines, and breast muscles to form 3D TECs. One TEC was placed into each well of a 24-well culture plate. Control scaffolds were left unseeded. Next, the cells were allowed to attach to the substrates for 2 h in a tissue culture incubator, then added to with 1 mL of CCM per well and cultured for 1–28 days. On day 1, the TECs were carefully relocated to the new multiwell plates to preserve only the cell populations attached to the scaffolds. The CCM in the growing 3D cultures was carefully changed twice a week. For microscopy, viability assays, and histological analysis, the TECs were sampled on week 1 (the multiorgan panel of TECs based on CE livers, lungs, hearts, ventriculi and proventriculi, brains, small intestines, and breast muscles) or weeks 1, 2, 3, and 4 after seeding (liver-based TECs).
2.6. Analysis of the Structural Evolution of TECs
2.6.1. Histology, Histomorphometry, and Fluorescence Microscopy
The AOSSs and TECs were fixed in 10% neutral buffered formalin, dehydrated in a graded series of alcohols, embedded in paraffin wax, and cut into serial sections of 5 µm in thickness by a rotary microtome. After deparaffination, slices were stained with hematoxylin and eosin (H&E), Van Gieson’s picrofuchsin, Masson’s trichrome, and toluidine blue, following conventional protocols. Stained histological preparations were examined using an upright research microscope Axio Imager Z2 (Zeiss, Oberkochen, Germany) equipped with dry-air EC Plan-Neofluar (5×/NA0.16; 10×/NA0.30; 20×/NA0.50 Ph) and an oil-immersion Plan Apochromat (100×/NA1.46 oil) objectives (Zeiss, Oberkochen, Germany). The relative cellularity of the TECs was examined using ImageJ software via color intensity-based segmentation of the area occupied by cells relative to the total section area of the TEC on the images of H&E-stained samples. The images were recorded using a preinstalled microscope digital video camera AxioCam (1388 × 1040, Zeiss, Oberkochen, Germany) in single-frame and stitching modes using Zen 2012 software. For the rapid check of the quality of DCL and the viability of the cells in the TECs, epifluorescence microscopy was performed. For the DCL quality check, the deparaffinized sections of AOSSs were stained with DAPI (#D9542, Sigma-Aldrich, North Ryde, NSW, Australia) to detect nucleic acids and with Phalloidin-TRITC (#P1951, Sigma-Aldrich, North Ryde, NSW, Australia) to detect f-actin, following the manufacturer’s protocol. For the live–dead cell detection, the TECs were stained immediately with fluorescein diacetate (#F7378, FDA; Sigma-Aldrich, North Ryde, NSW, Australia) and propidium iodide (#P4864, PI; Sigma-Aldrich, North Ryde, NSW, Australia) according to Application Note #33 by Ibidi GmbH (Germany) [
61], counterstained with DAPI and imaged with the use of the filter settings for DAPI, FITC (for FDA), and PI on the same microscope.
2.6.2. Scanning Electron Microscopy
The samples of AOSSs and TECs were fixed in 2.5% buffered glutaric aldehyde, further dehydrated in 70%–100% alcohols and contrasted by OsO4 using the Pelco Biowave Pro+ microwave processing system (PELCO BioWave Pro, Ted Pella Inc., Redding, CA, USA), before undergoing critical point drying in Tousimis Autosamdri-815 Critical Point Dryer (Tousimis research corporation, Rockville, MD, USA). Afterward, the samples were mounted on stabs with conductive carbon/graphite paint (ProSciTech, Kirwan, QLD, Australia) and coated with platinum using an Emitech K575x Pt sputter coater (Emitech Ltd., Ashford, Kent, U.K.). Electron microscope images were taken using NovaTM NanoSEM 230 (FEI company, Hillsboro, OR, USA), which is a field emission scanning electron microscope, under an accelerating voltage of 5 kV, a work distance of 20 mm, and a size point of 30 in the secondary electron imaging mode.
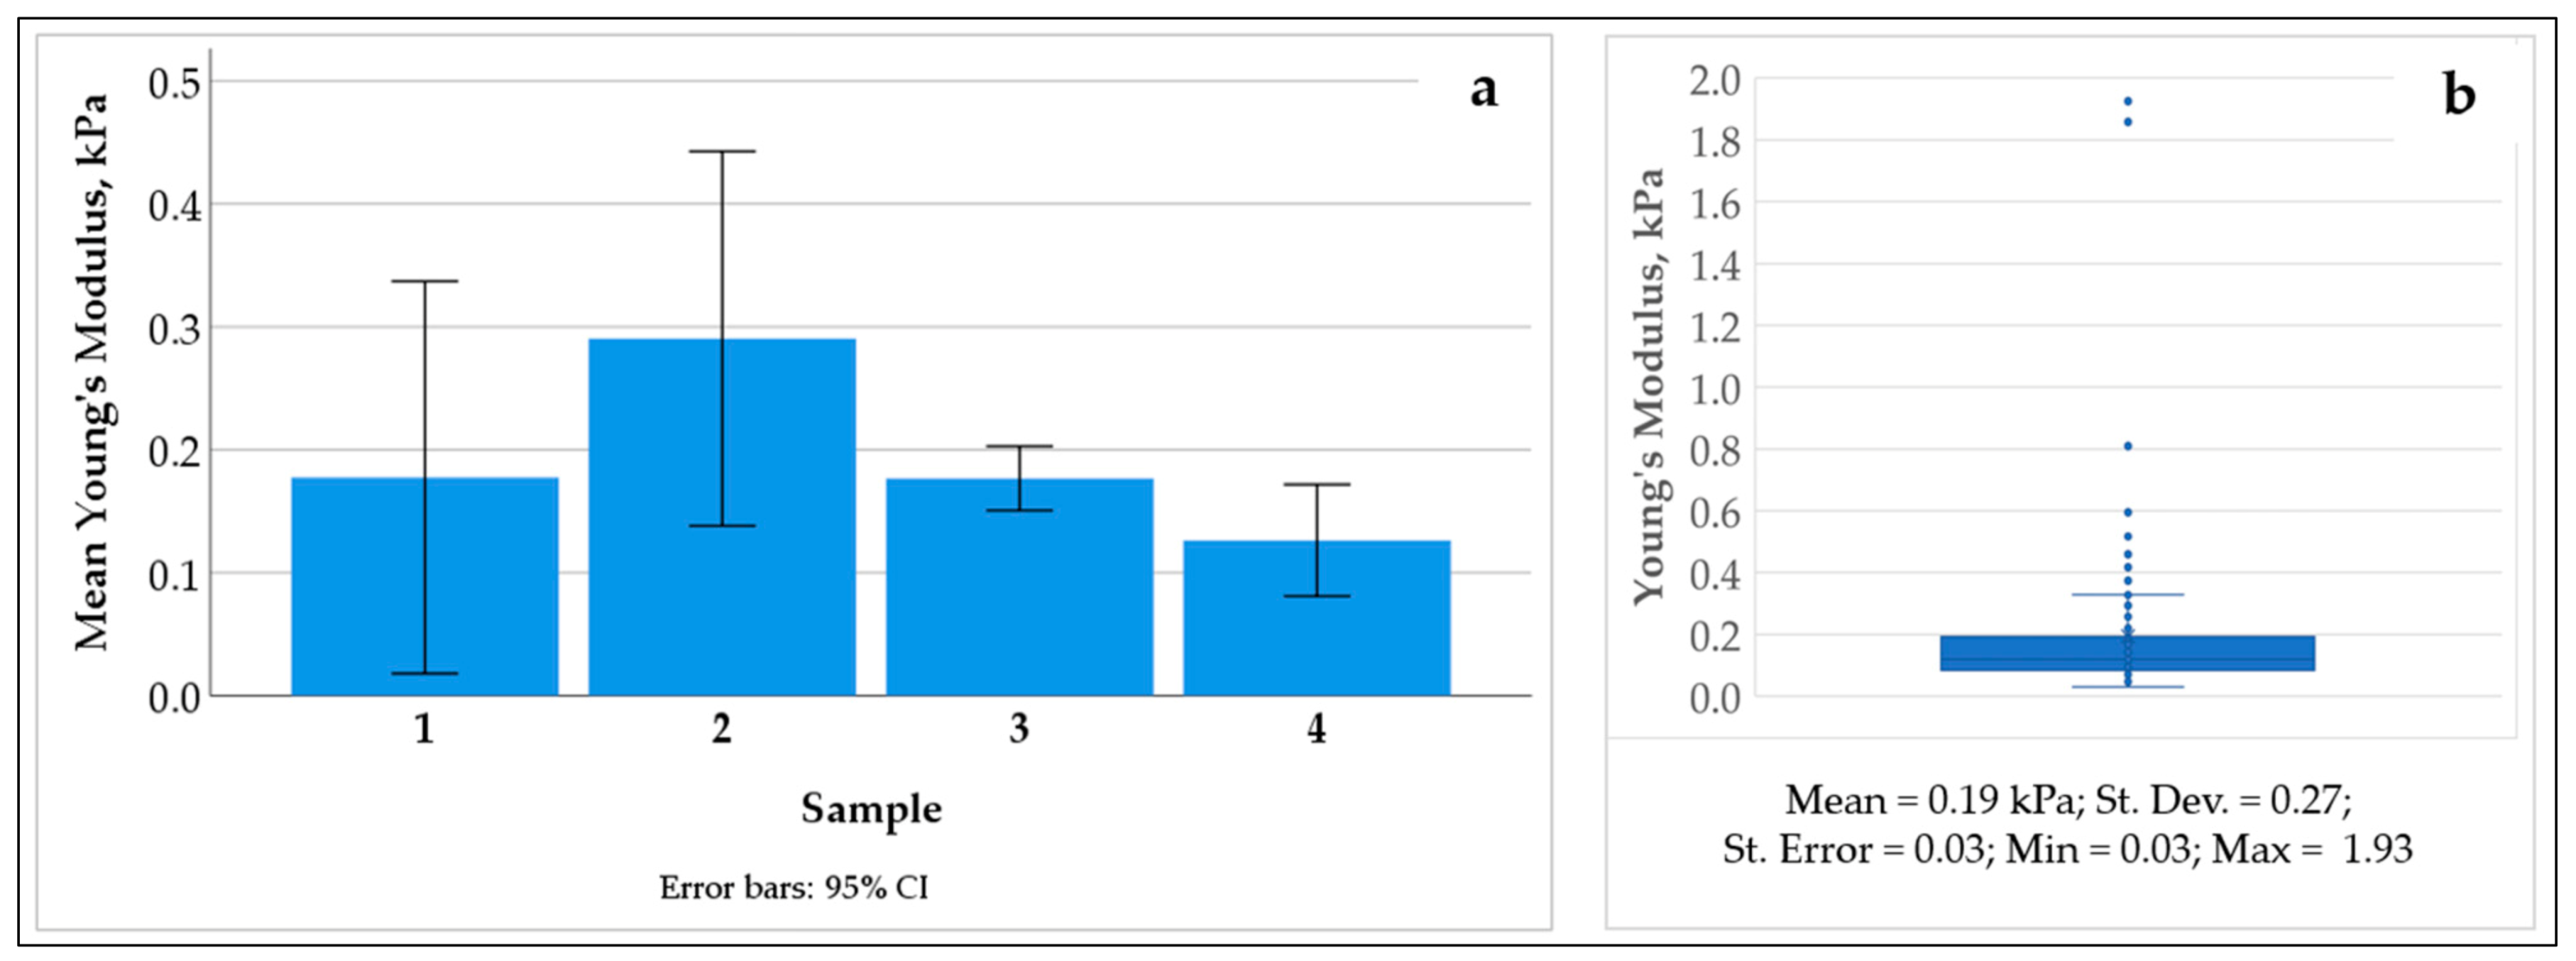
2.6.3. Atomic Force Microscopy
AFM imaging of the deparaffinized/non-coverslipped dry histological tissue (CE liver AOSSs) sections on glass slides was performed in air in the semi-contact mode (according to the method established by us earlier [
62] with the modifications indicated below). The scans were taken following the selection of the regions of interest under bright field microscopy. The following regions of interest were explored in the CE liver AOSSs: (1) In the parenchymal compartment—the parenchymal ECM of former Disse’s space, the former parenchymal ECM in the vicinity of the vein and arterial walls; and (2) in the stromal compartment—the former walls of the arteries, veins, and venules.
The AFM measurements were performed on the Bruker Dimension ICON SPM. The DMT modulus was measured using the peak force tapping mode with the OTESPA-R3 probe (Bruker AFM probes). For accurate modulus measurements, the probe was calibrated according to the following procedure. First, the probe was withdrawn from the sample surface by at least 5 mms, so the spring constant could be calculated using the thermal tunning method. Then, the probe was engaged on a hard surface, namely, sapphire, with a engage set point of 0.5 V, and then the probe was ramped on the surface with 0.2 V of deflection to calculate the deflection sensitivity, which was determined to be 67.3 nm/V (an average of 5 measurements are taken per location and two locations were measured). After the ramp curves were done, the probe was calibrated again, and then the spring constant was updated to a more accurate value—in this case, 28 N/m.
The tip radius of the probe was checked with a titanium roughness check; this is a sample with sharp titanium flakes to check the tip radius. A slow scan rate of 0.2 Hz was used, as the features of the titanium sample were sharp and rough, which could damage the probe apex if the scan rate was too fast. After all the constants were determined, the probe was engaged on the tissue sample, and the scanning parameters, such as scan rate, peakforce setpoint, and feedback gain, were optimized accordingly, depending on the scan size and the scanning area. The resolution of the image was kept at 256 samples/line. The following is an example of the typical scan parameters that were used: Scan size, 5 × 5 µm; scan rate, 0.25–0.4 Hz; feedback gain, ~14; peakforce setpoint, 70 nN; Poisson ratio, 0.45. The data visualization and analysis of stiffness and surface roughness were performed using free Gwyddion 2.55 software (Czech Metrology Institute, Jihlava, Czech Republic). The statistical calculations were conducted using SPSS 26.0, as described below.
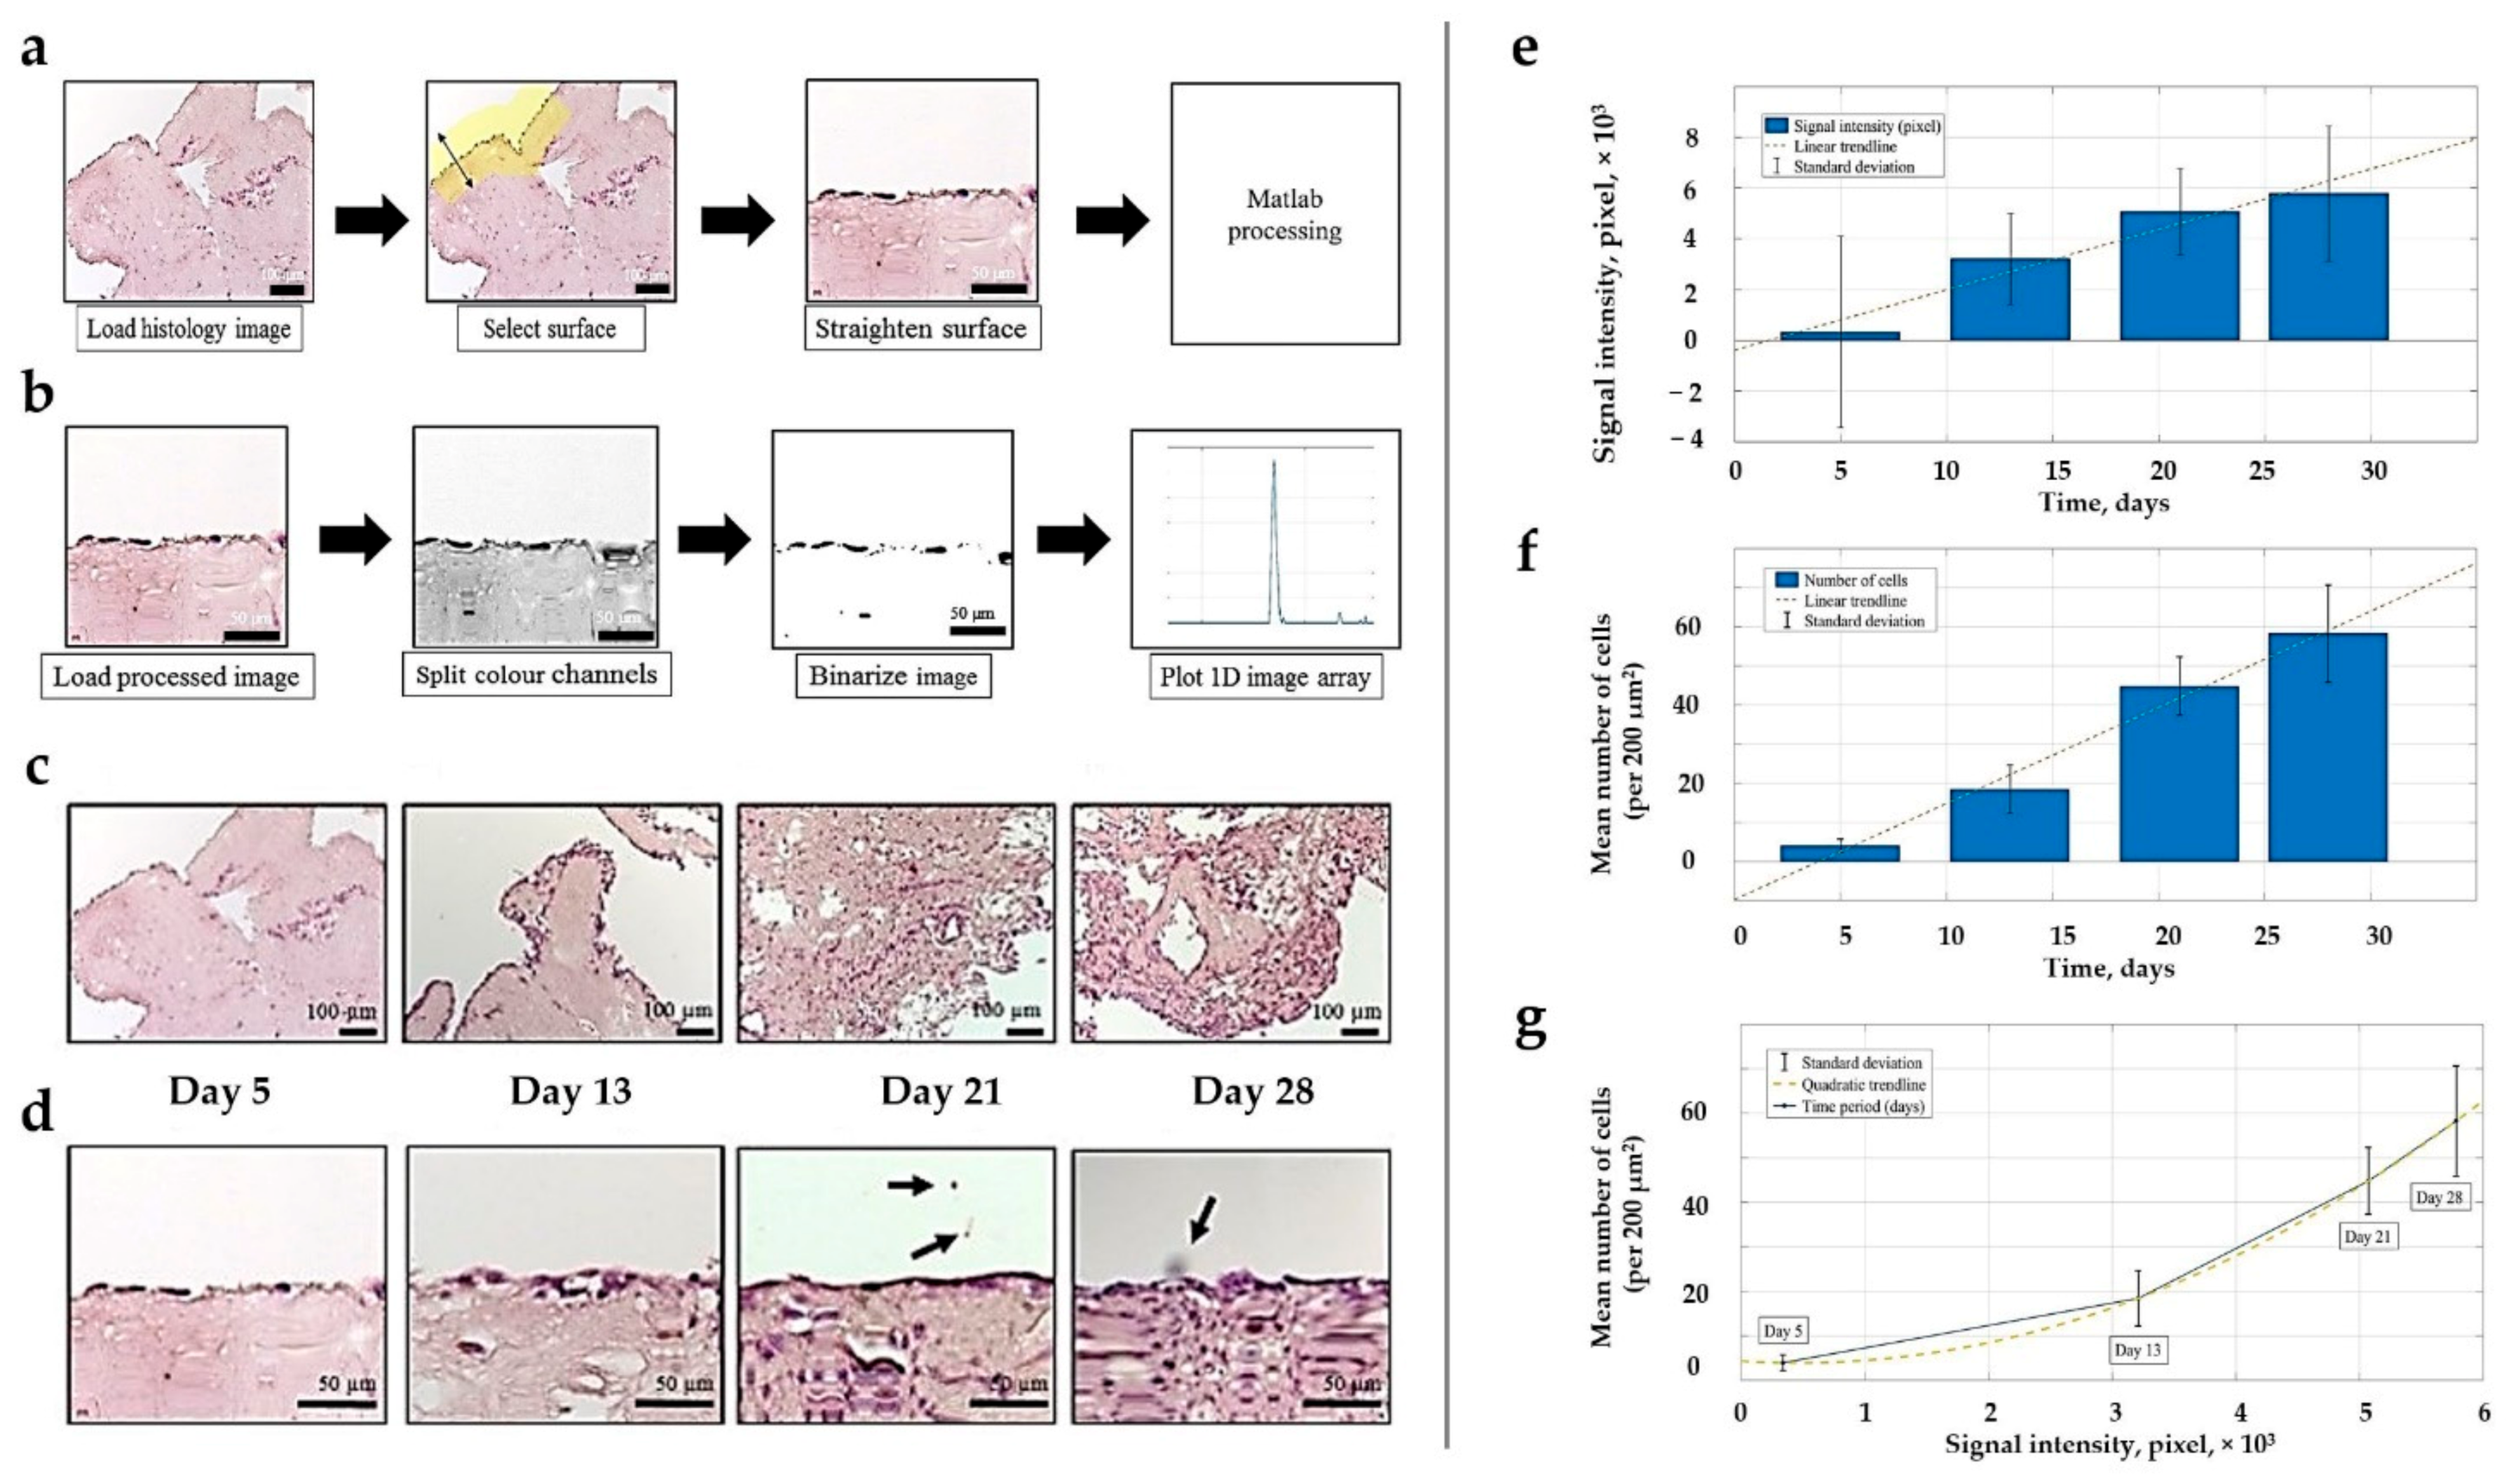
2.6.4. Image Analysis for Histological Morphometry
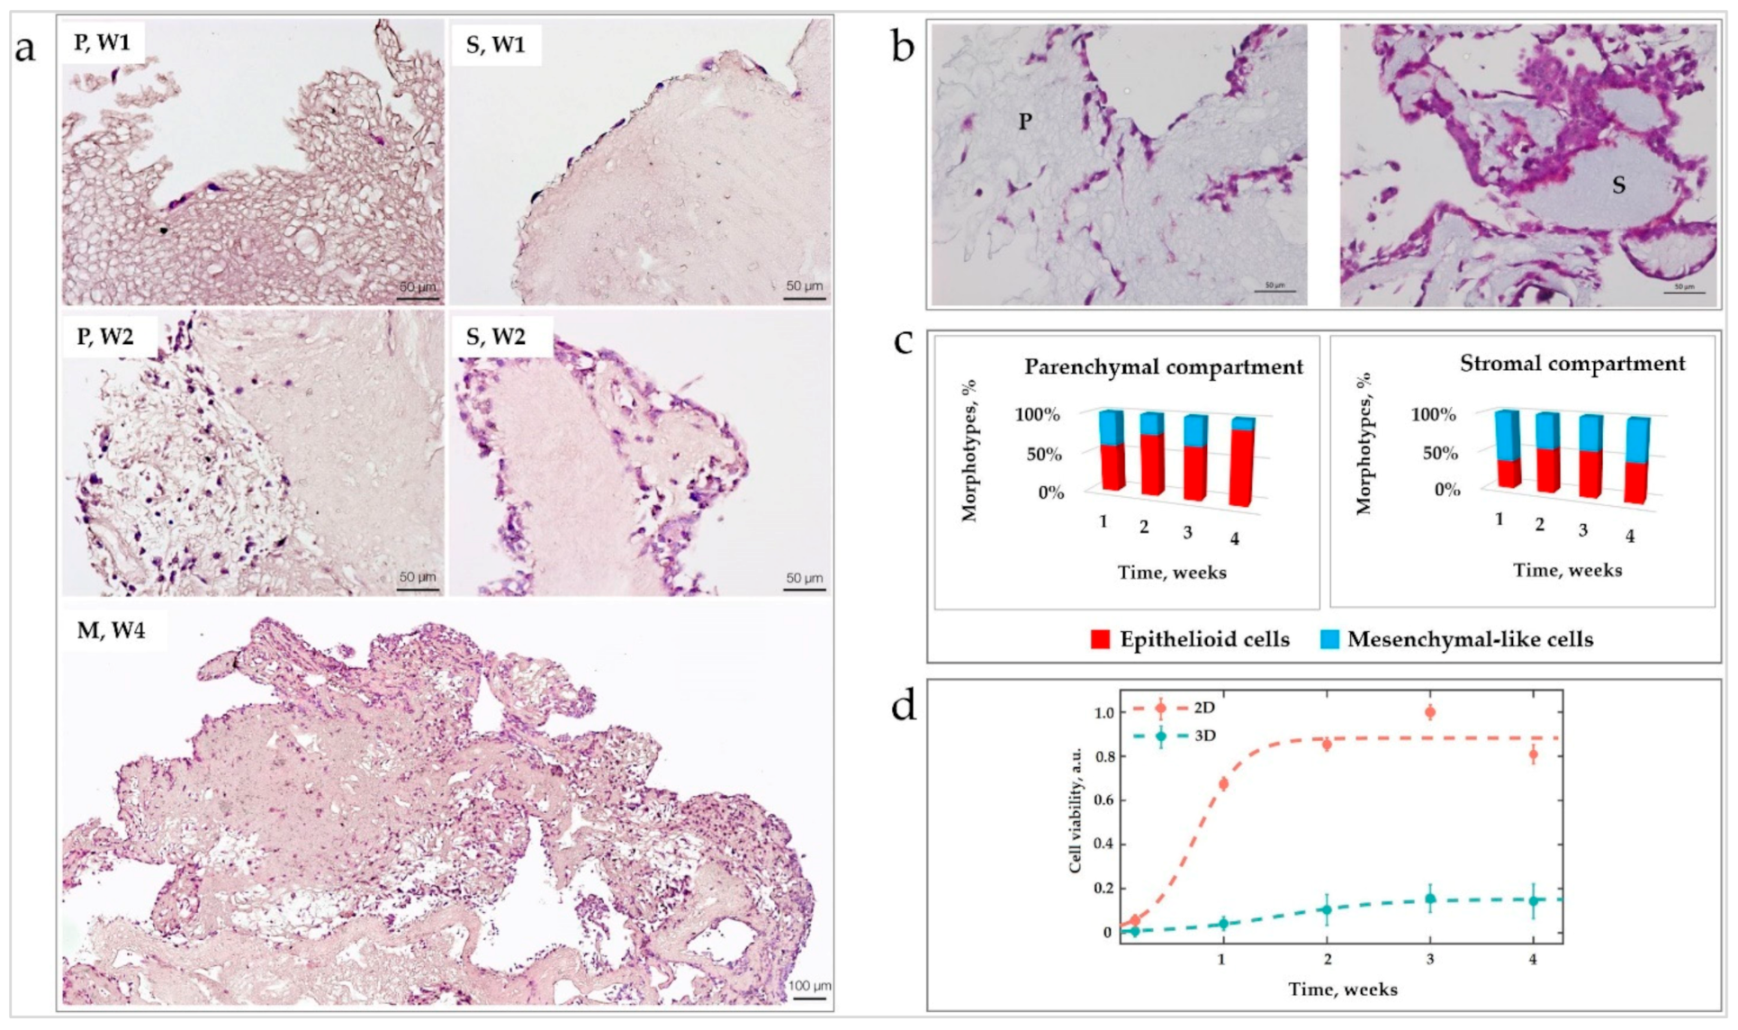
Image processing techniques were applied to evaluate the cellular distribution and shapes in H&E-stained histological images of the evolving CE liver and human TNBC TECs acquired on weeks 1, 2, 3, and 4 of the in vitro culture. During pre-processing, Gaussian blur with s.d. σ = 0.65 μm was applied to reduce high-frequency components. Using color deconvolution, the images were split into three separate channels containing cells, a matrix, and a background, respectively. Next, images with cells were thresholded and a segmentation algorithm was performed, where it was possible to extract single cell boundaries. The cell shape was described by calculating the circularity of a convex hull. The reason for using convex hull approximation of cell boundaries is that it reduces the variability of the data and allows more accurate classification. The boundaries of the parenchymal and stromal compartments were outlined manually. Image processing was performed using ImageJ and MATLAB 2016b.
2.6.5. MTT Assay for Evaluation of the Population Evolution of MDA-MB-231 Cells in 2D and 3D TECs
The cell viability was tested in 3D liver TNBC TECs and matching 2D cell cultures of MDA-MB-231 cells using a modified MTT colorimetric assay. This assay relies on the reduction and conversion of yellow 3-(4,5-dimethylthiazol-2-yl)-2,5-diphenyltetrazolium-bromide (MTT) reagent (#M2128, Sigma-Aldrich, North Ryde, NSW, Australia) into purple formazan salt, where the optical absorbance of formazan crystals dissolved in dimethyl sulfoxide (DMSO) represents the activity measure of mitochondrial dehydrogenase [
63]. The tested cultures were grown in CCM in a humidified atmosphere under 5% CO
2 at 37 °C.
The following procedure was introduced to ensure an appropriate comparison between 2D and 3D TEC cultures. The fifth passage MDA-MB-231 cells were seeded on chick embryo liver AOSSs, as described earlier, while the same amount of the cells (1 × 10⁵ in a 30 µL drop of CCM) was deposited in the middle of the wells of a 24-well culture plate (Costar, Corning, Cambridge, MA, USA) to perform high-density seeding. Next, the cells in both cultures were allowed to attach to the substrates for 2 h in a tissue culture incubator in a humidified atmosphere under 5% CO2 at 37 °C, and then filled with 1 mL of CCM per well and cultured for 1 day.
After 24 h, the media were removed, and the samples were washed twice with PBS to eliminate unattached cells. Next, the 3D TECs were aseptically transferred to new 24-well culture plates to get rid of the cells adhered to the plastic and not to the scaffolds in the original cultures, then filled with fresh CCM (1 mL per well) and cultured for 4 weeks, as described above. At the same time, 2D cell cultures, after washing with PBS, were filled with CCM, and cultured for 4 weeks, without splitting. The media were changed twice a week in both types of cultures.
The MTT assays were carried out on days 1, 7, 14, 21, and 28 after seeding (day 1 and weeks 1, 2, 3, and 4, respectively). For each assay, 3 samples of TECs were randomly selected and transferred to a separate 24-well plate for testing, while 3 wells of cells growing in a 2D culture were used as the internal control. After double washing with PBS, 500 µL of MTT reagent (0.5 mg/mL in the phenol red free cell culture medium; DMEM/F12; #D6434, Sigma-Aldrich, North Ryde, NSW, Australia) was added to each well. Then, the samples were incubated at 37 °C in a tissue culture incubator for 4 h to allow precipitation of insoluble formazan crystals. After this, the supernatant was carefully collected, and 500 μL of DMSO was added to the wells and left for 15 min in the dark on a rocking platform at room temperature to dissolve purple formazan crystals. Next, four portions of 100 µL of the dissolved MTT product was taken from each well, transferred to separate wells of a clear 96-well culture plate (#3585, Costar, Corning, Cambridge, MA, USA) and used for absorbance measurements. The samples’ absorbance was measured in a spectral band centered at 570 nm by a PHERAstar multiplate reader (BMG Labtech, Ortenberg, Germany), with unseeded wells used as blank controls. The experiments were repeated twice, with at least triplicates for each condition; the results were corrected for the blank controls by MARS Data Analysis software (BMG Labtech, Ortenberg, Germany).
2.6.6. Modeling Cell Growth Dynamics
The logistic growth model was fitted to the cell viability values at each point in time in the 2D and 3D cultures (Equation (1)):
where
N is proportional to the number of viable cells at time t;
C0 is proportional to the number of viable cells at the start;
Cmax is proportional to the maximum number of viable cells; and
d is the growth rate. The fit was performed using the nonlinear least squares function in MATLAB software.
2.7. Evaluation of Angiogenic Potential of Liver TNBC TECs in Vivo (CAM Assay)
2.7.1. Grafting and Imaging Procedures
The detailed description of the used procedures of the angiogenic assay on CE CAM [
64] can be found in
Appendix A.3.4,
Appendix A.3.4.1,
Appendix A.3.4.2 and
Figure A11 and
Figure A12. Briefly, liver TNBC TECs, CE liver AOSSs, or MDA-MB-231 cell suspensions were grafted on CAMs separately, one sample of each material type per egg, 5 replicates per a group. Before grafting, the TECs were cultured in vitro for 12 days, as described above, reaching the stage when they contained approximately 2 × 10
5 viable cells (according to MTT assay data). The liver AOSSs were kept in CCM for 24 h before grafting on CAM. The suspension of 2 × 10
5 MDA-MB-231 cells in 60 µL of CCM were grafted on CAMs within a sterile rubber ring. The angiogenic effect induced by the TECs, liver AOSSs, and suspensions of MDA-MB-231 cells in PBS grafted on CAMs was evaluated by stereomicroscopy imaging performed on the day of grafting (embryonic day 8, ED8) and on ED12, in comparison to the natural growth of blood vessels of CAM occurring during the same period of chick embryo development.
2.7.2. Angiogenesis Quantification
The images of CAMs taken using an 2×/0.5 N.A. objective were processed using the following methodologies to evaluate the dynamics of the vascular length density and branching of blood vessels in CAMs. For the control and cell groups, 10 regions of interest (ROIs) per egg were chosen manually. CAMs grafted with 3D-engineered tumors (TECs) and liver AOSSs (scaffolds) were imaged from the 4 corners around the graft, and then 3–4 ROIs were chosen from every corner to obtain approximately 10 ROIs per egg. Since the vessels have higher contrast in the green channel, the RGB images were split to obtain the green component. Histogram stretching of the grey-level intensities was performed to enhance the image contrast. Then, a ridge detection algorithm [
65] involving convolution with the derivatives of a Gaussian smoothing kernel was used to capture the blood vessels by finding the local minima, resulting in a skeleton of a vascular pattern. For each ROI, the total branch length of the obtained skeleton was divided by the area of the ROI, and then the results were averaged to obtain the mean vascular density per egg. The exploration of the branching parameters of the vascular trees was performed using the Angiogenesis Analyzer plugin for ImageJ [
66] (see
Appendix A.3.4,
Appendix A.3.4.3 for the details). Image processing was performed using ImageJ and MATLAB 2016b.
2.8. Cytotoxicity and Cellular Uptake of Doxorubicin (Dox) and Mesoporous Silica Nanoparticles Loaded with Dox in 3D Liver TNBC TECs and in Matching 2D Cultures of TNBC Cells
2.8.1. Preparation of Mesoporous Silica Nanoparticles and Their Loading with Dox
Anionic surfactant-templated mesoporous silica nanoparticles (AMS-6), reported by us earlier [
67,
68], were synthesized in-house following a protocol described elsewhere [
68]. Briefly,
N-lauroyl-
l-alanine was used as surfactant, and APES was applied as a costructure directing agent to achieve connected pores in TEOS-sourced silica nanomaterial. The sample was calcinated at ~550 °C using a temperature gradient of 1.5 °C/min to remove surfactant. Next, as-synthesized mesoporous silica nanoparticles (AMS-6) were loaded with 20% Dox (#D1515, doxorubicin hydrochloride, Sigma-Aldrich, North Ryde, NSW, Australia). Dox diluted in 100% ethanol was added to AMS-6 nanoparticles in a round-bottomed flask mounted on a rotary evaporator, and ethanol was evaporated at 40 °C under vacuum with slow rotation. The collected sample was air-dried overnight.
2.8.2. Characterization of Mesoporous Silica Nanoparticles
Unloaded (“pure”) AMS-6 and Dox-loaded AMS-6 (AMS-6-Dox) were characterized using transmission electron microscopy (TEM), X-ray diffraction (XRD), thermogravimetric analysis (TGA), and dynamic light scattering (DLS). Nitrogen adsorption/desorption isotherm measurements were carried out to evaluate the effective surface area of the AMS-6 and AMS6-Dox samples. For TEM sample preparation, a small amount of dry AMS-6 or AMS-6-Dox was thoroughly crushed in a mortar and then diluted in ethanol. A drop of the suspension was placed on a copper grid and dried. Next, the grid was placed in a sample holder of a JEOL 3000F TEM (Peabody, St. Louis, MO, USA) and imaged at 300 kV with the resolution of 1.6 Å. Images were obtained using a Gatan SC1000 11-megapixel CCD camera (Gatan Inc., Pleasanton, CA, USA), with a 1024 × 1024 pixel Gatan image filter (Gatan Inc., Pleasanton, CA, USA). XRD measurements of 20 mg of the dried nanoparticle samples were carried out using XRD instrument Bruker D8 Discover equipped with VÅNTEC-500 detector featuring a 140 mm diameter window (Bruker Corporation, Billerica, MA, USA).
XRD patterns were recorded using the Cu Kα anode (λ = 0.1542 nm), operating at 40 kV and 30 mA. TGA measurements were performed using a 1 mg sample placed in an aluminum crucible TGA2050 (TA Instruments, New Castle, DE, USA) and heated from 25 to 850 °C at 10 °C/min under air flow at 10 mL/min. Nitrogen adsorption/desorption isotherms were acquired at a temperature of –196 °C using liquid nitrogen with a TriStar II by the Micromeritics
® instrument (Micromeritics Instrument Corporation, Norcross, GA, USA), following degassing of the AMS-6 and AMS-6-Dox samples under vacuum using a VacPrep™ 061 by Micromeritics
® instrument (Micromeritics Instrument Corporation, Norcross, GA, USA) for ~10 h at 120 °C. The surface area was calculated using the Brunauer–Emmett–Teller (BET) equation [
69].
Hydrodynamic diameters and the zeta-potentials of colloidal AMS-6 and AMS-6-Dox were measured in PBS and CCM (1 mg/mL) by Zetasizer Nano ZS (Malvern Panalytical Ltd, Malvern, UK) in three runs followed by averaging.
2.8.3. MTT Viability Assay of 2D and 3D TEC Cell Cultures Treated with Free and Nanoformulated Dox
The TECs were cultured for 3 weeks as described above. For the control 2D in vitro culture, MDA-MB-231 cells were seeded in 96-well plates (#3599, Costar, Corning, Cambridge, MA, USA) at a density of 2 × 10
4 cells per well and incubated in CCM for 24 h before the test. Then, the culture medium was removed from all the cultures, the TECs were aseptically transferred to new 24-well culture plates, and all of the cultures were washed 3 times with PBS. Free Dox of the concentrations ranging from 0.1 to 10 µg/mL and AMS-6 (50 µg/mL) and AMS-6-Dox of the concentrations ranging from 0.5 to 50 µg/mL (Dox-equivalent, 0.1–10 µg/mL) were diluted in CCM and sonicated immediately before the test. Each concentration of each type of the tested compounds was applied in a total volume of 100 µL to 8 wells of 96-well plates for challenging of the 2D culture of MDA-MB-231 cells (2 biological replicates × 4 technical replicates). At the same time, 6 TECs growing in 24-well plates were used to test each concentration of each compound, and the added volume of the dispersions was 400 µL per well (2 biological replicates × 3 technical replicates). The 2D and 3D cultures treated with CCM were used as a control. The exposure time was 36 h. Then, MTT tests were performed, as described above (see
Section 2.6.5). The supernatant was removed and 100 or 400 µL of DMSO was added to the wells of 96-well plates (2D cultures) and 24-well plates (3D TECs), respectively. The solution of formazan in DMSO from the TECs was transferred to the new 96-well plate (100 µL per well; 3 samples per TEC), and the absorbance of the tested cultures was measured. The mean percentage of dead cells
E and the standard deviation
σE were recalculated based on the absorbance of the controls using Equation (2):
where
A is the average absorbance in each group,
A0 is the average absorbance of the corresponding control, and
σA is the standard deviation of the absorbance in each group.
2.8.4. Pharmacodynamics Modeling
The experimental measurements of the percentage of dead cells in the 2D and 3D cultures after administration of free or nanoformulated Dox were described by the following sigmoid Equation (3):
where
Emax is the maximum effect (%),
EC50 is the half maximal effective concentration (µg/mL),
dose is the concentration of administered Dox (µg/mL), and
h is the Hill coefficient. The half maximal inhibitory concentration (IC
50), i.e., the drug concentration needed to obtain 50% of cell death, was calculated in each group using the line of the best fit. The parameters of the model are provided in
Table A6 and
Table A7, respectively, for free and nanoformulated Dox (
Appendix A.3.5.2).
The fit was performed using a weighted unconstrained nonlinear curve fit (MATLAB r2016b) with the inverse error as the weight, and the dose values were first logarithmically transformed. The 0% cell death (100% viability) at 0 µg/mL in controls was given a higher weight as the data were normalized to these values and the model is expected to approach this intercept closely.
2.8.5. Confocal Microscopy Study of the Uptake of Free and Nanoformulated Dox in 3D TECs and 2D Cultures
As-produced liver TNBC TECs were cultured for 3 weeks. Control 2D in vitro cultures of MDA-MB-231 cells were seeded onto sterile coverslips placed into wells of a 24-well plate (Costar, Corning, Cambridge, MA, USA) at a density of 5 × 10⁴ cells/well and incubated under standard conditions in 1 mL of CCM during 24 h prior to the observation. Dox solution (10 µg/mL), AMS-6 nanoparticle (50 µg/mL), and AMS-6-Dox nanoparticle (50 µg/mL; Dox-equivalent, 10 µg/mL) dispersions were prepared as described above. Next, after removal of the culture media and triple washing with PBS, the tested compounds were added to the wells with 2D and 3D cultures in a total single volume of 0.5 mL per well. The wells added to with CCM without Dox or nanoparticles were used as controls. The prepared 2D and 3D cultures were incubated for 24 h in a tissue culture incubator at 37 °C and 5% CO2; next, following thorough rinsing 3 times with PBS to remove free Dox and nanoparticles, they were fixed with 10% neutral buffered formalin at room temperature.
After a 24 h fixation process and another washing with PBS, the samples were stained with DAPI solution in PBS (#D9542, Sigma-Aldrich, North Ryde, NSW, Australia) for 20 min at 37 °C. Microtome sections (6 µm in thickness) of the frozen 3D TECs were prepared and also stained with DAPI. Next, the staining solution was removed, and the coverslips were washed twice with PBS to eliminate unbound DAPI. Finally, the samples were mounted on glass slides with Dako anti-fade mounting media and sealed with nail polish.
Dox and AMS-6-Dox cellular uptake was imaged by an inverted Zeiss LSM 880 laser scanning confocal microscope (Zeiss, Oberkochen, Germany), using a Plan Apochromat 10×/0.45 N.A. M27 and Plan Apochromat 40×/1.3 N.A. oil DIC UV-IR M27 objectives. Dox fluorescence was observed using 488 nm excitation and 535–673 nm emissions, and DAPI fluorescence was observed using 405 nm excitation and 411–528 nm emissions.
2.9. Statistical Analysis
The data are expressed as means ± standard deviations (SD), and the 95% confidence intervals (CI95%) for the means were calculated. Due to the non-Gaussian nature of the data, the two-sided Mann–Whitney U-test was used to evaluate the significance of intergroup differences between the means. The two-sampled Kolmogorov–Smirnov test was used to compare any two observed distributions of branch length density. Statistical significance was reported as follows: * p < 0.05, ** p < 0.01, and *** p < 0.001 or the exact p-value was provided where possible. Statistical analyses were performed using R Statistical and SPSS 26.0 software.


 ,
, 


