Abstract
Preventive measures have proven to be the most effective strategy to counteract the spread of the SARS-CoV-2 virus. Among these, disinfection is strongly suggested by international health organizations’ official guidelines. As a consequence, the increase of disinfectants handling is going to expose people to the risk of eyes, mouth, nose, and mucous membranes accidental irritation. To assess mucosal irritation, previous studies employed the snail Arion lusitanicus as the mucosal model in Slug Mucosal Irritation (SMI) assay. The obtained results confirmed snails as a suitable experimental model for their anatomical characteristics superimposable to the human mucosae and the different easily observed readouts. Another terrestrial gastropod, Limacus flavus, also known as “ Yellow slug “, due to its larger size and greater longevity, has already been proposed as an SMI assay alternative model. In this study, for the first time, in addition to the standard parameters recorded in the SMI test, the production of yellow pigment in response to irritants, unique to the snail L. flavus, was evaluated. Our results showed that this species would be a promising model for mucosal irritation studies. The study conducted testing among all those chemical solutions most commonly recommended against the SARS-CoV-2 virus.
1. Introduction
The disinfection practice involves the actuation of physical procedures and/or chemical or biological products to eliminate pathogenic microorganisms. Therefore, it appears the first preventive practice against the development and spreading of infectious diseases caused by various pathogens, among them the SARS-CoV-2 virus [1,2,3].
The SARS-CoV-2 pandemic was immediately declared a global health emergency by the World Health Organization (WHO). A mortality rate between 2 and 2.5%, 122 million cases worldwide, and more than 2.7 million deaths (WHO update 21 March 2021) confirm the infection’s severity [4]. The virus transmission generally occurs from human to human through airborne, Flügge droplets, and contact with contaminated surfaces [5,6].
The SARS-CoV-2, being an enveloped virus, is poorly resistant to acids, detergents, disinfectants, drying, and heat, thus it is quite susceptible to disinfection [7,8,9]
Among disinfectants, chemicals are the most widely used, due to the wide availability of products, the cost–benefit ratio, the broad spectrum of action, and the possible employing on many surfaces and objects. In this context, several institutions, both national [10] and international [11,12], have drawn lists of products for surfaces and not on people counteract the coronavirus SARS-CoV-2 when used according to label directions.
The most commonly recommended substances are alcohols, chlorine compounds, hydrogen peroxide, phenols, iodine-based substances, and Quaternary Ammonium Compounds (QACs), each with a different mechanism of action:
- Alcohols, cross-linking, coagulation, and clumping, acting mainly as an aqueous emulsion on membrane proteins;
- Chlorine compounds, oxidation of proteins, carbohydrates, and lipids even at low concentrations;
- Hydrogen peroxide, oxidation of cell membrane components through the formation of peroxide radicals;
- Phenols, cross-linking, coagulating, clumping destroying the cell wall, and blocking of enzymatic activity;
- Iodine-based substances interfere at the level of the respiratory chain by blocking the transport of electrons, thus decreasing the oxygen supply of aerobic microorganisms;
- QACs act as ionic compounds that irreversibly bind membrane phospholipids, altering their permeability [13].
The effectiveness of an antiseptic product should be completed within thirty seconds to one minute. Indeed, the longer is the time required for disinfection to be effective, the greater is the risk that the user will not follow the correct application procedure required.
Since the pandemic earliest moments, the effectiveness of preventive and control measures reported by national and international guidelines in significantly reducing nosocomial infections has been demonstrated [2]. Among these, chemical disinfection played a crucial role in increasing the number of people who frequently handled disinfectants and a higher risk of accidental eyes, mouth, nose, and mucous membranes irritation.
Localized at the interface with the external environment, the mucosa plays a fundamental role as a protective barrier towards microorganisms and substances of a different nature. For this reason, it is not uncommon that oral, nasal, gastrointestinal, vaginal, and rectal mucous membranes can be intentionally or accidentally exposed to xenobiotics that irritate, with microlesions formation, compromising the protective barrier function, especially towards pathogenic microorganisms [14,15,16].
For toxicological evaluation on mucous membranes, vertebrates are mainly used in laboratory routines [17,18]. Although animal experimentation guarantees reliable data, it raises ethical, legal, and scientific high impact implications. For this reason, directives limiting the use of mammals and vertebrates have been issued [19]. Due to these limitations, researchers have begun to use invertebrates for in vivo model studies [20].
To cope with this scenario, a new in vivo assay, “Slug Mucosal Irritation” (SMI), has been proposed, and the snail Arion lusitanicus (A. lusitanicus) was the first invertebrate used as an alternative to mammals for mucosal toxicology studies [21].
The usage of snails as an alternative model finds its fundamental in mucosal tissue’s anatomy and physiology, which possesses numerous characteristics overlapping with its human counterpart. Moreover, the snail body conformation can be easily analyzed outside instead of inside the organism. From a structural standpoint, the mucosal tissue is non-keratinized with a monolayer outer epithelium composed of non-ciliated cells with microvilli and mucus-secreting glandular cells [22].
In addition to its locomotor, lubricating, and antidehydration functions, mucus is an essential component in external insults or damage protection [23]. These unique properties depend primarily on mucins, molecules that can hydrate and swell up to 100 times in a few fractions of a second [24]. Mucus secretory mechanism depends on chemical or mechanical stimulation of smooth muscle located near the mucus-secreting cells that produce apocrine secretion granules. Upon reaching the extracellular environment, the passage of ions and water allows rapid hydration of mucins [25].
Several comparative test studies Based on A. lusitanicus mucus production, showing a high predictive degree of chemicals irritant potential, have been developed.
Among these, the more relevant were focused on nasal discomfort [26], the tolerability of certain excipients on the children’s skin [27], chemicals that cause severe eye damage and irritation [28,29], and also cosmetic formulations biocompatibility [30,31,32,33,34].
Furthermore, the snail model overcomes some of in vitro cell culture assays limitations; due to the lack of a protective barrier formed by mucus, in vitro cell lines are more sensitive to chemicals than the in vivo mucosa. Another significant advantage is assessing tissue damage, which can be evaluated by microscopic examination and the release of several markers, including proteins and enzymes [35,36,37].
The high predictivity of the SMI test was also demonstrated in compared studies with the rabbit mucosal model since overlapping results were observed between the two models [38,39].
Limacus flavus (L. flavus) (phylum: Mollusca, class: Gastropoda, order: Stylommatophora, family: Limacidae), also known as “Yellow slug” is a pulmonate, hermaphroditic, synanthropic terrestrial gastropod that is autochthonous to the Mediterranean region and widespread worldwide. Colouration varies from yellowish to pinkish-orange, with grey-green spots. It has light blue-grey tubercles, a short crest, and a yellow-white belly (or feet). The mucus produced by the body is yellow, while the belly one is transparent [40,41].
Studies by Cook et al. on the anatomy and histochemistry of the mucus-producing glands of Limax pseudoflavus, a snail species closely related to L. flavus, demonstrated diffuse yellow granular cells on the dorsal surface. These glands are responsible for the yellow colouration of the dorsal mucus in L. pseudoflavus [42]. Moreover, other studies conducted by Chang et al. on the epithelial and mucus-producing cells have shown notable similarities between L. flavus and A. lusitanicus in mucus production [43].
The use of L. flavus in the SMI test has already been reported in some previous studies about polymers biocompatibility [34,44].
Regarding the chemicals’ irritation potential, Dhondt et al. in 2006 compared the use of L. flavus versus A. lusitanicus by the SMI test to evaluate 28 eye-referring chemicals. In this work, the authors justify this snail’s choice based on several criteria, such as larger size and greater longevity than A. lusitanicus. The results showed more outstanding mucus production for L. flavus than A. lusitanicus [45].
In this study, for the first time, in addition to the standard parameters recorded in the SMI test (i.e., mucus production, weight change, protein content, and LDH production), the secretion of the characteristic yellow mucus pigment of L. flavus was evaluated as a readout of the irritation response.
Thus, the study aimed to evaluate whether the characteristics of L. flavus could represent reliable readouts for the SMI test. To this end, the assay was implemented and adapted to L. flavus features to discriminate the main biocide substances used for surfaces and objects disinfection. The disinfectant solutions most commonly used and recommended for surfaces use only were investigated in this study, among the plethora of chemicals listed in the official guidelines produced by national and international health organizations to counter the spread of SARS CoV-2 [10,11,12].
2. Materials and Methods
2.1. Chemicals
Phosphate Buffered Saline (PBS) pH 7.4 (cat no. P3813 Sigma-Aldrich), benzalkonium chloride (BAC) 1% (w/v) (cat no.12060 Sigma-Aldrich, St. Louis, MO, USA), ethanol (EtOH) 70% (v/v) (cat no. 1.07017 Merck-Supelco, Darmstadt, Germany), isopropanol 95% (v/v) (cat. no. 34863 Sigma-Aldrich, St. Louis, MO, USA), isopropanol 70% (v/v) (cat. no. 34863 Sigma-Aldrich, St. Louis, MO, USA), sodium hypochlorite 0.1% (v/v) (Honeywell FlukaTM cat. no. 71696 Thermo Fisher Scientific, Waltham, MA, USA), hydrogen peroxide 3% (v/v) (cat. no H1009 Sigma-Aldrich, St. Louis, MO, USA), chlorhexidine 1% (w/v) (cat. no 282227 Sigma-Aldrich, St. Louis, MO, USA), and iodopovidone 10% (w/v) (cat. no PVP1 Sigma-Aldrich, St. Louis, MO, USA). All substances were diluted to the final concentration in sterile deionized water.
2.2. Collection, Housing, and Identification of Limacus flavus Specimens
Snails were collected in the proximity of Trivento municipality (Campobasso, Molise Italy) and then housed at a temperature between 16 and 18 °C with a photoperiod of 12-12. Each specimen was carefully inspected for macroscopic lesions or damage to the tubercles to exclude ineligible samples.
A preliminary snail identification in the field was carried out by macroscopic evaluation to confirm the body color (green, brown and greyish), the texture of the mantle (a network of yellow spots of ovoid shape), and the tentacles (bluish color). Additionally, both specimens size and position of the respiratory pore (pneumostome) located behind the mantle’s midline were evaluated [46].
2.3. SMI Assay
The assay was conducted following Adriaens et al. [28] with some modifications designed to optimize the unique characteristics of the L. flavus species. Snails with a weight between 3 and 5 g were selected. Three days before testing, they were housed in a ventilated plastic terrarium lined with PBS (pH 7.4) soaked paper towels and fitted with a wire mesh to drain mucus. Snails before testing were weighed and placed each in a Petri dish. The degree of irritability of the tested biocides was assessed by exposing the snails to 100 µL of each test substance (Figure 1a).
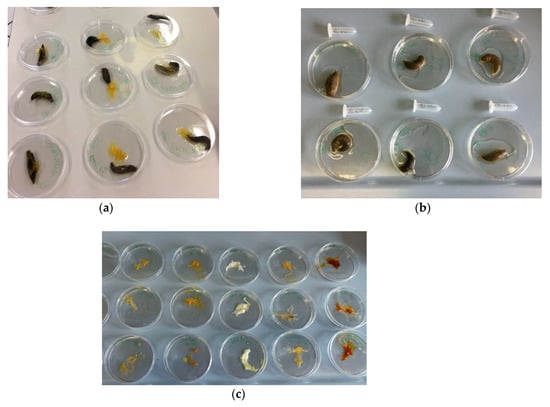
Figure 1.
(a) Snails during exposure with 100 µL of the test substances; (b) snails in contact with PBS after treatment; and (c) Petri dishes containing the mucus produced by snails during treatment.
Unlike the SMI protocol proposed by Adriens et al. [28], test substances were applied to the back and not the snails’ underside. Additionally, as already pointed out by Dhondt et al. [45], given the high mucus production in response to chemicals stimulation, the contact period with the tested substance was reduced from 60 to 15 min. After 15 min, snails were weighed to assess weight loss and transferred to another Petri dish in contact with 1 mL of PBS for 45 min (Figure 1b). Subsequently, samples were collected and frozen at −80 °C for further analysis.
Treatment-induced weight changes were expressed as percentage weight/weight (% × w/w) according to the formula:
Bodyweight variation = snail weight after treatment/snail weight before treatment × 100.
Petri dishes in which snails were placed in contact with the test substances were weighed before and after the test to determine the mucus produced by the irritant stimulus (Figure 1c).
The amount of mucus produced after the 15-min contact period (% w/w) was calculated as follows:
Mucus production = mucus produced after treatment/snail weight before treatment × 100.
Three snails were used for each substance tested, and the experiment was repeated three times independently (three biological and technical replicates).
2.4. Mucus Analysis
The mucus produced from each snail after treatment and collected in PBS, henceforth referred to as “sample”, was evaluated for protein quantification, lactate dehydrogenase (LDH) activity, and UV-visible absorbance (λmax 420 nm).
2.4.1. Protein Quantification
Quantification was performed using the Pierce BCA Protein Assay Kit (cat. No. 23227 Thermo-Scientific, Waltham, MA, USA) following the manufacturer’s instructions. Serial dilutions of BSA from 2000 to 20 µg/mL were performed to construct the calibration curve. Of each sample 25 µL were added to 200 µL of the BCA working solution in a microplate. After an incubation period at 37 °C for 30 min, measurements were made with VICTOR3 model1420 Multilabel Counter (PerkinElmer, Waltham, MA, USA) at a wavelength of 562 nm. Results were expressed as µg/mL and normalized for the initial weight of each snail.
2.4.2. LDH
LDH enzyme activity was measured according to Adriaens et al. [35] by the LDH activity assay kit (cat. No. MAK066 Sigma-Aldrich, St. Louis, MO, USA) according to the manufacturer’s instruction. LDH activity is reported as nmol/min/mL = milliunits/mL. One LDH activity unit was defined as the amount of enzyme that catalyzed the conversion of lactate to pyruvate to generate 1.0 mole of NADH per minute at 37 °C.
2.4.3. UV–Visible Spectra
Due to the yellow color of the mucus produced by L. flavus, test samples were diluted 1:5 (V/V) in deionized water and subjected first to spectrophotometric reading from 400 to 600 nm with 1 nm intervals (Lambda25 UV/Vis PerkinElmer); generating UV–VIS spectra for each substance tested.
Curves analysis displayed a maximum absorbance peak for all substances tested at λmax 420 nm, so subsequently, all samples were tested for λmax 420 nm.
2.5. Statistical Analysis
Data were expressed as mean ± standard deviation (S.D.) of three biological replicates from three independent experiments. Prism Graph Pad 6 software was used for the one-way ANOVA test, followed by multiple Bonferroni correction tests and linear regression analysis.
Linear Discriminant Analysis
As previously reported by Adriens et al. [17], linear discriminant analysis (LDA) was used as a classification prediction model.
In this study, this PM was applied for discrimination according to mucosal irritation potential of nine surface and object disinfectants prescribed to counteract the spread of SARS-CoV-2. Nine observations (three technical and three biological replicates) were considered for each variable (weight variations, mucus production, protein quantification, LDH activity, and λmax 420 nm to set up the dataset. Two separate LDA models were then developed, one based on the linear combination of the first four variables without λmax 420 nm (LDA w/o λmax 420 nm), the other included the λmax 420 nm spectrophotometric variable (LDA λmax 420 nm). Comparing each model’s confusion matrices (LDA w/o λmax 420 nm and LDA λmax 420 nm) allowed assessment of agreement between observed and predicted categories.
Finally, PBS (control) squared distances (D2) of the LDA λmax 420 nm analysis were used for classification of the tested substances by a numerical score (0–7) and a grade (none to exceptionally high). The significance level was set at p = 0.05. XLSTAT software v.2021.1 (Addinsoft Paris, France) was used for LDA analysis.
3. Results
3.1. SMI Assay
3.1.1. Bodyweight Variation
The mean change in weight of snails exposed to the tested disinfectants and controls (PBS pH 7.4, sodium hypochlorite 0.1%, hydrogen peroxide 3%, chlorhexidine 1%, povidone iodine 10%(w/v), EtOH 70% (v/v), BAC 1% (w/v), isopropanol 70%, and isopropanol 95% ranged from 100% to 78.78% (Figure 2).
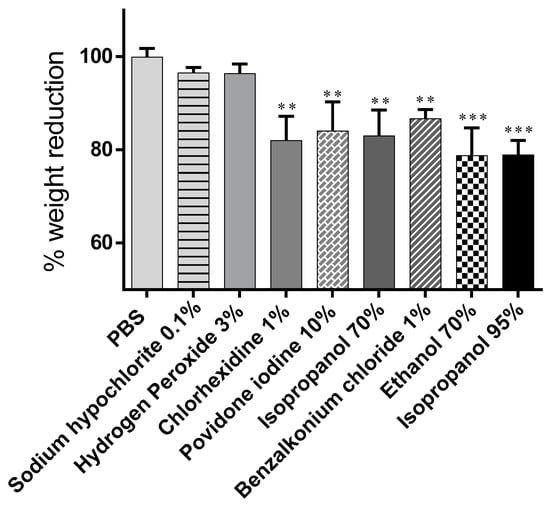
Figure 2.
Change in body weight induced by the substances tested. Data are presented as mean ± S.D. and expressed as a percentage of the initial body weight. *** p < 0.001, ** p < 0.01, significance from control (PBS).
No change in body weight was observed in snails treated with PBS buffer used as control (100 ± 1.84). In the groups exposed to disinfectants, a weight change was observed caused by the biocidal substances’ irritant action on the snail mucosa (lower percentage values indicate more significant weight loss), among all chemicals tested, EtOH 70% (v/v) and isopropanol 95% (v/v) significantly induced higher snail body weight variation by 78.78% ± 5.93% and 78.95% ± 3.10%, respectively. Hydrogen peroxide and sodium hypochlorite had the most negligible influence on body weight change, 96.37% ± 2.05% and 96.53% ± 1.15% (Table 1).

Table 1.
SMI test results for all disinfectants tested. Data are expressed as mean ± standard deviation (S.D.), each value with its unit of measure; a,b protein quantification and LDH were normalized to the weight of the snails before treatment.
3.1.2. Mucus Production
Data on the amount of mucus produced given as a percentage of the snails’ initial weight are shown in Figure 3. Treatment with PBS poorly stimulated mucus production 0.3% ± 0.41%. All substances tested, except hydrogen peroxide (5.03% ± 1.68%) and sodium hypochlorite (3.73% ± 1.27%), induced a significant increase in mucus secretion: EtOH 70% (14.63% ± 2.85%); isopropanol 70% (11.58% ± 3.98%); chlorhexidine 1% (10.23% ± 2.28%); and iodopovidone (14.28% ± 2.07%). Isopropanol 95% was the substance that more stimulated mucus production 19.96% ± 4.08% (Table 1).
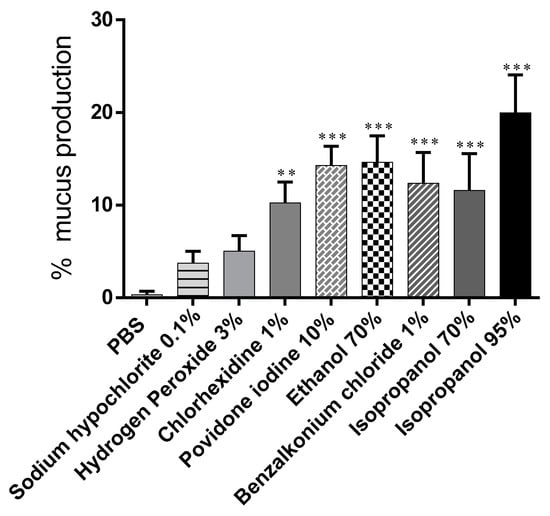
Figure 3.
Amount of mucus produced by snails after a 15-min contact period with test substances (percentage relative to initial snail weight). Data are presented as mean ± S.D. *** p < 0.001, ** p < 0.01 significance from negative control (PBS).
3.1.3. Protein Quantification
Data from protein quantification in samples taken after a 15 min exposure period with the different treatments and subsequent contact with PBS for 1 h were normalized to the snails’ initial weight (Figure 4).
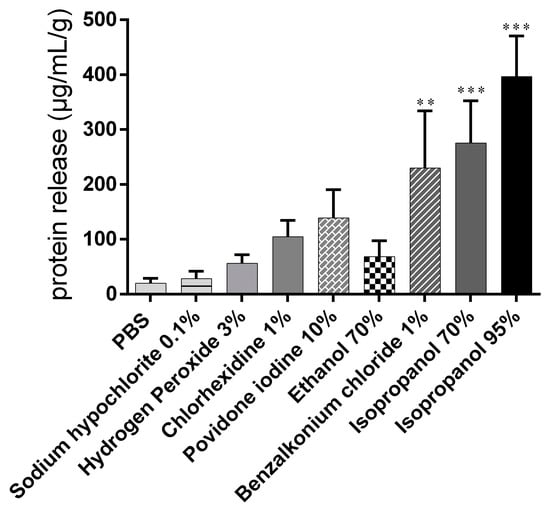
Figure 4.
Proteins released from snail mucosa after a 15 min exposure period with the different treatments and subsequent contact with PBS for 45 minutes. Data are presented as mean values ± S.D. and expressed in µg/mL. *** p < 0.001, ** p < 0.01 significance from negative control (PBS).
Moderate protein release into the mucus (20.07 ± 8.68 µg/mL) was recorded in the PBS control group. Treatment with 95% isopropanol, 1% BAC, and 70% isopropanol induced significant protein release compared with the control. The lowest protein concentrations among the biocidal substances tested were determined in the samples from the groups exposed to hydrogen peroxide and hypochlorite (Table 1).
3.1.4. LDH
The LDH activity in mucus correlates with cellular damage caused by snail exposure to test substances.
For PBS-treated snails, no LDH activity was recorded (Figure 5). On the other hand, 95% isopropanol exposure showed significant activity (5.73 ± 1.13 IU/L.G./g), hydrogen peroxide, and sodium hypochlorite induced less LDH activity 0.47 ± 0.12 and 0.57 ± 0.15IU/L.G./g, respectively.
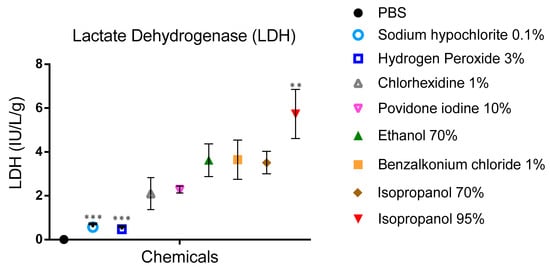
Figure 5.
LDH activity in PBS samples after a period of contact with the different biocides for 15 min. Data are presented as mean values and expressed in units/mL PBS per gram body weight. Two-way ANOVA comparing tested substances versus BAC 1% (mean LDH 3.6 IU/LG/g) as already reported by Adriaens et al. [17]. *** p < 0.001, ** p < 0.01 significance from control (BAC 1%).
3.1.5. UV–VIS Spectra
Table 1 shows the λmax 420 nm values. Lower absorbance values were found for the PBS (0.028 0.006), sodium hypochlorite 0.1% (0.035 ± 0.005), and hydrogen peroxide 3% (0.048±0.006) groups while the highest values were found for the isopropanol 95% (0.394 ± 0.019) isopropanol 70% (0.330 ± 0.020) and BAC 1% (0.0301 ± 0.015) groups.
Additionally, a linear correlation between λmax 420 nm and mucus protein was observed (Figure 6).
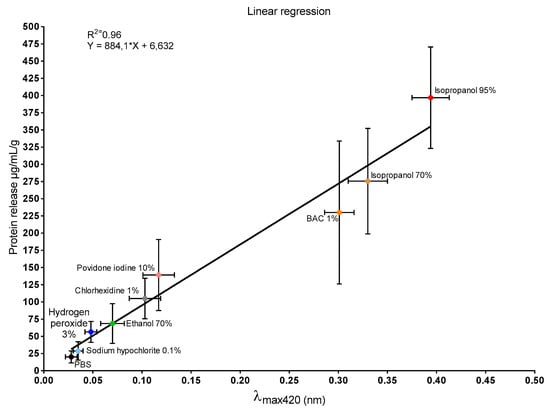
Figure 6.
Linear regression analysis between λmax 420 nm values and mucus protein concentration (R2 = 0.96; Y = 884.1 * X + 6.632). Data are expressed as mean ± standard deviation (vertical bars protein concentration, horizontal bars λmax 420 nm).
3.2. Linear Discriminant Analysis
The centroid plot of LDA without λmax 420 nm is shown in Figure 7. On the axes were the variables linear combinations with the highest discriminated percentage extracted from the analysis. On the x-axis was factor one (F1) with 89.44% discrimination and on the y-axis was factor two (F2) with 8.72%. The sum of the two factors (F1 and F2) reached a total bias of 98.16%.
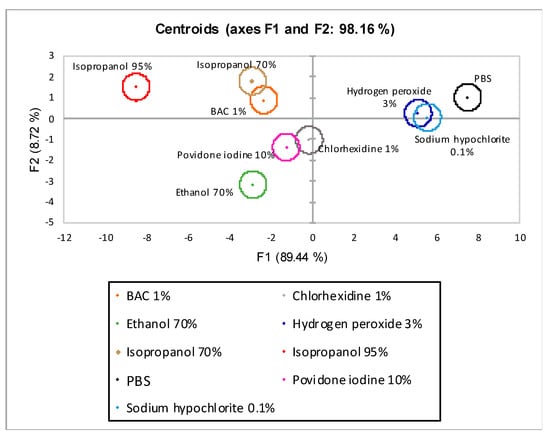
Figure 7.
Centroids graph for linear discriminant analysis (LDA) w/o λmax 420 nm. F1 (x-axis) and F2 (y-axis) are the factor axes extracted from the original variables. For each factor, the percentage of discrimination, both individual and cumulative, is reported in brackets.
Of the nine disinfectants tested, three were discriminated entirely (PBS, EtOH 70%, and isopropanol 95%), while the remaining were grouped into three distinct groups (hydrogen peroxide 3%-sodium hypochlorite 0.1, chlorhexidine 1%, povidone-iodine 10%, and BAC 1%-isopropanol 70%).
The centroid plot of the LDA with λmax 420 nm is shown in Figure 8. The axes are shown the linear combinations of the variables under investigation with the highest discriminated percentage extracted from the analysis. On the x-axis is factor one (F1) with 95.62% discrimination and on the y-axis is factor two (F2) with 4.09%. The sum of the two factors (F1 and F2) achieved total percentage discrimination of 99.71%. All nine disinfectants tested were completely discriminated.
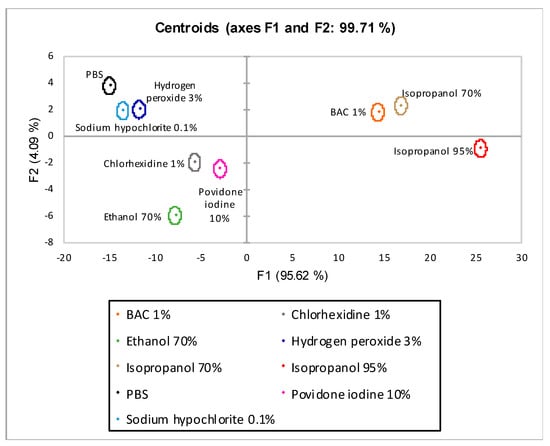
Figure 8.
Centroids graph for LDA λmax 420 nm. F1 (x-axis) and F2 (y-axis) are the factor axes extracted from the original variables. For each factor, the percentage of discrimination, both individual and cumulative, is reported in brackets.
Table 2 shows the percentage of correct predictions broken down for each class (disinfectants tested) for the two models analyzed (λmax 420 and w/o λmax 420) together with the percentage differences.

Table 2.
Training sample percentage of correct predictions for the LDA analysis performed. LDA λmax 420: analysis with λmax 420 variable; LDA w/o λmax 420: analysis without λmax 420; % correct LDA λmax 420—% correct LDA w/o λmax 420: the difference between the two analysis.
The introduction of the. Variable λmax 420 resulted in a percentage increase in total correct predictions of 16.05%. The classes that showed the most significant increase in prediction accuracy were BAC 1% (55.55% increase), povidone-iodine 10% (33.33%), and isopropanol 70% (22.22%). Sodium hypochlorite 0.1%, hydrogen peroxide 3%, and EtOH 70% had a modest increase (11.11%), while PBS, chlorhexidine 1%, and isopropanol 95% had no increase.
4. Discussion
The main SARS-CoV-2 routes of transmission are interhuman airborne and contact with contaminated surfaces. Thus, healthcare and community prevention measures include regular use of surface disinfectants and hand sanitizers [47,48,49].
The persistence of coronavirus on surfaces has caused the intensive use of chemical disinfectants by healthcare professions and the general public [50,51].
According to Van Doremalen et al. [52], SARS-CoV-2 could remain viable in aerosols for three hours with a low infectious load reduction. The viable virus was shown to be more stable on plastic and stainless steel and could be detected up to 72 h after deposition, although a substantial decrease in viral load was observed. A rough estimate of the median half-life was 5.6 h on steel and 6.8 h on plastic. No viable virus was detected after 4 h on copper or after 24 h on cardboard.
Due to the vast resonance of the pandemic and the high number of confirmed cases worldwide [4], people easily take inappropriate actions caused by fear. Numerous studies have reported improper use of chemical surface disinfectants prescribed against the spread of SARS-CoV-2 by not properly following the manufacturers’ instructions [53], with an increased poisoning risk rate during the year 2020 [54].
Besides, a prepandemic study conducted by Casey et al. [55] had already established a correlation between routine use of chemical disinfectants and mucosal irritant effects together with respiratory health. This study had concluded that the risks of mucosal irritation and asthma are higher in healthcare workers. Thus, repeated exposure to disinfectants had to be evaluated as an occupational disease risk factor when drafting healthcare disinfection protocols [56].
In this scenario, the study aimed at the discrimination according to mucosal irritation potential of nine disinfectants used for objects and surfaces against the spread of SARS-CoV-2 [10,11,12].
To this end, the land snail L. flavus was evaluated as a test organism in place of A. lusitanicus. In addition to the characteristics common to A. lusitanicus (i.e., mucosal epithelium, easily observable irritant effect, vulnerability to mechanical, or chemical damage), this species possesses unique features that promote its adoption as an “ideal” candidate for the evaluation of irritant potential [43,44,45].
As in the A. lusitanicus model, mucus production, weight changes, protein content, and LDH activity were evaluated as the main readouts [57].
For the first time in this study, mucus staining was used as a readout to assess mucosal irritant potential. Although the pigment’s chemical nature is unknown, this phenomenon has already been described in other land snail species. Some snails of the genus Ariolimax have bright yellow colouration [58]. Arion fasciatus (Nilsson) also possesses yellow-orange mantle pigments lost when reared on carrots, lettuce, or paper [59]. Moreover, besides the studies conducted by Cook et al. [42] on L. pseudoflavus, yellow pigmentations were evaluated by Seki et al. for the taxonomic distinction of two sibling snails species Bradybaena pellucida and B. similaris [60].
UV–Vis spectra of mucus samples retrieved from the disinfectant-treated snail (data not shown) revealed a maximum absorbance peak at 420 nm (λmax). These absorbance values were correlated with the respective data obtained from mucus protein quantification (Figure 6). Linear correlation analysis demonstrated a direct proportionality between the two variables (R2 = 0.96). These findings support the hypothesis that, similar to proteins [61], the pigment is released under stressful conditions.
Evaluation of mucosal irritant potential based on the comparison of individual readouts provided a difficult results interpretation (Table 1). However, a correlation between yellow pigmentation and protein release was demonstrated (Figure 6, the same was not true for % weight variations (Figure 2), % mucus production (Figure 3), and LDH activity (Figure 5).
For this reason, the mucosal irritation potential discrimination of disinfectants (classes) under investigation was assessed by a classification prediction model (LDA) that accounted for both the individual readouts (observations) and a statistically significant combination of them p < 0.05.
Two different LDA analyses were performed; in the first one (LDA w/o λmax 420), four observations common to both snail species (% weight variations, % mucus production, LDH, and protein quantification) were taken into account. This model’s total discrimination rate, defined as the sum of observations linear combinations (axes F1 and F2), was 98.16%. Nevertheless, only three of the nine observations were fully discriminated (Figure 7).
In the second model (LDA λmax 420), yellow mucus pigmentation (λmax 420) unique to L. flavus was included. The introduction of absorbance data into the model has increased both its discriminatory power (axes F1 and F2 99.71%) and predictive ability. Indeed, all nine observations were discriminated (Figure 8).
The predictive ability of both models has been reported in Table 2. The correct predictions (% correct) are summarized in percentages and divided both for each class (disinfectants tested) and total prediction. Comparison of the processed models (∆% correct) showed an increase in predictive ability for both total classes (16.05%) and six of the nine chemicals tested.
These findings demonstrate the contribution of the data obtained from the spectrophotometric analysis of L. flavus pigment in class discrimination according to their mucosal irritation potential.
Due to the better discrimination and predictive ability of the LDA λmax 420 model, its D2 data (Mahalanobis distance) from PBS (D2 PBS LDA λmax 420) were used to classify the tested disinfectants according to mucosal irritation potential (Table 3).

Table 3.
Disinfectant discrimination according to the mucosal irritation potential.
This parameter was chosen for its statistical meaning. When the D2 value between an observation and the group’s centre (calculated as mean) was the smallest, that observation could be classified into that group. The LDA provided D2 values for each group, called the linear discriminant function. For each observation, the group with the smallest D2 had the largest linear discriminant function, and the observation was classified into that group [62].
Since PBS was used as a control (no irritation potential), its Mahalanobis distance values were selected for classification.
By the D2 range values, a classification among the tested disinfectants was set up (Table 3) according to a numerical score (from 0 to 7) and an effects grade (from none to exceptionally high).
According to Dhont et al., L. flavus could be used to assess the irritant potential of chemicals without affecting the A. lusitanicus SMI concordance and specificity [45].
Nevertheless, in the present study, several chemical disinfectants at different concentrations prescribed by international disinfection protocols have been tested [10,11,12].
For this reason, the L. flavus SMI protocol was optimized to introduce a new readout (λmax 420).
Among the substances tested, only EtOH, chlorhexidine, and isopropanol have been previously analyzed by SMI studies (except PBS and BAC employed as control substances) [17,28,45,57,63]. For these substances, given the different concentrations used, a direct comparison of mucosa irritant potentials was not possible.
Nevertheless, although the concentration of isopropanol tested in previous studies was much lower than the current one (10% vs. 70 and 95%), it was already tagged as an irritant confirming snail mucosa high toxicity [28].
Regarding BAC 1%, both the classification proposed in this work (L. flavus SMI) and that proposed by previous works (A. lusitanicus SMI) were in agreement (very irritating to mucous membranes) [17].
5. Conclusions
In conclusion, our results confirmed that this native Mediterranean species might be a viable alternative in the SMI assay [43,44,45]. Furthermore, for the first time in this study, L. flavus mucus “yellow pigment” was evaluated as a new readout. Although further studies on the chemical composition and release patterns of this pigment are needed to elucidate the mechanisms of response to chemical insults, it demonstrated a strong correlation with protein secretion under stress conditions and a remarkable capacity in discriminating the mucosal irritant potential of nine surface disinfectants used to counteract the spread of SARS-CoV-2.
Author Contributions
Conceptualization, R.D.M., G.P.P. and M.A.C.; methodology, M.A.C., G.P.P., L.P., N.V., L.R. and F.N.; validation, R.D.M. and F.N.; formal analysis, L.R. and K.M.; investigation, G.P.P., M.A.C., L.P. and A.G.; resources, R.D.M.; data curation, I.M. and L.R.; writing—original draft preparation, M.A.C., G.P.P. and A.G.; writing—review and editing, R.D.M., G.P.P. and M.A.C.; supervision, K.M., G.P.P. and F.N.; funding acquisition, R.D.M. All authors have read and agreed to the published version of the manuscript.
Funding
This research received no external funding.
Institutional Review Board Statement
Ethical review and approval were waived for this study, due to the use of invertebrate animals.
Informed Consent Statement
Not applicable.
Data Availability Statement
Not applicable.
Conflicts of Interest
The authors declare no conflict of interest.
References
- Drexler, M. What You Need to Know about Infectious Disease; National Academies Press (US): Washington, DC, USA, 2014. [Google Scholar]
- Lai, X.; Wang, X.; Yang, Q.; Xu, X.; Tang, Y.; Liu, C.; Tan, L.; Lai, R.; Wang, H.; Zhang, X. Will healthcare workers improve infection prevention and control behaviors as COVID-19 risk emerges and increases, in China? Antimicrob. Resist. Infect. Control 2020, 9, 1–9. [Google Scholar] [CrossRef] [PubMed]
- Kim, S.W.; Kang, S.I.; Shin, D.H.; Oh, S.Y.; Lee, C.W.; Yang, Y.; Son, Y.K.; Yang, H.-S.; Lee, B.-H.; An, H.-J. Potential of Cell-Free Supernatant from Lactobacillus plantarum NIBR97, Including Novel Bacteriocins, as a Natural Alternative to Chemical Disinfectants. Pharmaceuticals 2020, 13, 266. [Google Scholar] [CrossRef] [PubMed]
- WHO. Coronavirus (COVID-19) Dashboard. 2021. Available online: https://covid19.who.int/ (accessed on 22 March 2021).
- Malik, Y.A. Properties of coronavirus and SARS-CoV-2. Malays. J. Pathol. 2020, 42, 3–11. [Google Scholar] [PubMed]
- Petronio, G.P.; di Marco, R.; Costagliola, C. Do Ocular fluids represent a transmission route of SARS-CoV-2 infection? Front. Med. 2020, 7, 1–4. [Google Scholar]
- Carraturo, F.; del Giudice, C.; Morelli, M.; Cerullo, V.; Libralato, G.; Galdiero, E.; Guida, M. Persistence of SARS-CoV-2 in the environment and COVID-19 transmission risk from environmental matrices and surfaces. Environ. Pollut. 2020, 115010. [Google Scholar] [CrossRef]
- García-Ávila, F.; Valdiviezo-Gonzales, L.; Cadme-Galabay, M.; Gutiérrez-Ortega, H.; Altamirano-Cárdenas, L.; Zhindón-Arévalo, C.; del Pino, L.F. Considerations on water quality and the use of chlorine in times of SARS-CoV-2 (COVID-19) pandemic in the community. Case Stud. Chem. Environ. Eng. 2020, 100049. [Google Scholar] [CrossRef]
- Hussain, S.; Cheema, M.J.M.; Motahhir, S.; Iqbal, M.M.; Arshad, A.; Waqas, M.S.; Usman Khalid, M.; Malik, S. Proposed Design of Walk-Through Gate (WTG): Mitigating the Effect of COVID-19. Appl. Syst. Innov. 2020, 3, 41. [Google Scholar] [CrossRef]
- Gruppo di Lavoro ISS Prevenzione e Controllo delle Infezioni. Indicazioni ad Interim per la Sanificazione Degli Ambienti Interni nel Contesto Sanitario e Assistenziale per Prevenire la Trasmissione di SARS-CoV 2. 2020. Available online: https://www.iss.it/documents/20126/0/Rapporto+ISS+COVID-19+n.+20_2020+REV+2.pdf/afbbb63a-1f0f-9a11-6229-a13009cacd96?t=1594641502569 (accessed on 22 March 2021).
- WHO. Infection Prevention and Control Guidance for Long-Term Care Facilities in the Context of COVID-19: Interim Guidance. 2021. Available online: https://apps.who.int/iris/bitstream/handle/10665/338481/WHO-2019-nCoV-IPC_long_term_care-2021.1-eng.pdf?sequence=1&isAllowed=y (accessed on 22 March 2021).
- Disinfectants for Use Against SARS-CoV-2 (COVID-19); U.S. Environmental Protection Agency: Washington, DC, USA, 2020.
- Maris, P. Modes of action of disinfectants. Rev. Sci. Et Tech. (Int. Off. Epizoot.) 1995, 14, 47–55. [Google Scholar] [CrossRef] [PubMed]
- Chesné, J.; Cardoso, V.; Veiga-Fernandes, H. Neuro-immune regulation of mucosal physiology. Mucosal Immunol. 2019, 12, 10–20. [Google Scholar] [CrossRef]
- Marini, A.; Hengge, U. Important viral and bacterial infections of the skin and mucous membrane. Der Internist 2009, 50, 160–170. [Google Scholar] [CrossRef]
- Magnifico, I.; Petronio, G.; Venditti, N.; Cutuli, M.A.; Pietrangelo, L.; Vergalito, F.; Mangano, K.; Zella, D.; di Marco, R. Atopic dermatitis as a multifactorial skin disorder. Can the analysis of pathophysiological targets represent the winning therapeutic strategy? Pharmaceuticals 2020, 13, 411. [Google Scholar] [CrossRef] [PubMed]
- Adriaens, E.; Remon, J.P. Evaluation of an alternative mucosal irritation test using slugs. Toxicol. Appl. Pharmacol. 2002, 182, 169–175. [Google Scholar] [CrossRef] [PubMed]
- Mangano, K.; Vergalito, F.; Mammana, S.; Mariano, A.; de Pasquale, R.; Meloscia, A.; Bartollino, S.; Guerra, G.; Nicoletti, F.; di Marco, R. Evaluation of hyaluronic acid-P40 conjugated cream in a mouse model of dermatitis induced by oxazolone. Exp. Ther. Med. 2017, 14, 2439–2444. [Google Scholar] [CrossRef] [PubMed]
- Olsson, I.A.S.; Silva, S.P.d.; Townend, D.; Sandøe, P. Protecting animals and enabling research in the European Union: An overview of development and implementation of directive 2010/63/EU. ILAR J. 2017, 57, 347–357. [Google Scholar] [CrossRef]
- Cutuli, M.A.; Petronio Petronio, G.; Vergalito, F.; Magnifico, I.; Pietrangelo, L.; Venditti, N.; di Marco, R. Galleria mellonella as a consolidated in vivo model hosts: New developments in antibacterial strategies and novel drug testing. Virulence 2019, 10, 527–541. [Google Scholar] [CrossRef]
- Van Houte, D.E. De Ontwikkeling van een Alternatieve Mucosale Irritatietest; Optimization and Validation of An Alternative Mucosal Irritation Test, 2000; Pharmaceutical Care Ghent University: Ghent, Belgium, 2005. [Google Scholar]
- Jensen, K.; Engelke, S.; Simpson, S.J.; Mayntz, D.; Hunt, J. Balancing of specific nutrients and subsequent growth and body composition in the slug Arion lusitanicus. Physiol. Behav. 2013, 122, 84–92. [Google Scholar] [CrossRef][Green Version]
- South, A. Terrestrial slugs: Biology, Ecology and Control; Chapman & Hall: London, UK, 1992. [Google Scholar]
- Verdugo, P.; Deyrup-Olsen, I.; Aitken, M.; Villalon, M.; Johnson, D. Molecular mechanism of mucin secretion: I. The role of intragranular charge shielding. J. Dent. Res. 1987, 66, 506–508. [Google Scholar] [CrossRef]
- Deyrup-Olsen, I.; Martin, A.W. Surface exudation in terrestrial slugs. Comp. Biochem. Physiol. Part. C Comp. Pharmacol. 1982, 72, 45–51. [Google Scholar] [CrossRef]
- Lenoir, J.; Bachert, C.; Remon, J.-P.; Adriaens, E. The slug mucosal irritation (SMI) assay: A tool for the evaluation of nasal discomfort. Toxicol. Vitr. 2013, 27, 1954–1961. [Google Scholar] [CrossRef] [PubMed]
- Kendall, R.; Lenoir, J.; Gerrard, S.; Scheuerle, R.L.; Slater, N.K.; Tuleu, C. Using the Slug Mucosal Irritation assay to investigate the tolerability of tablet excipients on human skin in the context of the use of a nipple shield delivery system. Pharm. Res. 2017, 34, 687–695. [Google Scholar] [CrossRef] [PubMed]
- Adriaens, E.; Guest, R.; Willoughby Sr, J.; Fochtman, P.; Kandarova, H.; Verstraelen, S.; van Rompay, A. CON4EI: Slug Mucosal Irritation (SMI) test method for hazard identification and labelling of serious eye damaging and eye irritating chemicals. Toxicol. Vitr. 2018, 49, 77–89. [Google Scholar] [CrossRef]
- Ceulemans, J.; Vermeire, A.; Adriaens, E.; Remon, J.P.; Ludwig, A. Evaluation of a mucoadhesive tablet for ocular use. J. Control. Release 2001, 77, 333–344. [Google Scholar] [CrossRef]
- Lenoir, J.; Adriaens, E.; Remon, J.P. New aspects of the Slug Mucosal Irritation assay: Predicting nasal stinging, itching and burning sensations. J. Appl. Toxicol. 2011, 31, 640–648. [Google Scholar] [CrossRef] [PubMed]
- Petit, J.-Y.; Doré, V.; Marignac, G.; Perrot, S. Assessment of ocular discomfort caused by 5 shampoos using the Slug Mucosal Irritation test. Toxicol. Vitr. 2017, 40, 243–247. [Google Scholar] [CrossRef]
- Adriaens, E.; Ameye, D.; Dhondt, M.; Foreman, P.; Remon, J.P. Evaluation of the mucosal irritation potency of co-spray dried Amioca®/poly (acrylic acid) and Amioca®/Carbopol® 974P mixtures. J. Control. Release 2003, 88, 393–399. [Google Scholar] [CrossRef]
- De Cock, L.J.; Lenoir, J.; de Koker, S.; Vermeersch, V.; Skirtach, A.G.; Dubruel, P.; Adriaens, E.; Vervaet, C.; Remon, J.P.; de Geest, B.G. Mucosal irritation potential of polyelectrolyte multilayer capsules. Biomaterials 2011, 32, 1967–1977. [Google Scholar] [CrossRef] [PubMed]
- Porfiryeva, N.N.; Nasibullin, S.F.; Abdullina, S.G.; Tukhbatullina, I.K.; Moustafine, R.I.; Khutoryanskiy, V.V. Acrylated Eudragit® E PO as a novel polymeric excipient with enhanced mucoadhesive properties for application in nasal drug delivery. Int. J. Pharm. 2019, 562, 241–248. [Google Scholar] [CrossRef] [PubMed]
- Adriaens, E.; Dierckens, K.; Bauters, T.G.; Nelis, H.J.; van Goethem, F.; Vanparys, P.; Remon, J.P. The mucosal toxicity of different benzalkonium chloride analogues evaluated with an alternative test using slugs. Pharm. Res. 2001, 18, 937–942. [Google Scholar] [CrossRef]
- Adriaens, E.; Remon, J.P. Mucosal irritation potential of personal lubricants relates to product osmolality as detected by the slug mucosal irritation assay. Sex. Transm. Dis. 2008, 35, 512–516. [Google Scholar] [CrossRef]
- Vandamme, K.; Melkebeek, V.; Cox, E.; Deforce, D.; Lenoir, J.; Adriaens, E.; Vervaet, C.; Remon, J.P. Influence of reaction medium during synthesis of Gantrez® AN 119 nanoparticles for oral vaccination. Eur. J. Pharm. Biopharm. 2010, 74, 202–208. [Google Scholar] [CrossRef]
- Callens, C.; Adriaens, E.; Dierckens, K.; Remon, J.P. Toxicological evaluation of a bioadhesive nasal powder containing a starch and Carbopol® 974 P on rabbit nasal mucosa and slug mucosa. J. Control. Release 2001, 76, 81–91. [Google Scholar] [CrossRef]
- Dhondt, M.M.; Adriaens, E.; Van Roey, J.; Remon, J.P. The evaluation of the local tolerance of vaginal formulations containing dapivirine using the Slug Mucosal Irritation test and the rabbit vaginal irritation test. Eur. J. Pharm. Biopharm. 2005, 60, 419–425. [Google Scholar] [CrossRef] [PubMed]
- Forcart, L. Limacus maculatus (Kaleniczenko) und Limacus flavus (Linnaeus). Mitt. Dtsch. Malakozool. Ges. 1986, 38, 21–23. [Google Scholar]
- Chelazzi, G.; le Voci, G.; Parpagnoli, D. Relative importance of airborne odours and trails in the group homing of Limacus flavus (Linnaeus) (Gastropoda, Pulmonata). J. Molluscan Stud. 1988, 54, 173–180. [Google Scholar] [CrossRef]
- Cook, A.; Shirbhate, R. The mucus producing glands and the distribution of the cilia of the pulmonate slug Limax pseudoflavus. J. Zool. 1983, 201, 97–116. [Google Scholar] [CrossRef]
- Chang, N.-S. Ultrastructural and Histochemical Studies on the Epithelial Cells and Mucus-producing Cells of Korean Slug (Limax flavus L.). Appl. Microsc. 1988, 18, 1–20. [Google Scholar]
- Khutoryanskaya, O.V.; Mayeva, Z.A.; Mun, G.A.; Khutoryanskiy, V.V. Designing temperature-responsive biocompatible copolymers and hydrogels based on 2-hydroxyethyl (meth) acrylates. Biomacromolecules 2008, 9, 3353–3361. [Google Scholar] [CrossRef] [PubMed]
- Dhondt, M.M.; Adriaens, E.; Pinceel, J.; Jordaens, K.; Backeljau, T.; Remon, J.P. Slug species-and population-specific effects on the end points of the Slug Mucosal Irritation test. Toxicol. Vitr. 2006, 20, 448–457. [Google Scholar] [CrossRef] [PubMed]
- Castillo, V.M. Limacus flavus (Linnaeus, 1758 Linnaeus, 1758 Linnaeus, 1758): Antecedentes de la especie Antecedentes de la especie. Amici Molluscarum 2020, 27, 21–26. [Google Scholar]
- WHO. Cleaning and Disinfection of Environmental Surfaces in the Context of COVID-19: Interim Guidance, 15 May 2020; World Health Organization: Geneva, Switzaerland, 2020; Available online: https://apps.who.int/iris/handle/10665/332096 (accessed on 22 March 2021).
- Lauritano, D.; Moreo, G.; Limongelli, L.; Nardone, M.; Carinci, F. Environmental Disinfection Strategies to Prevent Indirect Transmission of SARS-CoV2 in Healthcare Settings. Appl. Sci. 2020, 10, 6291. [Google Scholar] [CrossRef]
- Al-Gheethi, A.; Al-Sahari, M.; Abdul Malek, M.; Noman, E.; Al-Maqtari, Q.; Mohamed, R.; Talip, B.A.; Alkhadher, S.; Hossain, M. Disinfection Methods and Survival of SARS-CoV-2 in the Environment and Contaminated Materials: A Bibliometric Analysis. Sustainability 2020, 12, 7378. [Google Scholar] [CrossRef]
- Ijaz, M.; Brunner, A.; Sattar, S.; Nair, R.C.; Johnson-Lussenburg, C. Survival characteristics of airborne human coronavirus 229E. J. Gen. Virol. 1985, 66, 2743–2748. [Google Scholar] [CrossRef] [PubMed]
- Safari, Z.; Fouladi-Fard, R.; Vahidmoghadam, R.; Hosseini, M.R.; Mohammadbeigi, A.; Omidi Oskouei, A.; Rezaali, M.; Ferrante, M.; Fiore, M. Awareness and Performance towards Proper Use of Disinfectants to Prevent COVID-19: The Case of Iran. Int. J. Environ. Res. Public Health 2021, 18, 2099. [Google Scholar] [CrossRef] [PubMed]
- Van Doremalen, N.; Bushmaker, T.; Morris, D.H.; Holbrook, M.G.; Gamble, A.; Williamson, B.N.; Tamin, A.; Harcourt, J.L.; Thornburg, N.J.; Gerber, S.I. Aerosol and surface stability of SARS-CoV-2 as compared with SARS-CoV-1. N. Engl. J. Med. 2020, 382, 1564–1567. [Google Scholar] [CrossRef] [PubMed]
- Chang, A.; Schnall, A.H.; Law, R.; Bronstein, A.C.; Marraffa, J.M.; Spiller, H.A.; Hays, H.L.; Funk, A.R.; Mercurio-Zappala, M.; Calello, D.P. Cleaning and disinfectant chemical exposures and temporal associations with COVID-19—national poison data system, United States, 1 January–31 March 2020. Morb. Mortal. Wkly. Rep. 2020, 69, 496. [Google Scholar] [CrossRef] [PubMed]
- Babić, Ž.; Turk, R.; Macan, J. Toxicological aspects of increased use of surface and hand disinfectants in Croatia during the COVID-19 pandemic: A preliminary report. Arch. Ind. Hyg. Toxicol. 2020, 71, 261–264. [Google Scholar] [CrossRef]
- Casey, M.L.; Hawley, B.; Edwards, N.; Cox-Ganser, J.M.; Cummings, K.J. Health problems and disinfectant product exposure among staff at a large multispecialty hospital. Am. J. Infect. Control 2017, 45, 1133–1138. [Google Scholar] [CrossRef]
- Kim, J.-H.; Hwang, M.-Y.; Kim, Y.-j. A Potential Health Risk to Occupational User from Exposure to Biocidal Active Chemicals. Int. J. Environ. Res. Public Health 2020, 17, 8770. [Google Scholar] [CrossRef]
- Adriaens, E.; Bytheway, H.; de Wever, B.; Eschrich, D.; Guest, R.; Hansen, E.; Vanparys, P.; Schoeters, G.; Warren, N.; Weltens, R. Successful prevalidation of the slug mucosal irritation test to assess the eye irritation potency of chemicals. Toxicol. Vitr. 2008, 22, 1285–1296. [Google Scholar] [CrossRef]
- Gordon, D.G. Field Guide to the Slug; Sasquatch Books: Seattle, WA, USA, 1994. [Google Scholar]
- Jordaens, K.; Riel, P.V.; Geenen, S.; Verhagen, R.; Backeljau, T. Food-induced body pigmentation questions the taxonomic value of colour in the self-fertilizing slug Carinarion spp. J. Molluscan Stud. 2001, 67, 161–167. [Google Scholar] [CrossRef][Green Version]
- Seki, K.; Wiwegweaw, A.; Asami, T. Fluorescent pigment distinguishes between sibling snail species. Zool. Sci. 2008, 25, 1212–1219. [Google Scholar] [CrossRef] [PubMed]
- Adriaens, E.; Remon, J.P. Gastropods as an evaluation tool for screening the irritating potency of absorption enhancers and drugs. Pharm. Res. 1999, 16, 1240–1244. [Google Scholar] [CrossRef] [PubMed]
- Izenman, A.J. Linear discriminant analysis. In Modern Multivariate Statistical Techniques; Springer: New York, NY, USA, 2013; pp. 237–280. [Google Scholar]
- Adriaens, E.; Dhondt, M.; Remon, J.P. Refinement of the Slug Mucosal Irritation test as an alternative screening test for eye irritation. Toxicol. Vitr. 2005, 19, 79–89. [Google Scholar] [CrossRef] [PubMed]
Publisher’s Note: MDPI stays neutral with regard to jurisdictional claims in published maps and institutional affiliations. |
© 2021 by the authors. Licensee MDPI, Basel, Switzerland. This article is an open access article distributed under the terms and conditions of the Creative Commons Attribution (CC BY) license (https://creativecommons.org/licenses/by/4.0/).