Abstract
This analysis is the first to investigate the influence of index futures trading volume on spot market volatility for the Ho Chi Minh Stock Exchange (HOSE). The data utilized in this study are the daily VN30-Index futures contract trading volume starting at the inception date for the VN30-Index futures contract, 10 August 2017 and going through 10 August 2022. Using an autoregressive distributed lag (ARDL) bounds testing approach, the empirical findings reveal a positive relation between VN30-Index futures trading volume and the volatility of the spot market for the HOSE in the short-run. In addition, the results of the ARDL tests confirm in for the long-run, trading volume of futures contracts has a significant positive influence on spot market volatility. Moreover, the results derived from the error correction model (ECM) indicate that only 5.54% of the disequilibria from the previous trading day are converged and corrected back to the long-run equilibrium from the current day. Based on the findings, we recommend that Vietnamese policymakers establish relevant intervention polices on speculation of individual investors in order to provide stabilization safeguards for the underlying stock market.
1. Introduction
The effects of derivatives trading on the spot market have received significant attention from both academics and practitioners over the last few decades (Bae et al. 2004). One of primary topics explored by researchers is the impact of futures trading volume on the price volatility of spot markets. Most studies have focused on developed markets such as the U.S. and U.K. and larger emerging stock markets, while very few have addressed frontier markets such as Vietnam because few have taken the major step Vietnam has taken to launch derivative contracts. This dearth of research in frontier markets is an important gap in the literature where these much smaller and generally newly created derivative markets may behave idiosyncratically varying substantially from more established and actively traded markets. Vietnam, for example, has a very high participation rate by individual investors as compared to much smaller participation by institutional investors. Specifically, at the end of 2019, the proportion of individual investor’s trading volume to the total market trading volume accounted for 85.8% (Truong et al. 2021). This proportion is considerably high compared to those in other emerging stock markets. In fact, individual investor trading volume accounted only for 43.8% of the total market trading volume in the Stock Exchange of Thailand (SET market report for April 2022: “https://classic.set.or.th/set/pdfnews.do?newsId=16517934214730&sequence=2022054374”, accessed on 25 November 2022).
The existing literature has provided mixed evidence on the effect of futures volume on spot market volatility (SMV). One group of studies reported a positive association between futures trading volume and SMV (Smit and Nienaber 1997; Yilgor and Mebounou 2016; Sharma and Rastogi 2020; Rastogi et al. 2021). Contrary to the first category, several studies found a negative influence of futures trading volume on SMV (Bessembinder and Seguin 1992; Brown-Hruska and Kuserk 1995; Gulen and Mayhew 2000). Additionally, other studies contented that futures trading levels did not have a significant impact on the SMV (Darrat and Rahman 1995; Board et al. 2001; Illueca and Lafuente 2003).
Established on 28 July 2000, the Ho Chi Minh Stock Exchange (HOSE) was the first and is now the largest stock exchange in Vietnam. Bythe end of June 2020, there were 380 companies with a total equity market capitalization of VND 2,874,204 billion (about USD 124.48 billion) traded on the HOSE. The Vietnam derivatives market has followed on this success and officially launched on 10 August 2017 by introducing the VN30-Index futures contract, a market capitalization-weighted index comprising 30 large capitalization and highly liquid stocks traded on the HOSE. According to Nguyen and Truong (2020), the VN30-Index futures contract was selected as the first product for the Vietnam derivatives market because it was viewed as less risky than futures contracts on individual stocks. As measured by the increased trading volume, the new futures contract has become popular; according to data from the Ha Noi Stock Exchange, average daily volume has risen from 10,954 contracts in 2017 to a very notable 164,631 contracts traded during the first half of 2020.
One of the primary and unique traits of Vietnamese futures market participation is that most investors are smaller individual investors. The presence of larger numbers of individual investors could increase the SMV because most of them participate in the futures market with the goal of speculation while lacking experience and knowledge of investment. In other words, most of individual investors are noise-traders. In addition, the high leverage of index futures trading is also a characteristic of the Vietnamese futures market that could make the market more unstable. Although the effects of futures volume on the spot market in general and on SMV in particular have been extensively investigated in the literature, to our knowledge, no study has examined the impact of index futures trading volume on the SMV for HOSE.
This analysis fills the literature gap by investigating the effect of index futures trading volume on SMV for HOSE. This study should provide unique insights for the literature covering the effects of index futures trading volume on SMV. While most prior studies focus on developed or emerging markets, this study provides the first empirical evidence of the relation between index futures trading volume and SMV for the HOSE—a frontier market. The HOSE is an interesting case for this research because it is one of only a small number of frontier stock markets that have endeavored to launch a derivatives contract. In addition, the derivatives market has only operated for a short period, with trading still dominated by individual investors. For these reasons, the effects of index futures trading volume on SMV are expected to be more pronounced for the HOSE.
In addition, while most previous studies used GARCH models or Granger causality tests to examine the effects of futures volume on SMV, this study employs an ARDL bounds test approach to investigate the effects of index futures trading volume on SMV for the HOSE. The major advantage of an ARDL bounds test is that an error correction model (ECM) can be obtained from the ARDL model, so the short-run and the long-run impacts of index futures trading volume on the SMV can be assessed at the same time. It is important to note that the ECM approach has been widely employed in the financial literature in recent years (Hunegnaw and Kim 2017; Bahmani-Oskooee and Gelan 2018; Apostolakis et al. 2021; Dungore and Patel 2021; Truong et al. 2022). In addition, the ARDL does not require that all variables in the model have the same integration order. Moreover, the ARDL test is relatively more efficient and reliable than other approaches in the case of small and limited sample sizes (Guan et al. 2015; Yiheyis and Musila 2018).
The key hypothesis of this study is that VN30-Index futures trading volume has a significant positive impact on SMV due to the large relative participation of individual investors. This hypothesis is tested by using the ARDL bounds test. The findings derived from the test confirm that in the short-run, futures contract trading volume has a significant positive impact on SMV. Similarly, the futures trading volume also has a significant positive influence on the SMV in the long-run. Moreover, the results derived from the error correction model (ECM) indicate that only 5.54% of the disequilibria from the previous trading day are converged and corrected back to the long-run equilibrium of the current day.
2. Literature Review
The existing literature has provided mixed evidence on the effect of futures volume on spot market volatility (SMV). One group of studies reported a positive association between futures trading volume and SMV. Specifically, Bessembinder and Seguin (1992) investigated the effects of futures trading volume levels and open interest on SMV in the US by partitioning futures trading volume and open interest series into expected and unexpected components. Their results indicated that the unexpected futures trading volume has a positive effect on the SMV. Using the same method of Bessembinder and Seguin (1992), Smit and Nienaber (1997) estimated the relationship between futures trading activity and stock market returns volatility for the Johannesburg Stock Exchange (JSE). This study documented that futures trading volume has a significantly positive impact on market return volatility. In addition, Yilgor and Mebounou (2016) examined the effects of futures trading volume on the SMV for the Istanbul Stock Exchange. Using both GARCH and EGARCH models, the results revealed that an unexpected futures trading volume is positively associated with the SMV. Similarly, Sharma and Rastogi (2020) employed a GARCH(1,1) model to measure the effects of options volume and futures volume on the SMV in India. They found that both option trading volume and futures trading volume have a significantly positive effect on SMV. In a recent study, Rastogi et al. (2021) employed the generalized method of moments (GMM) model to investigate effects of futures trading volume on the SMV in India. Findings from this indicated that high futures trading volume is associated with high SMV.
Contrary to the first category, several studies found a negative influence of futures trading volume on SMV. In fact, Bessembinder and Seguin (1992) documented that expected futures trading volume has a significantly negative effect on the SMV. Similarly, Brown-Hruska and Kuserk (1995) determined the effects of index futures trading volume on the SMV for the US. stock market and concluded that the index trading volume, measured by the expected ratio of index futures trading to spot market trading, is negatively associated with the SMV. Furthermore, Gulen and Mayhew (2000) investigated the effects of futures trading activity on the market returns volatility for 17 developed countries. Using the GJR-GARCH model, the results showed that in most countries, futures open interest has negative effects on the market volatility.
Moreover, some recent studies have tested the causal relation between futures trading volume and SMV. Specifically, Pok and Poshakwale (2004) employed the Granger causality test to examine the causality between futures trading volume and SMV for the Kuala Lumpur Stock Exchange. Findings of the study indicated that futures trading volume causes SMV with one day’s lag. Similarly, Truong et al. (2021) investigated the causal relation between index futures trading and SMV for Ho Chi Minh Stock Exchange. Using the Granger causality test, the study found the bidirectional causality relation between the SMV and the future trading volume. Regarding single stocks, Jain et al. (2016) reported the bidirectional causal relationships between futures volume and spot price volatility for half of the 50 constituent stocks of the CNX NIFTY Index in India. In addition, Rastogi and Athaley (2019) tested the integration of volatility in spot, futures and options markets for the National Stock Exchange of India. The results derived from the GMM method indicated that volatility in spot and futures markets has bidirectional causality.
In addition, other studies have contended that futures trading levels did not have a significant impact on the SMV. Using multivariate Granger causality tests, Darrat and Rahman (1995) mainly determined the effects of futures trading activity, measured by futures trading volume and open interest, on the market volatility for the US stock market. This study documented that SMV was not significantly caused by futures trading activity. In addition, Board et al. (2001) investigated the effects of futures market volume on SMV for the London Stock Exchange. The authors also found no significant impact of futures trading volume on the SMV. Similarly, Illueca and Lafuente (2003) determined the intraday relation between spot volatility and trading volume for the Spanish stock index futures exchange. Using a GARCH model, the results confirmed that futures trading volume did not have any significant effects on the SMV.
Regarding the effect of index futures trading on SMV, Chen et al. (2013) measured the effect of index futures introduction on SMV in China. The empirical findings indicated that the introduction of index future trading is associated with a decrease in the SMV. Also in China, Bohl et al. (2015) investigated the impact of index futures trading on the SMV for three Chinese stock markets. By using GARCH models, the authors also found that the introduction of index futures leads to diminished SMV. In another study, Ausloos et al. (2020) discovered an effect of index futures trading on spot price volatility for the Chinese stock market. They reported that the introduction of CSI-300 index futures trading is associated with a reduction in spot price volatility. However, Xie and Huang (2014) found that the introduction of index futures does not have a significant effects on the SMV for the Chinese stock market. In addition, Günay and Haque (2015) examined the effect of index futures trading on the SMV in Turkey. The findings of EGARCH and TARCH models indicated that index futures trading destabilizes SMV. Bohl et al. (2016) investigated the effect of the introduction of index futures contracts on spot markets in France, Germany, Japan, the United Kingdom and the United States. This study found no significant changes in market volatility following the introduction of index futures contracts for these large actively traded markets.
Examining another aspect, Antonakakis et al. (2016) estimated the dynamic spillovers between spot and futures markets volatilities as well as volume of futures trading and open interest for the UK and the US. They documented that spot and futures volatilities in both the US and UK are transmissional channels of shocks to futures trading volume and open interest. In addition, Kao et al. (2019) investigated the linkages between return and trading volume as well as between return volatility and trading volume for the S&P 500 VIX Futures Index. The results of the threshold model with the GJR-GARCH framework confirmed that the contemporaneous and lagged trading volume have significantly positive effects on the volatility of the S&P 500 VIX Futures Index. Recently, Dungore and Patel (2021) determined the relationship between trading volume, open interest and volatility for India. Based on the findings of a VAR model, they concluded that the effect of volume is greater than open interest on volatility.
3. Data and Methodology
3.1. Data Sources
The data utilized in this study are the daily VN30-Index and futures contract trading volume. The data were obtained from the HOSE and Ha Noi Stock Exchange (HNX)for the period from 10 August 2017 (the first trading day of VN30-Index futures contract in Vietnam) through 10 August 2022. Specifically, the data sources are shown in Table 1.

Table 1.
Data sources.
It is important to note that this analysis employs price indices and not total return (includes regular dividends) indices. Price indices are the industry standard for calculating volatility. Financial instruments and derivatives in particular are constructed with this as a foundational precept. As Edwards and Lazzara (2016) point out, “we have not specified the total return version; the S&P Realized Volatility Indices use price indices as their underlying reference”.
Volatility is a measure of uncertainty of the underlying prices that incorporate the known information set of a particular company including all regular dividend announcements and payments. Using a total return index that incorporates dividend payments would create a muddy and inaccurate representation of spot market price volatility considering that the announcement, ex-dividend and payment differential price movements surrounding each dividend already incorporate the dividend’s effects. For this reason, stock options also do not include adjustments for regular dividends. Using a total return index that incorporates dividend payments is appropriate for calculating the buy and hold returns of a stock or index but not for calculating the intermittent volatility of a stock or index.
Daily VN30-Index was obtained for each trading day. Then, daily continuously compounded returns were calculated as follows:
where:
Rt: Market return at trading day t;
Pt: VN30-Index at trading day t;
Pt−1: VN30-Index at trading day t − 1.
3.2. Methodology
This study investigates the effects of VN30-Index futures trading volume on SMV for the HOSE by using the following regression model:
where:
- -
- VOL: Volatility of spot market returns generated from the EGARCH(1,1) model. Specifically, the EGARCH(1,1) employed in this study takes the following form:
- -
- LNFTV: The natural logarithm of index futures trading volume.
To test for short-run and long-run effects of index futures trading volume on the SMV for the HOSE, an autoregressive distributed lag (ARDL) model proposed by Pesaran et al. (2001) is employed in this study. The ARDL model has three main advantages compared to other co-integration methods. Firstly, the ARDL does not require all variables in the model have the same integration order. They can be integrated of purely order zero, purely order one or a combination of both. Secondly, the ARDL test is relatively more efficient and reliable than other approaches in the case of small and limited sample sizes. The final strong-point of this approach over other alternative cointegration methods is that an error correction model (ECM) can be obtained from the ARDL model, so the short-run and the long-run impacts of the independent variables on the dependent variable can be assessed at the same time.
3.2.1. Unit Root Test
It is important to indicate that the ARDL bounds test requires that all variables are I(0) or I(1). Therefore, before performing the ARDL bounds test, the order of integration of all variables should be determined by using the unit root test. In this study, the ADF test is used to examine whether the studied variables are stationary or not. The ADF test takes the following form:
where Δ is the first-difference operator and yt is the series under consideration. Because the ADF test results are sensitive to the choice of the lag length (k), the Akaike information criterion (AIC) was employed for choosing the optimal lag length of the ADF regression.
3.2.2. ARDL Bound Test for Cointegration
Before investigating the long-run and short-run relationship among the variables in the model, cointegration tests are performed as a required condition. The bounds test is conducted using the following equation:
where Δ represents the first difference of the variables.
The null hypothesis (H0) of the bound test is λ1 = λ2 = 0 (no co-integration in the long-run between variables). If the F-statistic computed from the bounds test is more than the critical value of the selected significance level, the null hypothesis is rejected. This means that there is a long-term relationship (co-integration) between the variables in the model. If a long-run equilibrium relationship exists between the SMV and index futures volume, the short-run and long-run effects of index futures volume on the SMV are estimated by Equations (6) and (7), respectively.
where:
- -
- q1, q2 represent the optimal number of lags.
- -
- ECM stands for Error Correction Model; ECMt−1 measures how quickly the dependent variable responds to a deviation from the equilibrium relationship in one day (period).
4. Empirical Results
4.1. Descriptive Statistics from the Sample
The descriptive statistics of variables that are employed in the model are summarized in Table 2. It is shown that the volatility of spot market returns measured by conditional variances ranges from 0.00001 to 0.00018 with a mean of 0.00001. Figure 1 plots volatility of spot market returns from 10 August 2017 to 10 August 2022. In addition, Table 2 reveals that the daily index futures trading volume fluctuated highly over the sample period, ranging from 487 to 505,677, with a standard deviation of 81,603. Specifically, Figure 2 shows that the daily index futures trading volume increased significantly during the period from 2017 to 2022.
Table 2.
Summary statistics of the sample.
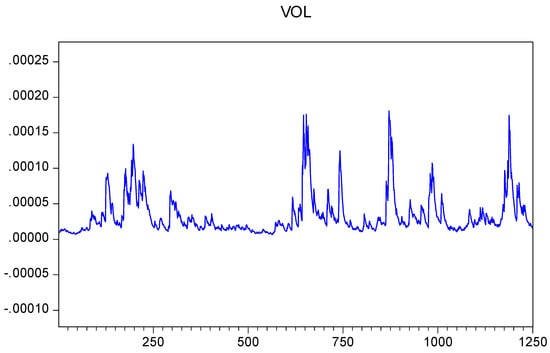
Figure 1.
Volatility of spot market returns from 10 August 2017 to 10 August 2022.
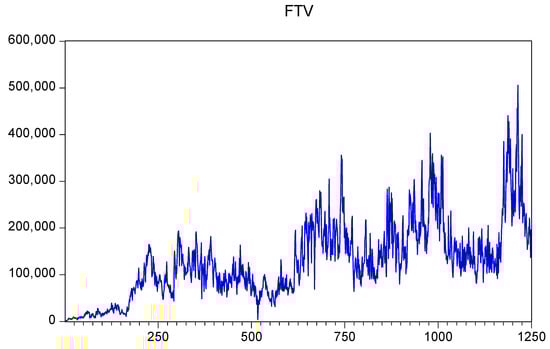
Figure 2.
Daily index futures trading volume from 10 August 2017 to 10 August 2022.
4.2. Results of Unit Root Tests
The results for the ADF test that are presented in Table 3 show that the null hypothesis of a unit root can be rejected at the five percent level for the VOL and FTV series. This indicates that these series are integrated to the order zero (I(0)). With this evidence, it is concluded that all the variables in the model fulfill the requirements of the ARDL bounds test even with or without trend.
Table 3.
Results of ADF unit root tests.
4.3. ARDL Bounds Test for Cointegration
The bounds test proposed by Pesaran et al. (2001) is used in this study to investigate the long-run relationship among variables of the models. Using the Akaike information criterion to detect optimal lags, the best model used for the study is ARDL (1,4). The results of the bounds reported in Table 4 show that the null hypothesis for no co-integration among variables can be rejected with an F-statistic greater than the upper-bound critical value at the one percent level. In other words, there is a long-term equilibrium relationship between the SMV and FTV. Therefore, the ARDL model can be employed to estimate the short-run and long-run coefficients of the model.
Table 4.
Results of the bounds test.
4.4. Short-Run and Long-Run Effects of Index Futures Volume on Spot Market Volatility
The short-run and long-run effects of index futures trading volume on SMV are estimated by using the selected ARDL (1,4) model. Due to existence of heteroskedasticity in the model (see Appendix A for results of ARCH test), the heteroskedasticity consistent standard errors developed by White (White standard errors) are employed in this study. The findings of the short-run and long-term effects of the VN30-Index futures trading volume on SMV derived from the model are summarized in Table 5 and Table 6, respectively. Specifically, the results presented in Table 5 show significant positive effects of contemporaneous and all lags index futures volume. The implication of this evidence is that in the short-run an increase in the index futures volume results in an increase in the SMV. The error correction coefficient for the model is only −0.0554 and statistically significant at the one percent level, indicating that only 5.55% of the movement into disequilibrium are corrected within one day. This adjustment speed is slow, indicating that the system takes more time to return to long-run equilibrium after a short-run shock.
Table 5.
The estimated short-run coefficients.
Table 6.
The estimated long-run coefficients.
As mentioned above, the ARDL bounds test approach also allows for the estimation of long-run effects of explanatory variables on a dependent variable. The results of the long-term effects of the index futures trading volume on the SMV presented in Table 6 confirm that index futures volume (LNFTV) is positively associated with SMV. This relationship is statistically significant at the one percent level. The implication of this evidence is that in the long-run an increase for the VN30-Index futures trading volume leads to an increase in SMV. This finding is consistent with the previous findings of Bessembinder and Seguin (1992), Smit and Nienaber (1997), Yilgor and Mebounou (2016), and Rastogi et al. (2021), but it is contrary to findings of Brown-Hruska and Kuserk (1995), Gulen and Mayhew (2000), Board et al. (2001), Illueca and Lafuente (2003). This evidence is likely to be appropriate with the current situation in the Vietnam stock market. It is important to stress that the Vietnam stock market has been characterized by the high leverage of index futures trading and dominated by individual speculative traders (Truong et al. 2021). Another characteristic of the market is a lack of information transparency (Ando and Scheela 2005). Therefore, many individual investors use futures trading volume as a signal of the market and make decisions to buy or sell stocks based on it. The positive effect of index trading volume on the SMV can be explained by these characteristics of the market.
4.5. Structural Stability Tests
To check the long-term stability of the coefficients in the model, the cumulative sum of the recursive residuals (CUSUM) and the cumulative sum of squared recursive residuals (CUSUMSQ) tests developed by Brown et al. (1975) are employed in this study. Figure 3 and Figure 4 show that the plots of CUSUM and CUSUMSQ, respectively, lie inside the critical bounds at the five percent level of significance. Therefore, it can be concluded that the model used is stable over the sample period.
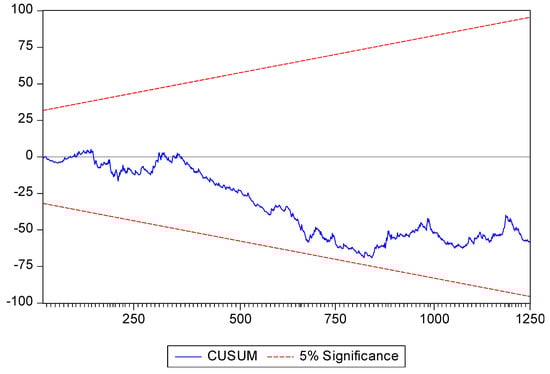
Figure 3.
Plots of CUSUM of recursive residuals.
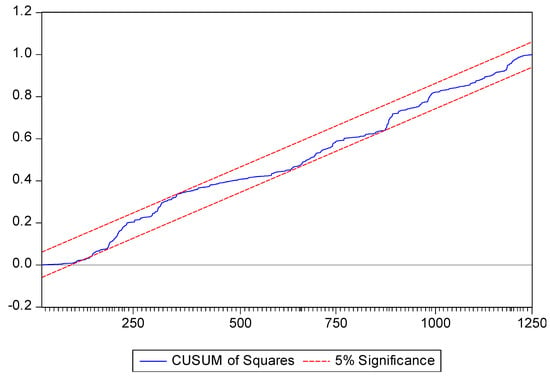
Figure 4.
Plots of CUSUMSQ of recursive residuals.
5. Conclusions
This study empirically investigated the effects of index futures trading volume on the SMV for the HOSE. Using VN30-Index futures trading volume and the daily return series for the VN30-Index covering the period from 10 August 2017 through 10 August 2022, the empirical results derived from the ARDL bounds test show that in the short run, an increase in the trading volume of futures contracts leads to an increase in the SMV. In addition, the findings of the ARDL test confirm that in the long run, the trading volume of futures contracts has significant positive effects on SMV. This evidence is in line with the previous findings of Bessembinder and Seguin (1992), Smit and Nienaber (1997), Yilgor and Mebounou (2016), Sharma and Rastogi (2020) and Rastogi et al. (2021) and seems appropriate for the case of Vietnam. The Vietnam stock market has been characterized by alack of information transparency, high leverage of index futures trading and domination by individual speculative traders. Therefore, spot market returns are very sensitive to changes in futures trading volume, which is used as a market signal. Moreover, the results derived from the error correction model (ECM) indicate that only 5.54% of the disequilibria from the previous trading day are converged and corrected back to long-run equilibrium in the current day. This indicates that the adjustment speed is slow to return to long-run equilibrium after a short run shock.
It is important to stress that the positive effect of index trading volume on the SMV can be caused by the high leverage of index futures trading and the large number of individual speculative traders in the Vietnam stock market. Therefore, in order to stabilize the underlying stock market, it is recommended that market regulators reduce the level of leverage for index futures trading. In addition, the government should implement policies to attract more large institutional investors, both domestic and foreign, to the market.
Although this study has enriched our understanding of the effects of index trading volume on SMV in a frontier stock market, it still has limitations that should be addressed in future empirical research. The first limitation is the assumption that index trading volume has a symmetrical effect on SMV. The effect of index trading volume on SMV could possibly be asymmetrical. In addition, due to limitations of the data, we only investigated the effects of total futures trading volume on the SMV. It seems that active buying volume and active selling volume may influence on SMV in different ways. Specifically, we expect that active buying volume reduces SMV while active selling volume increases SMV. These limitations await further research.
Author Contributions
Conceptualization, L.D.T. and H.S.F.; methodology, L.D.T. and A.T.K.N.; software, L.D.T. and A.T.K.N.; validation, L.D.T.; formal analysis, L.D.T. and H.S.F.; investigation, L.D.T.; resources, A.T.K.N.; data curation, L.D.T. and A.T.K.N.; writing—original draft preparation, L.D.T. and H.S.F.; writing—review and editing, H.S.F., L.D.T. and A.T.K.N.; visualization, L.D.T. and H.S.F.; project administration, L.D.T. All authors have read and agreed to the published version of the manuscript.
Funding
This research received no external funding.
Data Availability Statement
The data that support the findings of this research are available from the corresponding author upon request.
Conflicts of Interest
The authors declare no conflict of interest.
Appendix A. Results of Diagnostic Tests
| Diagnostic Test | Statistics | p-Value | Conclusions |
| Autocorrelation (Breusch–Godfrey test) H0: No serial correlation | 1.22 | 0.294 | Fail to reject H0 |
| Heteroskedasticity (ARCH test) H0: No ARCH effects | 20.10 | 0.000 | Reject H0 |
References
- Ando, Ai, and William J. Scheela. 2005. The development of the stock market in Vietnam: An institutional perspective. Journal of Asian Business 21: 53–63. [Google Scholar]
- Antonakakis, Nicolaos, Christos Floros, and Renatas Kizys. 2016. Dynamic spillover effects in futures markets: UK and US evidence. International Review of Financial Analysis 48: 406–18. [Google Scholar] [CrossRef]
- Apostolakis, George N., Christos Floros, Konstantinos Gkillas, and Mark Wohar. 2021. Political uncertainty, COVID-19 pandemic and stock market volatility transmission. Journal of International Financial Markets, Institutions and Money 74: 101383. [Google Scholar] [CrossRef]
- Ausloos, Marcel, Yining Zhang, and Gurjeet Dhesi. 2020. Stock index futures trading impact on spot price volatility. The CSI 300 studied with a TGARCH model. Expert Systems with Applications 160: 113688. [Google Scholar] [CrossRef]
- Bae, SungC., Taek Ho Kwon, and Jong Won Park. 2004. Futures trading, spot market volatility, and market efficiency: The case of the Korean index futures markets. Journal of Futures Markets 24: 1195–228. [Google Scholar] [CrossRef]
- Bahmani-Oskooee, Mohsen, and Abera Gelan. 2018. Exchange-rate volatility and international trade performance: Evidence from 12 African countries. Economic Analysis and Policy 58: 14–21. [Google Scholar] [CrossRef]
- Bessembinder, Hendrik, and Paul J. Seguin. 1992. Futures trading activity and stock price volatility. The Journal of Finance 47: 2015–34. [Google Scholar] [CrossRef]
- Board, John, Gleb Sandmann, and Charles Sutcliffe. 2001. The effect of futures market volume on spot market volatility. Journal of Business Finance and Accounting 28: 799–820. [Google Scholar] [CrossRef]
- Bohl, Martin T., Jeanne Diesteldorf, and Pierre L. Siklos. 2015. The effect of index futures trading on volatility: Three markets for Chinese stocks. China Economic Review 34: 207–24. [Google Scholar] [CrossRef]
- Bohl, Martin T., Jeanne Diesteldorf, Christian A. Salm, and Bernd Wilfling. 2016. Spot market volatility and futures trading: The pitfalls of using a dummy variable approach. Journal of Futures Markets 36: 30–45. [Google Scholar] [CrossRef]
- Brown, Robert L., James Durbin, and James M. Evans. 1975. Techniques for testing the constancy of regression relationships over time. Journal of the Royal Statistical Society 37: 149–92. [Google Scholar] [CrossRef]
- Brown-Hruska, Sharon, and Gregory Kuserk. 1995. Volatility, volume and the notion of balance in the S&P 500 cash and futures markets. Journal of Futures Markets 15: 677–89. [Google Scholar] [CrossRef]
- Chen, Haiqiang, Qian Han, Yingxing Li, and Kai Wu. 2013. Does index futures trading reduce volatility in the Chinese stock market? A panel data evaluation approach. Journal of Futures Markets 33: 1167–90. [Google Scholar] [CrossRef]
- Darrat, Ali F., and Shafiqur Rahman. 1995. Has futures trading activity caused stock price volatility? Journal of Futures Markets 15: 537–57. [Google Scholar] [CrossRef]
- Dungore, Parizad Phiroze, and Sarosh Hosi Patel. 2021. Analysis of volatility volume and open interest for Nifty Index futures using GARCH analysis and VAR model. International Journal of Financial Studies 9: 7. [Google Scholar] [CrossRef]
- Edwards, Tim, and C. J. Lazzara. 2016. Realized volatility indices: Measuring market risk. In Research: S&P Dow Jones Indices. New York: McGraw Hill Financial. Available online: https://www.spglobal.com/spdji/en/documents/research/research-realized-volatility-indices-measuring-market-risk.pdf?force_download=true (accessed on 19 August 2022).
- Guan, Xueling, Min Zhou, and Ming Zhang. 2015. Using the ARDL-ECM approach to explore the nexus among urbanization, energy consumption, and economic growth in Jiangsu Province, China. Emerging Markets Finance and Trade 51: 391–99. [Google Scholar] [CrossRef]
- Gulen, Huseyin, and Stewart Mayhew. 2000. Stock index futures trading and volatility in international equity markets. Journal of Futures Markets 20: 661–85. [Google Scholar] [CrossRef]
- Günay, Samet, and Mahfuzul Haque. 2015. The effect of futures trading on spot market volatility: Evidence from Turkish Derivative Exchange. International Journal of Business and Emerging Markets 7: 265–85. [Google Scholar] [CrossRef]
- Hunegnaw, Fetene Bogale, and Soyoung Kim. 2017. Foreign exchange rate and trade balance dynamics in East African countries. The Journal of International Trade & Economic Development 26: 979–99. [Google Scholar] [CrossRef]
- Illueca, Manuel, and Juan Angel Lafuente. 2003. The effect of spot and futures trading on stock index volatility: A non-parametric approach. Journal of Futures Markets 23: 841–58. [Google Scholar] [CrossRef]
- Jain, Anshul, Pratap Chandra Biswal, and Sajal Ghosh. 2016. Volatility–volume causality across single stock spot–futures markets in India. Applied Economics 48: 3228–43. [Google Scholar] [CrossRef]
- Kao, Yu-Sheng, Hwei-Lin Chuang, and Yu-Cheng Ku. 2019. The empirical linkages among market returns, return volatility, and trading volume: Evidence from the S&P 500 VIX Futures. The North American Journal of Economics and Finance 54: 100871. [Google Scholar] [CrossRef]
- Nguyen, Anh Thi Kim, and Loc Dong Truong. 2020. The impact of index futures introduction on spot market returns and trading volume: Evidence from Ho Chi Minh Stock Exchange. Journal of Asian Finance, Economics and Business 7: 51–59. [Google Scholar] [CrossRef]
- Pesaran, M. Hashem, Yongcheol Shin, and Richard J. Smith. 2001. Bounds testing approaches to the analysis of level relationships. Journal of Applied Econometrics 16: 289–326. [Google Scholar] [CrossRef]
- Pok, Wee Ching, and Sunil Poshakwale. 2004. The impact of the introduction of futures contracts on the spot market volatility: The case of Kuala Lumpur Stock Exchange. Applied Financial Economics 14: 143–54. [Google Scholar] [CrossRef]
- Rastogi, Shailesh, and Chaitaly Athaley. 2019. Volatility integration in spot, futures and options markets: A regulatory perspective. Journal of Risk and Financial Management 12: 98. [Google Scholar] [CrossRef]
- Rastogi, Shailesh, Vikas Tripathi, and Sunaina Kuknor. 2021. Informational role of futures volume for spot volatility. Pacific Accounting Review 34: 49–69. [Google Scholar] [CrossRef]
- Sharma, Arpita, and Shailesh Rastogi. 2020. Spot volatility prediction by futures and option: A Indian scenario. International Journal of Modern Agriculture 9: 263–68. [Google Scholar] [CrossRef]
- Smit, E. vd M., and H. Nienaber. 1997. Futures-trading activity and share price volatility in South Africa. Investment Analysts Journal 26: 51–59. [Google Scholar] [CrossRef]
- Truong, Loc Dong, Anh Thi Kim Nguyen, and Dut Van Vo. 2021. Index future trading and spot market volatility in frontier markets: Evidence from Ho Chi Minh Stock Exchange. Asia-Pacific Financial Markets 28: 353–66. [Google Scholar] [CrossRef]
- Truong, Loc Dong, Ha Hoang Ngoc Le, and Dut Van Vo. 2022. The asymmetric effects of exchange rate volatility on international trade in a transition economy: The case of Vietnam. Bulletin of Monetary Economics and Banking 25: 203–14. [Google Scholar] [CrossRef]
- Xie, Shiqing, and Jiajun Huang. 2014. The impact of index futures on spot market volatility in China. Emerging Markets Finance and Trade 50: 167–77. [Google Scholar] [CrossRef]
- Yiheyis, Zelealem, and Jacob Musila. 2018. The dynamics of inflation, exchange rates and the trade balance in a small economy: The case of Uganda. International Journal of Development Issues 17: 246–64. [Google Scholar] [CrossRef]
- Yilgor, Ayse Gul, and Claurinde Lidvine Charbelle Mebounou. 2016. The effect of futures contracts on the stock market volatility: An application on Istanbul stock exchange. Journal of Business, Economics and Finance 5: 307–17. [Google Scholar] [CrossRef]


Publisher’s Note: MDPI stays neutral with regard to jurisdictional claims in published maps and institutional affiliations. |
© 2022 by the authors. Licensee MDPI, Basel, Switzerland. This article is an open access article distributed under the terms and conditions of the Creative Commons Attribution (CC BY) license (https://creativecommons.org/licenses/by/4.0/).