Article

Factors of Risk Analysis for IoT Systems

by
Roberto Andrade
1,
Iván Ortiz-Garcés
2,*,
Xavier Tintin
1 and
Gabriel Llumiquinga
2
1
Facultad de Ingeniería en Sistemas, Escuela Politécnica Nacional, Quito 170525, Ecuador
2
Escuela de Ingeniería en Tecnologías de la Información, Facultad de Ingeniería y Ciencias Aplicadas, Universidad de Las Américas, Quito 170125, Ecuador
*
Author to whom correspondence should be addressed.
Risks 2022, 10(8), 162; https://doi.org/10.3390/risks10080162
Submission received: 1 May 2022 / Revised: 6 July 2022 / Accepted: 15 July 2022 / Published: 10 August 2022

Abstract

:
The increasing rate at which IoT technologies are being developed has enabled smarter and innovative solutions in the sectors of health, energy, transportation, etc. Unfortunately, some inherent characteristics of these technologies are compromised to attack. Naturally, risk analysis emerges, as it is one of many steps to provide a reliable security strategy. However, the methodologies of any risk analysis must first adapt to the dynamics of the IoT system. This article seeks to shed light on whatever factors are part of an IoT system and thus contribute to security risks, IoT device vulnerabilities, susceptibility due to the application domain, attack surfaces, and interdependence as a product of the interconnection between IoT devices. Consequently, the importance of these factors in any risk evaluation is highlighted, especially the interdependence generated by IoT systems, which can cause the generation of an uncontrollable cascade of effects that can occur under certain conditions of any systematic risk event.

1. Introduction

Security attacks have seen significant growth in recent years, generating considerable economic impacts for a variety of organizations. For example, in December 2021, Bitmart, a cryptocurrency trading platform, suffered a security breach, losing nearly USD 150 million in stolen tokens (BBC 2022). In a similar case, carried out in June 2021, gas pipelines in the United States suffered a ransomware attack, forcing the Colonial Pipeline to pay USD 5 million to retrieve its operations (New York Times 2022). A study developed by NetDiligence (NetDiligence 2022) set out the economic costs generated by security incidents; according to this study, the top five security incidents are the following: bank transfer found, erroneous data collection, system failure, hackers, and malware/virus. The costs associated with these security incidents for that study are shown in Table 1.
These costs could be relatively small for many organizations. However, a relevant aspect of a security attack is, nonetheless, the level of impact an idiosyncratic (single) cyber incident could have due to its capacity to propagate through networks, causing unprecedented ripple effects on economic systems. In this sense, the risk due to cyber attacks is considered a source of systemic risk (Kaffenberger and Kopp 2022). According to the World Economic Forum (WEF), a systemic cyber risk is the “risk that a cyber event (attack(s) or other adverse event(s)) on an individual component of a critical infrastructure ecosystem will cause significant delay, denial, disruption, interruption or loss, such that services are affected not only in the originating component, but the consequences also cascade to related ecosystem components (logically and/or geographically), resulting in significant adverse effects to public health or safety, economic security, or national security” (World Economic Forum 2016).
The WEF defines a systemic scenario as one in which the volume of successful cyber attack events achieves the umbral to disrupt financial operations. The WEF defines three levels (World Economic Forum 2022):
  • Level 1: The pervasiveness of technology could penetrate a high number of organizations simultaneously;
  • Level 2: Interdependencies between organizations are growing, and cybersecurity failure in one organization has the potential to cascade across its dependent organizations;
  • Level 3: Cybersecurity failure could be systematically catastrophic to economies and societies, and multiple heterogeneous sectors could fail.
Two factors that contribute to the scale and intensity of cyberattacks are: (i) speed of spread: a cyber attack event has the potential to be effective and spread throughout all or part of an information or operational system, faster than other types of risk; (ii) scale of spread: a major cyber attack event could have a broader impact and is not limited to geographic boundaries. The high severity of loss could be extended to several organizations facing systemic cyber events; these events have the capacity to reduce the operations of an organization or entire cities. In Figure 1, we show the scale and intensity of different cyber incidents based on the study extracted from the World Economic Forum (WEF 2022).
The World Economic Forum defines 11 systemic cyber attack patterns related to cyber risk incidents (European Systemic Risk Board 2022):
  • Repeated attacks;
  • Scattershot attacks;
  • Pervasive attacks;
  • Rolling attacks;
  • Transitive attacks;
  • Cascading attacks;
  • Shared resource consumption attacks;
  • Critical function attacks;
  • Regional attacks;
  • Service dependency attacks;
  • Coordinated supply chain attacks.
According to the International Monetary Fund (IMF), certain conditions must be present so that these attack patterns can be developed (International Monetary Fund 2022):
  • Risk concentration and lack of substitutability: Systemic risk arises from technical and IT systems, such as operating systems, program applications, cloud servers, and network equipment. These systems could be single points of failure, affecting the normal operations of organizations and generating financial/economic losses;
  • Complex interdependency: Interconnections among systems increase the level of complexity, allowing cyber attacks to spread throughout a system. Impacts on one part of the system may affect another; for example, attacks on a central financial system are through indirect interconnections in remote areas. The accumulation of local volatility added to systemic risks is derived from the other networks;
  • Risk correlation: Idiosyncratic cyber shocks can cause a loss of confidence that generates market liquidity shocks, market risk, and solvency risk.
Additionality, a cyber event could grow into a systemic event that generates a significant impact on the economy due to the following three factors (McKinsey 2022):
  • Small or idiosyncratic cyber events that, due to linkages and dependencies among affected organizations, generate cascade effects;
  • Timing affects the response to events that, due to the resources of the organization, allow the mitigation of financial losses and control the damage to reputation;
  • Focus on critical functions, increasing the impact related to the loss or disruption.
Based on these possible conditions that allow the generation of a systemic risk, interdependence is a factor of interest. Our motive is based on the fact that, in the context of the digital transformation that has been experienced in different verticals, such as health, education, and transportation, among others, the interconnection between heterogeneous networks and organizations has allowed the development of efficient electronic services. Within the process of digital transformation, the incorporation of technologies such as IoT has allowed the abstraction of the physical world to the digital world, generating data that allow the improvement of decision-making processes. IoT has strengthened digital transformation processes, and its operation is based on the interconnection and interdependence of elements that were not previously connected to the Internet. However, under the previously exposed context, interdependence could allow the possibility of generating a systemic risk event. From this arises our research question: How could IoT contribute to the generation of security risk events? In particular, could the interdependence generated by IoT in the connection of physical elements be considered an enabling factor for a higher security risk?
To address this question, security risk modeling in IoT systems is proposed to evaluate the contribution of interdependence in IoT systems to the final value of risk. Therefore, this manuscript is structured as follows: Section 2 addresses the concepts related to risk modeling. Section 3 establishes the proposal of IoT factors that can be considered in risk modeling. Section 4 establishes the risk assessment process in IoT systems. Finally, Section 5 presents a discussion on interdependency and its consideration within risk models.

2. Background

2.1. Risk Analysis in IoT

IoT systems present characteristics that trigger the adaption of risk analysis methodologies used in traditional IT systems. Nurse et al. (2017) mention four aspects that must be considered by the risk analysis methodologies for applied risks in IoT:
  • Shortcomings of period assessment;
  • Changing of system boundaries;
  • Failure to consider assets as an attack platform;
  • The challenge of understanding connections.
In this context, various proposals have come to adopt IoT risk methodologies. To understand these proposals in more detail, we have made a literary revision of the following scientific bases: Scopus, ACM, IEEE Xplorer, Science Direct, and Springer, in function of the following key words:
  • “Risk assessment AND IoT”;
  • “Risk Security AND IoT”;
  • “Risk analysis AND IoT”.
Based on the literature review we can emphasize the following comments: Matheu-García et al. (2019) present a security assessment based on the identification of goods according to ISO standards, STRIDE, and a control evaluation based on NIST. In a similar way, Rak et al. (2018) refer to the same identification process, but this time, they define IoT assets not only as devices, but as gateways, networks, IoT devices, and services as well. In the same focus of categorizing IoT assets, Randaliev et al. (2018) propose the following categorization:
  • IoT core value assets (IoTCA) where digital assets are categorized as (1a) IoT digitized assets (IoTDA) and services are digitized from traditional services, or (1b), in which IoT assets are born digital, representing things and services that are intrinsically digital;
  • IoT operational assets (IoTOA), representing assets that support the creation, consumption, and distribution of services.
Additionally, Randaliev evaluates the risk value using MicroMort (MM) and Value-at-Risk (VaR).
Thibaud et al. (2018) take into consideration that, to undertake a risk evaluation, vulnerability and IoT threat mappings are factors to be considered and categorized as the following: IoT device 1–vulnerability 1–threat type 1; IoT device 1–vulnerability 2–threat type 2; and IoT device 2–vulnerability 1–threat type 2. Lee proposes two dimensions to evaluate the risk; the first one is related to the frequency of attacks of each IoT asset–vulnerability–threat, and the other dimension is the expected financial loss per attack. Shivraj et al. (Lee 2020) mention that not only are security risks important, but privacy risks are as well, followed by the proposition of the use of the LINDDUN method. According to Shivraj, this method reduces the limitation of existing risk assessments based on STRIDE/DREAD to address privacy risks.
Huang and Sun (2018) propose an AHP-based risk assessment based on analyzing security risk function (confidentiality, integrity, availability) followed by the analysis of a set of attacks, such as DoS, Sybil attacks, and key cracking. Afterwards, the traffic, CPU, memory, and IoT device port impact are evaluated.
Park et al. (2019) propose a risk evaluation based on threat analysis as a cause of vulnerability and impact, for which they also define threats such as Threat Event Frequency (TEF) for IoT devices in relation to the device’s contact valorization and the action performed against it. In relation to the vulnerabilities (VUL) of IoT devices, VUL is measured as a combination of threat capability (TCap) and control strength (CS), and indicates the difficulty of successful attacks based on the common vulnerability scoring system (CVSS).
Kieras et al. (2021) is focused on the major details of IoT devices, and for the risk evaluation he defines four related components that are: security attributes, dependencies, security logical functions, and security risks. Their analysis is based on the graph’s concepts.
These proposals, in almost their entirety, focus on a risk analysis based on goods, considering threats and vulnerabilities as factors to establish risk values. It is important to highlight Randaliev’s, Thibaud’s and Shivraj’s proposals, for they add methods that establish an additional quantitative value of risk analysis, and represent the economic loss value due to security risks. In Table 2, an IoT security risk summary is presented.

2.2. Risk Modeling

Risk models are the mathematical representations of future states in terms of risk factors and the projection of loss events. Risk factor is a general term denoting a particular attribute, characteristic, variable, or other determinant element that influences the risk profile of a system, entity, or organization. The identification of risk factors is an essential aspect of formal risk management, and the following aspects should be considered (Bank of England 2022):
  • Identifying the association degree of risk factors with specific data;
  • Understanding that risk factors change over time;
  • Identifying the association of risk factors with single or multiple systems.
On the other hand, the projection of loss events does not always have enough data for efficient estimation, and the use of simulation techniques may be needed. One of the techniques to be used is stress testing. Stress testing is a set of actual or hypothetical tests to probe a system’s behavior and its response under extreme, unusual conditions. Stress testing involves the following elements (Bank of England 2022):
  • The risk factors;
  • The stress scenario which prescribes a range of scenarios related with the risk factors;
  • The monitored outcomes which represent subsequent actions and recommendations.
In designing risk assessment methodologies, the two approaches that can be addressed are: assets and goals. Risk methodologies are widely used in the field of computer science, such as MAGERIT, which is based on the assessment of assets, and its process consists of identifying critical assets for the continuity of an organization’s operations (García and Moreta 2018). MAGERIT also evaluates complementary assets that are used by critical assets to operate or have connectivity, such as switches or routers. In this sense, this methodology presents strengths such as having an inventory of critical assets that could be affected by a security attack; another relevant aspect of MAGERIT is that it considers the relationships between assets to evaluate the possible value of an impact in case of an attack. However, the methodology also presents weaknesses; without historical information such as the type of attack or the correct identification of assets, the risk estimation value can vary significantly. Another aspect is that the process of identifying critical assets can require a great deal of effort and time. At this point, let us assume that the target of the attack is not the critical assets: the target of attack is for those assets that are supplementary, and given that the work focuses on the inventory process of critical assets, we could lose the general vision (situation awareness) of how a possible attack on these assets could affect the operations of organizations. In this proposed scenario we can consider the IoT devices which are not considered critical assets, such as a database or a frontend server, where their contributions are more focused on the process of obtaining data and generating an intelligent feedback process for the execution of a specific action. However, the affectation of a security attack could generate a considerable impact. One of the reasons that drives the importance of security in IoT devices is that a connection between humans and IT or OT systems has been created. Today, it is common to find the inclusion of IoT systems in different domains such as health, education, agriculture, transportation, energy, among others, and to have devices that were traditionally isolated that are now connected to the Internet. For example, from the smart home perspective, light bulbs, refrigerators, stoves, and most domestic electronic devices, now have Internet connection and can be controlled remotely.
Under this premise, an attack on IoT devices could have an impact just as relevant as attacks on critical assets. If we consider this premise as true, a possible strategy would be to include these devices in the MAGERIT asset survey process. The problem arises when analyzing the number of IoT devices, for this has considerably grown in recent years, with projections for continuous growth rates for the future years to come. Reports from Cisco, Gartner, and Forbes estimate that the number of IoT devices in several verticals will exceed 50 billion by 2030 (Al-Sarawi et al. 2020). Organizations include new IoT devices in order to drive the digital transformation of their processes, and in some cases, the number of devices or their interrelationships can change within just a couple of days. For example, a hospital may consider implementing smart light bulbs as a strategy to optimize energy resource consumption, setting up a plan to perform this implementation across the floors of its building while changing its connectivity topology between devices continuously. Even if the implementation process is completed, the hospital could consider integrating smart light bulbs with voice assistance systems, changing the entire topology once again.
At this point, we can see some possible limitations of the asset-based approach used by MAGERIT, prompting some adaptations of the methodology for this new security model generated by IoT systems.

3. Risk Modeling in IoT Systems

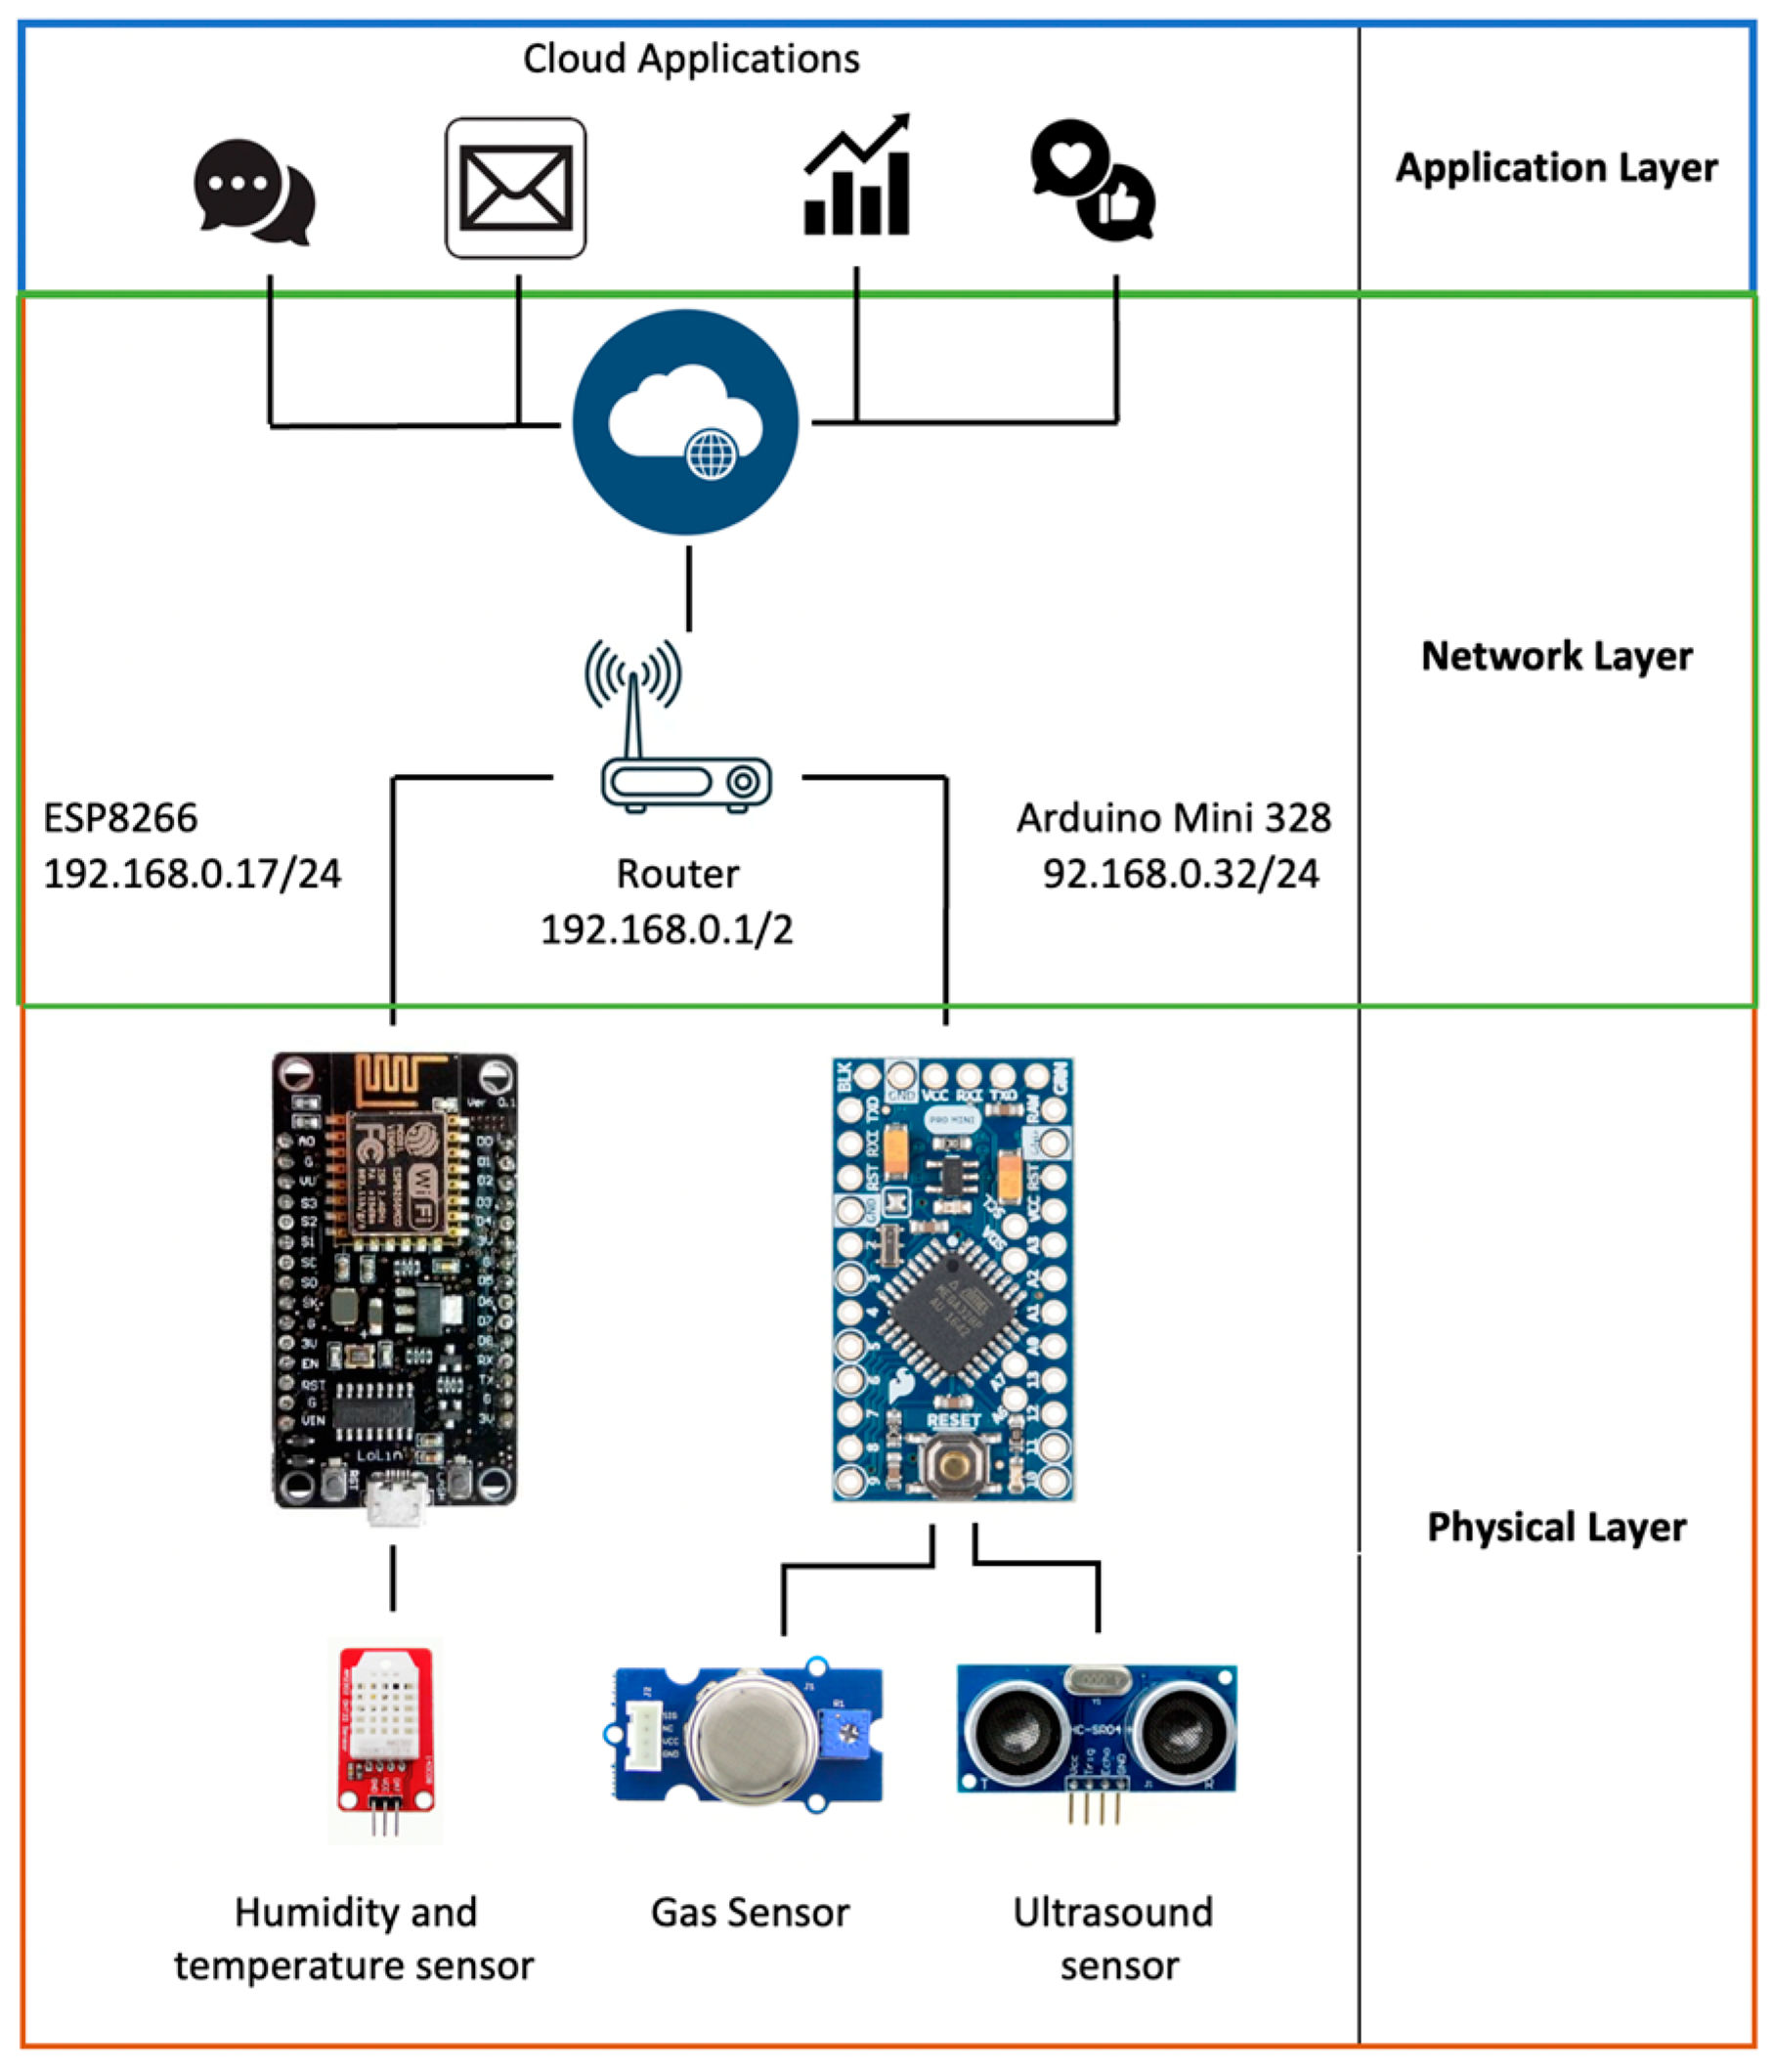
IoT systems have shown great growth due to their contribution to the development of smart solutions (Al-Sarawi et al. 2020). IoT systems are based on a multi-layer architecture with different technologies, protocols and devices converging. One of the architectures is defined by the following layers: perception, network, and application (see Figure 2). Each of these layers could be attacked; we display some attacks for each layer of the IoT architecture in Table 3.
A relevant feature of cyber attacks on IoT systems is that since they are a set of interconnected nodes, the attacks could have the ability to impact other neighboring nodes, and if the level of propagation of the infection reaches a considerable number of nodes, they could significantly reduce the operational capacity of the entire IoT system. Additionally, if we consider that infected IoT systems are connected to other IoT systems, the probability of the infection spreading to these other IoT systems in a cascading effect increases. Furthermore, we must take into consideration that the IoT system may be connected to IT and OT systems that are responsible for the provision of life management services, such as health, energy, transportation, waste management, and water distribution. The infection could generate an impact at economic, social, and environmental levels. Therefore, if this infection comes to affect these IT and OT systems that are part of these critical infrastructures in a considerable way, we could experience a systemic risk. Based on the context above, the research question directing the present work is: Do cyber attacks directed to IoT nodes have the capacity to generate a systemic risk?
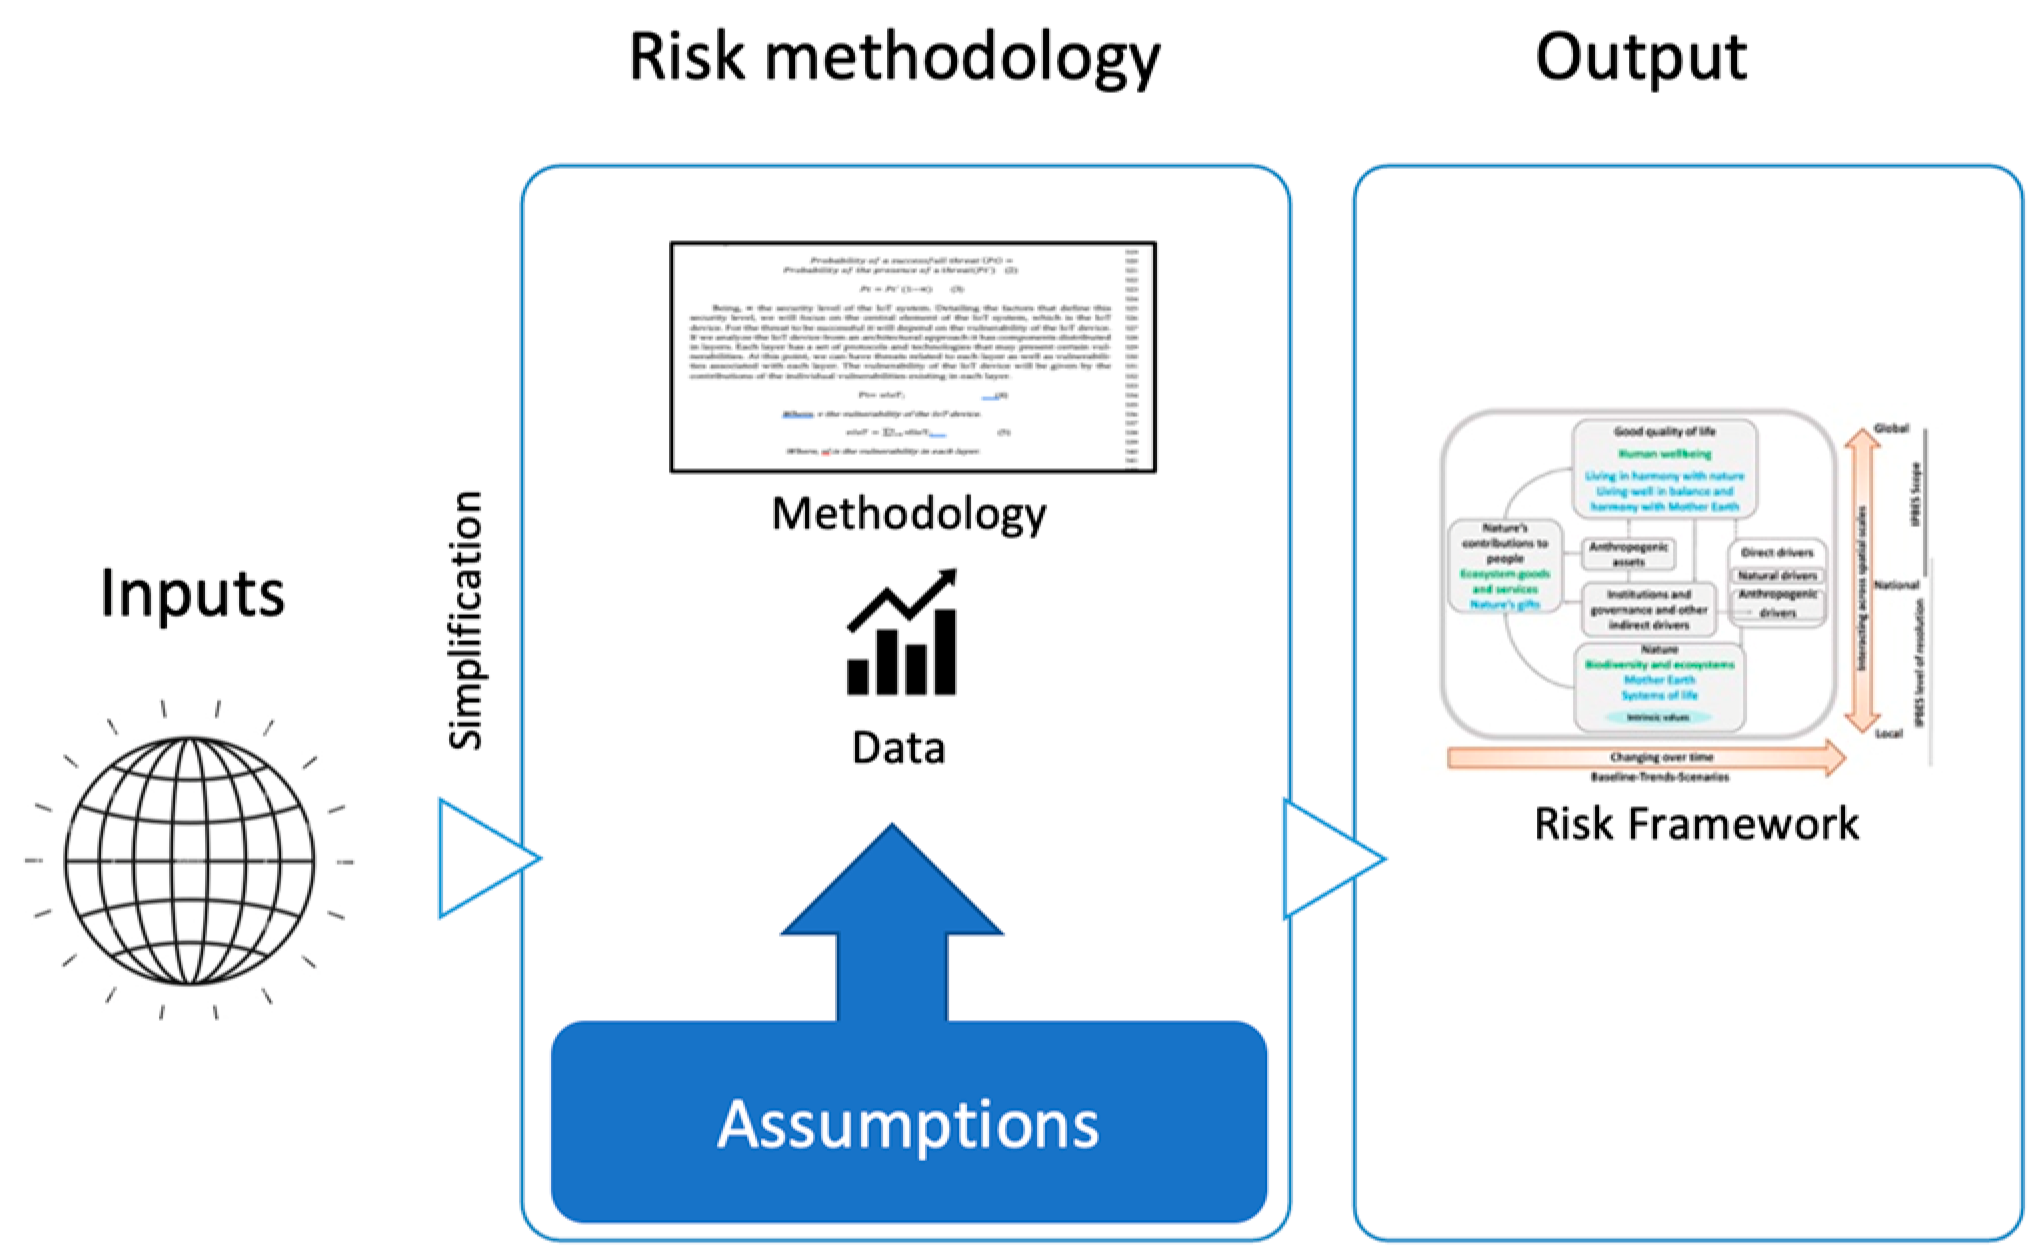
To address this question, we can abstract cyber attacks by means of a model in which the inputs are risk factors and the outputs are acceptable levels of risk, and relate this to the risk methodology shown in Figure 3.
The proposals that we have considered of most relevance in this study are based on the presence of risk analysis methodologies for IoT systems and the detailed parameters, elements or factors that are considered in the process of risk analysis. Each proposal has an approach to evaluate risk factors, and it would be interesting to group the apported fundaments in each approach with a visualization to a future standardization. Additionally, some of the analyzed proposals do not indicate the orogen of the selected parameters or factors. In this context, in a previous work, “Security Risk Analysis in IoT Systems through Factor Identification over IoT Devices” (Andrade et al. 2022), an analysis of proposed risk factors was planned to be executed in relation to various IoT risk methodologies and the inherent characteristics of IoT systems in order to understand how these factors contribute to the total risk value. This work also sought to analyze the interrelation between the proposed cyber risk factors and the possible impact to the economic, social, and environmental domains related to the organizations where the IoT solutions were used. It was possible to characterize related IoT security input elements into four macro categories given the results of the test: vulnerability, susceptibility, attack surface, and interdependency. They could also be characterized into three macro output categories: economic impact, social impact, and environmental impact.
Having established these macro categories, our investigation approach is based on the following research question: What is the mathematical model required to determine a quantitative value of the security risk of an IoT system based on these macro categories? The following steps are required in order to define the mathematical model:
  • Define the method to quantify the risk. In this study this is performed in relation to probability and impact, which are generic factors used in multiple risk analysis methodologies and ISO 27,000 standards;
  • Establish the input elements for the risk analysis in relation to the probability and impact. In this study, this is the macro categories (vulnerability, susceptibility, attack surface, interdependency);
  • Establish the output elements for the risk analysis in relation to the probability and impact. In this study, this is the base of the economic impact, social impact, and environmental impact;
  • Define the methodology to quantify the values in function of the interrelation between the macro categories. We establish a set of simulations to determine a distribution function in relationship to the inputs and outputs of the risk analysis;
  • Based on the distribution function, we select a model to quantify the risk value from an economic perspective. We select an economic perspective in relation to the systematic risk possibility mentioned by the global economic forum and the contents of this study;
  • We define a risk scale to determine the level of impact on the IoT attacks in relation to the possibility of a systematic risk event. The scale will monitor subsequent risk values.

3.1. Input Elements

To address the input elements, we propose the following question related to risk factors: What are the risk factors that allow the possibility for a systemic risk?
Risk factors, also called risk-driven factors, denote an attribute, variable, or characteristic which influences the risk profile of an entity system. Risk factors may cause the risk or be correlated with the risk. The following factors were considered:
  • Organization: The application domain for which the IoT system has been developed has certain inherent characteristics due to its functionality. Among the domains we have health, agriculture, education, and energy, among others. If we approach the analysis of an IoT solution applied for traffic management, its location will be in an external public area, which could imply an exposure to physical attacks, in contrast to an IoT solution used in smart homes. This is an aspect to be considered in security risk assessment processes. Additionally, in the organization we have the pillar related to technological infrastructure, economic infrastructure, social infrastructure, and governance, which may vary between organizations. Two factors related to organizations from a security perspective are:
    a.
    Vulnerability: The weakness in each layer of an IoT architecture, which is the possibility of suffering attacks;
    b.
    Susceptibility: IoT systems are made up of a set of protocols, technologies, and devices, so depending on this set, it is possible that one device is more susceptible to an attack than another.
  • Attack surface: The greater number of interconnected devices and systems increases the surface to be exploited by a given threat that is likely to generate an attack.
  • Interdependence: Interdependence between IoT, OT and IT systems can increase risk exposure as there is the possibility of an attack from external systems. How security attacks interact with more IoT elements can also modify the level of risk.
To understand how these factors are related and contribute to risk value, the following is a description of them in relation to risk. Starting from the concept of risk, as the probability of success of a given threat and its impact on the strategic objectives, we can use Equation (1).
R = P t I
where R is the risk value, Pt the probability of a threat, and I the probability of impact.
Analyzing the first component of risk, the probability of the success of a threat, in the context of IoT systems as well as computational systems, is the possibility of the presence of threats. The presence of a threat induces a certain value of security risk. However, whether this threat can generate an impact will depend on different factors such as the vulnerability of the attacked device that can be exploited by this threat, the security levels of the device and the entire IoT system, and the effectiveness of the tools and techniques used by the attacker. In other words, although the presence of the threat already generates a possible risk value, the probability of its success is based on the security levels of the IoT system, for this can give us a more accurate value. Thus, we initially propose the value of the probability of success of a threat as the probability of its presence in the IoT system, but the final value of the probability of success will be conditioned by the level of security of the system.
P r o b a b i l i t y   o f   a   s u c c e s s f u l l   t h r e a t   ( P t ) = P r o b a b i l i t y   o f   t h e   p r e s e n c e   o f   a   t h r e a t ( P t )
P t = P t   ( 1 δ )
where δ is the security level of the IoT system.
Detailing the factors that define this security level, we will focus on the central element of the IoT system, which is the IoT device. The threat depends on the vulnerability of the IoT device to be successful. If we analyze the IoT device from an architectural approach it has components distributed in layers. Each layer has a set of protocols and technologies that may present certain vulnerabilities. At this point, we can have threats related to each layer as well as vulnerabilities associated with each layer. The vulnerability of the IoT device will be given by the contributions of the individual vulnerabilities existing in each layer.
Pt = v I o T ;
where v is the vulnerability of the IoT device.
v I o T = l = 0 n vlIoT ;
where vl is the vulnerability in each layer.
An interesting aspect of IoT is its adaptability to be used in different verticals; we can find in the literature that is used to develop smart homes, smart health, smart grids, and smart cities, among others. This aspect of IoT could have an important implication from a security aspect, because an IoT device based on certain hardware and software used for agriculture could be modified and used for vehicle control. This adaptability is what has made IoT so popular, and devices such as Raspberry Pi and Arduinos have been widely used to develop smart concepts. However, it is worth asking, at this point, questions such as: Is the required level of security of a device different for an agricultural environment than for a vehicular control environment? Additionally, what is the factor that determines the level of security to be applied in a given vertical? Regarding these questions, two proposals are presented by CIS concerning the definition of a set of classes that represent a security value of the IoT device based on confidentiality, integrity, and availability. We present information on the different classes in Table 4. A second proposal is the one proposed by OWASP in the ASVS methodology for IoT systems in which the security level is established by levels L1, L2 and L3 according to the criticality of the vertical.
Additionally, in relation to the influence of the vertical, a component related to the susceptibility of the device to being attacked is where the IoT device is used. A device may also have certain vulnerabilities, for example, a physical vulnerability; thus, by not having a case that protects it, it is susceptible to an attacker connecting directly to a port JTAG. If the IoT device is used in a smart home, this vulnerability may not be very relevant, but if the device is in a smart traffic solution, in which the device is in a street, the vulnerability has a greater relevance. The susceptibility of the device will be influenced by the characteristics of the vertical where it is used.
Thus, the susceptibility of an IoT device could be affected by the characteristics of the vertical domain where the IoT solution is implemented, increasing the value of vulnerability of the IoT device by a factor β .
v I o T = β   v I o T ;
where vIoT represents the vulnerability value as a function of a Beta, and β represents the susceptibility value. vIoT’ is the vulnerability value without considering the susceptibility.
The Beta value is obtained as a function from the relationship of the domain and the specific vulnerability in each layer. For instance, Table 5 shows the selection of Beta for three scenarios. Another aspect related to the security level is the attack surface. The attack surface of a system is constituted by the elements that allow the possibility of an attack: input and output interfaces, data, methods and channels, and attacks. From the IoT device-based analysis approach, each IoT device is a possible entry point for an attack, and the more vulnerabilities such a device has, the higher the probability of a successful threat, so an increase in the number of IoT devices would increase the attack surface and the probability of the threat’s success.
A s = γ   n v I o T ;
where ɣ (gamma) represents the interdependencies between systems and nIoT represents the number of devices.
Entry points for attacks in the IoT context represent interdependencies with other IoT systems, as well as with IT and OT systems. The number of these dependencies modifies the attack surface. Gamma represents the number of connections between IoT devices. An important aspect in IoT security is the level of interdependency, which is due to high connectivity between IoT devices; this can allow cascade or dominance effects due to cyber attacks. Although most IoT solutions propose a centralized management solution through a gateway, these can also allow the establishment of authentication controls for the exchange of information. There is a tendency to implement gateway-less solutions to reduce energy consumption due to the exchange of control messages between the gateway and the IoT device (Pereira et al. 2018). Thus, Equation (8) intends to consider both scenarios. The value of n can be reduced if the gateway is used. Another alternative is that it can evaluate the impact due to increased connections in the gateway-less architecture.
γ = ( n 1 ) / n ;
where n is the number of IoT devices
The level of security of the IoT solution is related to the level of cybersecurity assurance of the IoT attack surface. This is so the objective has a small IoT attack surface or a more controlled IoT attack surface.
A s = γ   n ( β ( l = 0 n vlIoT ) ) ;
A s = ( n 1 ) n   n ( β ( l = 0 n vlIoT ) ) ;
When replacing in Equation (3) the value δ = 1 A s with the values for Equation (10), we have the following equation:
R = P t ( 1 1 ( n 1 ) n   n ( β ( l = 0 n vlIoT ) ) ) I
Analyzing the final proposed formula, reducing the number of IoT devices—although feasible through a process of resource optimization—may not always be practical. If more IoT devices are used it could improve the process of sensorization and, therefore, the data acquisition for the decision-making process. Thus, it would not be possible to reduce the number of links between devices under the same justification.
At this point, the two remaining factors would be the Beta value representing susceptibility and vIoT representing vulnerability. This last factor is more intrinsic to the IoT device and could be addressed by a hardening process. The susceptibility, which is more an extrinsic element of the device and depends mostly on the conditions of its environment, could be addressed by the implementation of a set of policies, and is controlled based on best practices related to each vertical domain. The process of hardening and best practice could be carried out based on security controls such as those proposed by the Center for Internet Security (CIS).

3.2. Output Elements

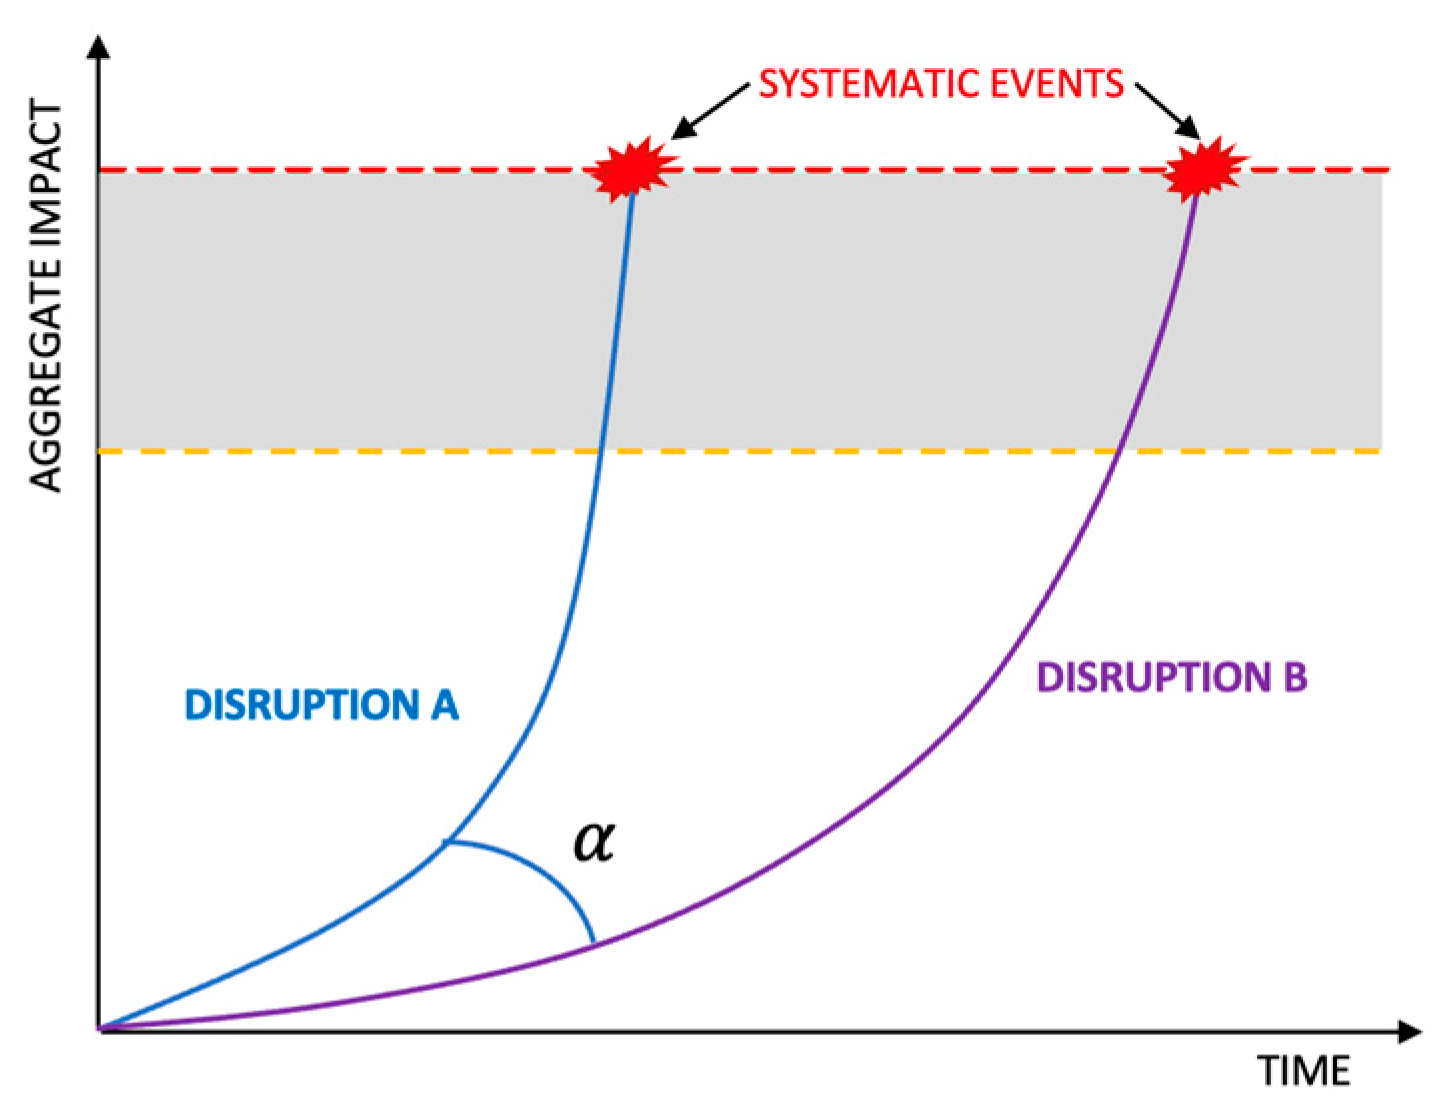
To address output elements, we propose the following questions: (i) What would be the indicators to assess systemic risk? (ii) What would be acceptable values of security risk before having a systemic-type condition? We take as a basis what was presented by the Bank of England in July of 2018 regarding systemic risk thresholds. In Figure 4, graph A shows the impact tolerance threshold as a function of aggregate impact as a function of time. The threshold includes a systemic buffer capacity. The second shows that depending on an incident response in the response phase, the shock could be absorbed within the threshold. Finally, graph C shows that if the event exceeds the established tolerance threshold, a systemic event resulting from a disruption will occur and a second disruption B may occur in time.
Returning from our first risk equation, we have the modified equation in which we have included the security level.
R = P t ( 1 δ ) I
Focusing on the second component of the equation, the impact, although a threat can generate a level of impact on the IoT device or system, what we are interested in evaluating is the impact on the strategic objectives of the organization. For example, an IoT system is used to develop smart health to improve effectiveness in the processes of measuring the physical conditions of patients, so the impact could be associated with the theft of sensitive patient information, with the manipulation of medical information, or with the unavailability of patient data. If the IoT system is used to develop smart traffic, the impact could be reflected in the unavailability of signaling, which can produce traffic jams and generate an economic impact related to the monetary loss of people who cannot get to their jobs, or have a negative social impact due to the stress generated in drivers. In this context, we establish that the impact must be evaluated in strategic axes such as economic, social, and environmental, as is shown in Table 6.
Economic, social, and environmental impact has been of great interest in the research field given its relevance. In this work, the scope is to focus on the economic domain given its importance in the security budget management processes. The budget factor is important to improve strategies for the development of an acceptable security level for IoT systems. For this, it is necessary to establish some controls and best practices that directly or indirectly require a monetary value for implementation.
To predict the future level of some key economic variables, some economic models can be used. These models identify the relation between one set of economic variables (independent variables) and variables of interest for tactical decision-making (dependent variable). For instance, the impact on inflation given information about changing GDP and unemployment levels must be considered. In the case of cybersecurity, some research has contributed to the evaluation of economic impact through of the use of VaR to estimate possible losses. Others researchers take into consideration an expected loss called conditional value at risk (CVaR), instead of VaR, for they consider that this information allows a more accurate estimation of losses.
Economic impact assessment starts from the need to consider the value of assets. Here, there is an important issue to be considered for correctly determining assets. An alternative method would be to consider IoT devices as critical assets, but really they are a component of the proposed smart solution. To exemplify our proposition we will analyze a smart parking solution, considering a smart parking lot that receives a total of 100 cars per hour, with a billing value of USD 10 per hour. If, due to security attacks, the system remains inoperative for three hours, there will be certain losses. When considering the critical assets for loss assessment, the asset would be the smart parking while the IoT devices would be components of the solution, but not the main asset. One aspect of certain IoT solutions is that the IoT devices used can have values that range from 60 to 100 dollars, so their replacement would not have a high economic impact. This economic aspect of IoT devices is just one of the factors that has enabled the huge growth and inclusion of IoT devices in various applications. In this case, the value of loss (impact) will be given by the threat’s probability of occurrence for the estimated value of loss in dollars for the organization, thus, not for IoT devices. We define lower and upper values of monetary loss and define a probability of loss in this range. Additionality, we establish a probability value where these losses could occur. For example, the probability of occurrence of a DoS attack is 20% and the probability of having losses between USD 25,000 and USD 50,000 is 90%. We calculate the value Vr that corresponds to economic loss.
I = P t V r
where I is the impact and Vr represents the possible loss in terms of currency.
In this case, Vr would be obtained by the means of the CVAR application. It is through the CVAR application that we can define a threat portfolio capable of obtaining monetary losses for every single one of the present threats.

3.3. Methodology

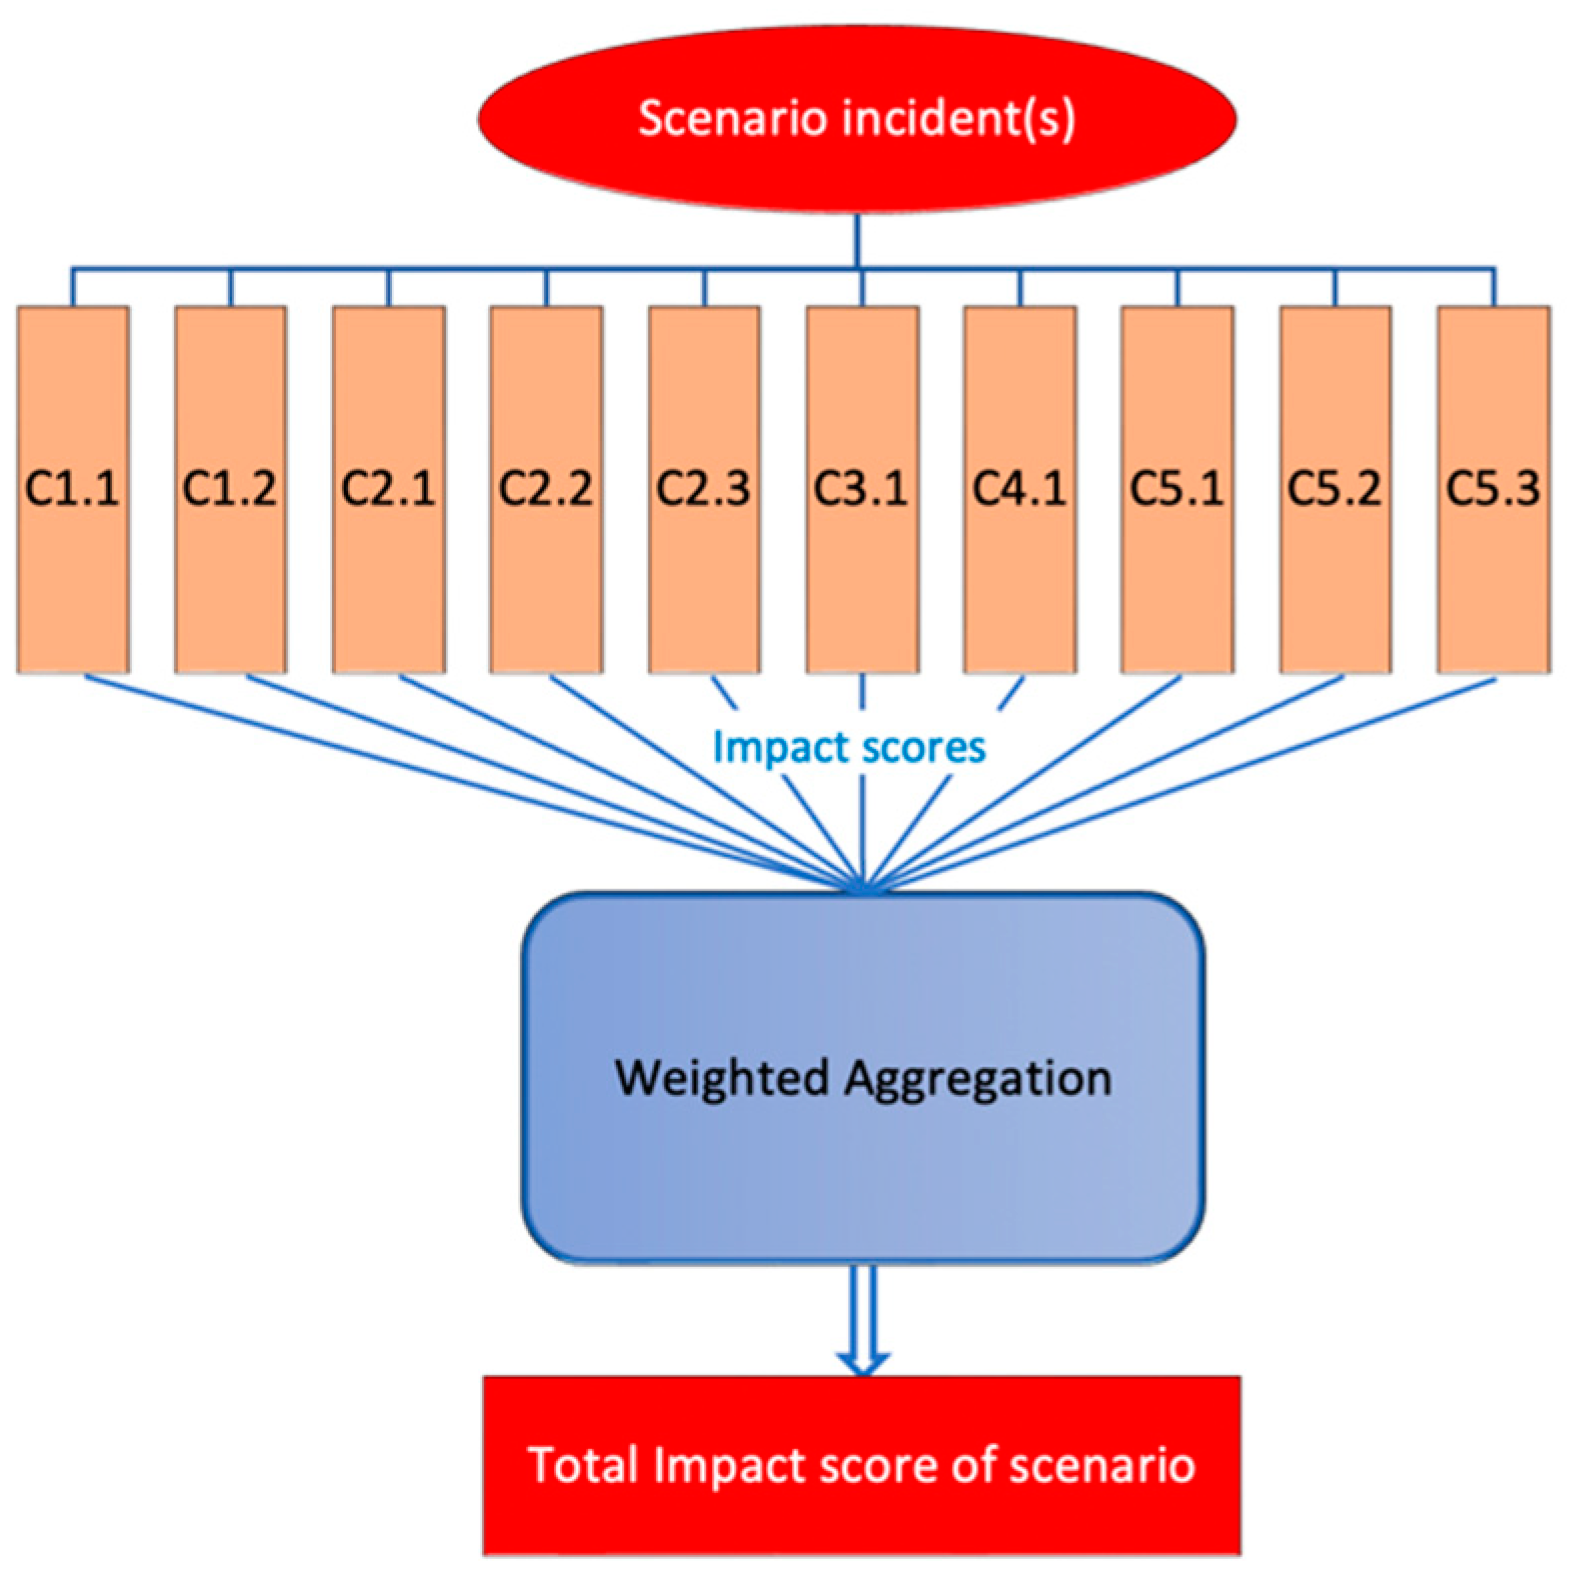
The third component of the generic model is the risk assessment methodology. Although we have mathematically expressed risk itself as a function of the probability of success—depending on the existence of the threat and the security level of the system, the conditions of scalability, and impact measured in terms economic losses—it is necessary that a risk methodology is utilized help us make projections. To evaluate scenarios related to high economic losses or natural catastrophes, which result from systemic cyber risk, it is possible to use either a frequency/severity model or a loss ratio model. The methodology proposal for security risk assessment in IoT systems defines the relation between input (risk factors) and output (economic impact). In the context of security, it is not always feasible to have enough data to establish a decision-making process. Having an IoT environment that is a complex and dynamic system makes this aspect even more relevant. Thus, we can define a set of actual or hypothetical tests to probe a system’s behavior under unusual conditions and then estimate the response of the system to predict conditional probabilities and beliefs (see Figure 5).
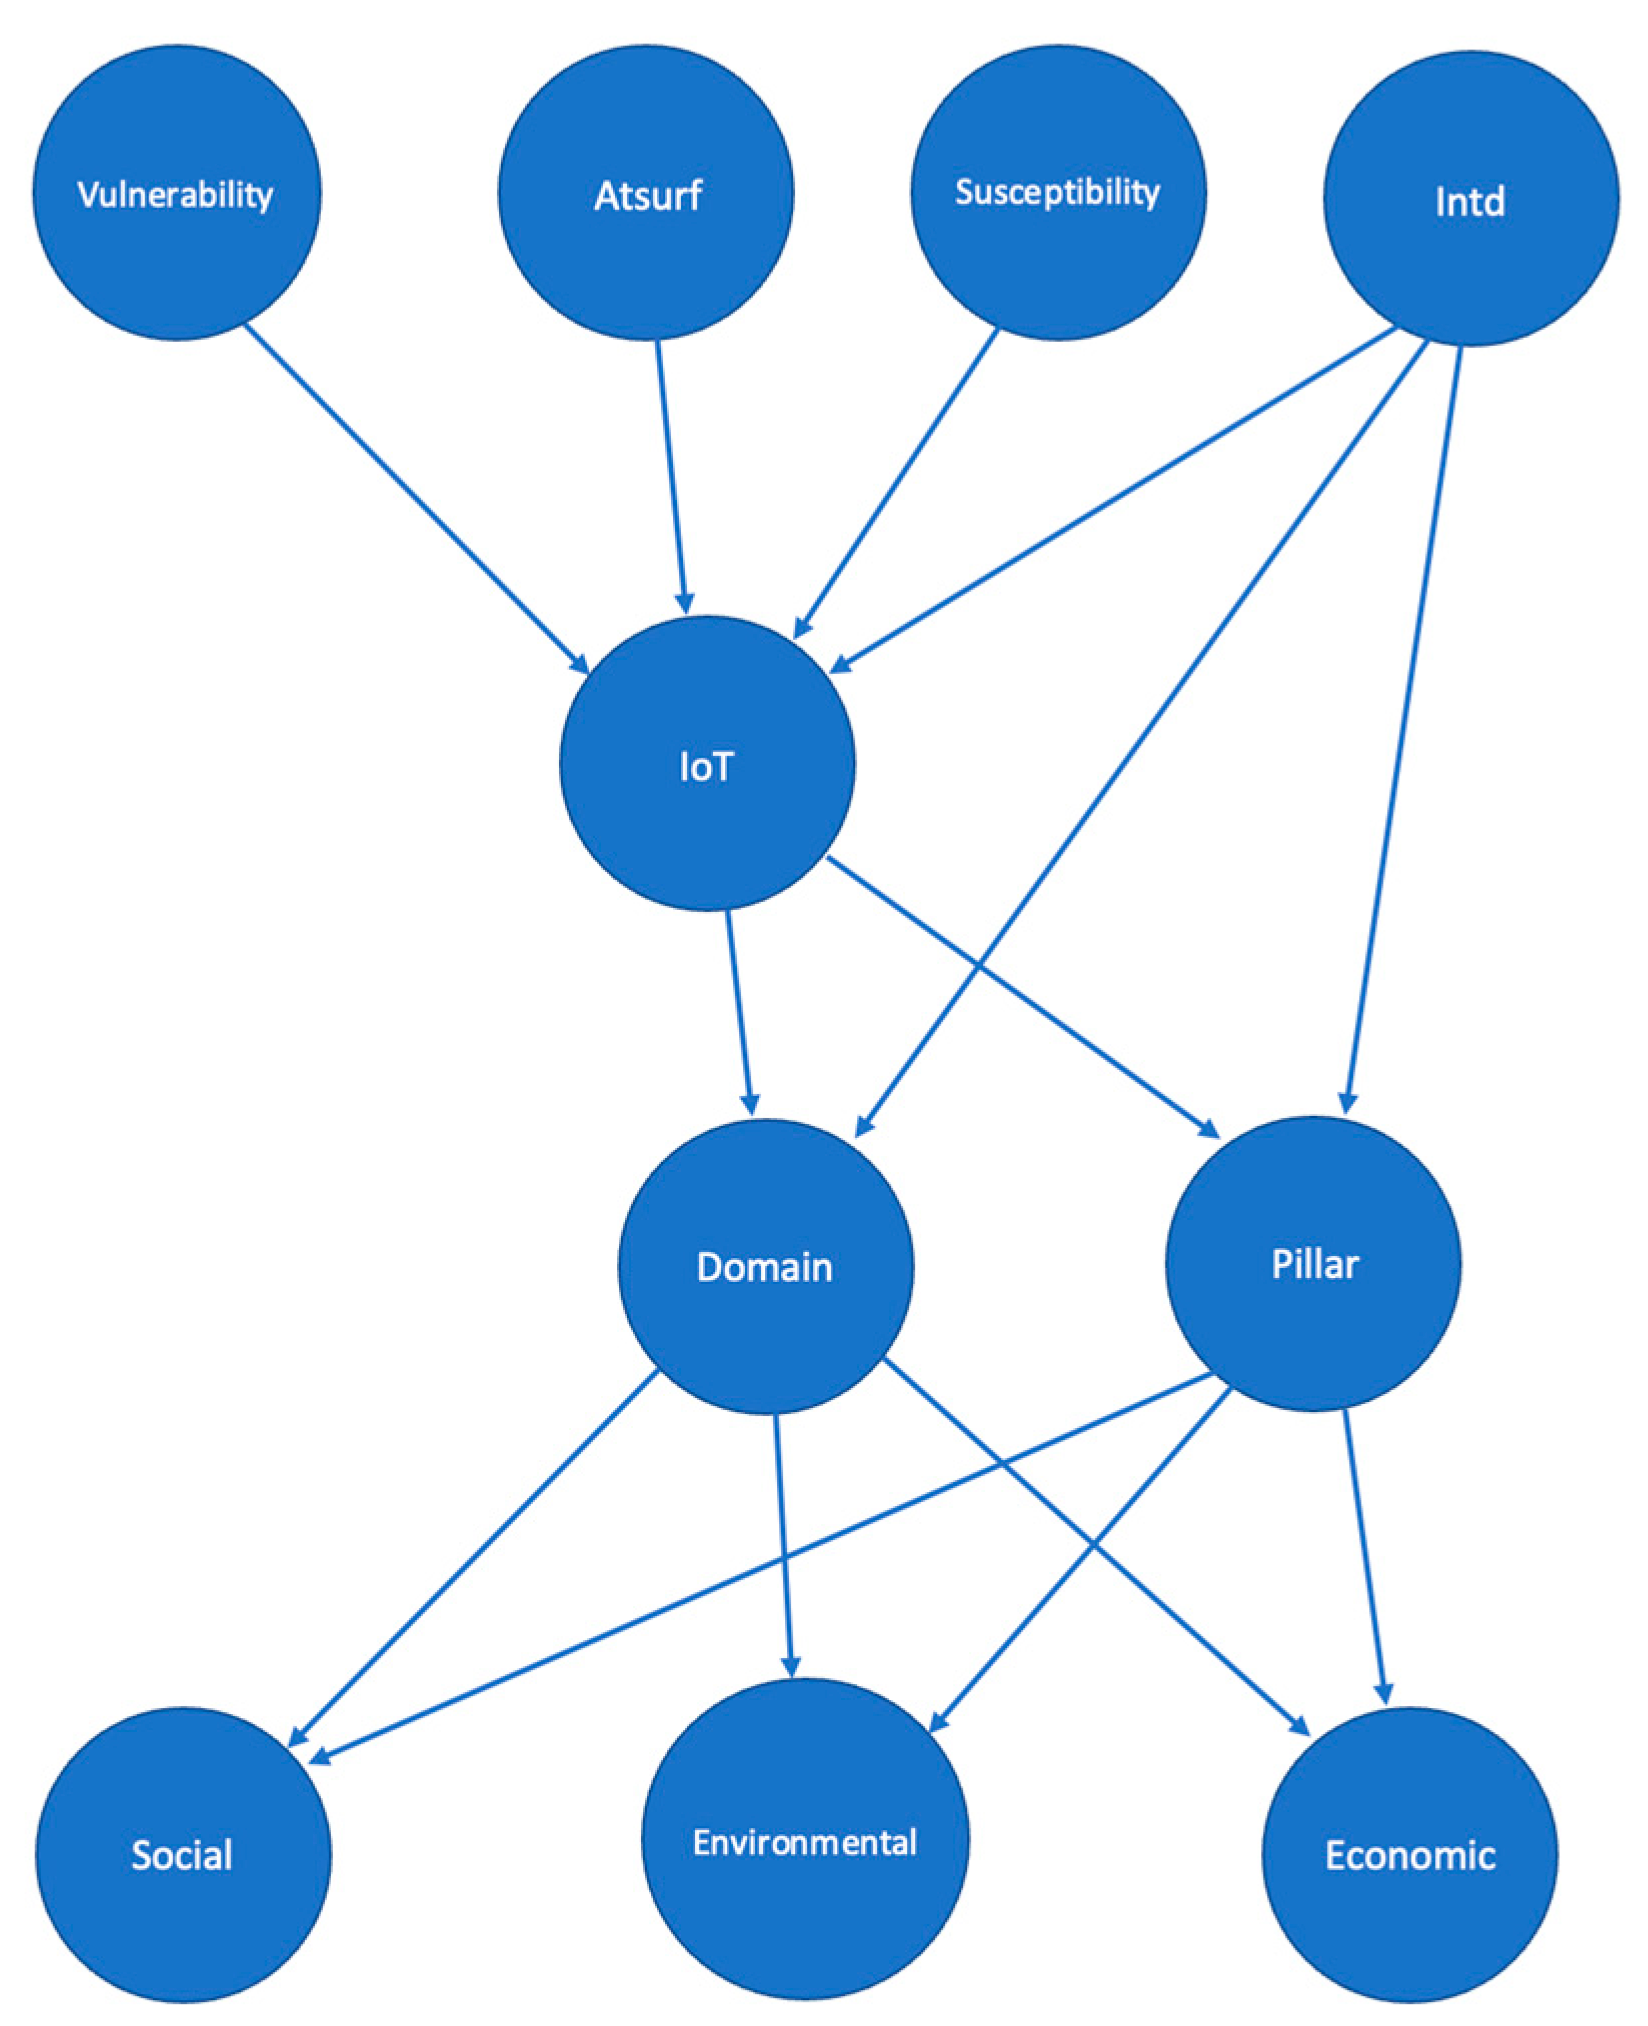
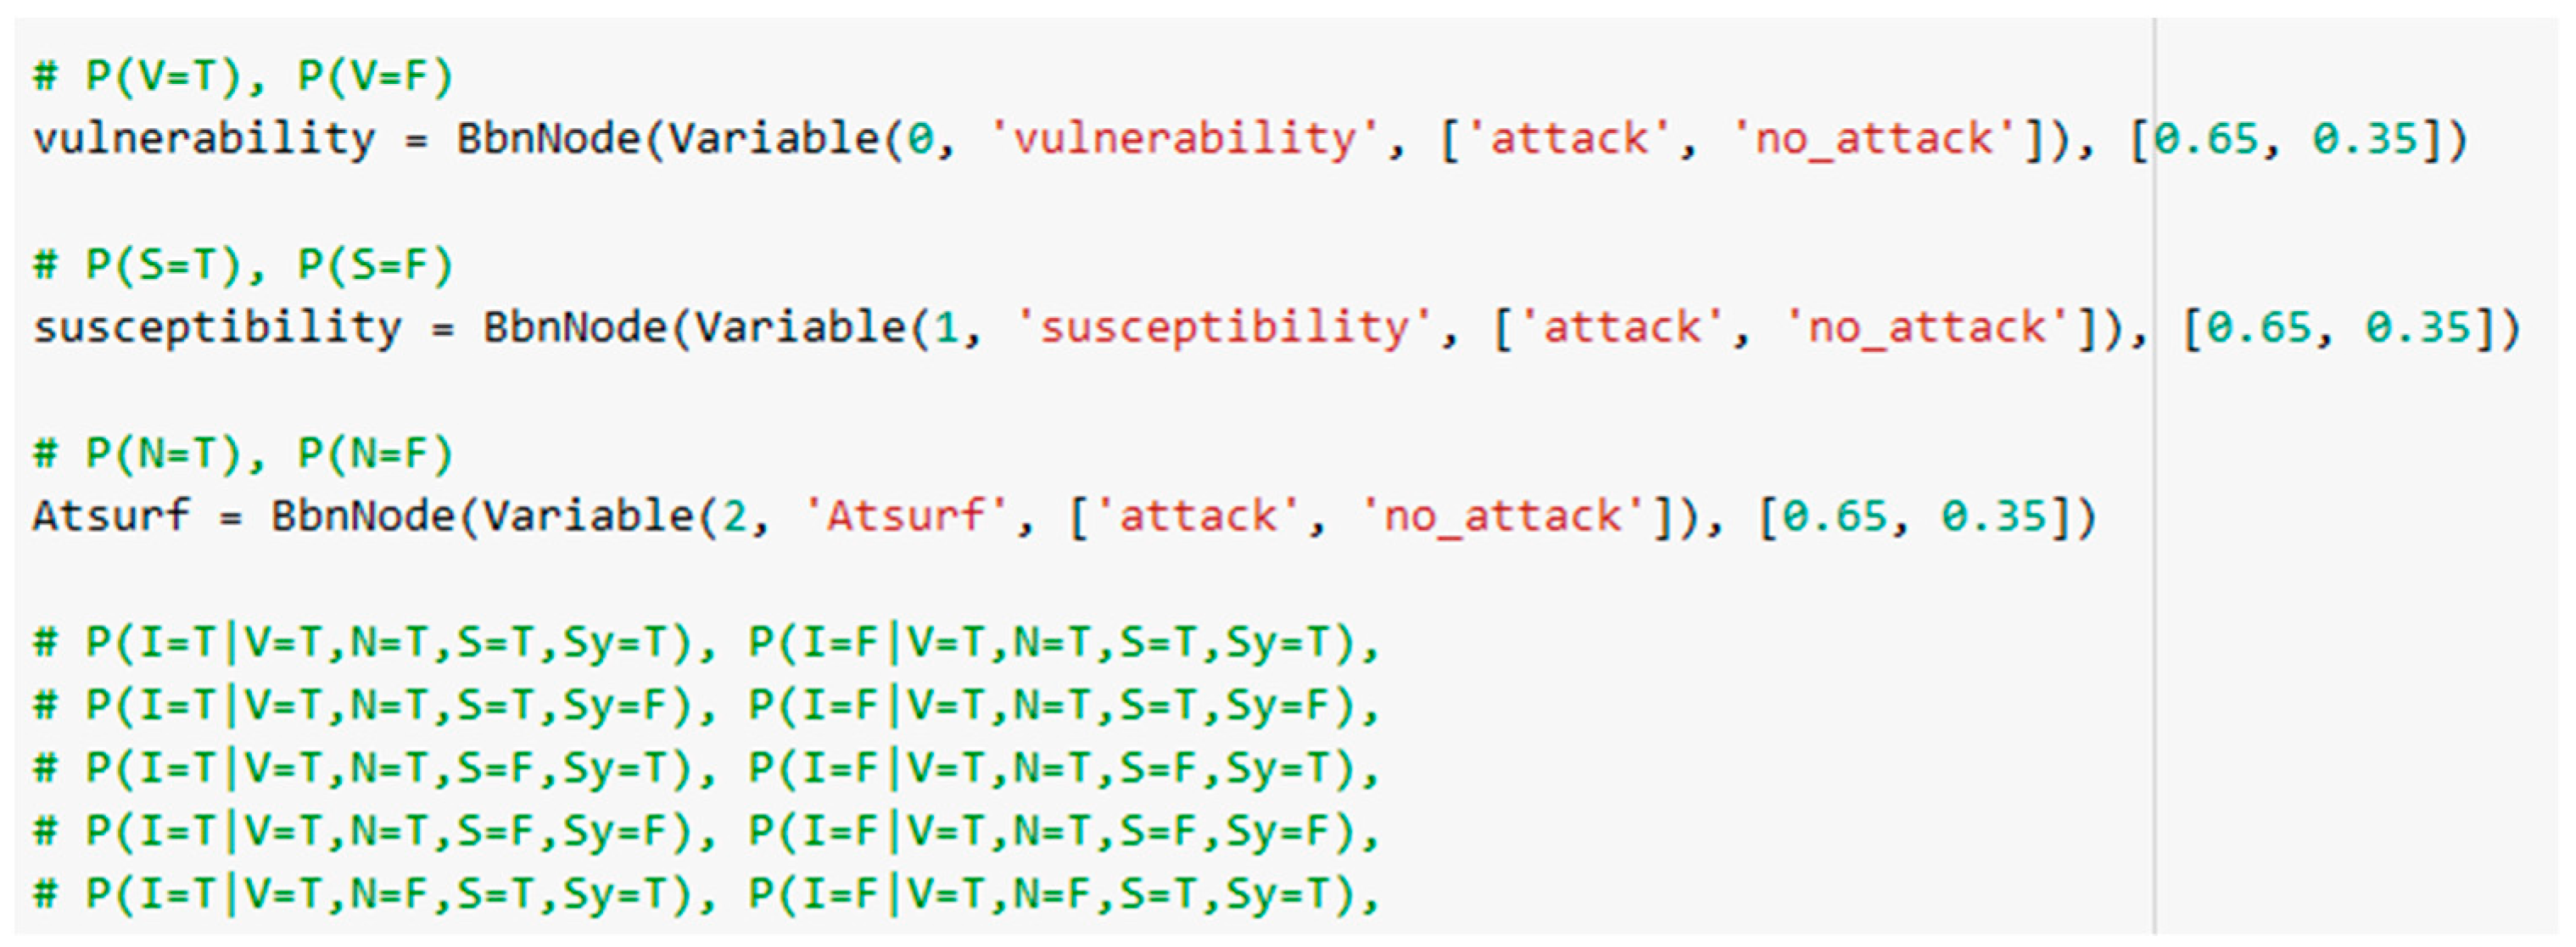
We propose a Bayesian network consisting of the following factors: vulnerability, susceptibility, attack surface, and interdependency. These factors shine a light on the possible impact on the economic, social, and environmental domains. We have selected the Bayesian network because it allows us to work in data-poor environments that face the presence of uncertainty. Additionally, it allows us to incorporate evidence that can update the state of the output variables, allowing us to capture the dynamics of these IoT systems (see Figure 6 and Figure 7).

4. Monitoring of Outputs

Finally, the fourth component for the assessment of IoT risk is output monitoring. Based on the Bayesian network, we obtained the results presented in Table 7. After obtaining the percentage of possible impact, we were interested in obtaining the resulting economic value from the security attack. For this, we were initially interested in seeing if the simulated output data could be adjusted to a financial risk calculation model to verify if it could fit a normal distribution, such as the one used by economic models such as VAR. There are some ways to estimate whether a variable has a normal distribution or not. We rely mostly on the shape of frequency polygons. Now, we are going to introduce a more formal test of normality.
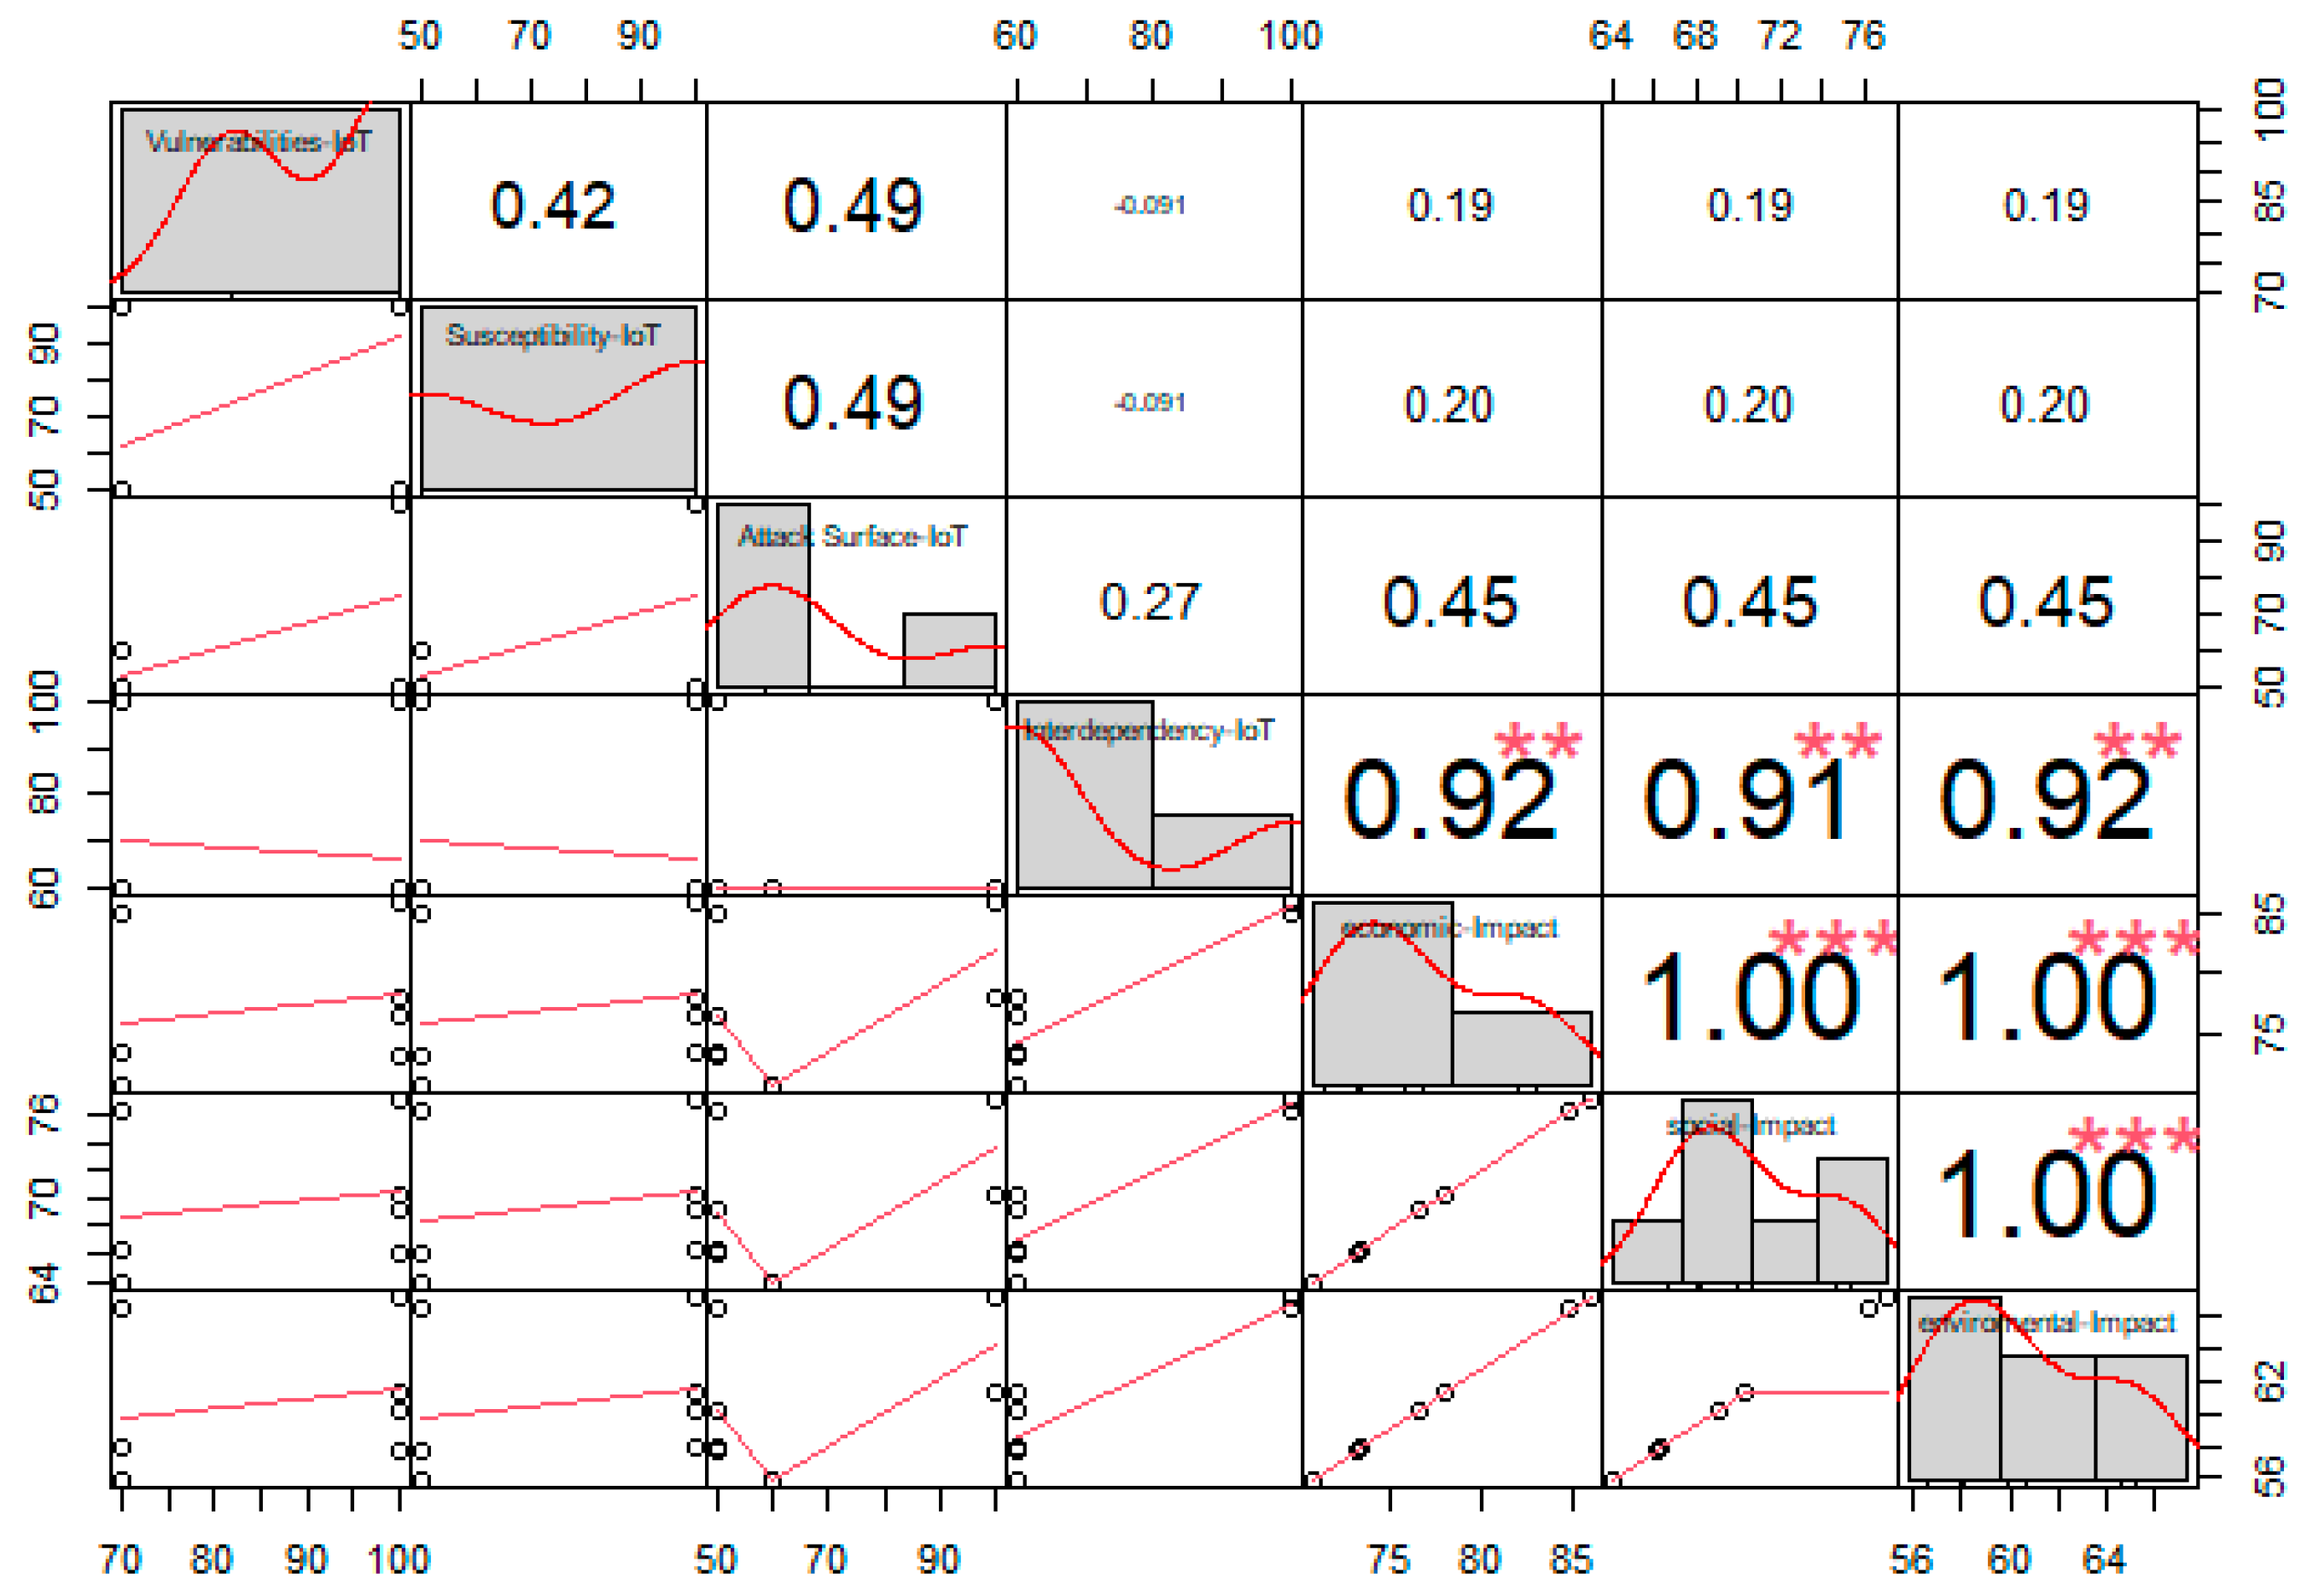
To probe if our values had a normal distribution, we used the Shapiro–Wilks test to identify if the null hypothesis of the sample came from a normal distribution. We chose a significance level of 0.05, and we had an alternative hypothesis that the distribution was not normal. We observed that the variables related to the proposal factors (vulnerability, attack surface, interdependency, and susceptibility) did not follow a normal distribution, and since in all four cases the probability value (p) was less than our chosen level (0.05) we rejected the null hypothesis. On the other hand, we observed that the variables related to impact followed a normal distribution; since in all three cases the probability value (p) was greater than our chosen level (0.05), we concluded that the null hypothesis should not be rejected. The correlations among the variables are shown in Figure 8.
Additionally, we observed evidence that the correlations were positive in all cases, but the interdependence variable had a high correlation close to 1, implying a higher contribution to social, economic, and environmental impact.
To evaluate the outputs, we defined a risk scale based on the percentage in the range of absorption capacity. The absorption capacity relates to the response that the organization has when faced with a security incident. An organization could have direct capital or insurance to counter a value that exceeds the threshold defined by the organization. The absorption capacity depends on the organization and defines the threshold. The risk value is an element within the range of the absorbing capacity. A risk value of 1 is equivalent to a value of 10% of the range defined for the absorption capacity, and the value is 10% above the threshold value set by the organization to absorb the impact of a security attack. A risk value of 2 is equivalent to a value of 20% of the range defined for the absorption capacity, a risk value of 3 is equivalent to a value of 30% of the range defined for the absorption capacity, and so on accordingly with the rest of the values. Best practice would be to set this threshold value between 70% and 80%; this would represent a risk value of 7 and 8, respectively. A risk value of 9 and 10 would mean that the organization could exceed the absorptive capacity threshold and generate a systemic event (see Figure 9).
We can establish a quantitative value of the economic impact based on the normal distribution. Table 8 presents the risk value as a function of the impact values obtained from the Bayesian network and the evaluation of normal distribution.
To exemplify the risk calculation according to the proposed methodology. We define the values of economic losses due to attacks. We estimate the minimum and maximum values of loss according to a risk portfolio (see Table 9).
The following is an example of a security attack on a parking lot system that uses an IoT infrastructure for its operation. We have used the analysis based on four phases: context, shock event produced by the incident, amplification of the incident impact, and the generation of a possible systemic event. The following is a description of the four phases for our smart parking scenario:
  • Context: We define the following assumption. A DoS attack on a parking IoT system is presented. We define our capacity of absorption of losses as USD 25,000;
  • Shock: The attack could generate economic, social, and environmental losses. In Table 10, we describe the possible loss for economic, social, and environmental aspects;
  • Amplification: The attack not only affects the parking lot with losses, but the owners as well. The social event in this case has the same value as the economic impact;
  • Systemic Event: In this case, there is no systemic event that could affect the local or global economy.
In this case, the loss value is USD 25,000. This value represents a 55% impact or a risk level of 5 in our proposal, as it is under the maximum expected loss value that we had proposed for a DoS attack (USD 45,000) in Table 8. However, in this case, we assume one of the possible scenarios.
For the information of the Bayesian network, if the probability of having vulnerability is 100%, the attack surface is hackable, there is interdependence that allows an attack, and there is a susceptibility, we would have—in the worst case scenario—an 86.05% probability of an economic impact, which represents a risk value of 8. This means that the economic loss value from the normal distribution analysis built with the values of Table 6, Table 7 and Table 8 is close to USD 30,000. In this case, we are still inside the range of our capacity of absorption of the shock, but we are very close to the umbral of a systemic event. Additionally, this is not considering the notion of a possible second event in the theta period, as shown in Figure 10.

5. Discussion

Based on the risk formula based on susceptibility, vulnerability, attack surface, interdependence, we have:
R = P t ( 1 1 ( n 1 ) 2 n ( β ( l = 0 n v l I o T ) ) ) V r
The attack surface, as mentioned above, is related to the number of devices, so reducing its size would not be feasible, but it would be possible to focus on securing the attack surface to maintain an adequate risk value. Regarding the vulnerability factor, it is important to reduce them through security implementation processes in the development process of the IoT solution or hardening the process to maintain an acceptable risk value. Regarding susceptibility, the best security practices to be considered depend on the characteristics of the domain. The number of interdependencies cannot be reduced because they are part of the construction of the IoT system, and the interoperability between IT and OT systems gives the expected functionality of the smart solution.
From the analysis of the four factors, interdependency requires the establishment of mechanisms to improve security aspects to avoid affecting risks. Interdependence is the one with the greatest contribution. There is security between the connections of devices and resilience when a device fails at the interdependency level, and cascading effects of security events. The theta time between systemic event A and systemic event B is important to manage in order to avoid the chaining of new events. Containment requires a safety incident response process.

Author Contributions

Conceptualization, R.A.; methodology, R.A.; validation, G.L.; formal analysis, R.A.; investigation, R.A., X.T.; writing—review and editing, R.A., X.T.; project administration, I.O.-G.; funding acquisition, I.O.-G. All authors have read and agreed to the published version of the manuscript.

Funding

This research received no external funding.

Institutional Review Board Statement

Not applicable.

Informed Consent Statement

Not applicable.

Conflicts of Interest

The authors declare no conflict of interest.

References

  1. Al-Sarawi, Shadi, Mohammed Anbar, Rosni Abdullah, and Ahmad B. Al Hawari. 2020. Internet of Things Market Analysis Forecasts, 2020–2030. Paper presented at 2020 Fourth World Conference on Smart Trends in Systems, Security and Sustainability (WorldS4), London, UK, July 27–28; pp. 449–53. [Google Scholar] [CrossRef]
  2. Andrade, Roberto O., Sang G. Yoo, Iván Ortiz-Garces, and Jhonattan Barriga. 2022. Security Risk Analysis in IoT Systems through Factor Identification over IoT Devices. Applied Sciences 12: 2976. [Google Scholar] [CrossRef]
  3. Andrade, Roberto Omar, Sang Guun Yoo, Luis Tello-Oquendo, and Iván Ortiz-Garcés. 2020. A Comprehensive Study of the IoT Cybersecurity in Smart Cities. IEEE Access 8: 228922–41. [Google Scholar] [CrossRef]
  4. Bank of England. 2022. Model Risk Management Principles for Stress Testing. Available online: https://www.bankofengland.co.uk/prudential-regulation/publication/2018/model-risk-management-principles-for-stress-testing-ss (accessed on 18 April 2022).
  5. BBC. 2022. BitMart: Crypto-Exchange Losses $150m to Hackers. Available online: https://www.bbc.com/news/technology-59549606 (accessed on 18 April 2022).
  6. Cazares, María, Roberto O. Andrade, Julio Proaño, and Iván Ortiz. 2021. Study of Technological Solutions in the Analysis of Behavioral Factors for Sustainability Strategies. In Sustainable Intelligent Systems. Advances in Sustainability Science and Technology. Edited by Amit Joshi, Atulya K. Nagar and Gabriela Marín-Raventós. Singapore: Springer. [Google Scholar] [CrossRef]
  7. Echeverría, Aarón, Cristhian Cevallos, Ivan Ortiz-Garces, and Roberto O. Andrade. 2021. Cybersecurity Model Based on Hardening for Secure Internet of Things Implementation. Applied Sciences 11: 3260. [Google Scholar] [CrossRef]
  8. European Systemic Risk Board. 2022. Mitigating Systemic Cyber Risk. Available online: https://www.esrb.europa.eu/news/schedule/2021/html/20210701_conf_systemic_risk_analytics.en.html (accessed on 15 January 2022).
  9. García, Fresia Yanina Holguín, and Lohana Mariella Lema Moreta. 2018. Maturity Model for the Risk Analysis of Information Assets based on Methodologies MAGERIT, OCTAVE y MEHARI; focused on Shipping Companies. Paper presented at 2018 7th International Conference on Software Process Improvement (CIMPS), Guadalajara, Mexico, October 17–19; pp. 29–39. [Google Scholar] [CrossRef]
  10. Huang, Yu-Lun, and Wen-Lin Sun. 2018. An AHP-Based Risk Assessment for an Industrial IoT Cloud. Paper presented at 2018 IEEE International Conference on Software Quality, Reliability and Security Companion (QRS-C), Lisbon, Portugal, July 16–20. [Google Scholar]
  11. International Monetary Fund. 2022. Understanding Financial Interconnectedness. Available online: https://www.elibrary.imf.org/view/journals/007/2010/023/article-A001-en.xml (accessed on 2 February 2022).
  12. Kaffenberger, Lincoln, and Emanuel Kopp. 2022. Cyber Risk Scenarios, the Financial System, and Systemic Risk Assessment. Available online: https://carnegieendowment.org/2019/09/30/cyber-risk-scenarios-financial-system-and-systemic-risk-assessment-pub-79911 (accessed on 18 April 2022).
  13. Kieras, Timothy, Junaid Farooq, and Quanyan Zhu. 2021. I-SCRAM: A Framework for IoT Supply Chain Risk Analysis and Mitigation Decisions. IEEE Access 9: 29827–40. [Google Scholar] [CrossRef]
  14. Lee, In. 2020. Internet of Things (IoT) Cybersecurity: Literature Review and IoT Cyber Risk Management. Future Internet 12: 157. [Google Scholar] [CrossRef]
  15. Matheu-García, Sara N., José L. Hernández-Ramos, Antonio F. Skarmeta, and Gianmarco Baldini. 2019. Risk-based automated assessment and testing for the cybersecurity certification and labelling of IoT devices. Computer Standards & Interfaces 62: 64–83. [Google Scholar] [CrossRef]
  16. McKinsey. 2022. Meeting the Future: Dynamic Risk Management for Uncertain Times. Available online: https://www.mckinsey.com/business-functions/risk-and-resilience/our-insights/meeting-the-future-dynamic-risk-management-for-uncertain-times (accessed on 18 April 2022).
  17. NetDiligence. 2022. Sixth Annual Cyber Claims Study | NetDiligence. Available online: https://netdiligence.com/press-releases/netdiligence-releases-latest-study-on-cyber-claim-costs/ (accessed on 18 April 2022).
  18. New York Times. 2022. Pipeline Attack Yields Urgent Lessons About U.S. Cybersecurity. Available online: https://www.nytimes.com/2021/05/14/us/politics/pipeline-hack.html (accessed on 18 April 2022).
  19. Nurse, Jason R. C., Sadie Creese, and David De Roure. 2017. Security Risk Assessment in Internet of Things Systems. IT Professional 19: 20–26. [Google Scholar] [CrossRef] [Green Version]
  20. Park, Mookyu, Haengrok Oh, and Kyungho Lee. 2019. Security Risk Measurement for Information Leakage in IoT-Based Smart Homes from a Situational Awareness Perspective. Sensors 19: 2148. [Google Scholar] [CrossRef] [Green Version]
  21. Pereira, Carlos, Diana Guimarães, João Mesquita, Frederico Santos, Luis Almeida, and Ana Aguiar. 2018. Feasibility of Gateway-Less IoT E-Health Applications. Paper presented at 2018 European Conference on Networks and Communications (EuCNC), Ljubljana, Slovenia, June 18–21; pp. 324–28. [Google Scholar] [CrossRef]
  22. Rak, Massimiliano, Valentina Casola, Alessandra De Benedictis, and Umberto Villano. 2018. Automated Risk Analysis for IoT Systems. In Lecture Notes on Data Engineering and Communications Technologies. Berlin: Springer, pp. 265–75. [Google Scholar] [CrossRef]
  23. Randaliev, Petar, Dave De Roure, Stacy Cannady, Rafael Mantilla Montalvo, Razvan Nicolescu, and Michael Huth. 2018. Economic impact of IoT cyber risk—Analysing past and present to predict the future developments in IoT risk analysis and IoT cyber insurance. Paper presented at Living in the Internet of Things: Cybersecurity of the IoT—2018, London, UK, March 28–29. [Google Scholar]
  24. Thibaud, Montbel, Huihui Chi, Wei Zhou, and Selwyn Piramuthu. 2018. Internet of Things (IoT) in high-risk Environment, Health and Safety (EHS) industries: A comprehensive review. Decision Support Systems 108: 79–95. [Google Scholar] [CrossRef]
  25. World Economic Forum. 2016. Understanding-Systemic-Cyber-Risk. Available online: https://www.weforum.org/whitepapers/understanding-systemic-cyber-risk (accessed on 18 April 2022).
  26. World Economic Forum. 2022. Global Risks Report 2022. Available online: https://www.weforum.org/reports/global-risks-report-2022 (accessed on 18 April 2022).
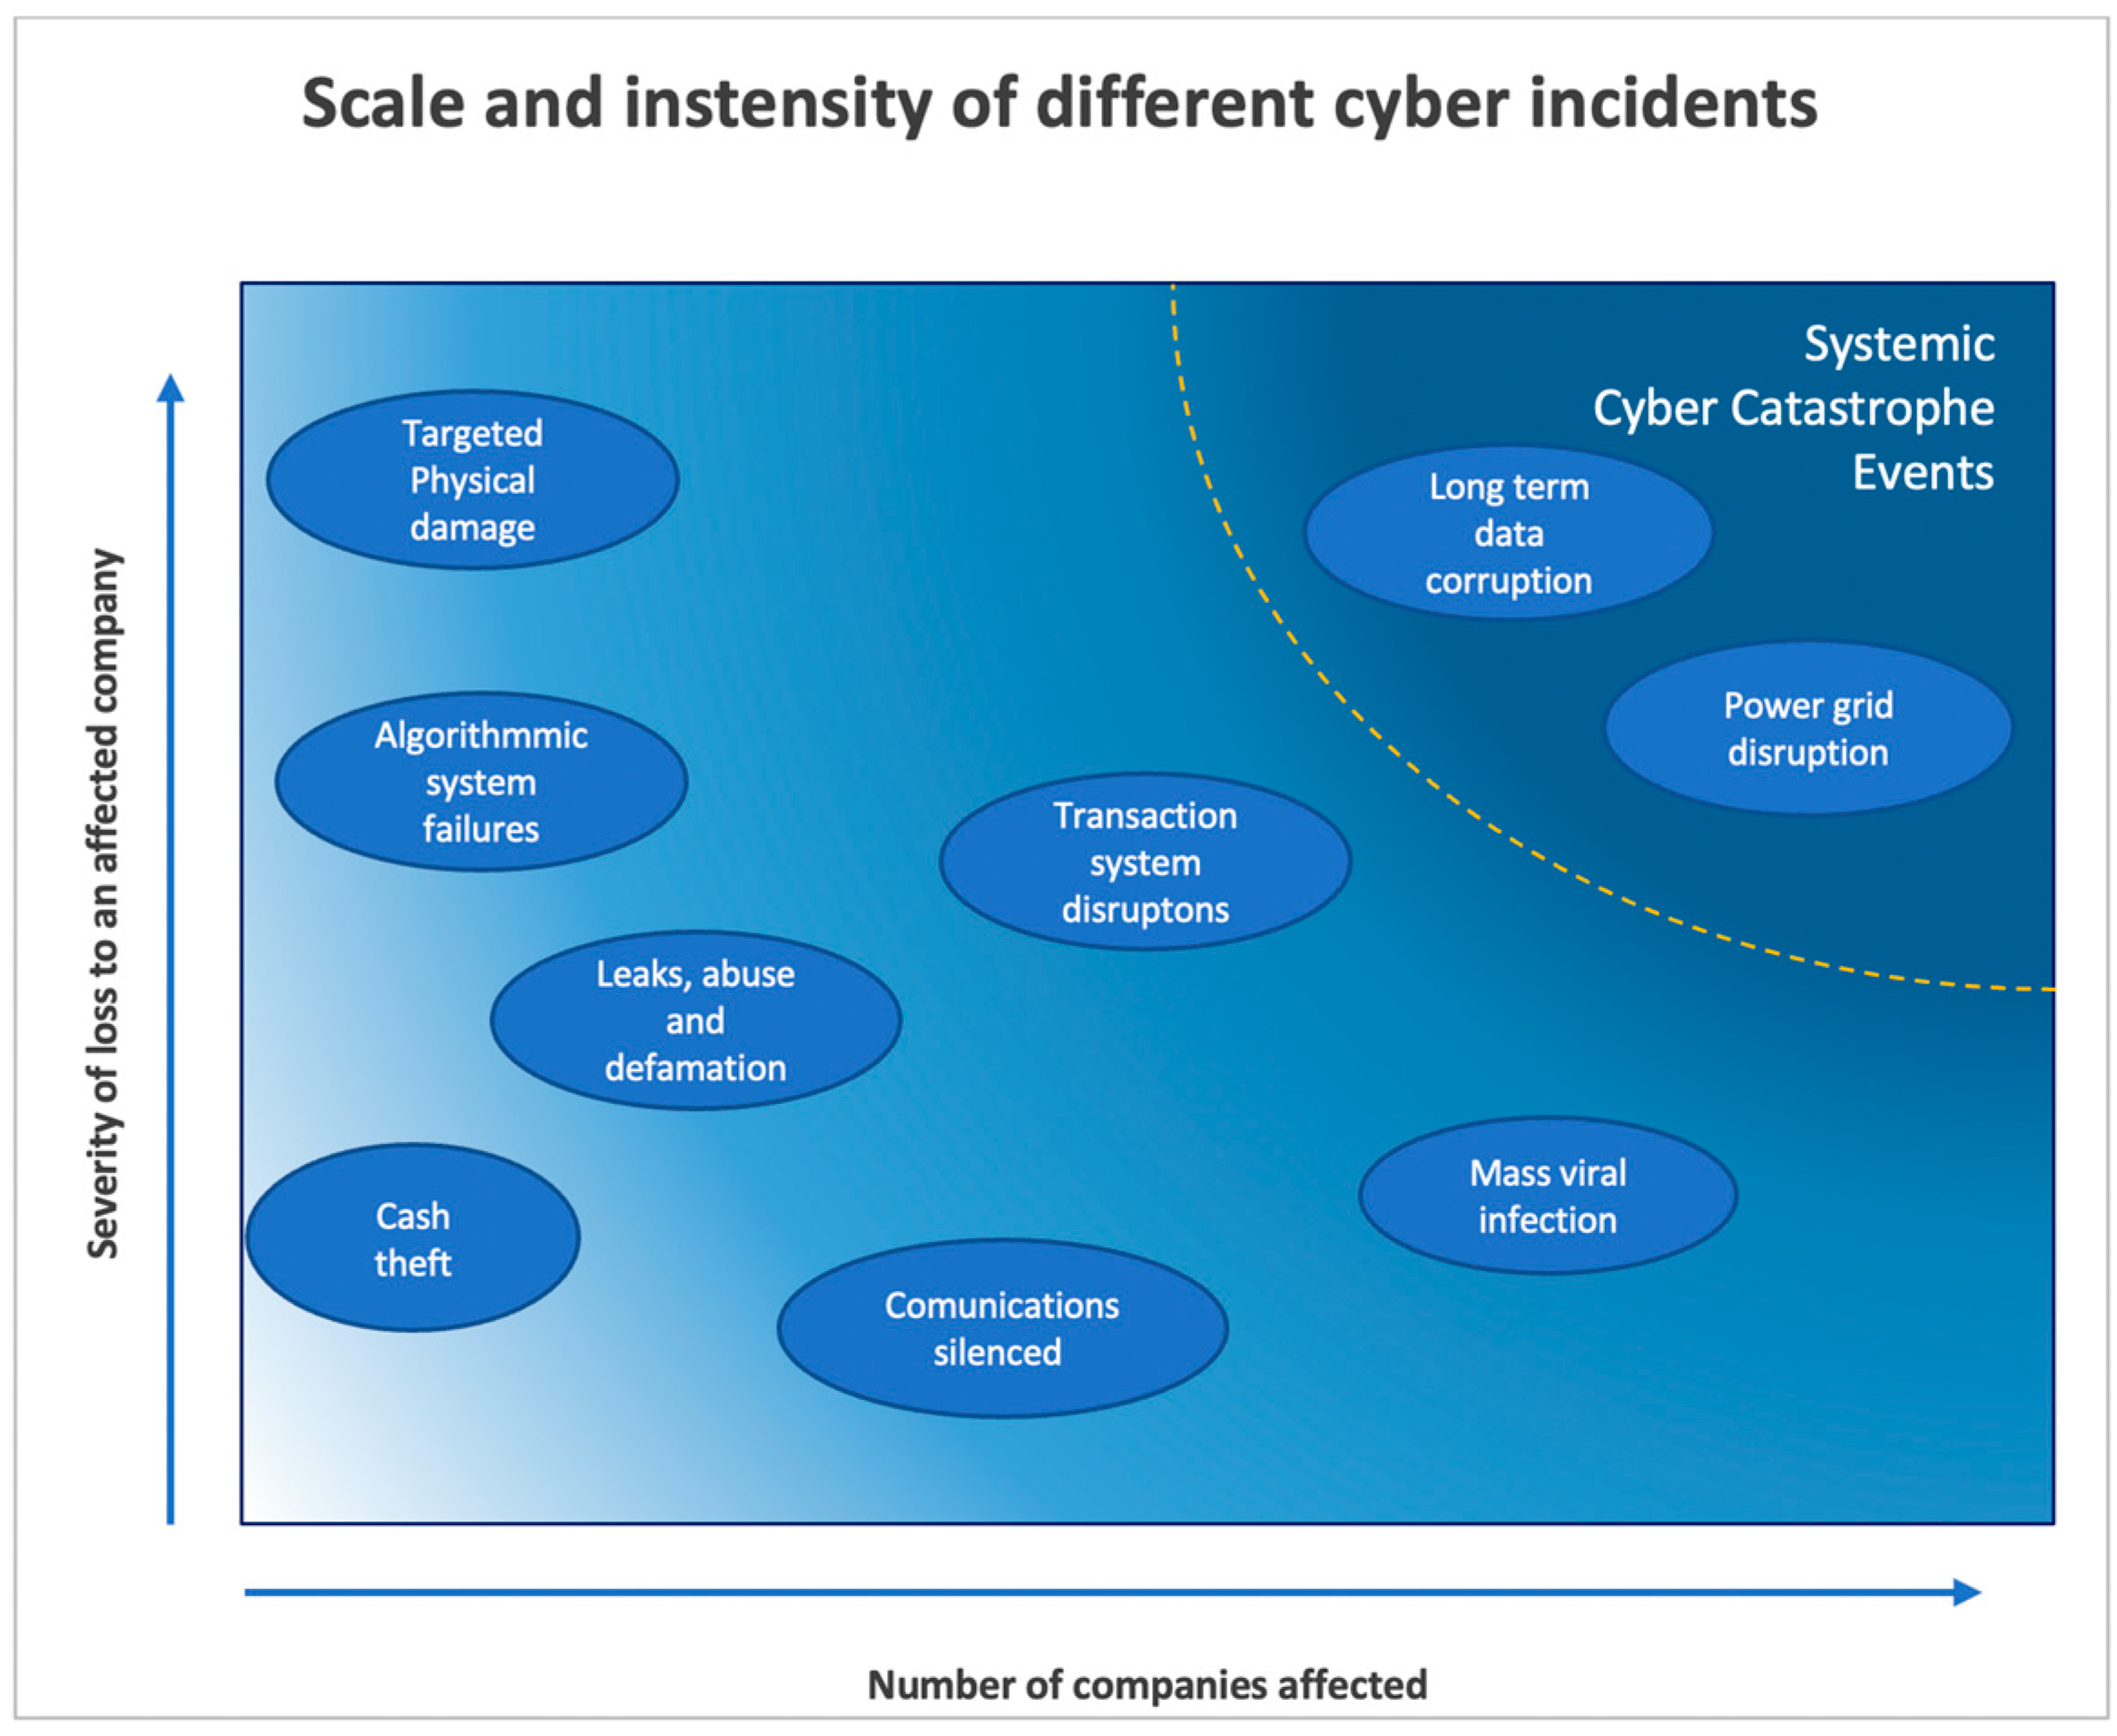
Figure 1. Number of companies affected versus severity of loss (source: WEF (European Systemic Risk Board 2022)).
Risks 10 00162 g001
Figure 2. Proposed multilayered architecture of an IoT system.
Risks 10 00162 g002
Figure 3. Model for security risk management in IoT context.
Risks 10 00162 g003
Figure 4. Three charts illustrate in the concept of impact tolerance and absorptive capacity (a) a shock being absorbed (b) and disruptions with different rates of impact amplification (c). Source: WEF (European Systemic Risk Board 2022).
Risks 10 00162 g004
Figure 5. Scheme of an actual or hypothetical test targeted to probe the system’s response to a hypothetical but possible scenario.
Risks 10 00162 g005
Figure 6. A Bayesian network consisting of various factors (vulnerability, susceptibility, attack surface, and interdependency) that have potential to impact the economic, social, and environmental domains.
Risks 10 00162 g006
Figure 7. This is a figure. Schemes follow the same formatting.
Risks 10 00162 g007
Figure 8. Correlation of a set of variables indicating that the null hypothesis should not be rejected since the financial risk calculation model followed the normal distribution. ** high correlation; *** very high correlation.
Risks 10 00162 g008
Figure 9. The percentage in the range absorption capacity relates directly to the risk value and is related to the response given in the event of the security incident.
Risks 10 00162 g009
Figure 10. Disruptions with different rates of impact amplification.
Risks 10 00162 g010
Table 1. Cost for security incidents according to the study by NetDiligence (NetDiligence 2022). Costs for attacks are shown in USD.
CategoryMeanMediumMax
Wire transfer found1801051400
Wrongful data collection868686
System glitch19007917,500
Hacker337747400
Malware/virus308709000
Table 2. Risk proposals to evaluate risk in IoT Systems.
Focus onBased onContrasted withEconomic Impact Evaluated byReference
Gateway, Network, IoT device, ServiceThe ISO 31000, ISO 29119, STRIDENIST Security Control FrameworkDoes not applySara
IoT digital assetsBusiness Impact AnalysisDoes not applyMicroMort y VaRRandaliev
IoT assetsCKC frameworkCenter for Internet Security (CIS)Expected financial lossThibaud
IoT nodesLINDDUNDoes not considerCumulative business impactShivraj
IoT devicesAHP-based%CPU y traffic-rateDoes not applyHuang
IoT devicesProduct threat, vulnerability, impactCVSSDoes not applyPark
IoT devicesSecurity graphSecurity attributes, dependencies, security logical functions and security risk.Does not applyKieras
Asset Threat IdentificationISO, STRIDENIST Security Control FrameworkDoes not applyRak
Table 3. Attacks to layers of IoT systems (Randaliev et al. 2018).
LayerAttacks
ApplicationSocial Engineering
Virus
Trojan
Injection
Unauthorized access
Exhaustion
Collision
Malware
NetworkMan-in-the-middle
Wormhole
Unfairness
De-synchronization
Flooding
PhysicalSelective forwarding
Spoofing
Eavesdropping
Tampering
Sybil
Jamming
Table 4. Compliance classes for IoT systems (Echeverría et al. 2021).
Compliance ClassesDescriptionConfidentialityIntegrityAvailability
Class 0Impact could happen in the IoT systemLowLowLow
Class 1Limited impact could occur in the IoT system.LowMediumMedium
Class 2Significative impact to the availability of IoT systemMediumMediumHigh
Class 3Impact to sensitive data of IoT systemHighMediumHigh
Class 4Loss control and critical impact of the IoT system.HighHighHigh
Table 5. Relation of susceptibility β to vulnerability and domain of the application of IoT systems (Andrade et al. 2020).
Vertical DomainPhysical VulnerabilityNetwork VulnerabilityApplication VulnerabilityBeta
Smart homeWithin the boundaries of a house or building. Generally, few meters of geographic area.Network topology generally is of star type. Network topology is small. Few devices in the network.Applications on mobile devices, especially smartphones.Low
Smart healthWithin the boundaries of a building or medical campus. Coverage of geographic area of meters or kilometers.Network topology could be extended-star type. The size of the network is medium. Network could contain hundreds of devices.Applications on mobile devices (smartphones and tablets).Medium
Smart trafficWithin the boundaries of a city. Geographic coverage in kilometers.Mesh-type network topology. Large network.Applications on computer devices (information systems).High
Table 6. Possible impact to economic, social and environmental domains due to attacks in IoT systems (Cazares et al. 2021).
Vertical/DomainEconomicSocialEnvironmental
Smart cityPotential loss of high economic revenues due to non-operation
of city services.
Loss of credibility of public services.Possibility of certain attacks affecting services related to waste management that could affect the environment.
Smart healthPossible high economic losses due to possible legal claims.Possibility of the loss of lives.Possibility of certain attacks affecting waste management.
Smart homePossible low economic losses.Low impact.Low impact.
Smart gridPotential high economic losses due to lack of energy for the organization’s operations.Possibility of generating a feeling of chaos, insecurity, or stress in people due to the lack of electric power.Possibility of certain attacks affecting waste management or environmental control processes in organizations due to lack of energy.
Smart trafficPossible low-to-medium economic losses due to delays in people getting to their jobs.Possibility of generating anxiety and exhaustion in drivers.Possibility of increased pollution due to vehicular congestion.
Table 7. Values for Bayesian network simulation for input factors.
Vulnerabilities–IoTSusceptibility–IoTAttack Surface–IoTInterdependency–IoTEconomic ImpactSocial ImpactEnvironmental Impact
70.00%50.00%60.00%60.00%70.77%63.98%55.90%
100.00%50.00%50.00%60.00%73.12%66.04%57.66%
100.00%100.00%50.00%60.00%76.56%69.08%60.26%
100.00%100.00%100.00%60.00%77.91%70.25%61.26%
100.00%100.00%100.00%100.00%86.05%77.15%67.28%
70.00%100.00%50.00%60.00%73.40%66.30%57.88%
70.00%50.00%50.00100.00%84.86%76.2%66.43%
Table 8. Risk level according to economic impact.
Economic ImpactRisk Level
70.777
73.127
76.567
77.917
86.058
73.407
84.868
Table 9. Hypothetical cost for attacks to IoT systems.
AttackLowerUpper
DoS15,00045,000
Eavesdropping20007500
Privilege Escalation Attack10,00080,000
Table 10. Indicator for estimating cost of economic security.
Indicator for Estimating Cost of Economic Security
Damage to smart infrastructure
A DoS attack can affect the IoT infrastructure related to vehicle detection devices, generating 10 h of inoperability to the parking lot.
Economic Loss
There are financial losses due to an estimated parking flow of 100 cars per hour. Since the inoperability is set to 10 h with a parking price at USD 10, the final loss cost is approximately USD 10,000.
Social damage
A social impact is inevitable due to the unavailability of parking lots, this generates stress and latency in people’s lives. In this case, we estimate that at least half (500) of the owners had an hour delay; if they were to be paid USD 20 an hour, the total loss would be USD 10,000.
Environmental damage
The inoperability of parking lots implies that cars will have to circulate throughout the zone generating more contamination to the atmosphere than usual. For simplicity, let us suppose that the environmental damage is of USD 5000.
Publisher’s Note: MDPI stays neutral with regard to jurisdictional claims in published maps and institutional affiliations.