Abstract
This research indicates that accounting is essential for assessing South Asian airline companies via financial ratio analysis from 2011 to 2022. The accounting measurements delineate informing and facilitating strategic decision-making from 2011 to 2022. The analysis utilizing GARCH and PARCH models indicates that liquidity ratios have a positive impact on financial performance, supported by statistically significant evidence (p < 0.05) under both symmetric and asymmetric conditions. Effective liquidity management and the strategic implementation of debt through accounting practices should be prioritized, as they enhance financial outcomes for South Asian airlines while adhering to long-term accounting standards. Future research should examine the responses of various airlines to these ratios, considering external factors, as this will yield valuable insights to enhance financial practices and promote aviation development in the region.
JEL Classification:
E42; E51; F31
1. Introduction
When it comes to the performance of the organizations, competition, expansion, and the name of the organization, the financial data are always crucial. An effective accounting information system enables the generation, maintenance, and formulation of essential and accurate reports (Raza et al. 2022). Both small and large businesses necessitate precise accounting records to assess their progress. An effective accounting and finance department is crucial for overall business growth and the success of individual enterprises. The capital structure of a company consists of debt and long-term capital. A business utilizes it to acquire essential assets or to address a capital shortfall (Raza et al. 2024). The investor possesses a claim on a company’s assets pertaining to both debt and equity. Employ these resources to finance productive assets, enabling the business to generate sufficient revenue (Aman and Altass 2023).
A management system that meets funder obligations while fulfilling company objectives is enhanced by the assessment of financial performance. The assessment of financial performance indicates that the investment in profitable assets is contingent upon the viability of capital (Hermuningsih et al. 2023).
A company with sufficient liquidity can employ its current assets, including cash, inventories, and receivables, to meet its short-term obligations. Also, the corporation can utilize the liquidity to jump all over immediately or make the most of possible chances that might boost profitability (Tang et al. 2024). Liquidity refers to the ability of a company to fulfill its short-term obligations, and its significance becomes evident when assessing the consequences of a company’s inability to do so. A company’s failure to pay its creditors can be attributed to various factors. Second, although the company possesses cash, its ability to cover current liabilities is inadequate. A lack of liquidity could force the company to liquidate its fixed assets and investments or, in the worst case, result in bankruptcy (Sany and Yonatan 2023).
This analysis examined liquidity ratios and debt ratios, as they serve as critical indicators for assessing both short-term financial stability and long-term debt repayment capacity, directly impacting financial evaluations within the airline sector. Liquidity ratios, such as the current ratio and quick ratio, indicate the capacity to meet short-term obligations. Additionally, debt ratios, including debt-to-equity and debt-to-assets ratios, reflect company leverage and financial risk. Unlike many other industries, airline companies require significant capital investment, are susceptible to fluctuating fuel prices, and operate with narrow profit margins. The capital intensity inherent in the airline industry results in elevated fixed costs, necessitating reliance on debt and equity financing. The revenue generation for airlines exhibits significant seasonality, and their working capital cycles are complex, primarily due to advanced ticketing and substantial operating costs. Liquidity management is crucial for ensuring financial stability in this sector, especially in South Asia, where economic uncertainty and regulatory constraints markedly affect financial performance. The interest coverage ratio and asset turnover are relevant; however, this research chose to exclude these financial indicators from this study due to specific factors. The airline industry exhibits limited significance regarding the interest coverage ratio, as financial interest expenses arise primarily from fuel price fluctuations rather than from debt levels. Additionally, traditional full-service airlines and low-cost carriers exhibit distinct financial structures. Traditional full-service airlines exhibit higher leverage due to substantial investments in fleets and international operations, while low-cost carriers prioritize cost control and typically maintain lower debt levels. The disparity in financial structures affects financial performance, as traditional airlines incur higher interest expenses compared to low-cost carriers, thereby influencing their return on equity and liquidity management strategies. Liquidity and debt ratios demonstrate a more direct correlation with financial stability in bankruptcy situations than the operational efficiency metric indicated by asset turnover. This study proposed the following research questions:
Does the current ratio significantly affect the ROE of airline companies in South Asian economies?
Does the quick ratio significantly affect the ROE of airline companies in South Asian economies?
Does the cash ratio significantly affect the ROE of airline companies in South Asian economies?
Does the debt ratio significantly affect the ROE of airline companies in South Asian economies?
Does the debt-to-equity ratio significantly affect the ROE of airline companies in South Asian economies?
2. Literature Review
South Asian airline companies and all firms operate under the Trade-Off Theory of Capital Structure, which involves balancing costs and benefits between debt and equity to determine their optimal capital structure (Boumlik et al. 2025). The theory advocates for debt financing, as it allows businesses to leverage tax advantages through the deduction of interest payments, thereby enhancing profitability. As firms elevate their debt levels, the risk of financial distress escalates, diminishing the potential advantages associated with leverage (Kamel et al. 2024). Financial distress costs, encompassing bankruptcy proceedings, loss of market confidence, and diminished operational flexibility, escalate to substantial levels as debt levels become excessive.
South Asian airlines face a financial dilemma as outlined by the Trade-Off Theory, necessitating a decision between utilizing debt for tax shield advantages and maintaining an appropriate debt-to-equity ratio for financial stability (Amin and Cek 2023). Elevated debt levels result in heightened interest payments for airlines, which subsequently cause cash flow issues and reduced profitability, ultimately leading to a decline in return on equity (ROE) levels. Companies that primarily utilize equity financing are unlikely to employ debt instruments for business expansion (Bui et al. 2023). The theory posits that firms maximize financial benefits from debt financing when the advantages of tax shields align with total distress costs. Effective management of the financial structure is essential for airlines to optimize performance metrics while ensuring long-term business sustainability. The established framework allows researchers to examine the impact of debt and liquidity decisions made by South Asian airlines on their financial performance, specifically regarding operational profitability and shareholder value attainment (Tawfiq et al. 2024).
2.1. Liquidity and Financial Performance
Financial management seeks to inform decisions that enable a firm to attain business excellence, especially in value creation (Hiadlovský et al. 2016). Liquidity is an essential tool for every organization. The organization can achieve this by transforming liabilities into assets. Liquidity reflects a corporation’s capacity to settle its debts, whether in the short term or long term. Liquidity influences performance, as a financially sound company generally exhibits strong performance and maintains adequate liquidity. The company’s operational confidence influences its liquidity (Waswa et al. 2018; Mugambi et al. 2023). Raza et al. (2024) found that there is a positive short-run and long-run effect of the current ratio on financial performance in the Turkish banking industry by applying the ARDL model.
Nanda and Panda (2018) assert that a low level of liquidity within an organization may diminish its procurement capacity due to increased credit requirements, subsequently impacting profitability negatively. The organization’s productivity could experience the ill effects of low liquidity levels. A company facing insufficient funds to meet its obligations may resort to external borrowing, which incurs interest and subsequently reduces its profit margins. The company must liquidate investments and non-current assets to settle its debt if it depletes its cash reserves prior to the due date of its obligations. Ratio analysis involves the connection of various estimations derived from financial statements through the use of financial ratios. The financial ratio analysis reveals important correlations between reported estimates and can evaluate the company’s financial performance. The current ratio is a financial metric that assesses a company’s liquidity by dividing its current assets by its current liabilities. This demonstrates to investigators and investors how a company may leverage its assets to address debt and obligations (Ciptawan and Frandjaja 2022). An increase in the current ratio indicates a decrease in the amount of current assets available to meet current obligations, and conversely, a decrease in the current ratio suggests an increase in available current assets. The anticipated profit will depend on the total resources invested (Irman and Purwati 2020).
Previous studies (Hiadlovský et al. 2016; Xiang et al. 2022; Khan et al. 2022) emphasize the significance of effective liquidity management in relation to a company’s financial performance. Popular belief suggests that a less liquid asset may yield a higher expected return, indicating a positive relationship between expected returns and liquidity (Amihud and Levi 2023). Previous studies by Tarmizi et al. (2018) and Wijaya and Sedana (2020) indicate that the quick ratio has a significant impact on returns on equity. Sohibien et al. (2022) indicated that the current ratio, a measure of liquidity, exerts an influence. The increase in the current ratio correlates with an enhancement in profitability, as indicated by the return on assets, demonstrating a positive relationship with profitability. Similarly, Raza et al. (2023) found that the current ratio, the cash ratio, has a strong, significant effect on the return on assets in the cement industry of Pakistan.
Li et al. (2020) examined the influence of liquidity on the financial performance of firms listed on the Ghana Stock Exchange. The findings of the study indicated that liquidity positively and significantly influences the financial performance of companies listed on the Ghana Stock Exchange. Additionally, causal relationships existed between company liquidity and financial performance on the Ghana Stock Exchange. Sogomi et al. (2022) concluded that working capital management and liquidity have a statistically significant effect on the financial performance of small and medium-sized enterprises in Kenya. Similarly, Kariuki et al. (2021) found a positive impact of liquidity on the financial performance of Kenyan insurance enterprises. Based on these studies we formulate three hypotheses.
H1.
The current ratio has a positive significant impact on the return on equity of airline companies in South Asian economies.
H2.
The quick ratio has a positive significant impact on the return on equity of airline companies in South Asian economies.
H3.
The cash ratio has a positive significant impact on the return on equity of airline companies in South Asian economies.
2.2. Debt Management and Financial Performance
The debt-to-equity ratio quantifies the relationship between debt and equity. The debt-to-equity ratio is calculated by dividing total debt by total equity (Raza et al. 2022). The debt-to-equity ratio quantifies the relationship between funds sourced from creditors and those provided by business owners. The owner’s capital available for loan collateral diminishes with an increase in the debt-to-equity ratio. Focusing on debt-to-equity is essential for shaping the company’s dividend policy. The debt-to-equity ratio indicates the amount of debt a company owes (Shabrina and Hadian 2021; Raza et al. 2023). The debt-to-equity ratio is a solvency metric that assesses a company’s total debt relative to its equity. Investors frequently employ this ratio to assess the company’s debt in relation to its equity ownership. Analysts and investors regularly employ the debt-to-equity ratio to assess the level of debt a firm holds in relation to its shareholders’ equity. The corporation employs its assets to settle its debt in the event that its equity is insufficient. The utilization of assets affects the return on assets financed by debt, as the achieved return percentage should be substantial; however, the level of asset investment is insufficient. This concept illustrates the impact of the debt-to-equity ratio on return on assets (Hasanudin 2023).
Companies primarily utilize debt to raise capital and enhance potential earnings for shareholders; however, neglecting the appropriate level of debt or leverage can adversely affect the company’s profitability. Sohibien et al. (2022) studied that debt has a significant positive effect on profitability and return on equity. Financial performance is evaluated through the firm’s financial recording activities to determine the extent of the company’s achievement against predetermined standards. Based on the above literature, the primary goal of this research is to clarify the significant relationship between liquidity, debt management, and financial performance of airline companies in South Asia. These studies formulate two more hypotheses.
H4.
The debt-to-assets ratio has a significant impact on the return on equity of airline companies in South Asian economies.
H5.
The debt-to-equity ratio significantly influences the return on equity of airline companies in South Asian economies.
3. Methodology
A total of twenty-two airlines operated in South Asia. We selected seven for this study. All companies’ financial reports were not publicly available (See Table 1). This research examined data from seven South Asian airlines between 2011 and 2022. The study encompasses a timeframe that includes financial crises and the COVID-19 pandemic, both of which significantly affected airline performance. The pandemic resulted in significant declines in air travel demand, destabilizing liquidity positions and exacerbating indebtedness as airlines pursued emergency funding. Financial ratios during this period may indicate external disruptions, necessitating careful analysis of trends. Future research should integrate crisis-dependent financial indicators to improve the evaluation of airline financial health under adverse conditions (Ramlall 2025).

Table 1.
Company profiles.
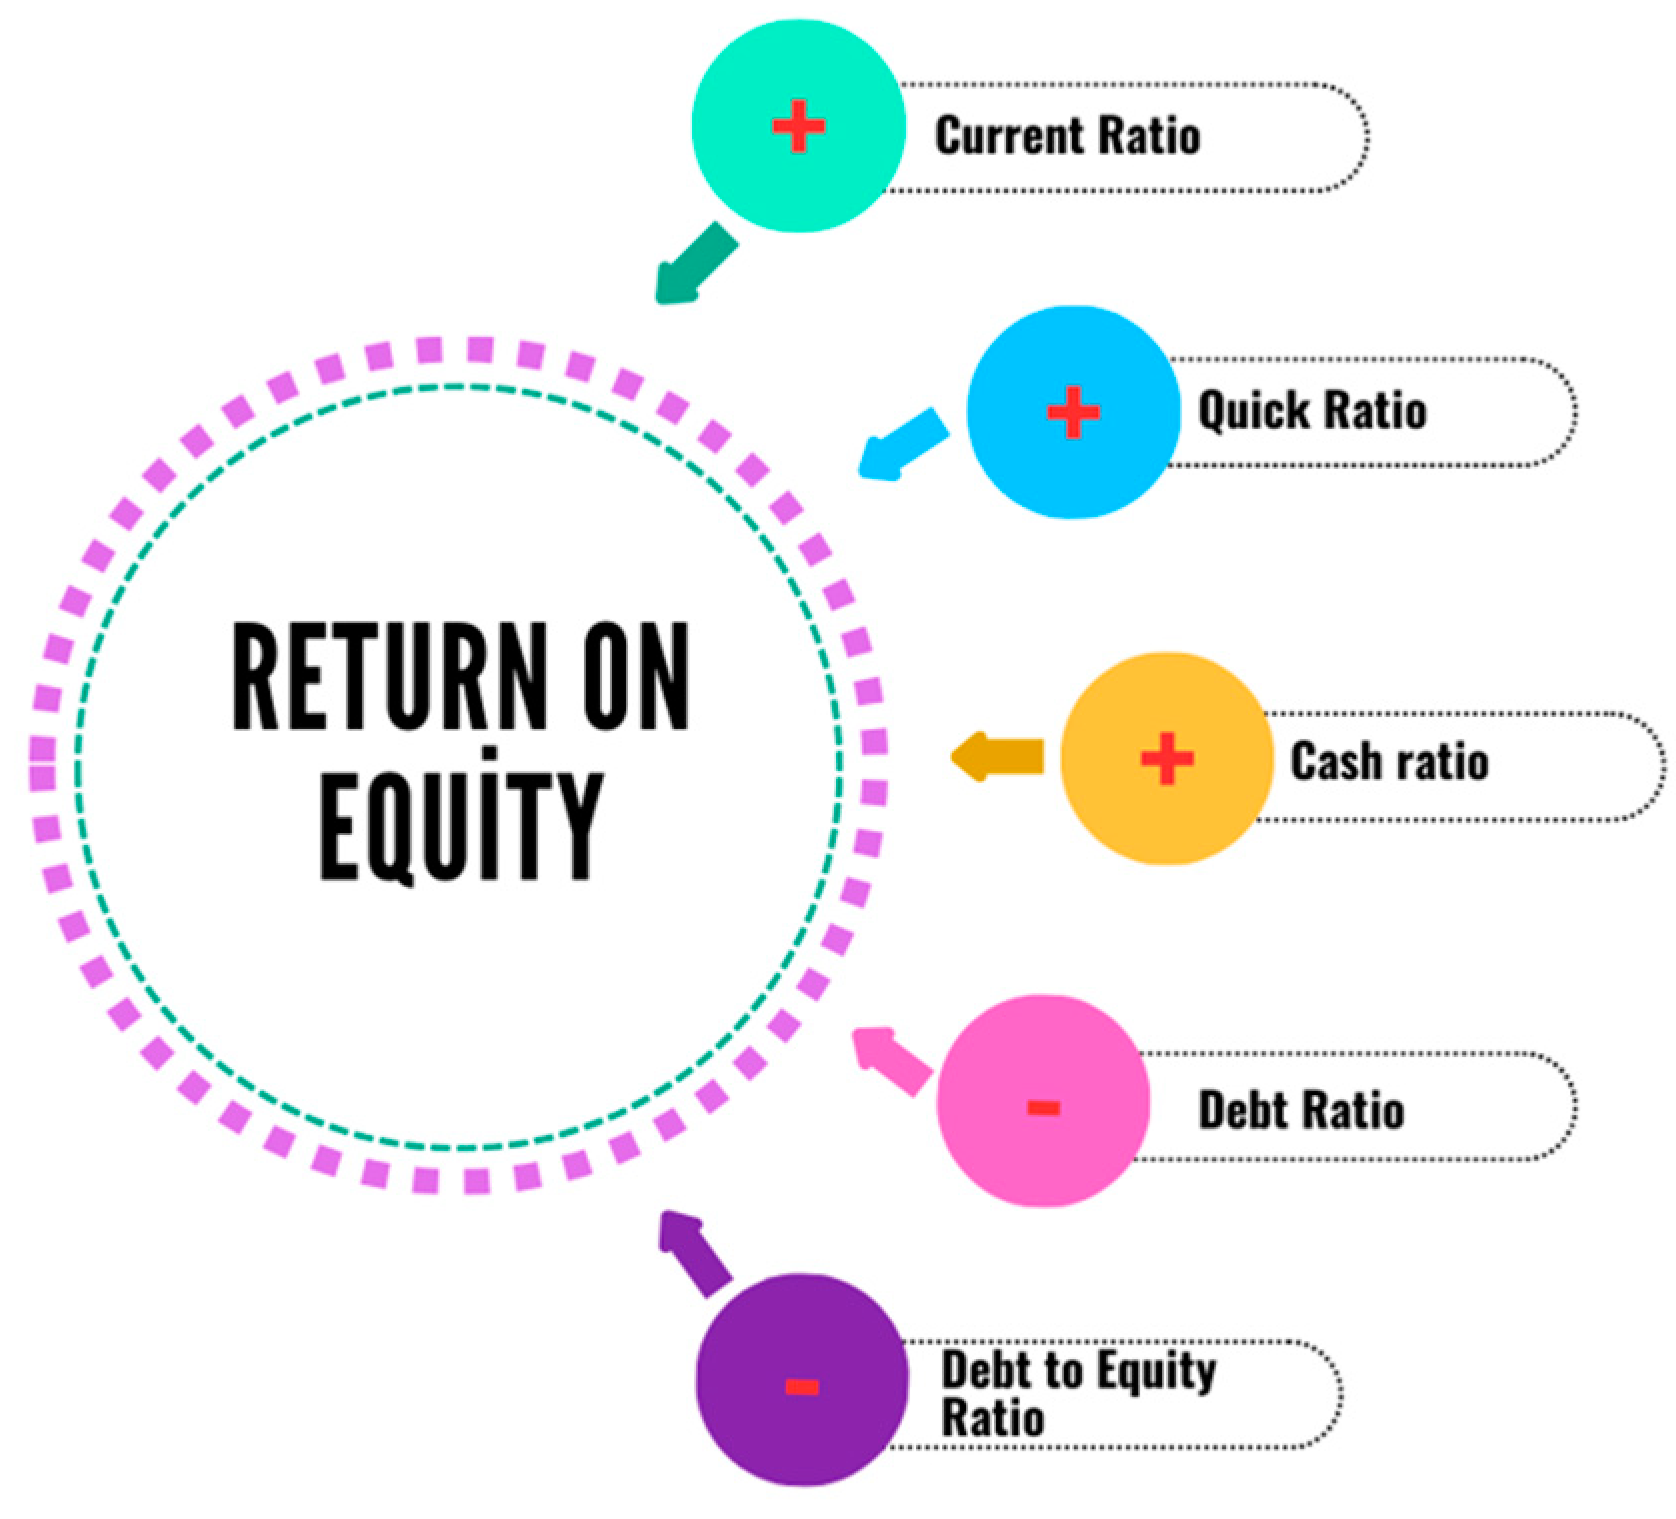
The annual reports of airline firms, including balance sheets, income statements, cash flow statements, and equity statements, were analyzed to extract financial data (Alamgir and Cheng 2023; Iqbal et al. 2021). This research examines independent factors related to liquidity ratios, the current ratio, quick ratio, and cash ratio, alongside debt management ratios, which include the debt ratio and debt-to-equity ratio. This study identifies ROE as the dependent variable (refer to Table 2). The model of this research is presented in Figure 1.
Table 2.
Data description.
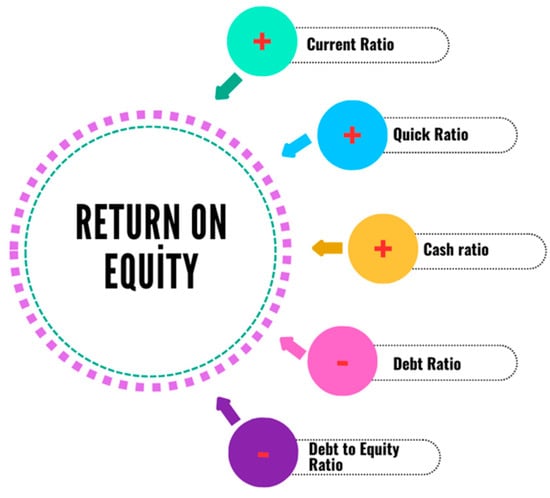
Figure 1.
Conceptual Framework Source: Author compilation.
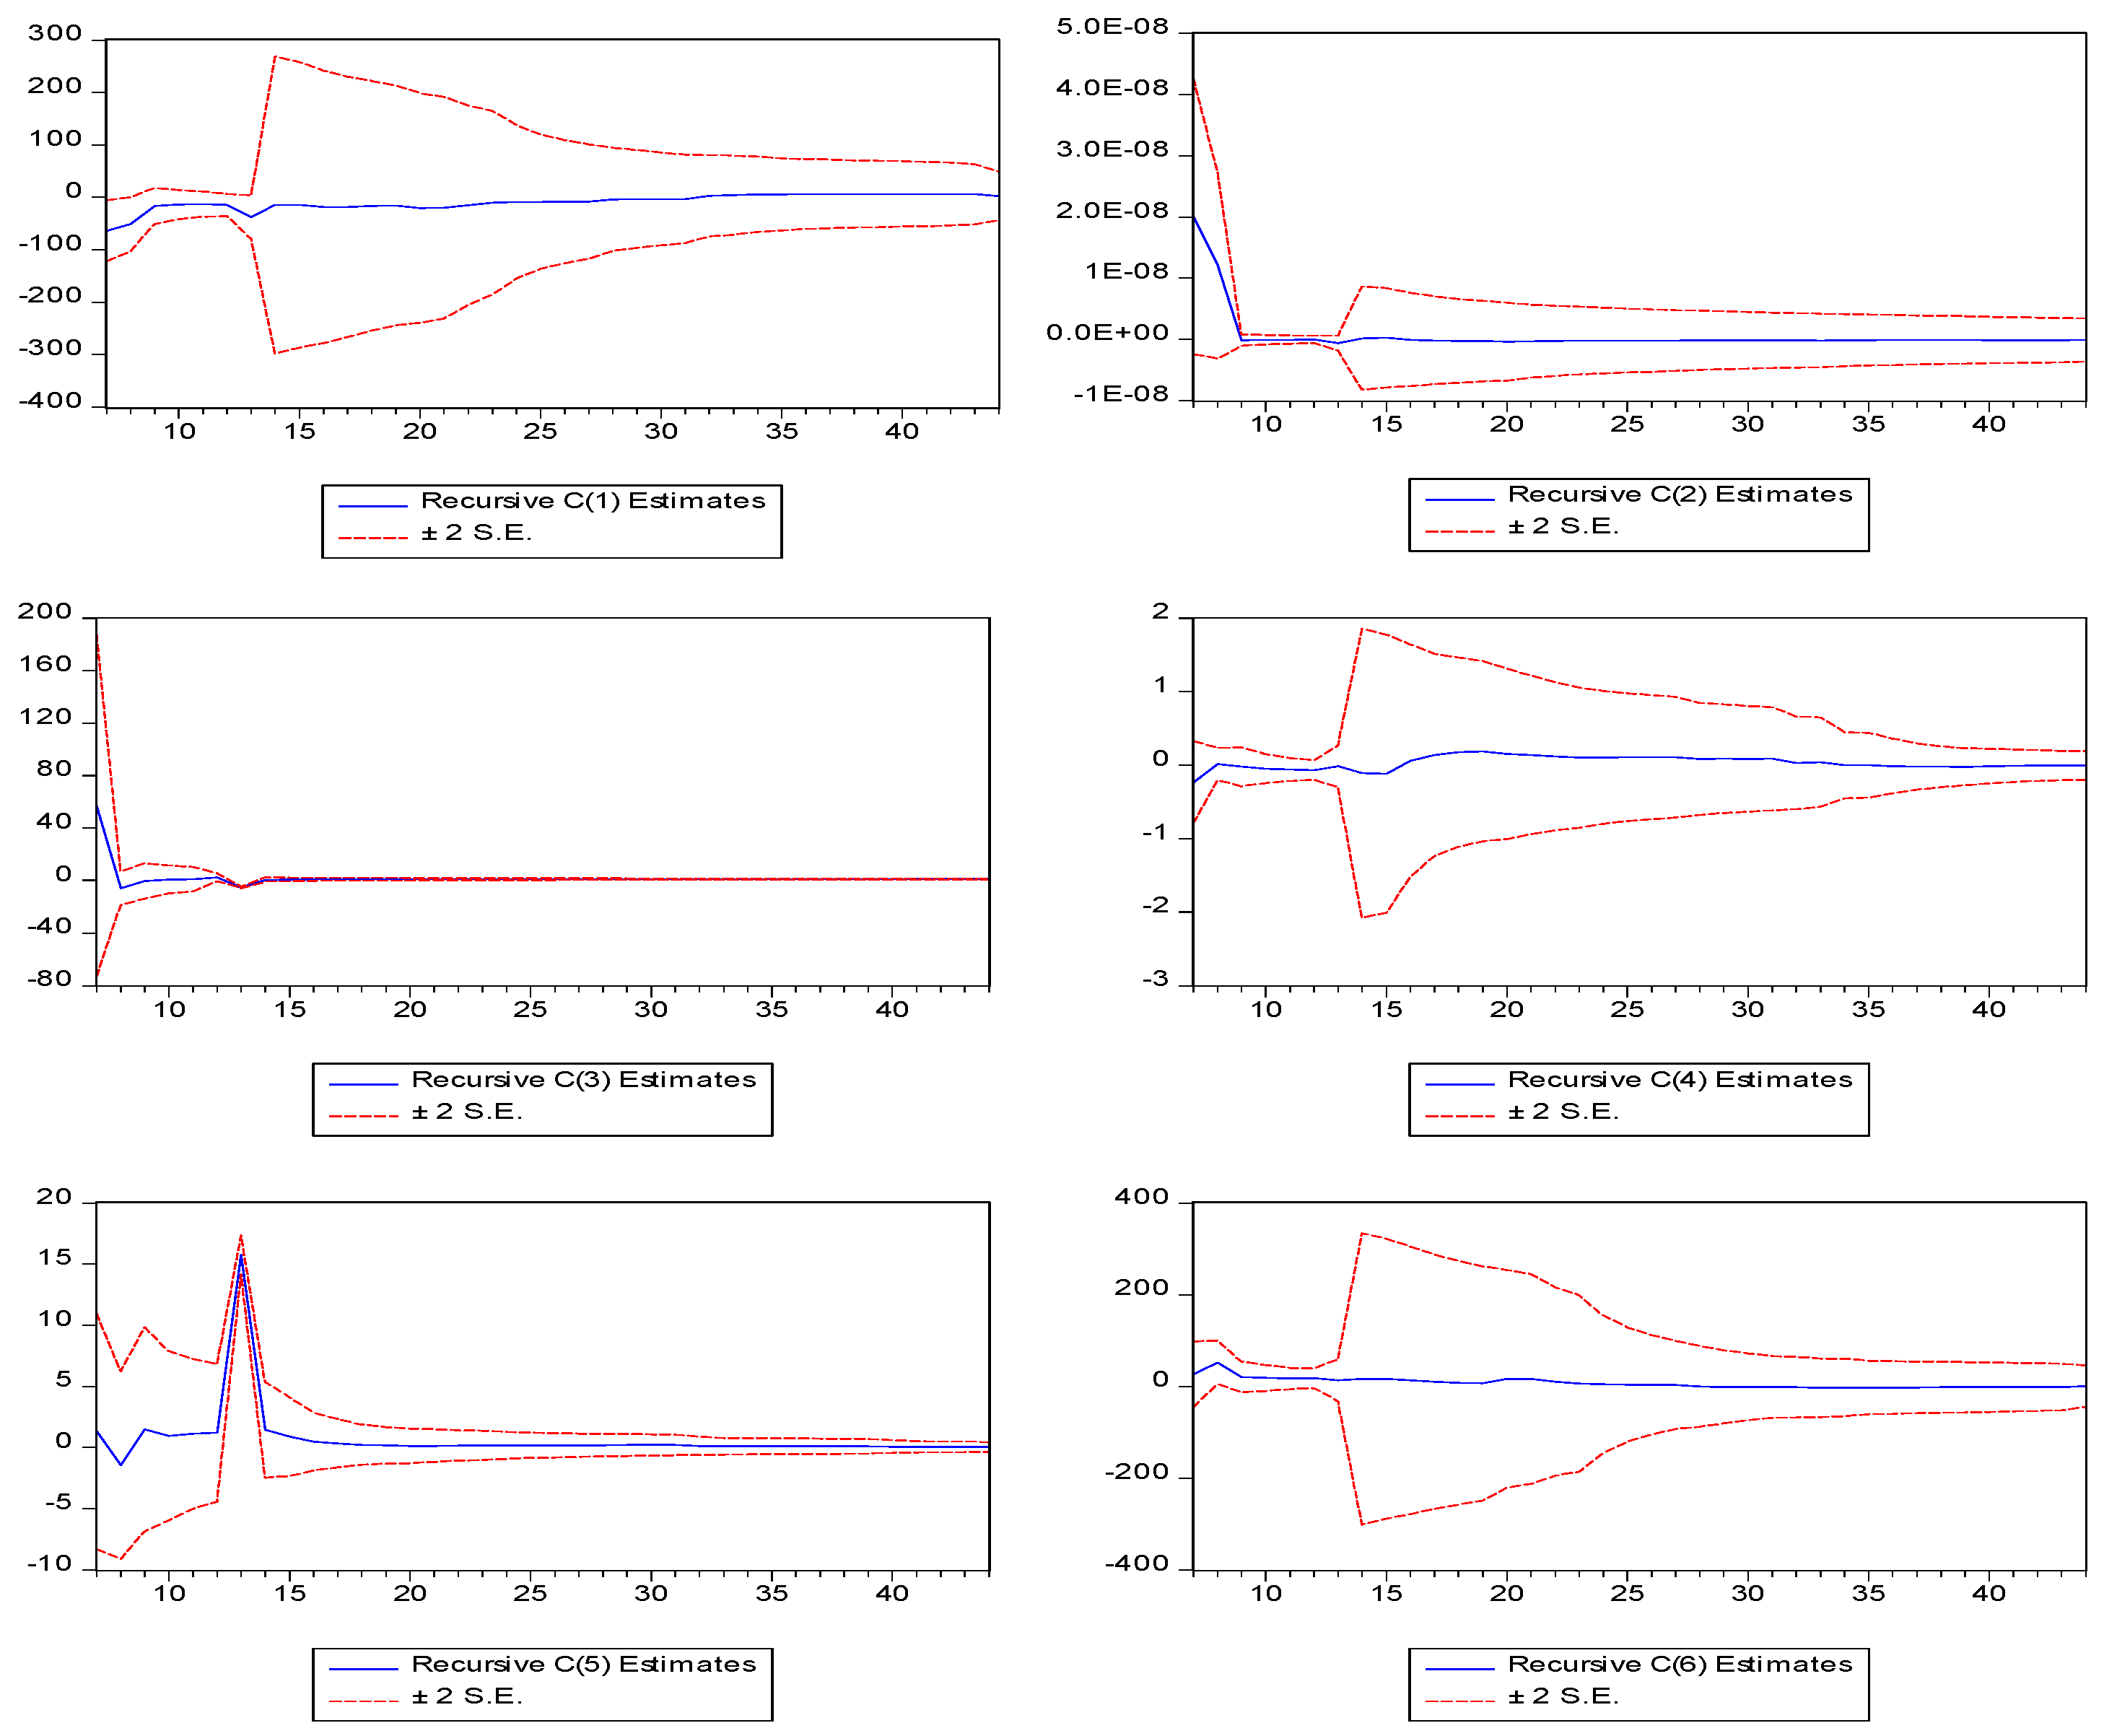
This study employed the Augmented Dickey–Fuller (ADF) and Phillips–Perron (PP) tests to assess stationarity and remove time series dependency in the variables (Dickey and Fuller 1979; Breitung and Franses 1998). The ARDL bound tests were utilized to evaluate the presence of a long-term equilibrium relationship among the variables (Alsulami and Raza 2025). Heteroscedasticity is identified through tests when the OLS assumption of constant variance of residuals across all observations is violated (Raza et al. 2023). Ramsey RESET tests were performed to assess omitted variable bias, indicating the presence of relevant variables (Ramsey 1969). Recursive coefficient estimates were employed to assess the long-term stability of the regression model (Belsley 1980).
The inclusion of exogenous variables in the variance structure enables this study to assess their impact on variations in financial performance, facilitating a comprehensive risk–return analysis. Also, financial ratios directly effects ROE capturing the roles to determine the financial performance in Equation (1). The study articulates the conditional mean equation in the following manner (Raza et al. 2024):
where ROE is the return on equity; CR is the current ratio; QR is the quick ratio; CAR cash ratio; DR is the debt ratio; DER is the debt-to-equity ratio; is the intercept; β1–β5 are the coefficients; ε is the error term.
Later on, A GARCH (Generalized Autoregressive Conditional Heteroscedasticity) (1, 1) model was applied for this research because financial performance displays volatile patterns and liquidity, and debt ratios serve as explanatory factors in the conditional variance definition. Financial ratios play an essential role in the temporal change in financial performance volatility according to this methodology (Engle 1982). GARCH effectively monitors volatility changes, allowing for precise evaluation of fluctuations in financial performance. Conditional heteroscedasticity in regression models is analyzed through GARCH models. Conditional heteroscedasticity leads to a reduction in the precision of estimations and results in inaccurate standard errors. Financial ratios determine performance volatility because they reveal how liquidity and debt elements affect financial performance of airline companies. The GARCH (1, 1) model conditional variance equations are expressed as follows:
where is conditional variances in liquidity and debt ratios; is intercept; shows impact of liquidity and debt shocks on financial performance; is coefficient of lagged conditional variance. are coefficients that measure the impacts of ratios on ROE under GARCH.
The GARCH model has been selected as a suitable framework for identifying changes in volatility in financial performance. Debt ratios and liquidity ratios influence both the level of financial performance and its conditional variance. The selected approach enables researchers to enhance financial risk models for airline companies.
And at the end, to account for both the conditional heteroscedasticity in the residuals and the asymmetric effects, this study used the PARCH (Power Auto-Regressive Conditional Heteroscedasticity) model (Ding et al. 1993). Normal values for PARCH model parameters may vary depending on the kind of data being examined, but in general, the model should account for a substantial portion of the residual variability, and the coefficients should be statistically significant.
where is conditional variances in liquidity and debt ratios; is intercept; is coefficient of last year raised by ; shows error terms and is coefficient of lagged conditional variance. are coefficients that measure the impacts of ratios on ROE under PARCH.
Three requirements are necessary for effective variance modeling. All calculated coefficients (α—alpha, β—beta and —gamma) are maintained as positive throughout the estimation process. An explosive variance process is avoided when the sum of α and β is less than 1. The Maximum Likelihood Estimation computes parameters using statistical analysis, incorporating Bollerslev-Wooldridge robust standard errors to address heteroscedasticity in the data. The computed α and β under the GARCH indicate the duration of financial volatility within model. The coefficient value of α demonstrates that historical financial shocks significantly influence current volatility, whereas elevated values of β indicate persistent volatility patterns. The coefficient levels indicate the current success of airline’s financial stability. The collected results will be presented with statistical significance levels of 5% and confidence intervals of 95%.
4. Empirical Results and Discussions
This research aims to explore how liquidity and debt ratios affect financial performance of the South Asian airline industry. Table 3 shows the mean current ratio of the sample is 0.63, indicating that for each dollar of current liabilities, businesses possess 0.63 in current assets. The standard deviation of 0.49 indicates a modest variation in current ratios among the enterprises. A distribution with a skewness of 0.96 suggests a rightward skew, indicating that while the majority of organizations exhibit ratios near the mean, a minority possess significantly lower ratios. The kurtosis of 3.99 indicates a distribution that is somewhat platykurtic, exhibiting a flatter profile compared to a normal distribution. A standard deviation of 6.25 signifies considerable variability in the quick ratios across the firms. Numerous organizations exhibit low quick ratios, whereas others approach the mean, as evidenced by a skewness of 5.72, indicating a significantly right-skewed distribution. The distribution exhibits significant leptokurtosis, characterized by a taller and thinner profile compared to a normal distribution, as evidenced by a kurtosis value of 35.76. The sample’s mean cash ratio indicates that companies possessed USD 9.96 in cash for each dollar of current obligations. The standard deviation of 43.09 signifies considerable variability in the cash ratios across the organizations. A right-skewed distribution is indicated by a skewness of 4.51, suggesting that while the majority of organizations exhibit ratios near the mean, a minority display significantly lower ratios. A leptokurtic distribution, characterized by a greater peak and thinner tails compared to a normal distribution, is indicated by a kurtosis value of 21.83. The mean debt ratio of the sample is 94.48%, signifying that businesses possess USD 94.48 in debt for every USD 100 in total assets. The standard deviation of 123.26% signifies considerable variability in the debt ratios of the enterprises.
Table 3.
Descriptive statistics.
The right-skewed distribution, with a skewness of 1.72, suggests that while most firms have debt ratios near the mean, a significant number exhibit very high debt ratios. The kurtosis of 5.09 indicates a platykurtic distribution, as the distribution is flatter than that of a normal distribution. The mean debt-to-equity ratio of the sample is 55.71%, indicating that for every USD 100 in equity, businesses carry USD 55.71 in debt. Return on equity (ROE) serves as an indicator of a business’s success, reflecting the profit generated by the firm for each dollar of shareholder equity. The average ROE of 14.16% indicates that the sample firms profit from their equity investment. A better yield on equity ROE is ideal since it shows that a business is making beneficial use of its resources.
The correlation coefficients for financial ratios are displayed in the presented Table 4. It indicates positive statistical correlations between the current ratio and the quick ratio, as well as between the current ratio and the cash ratio in relation to the return on equity ratio. The quick ratio closely aligns with the cash ratio, indicating a strong relationship between liquid assets. Debt ratios exhibit a positive correlation with liquidity ratios, peaking at the cash ratio. The cash ratio and debt-to-equity ratio have a strong positive relationship with each other because airline companies need more debt, and it increases the cash. Return on equity exhibits a negative correlation with debt-related ratios, indicating that leveraging can inversely impact company profitability. The data demonstrates significant correlations between liquidity and debt ratios, as increased leverage typically results in a decline in return on equity.
Table 4.
Correlations.
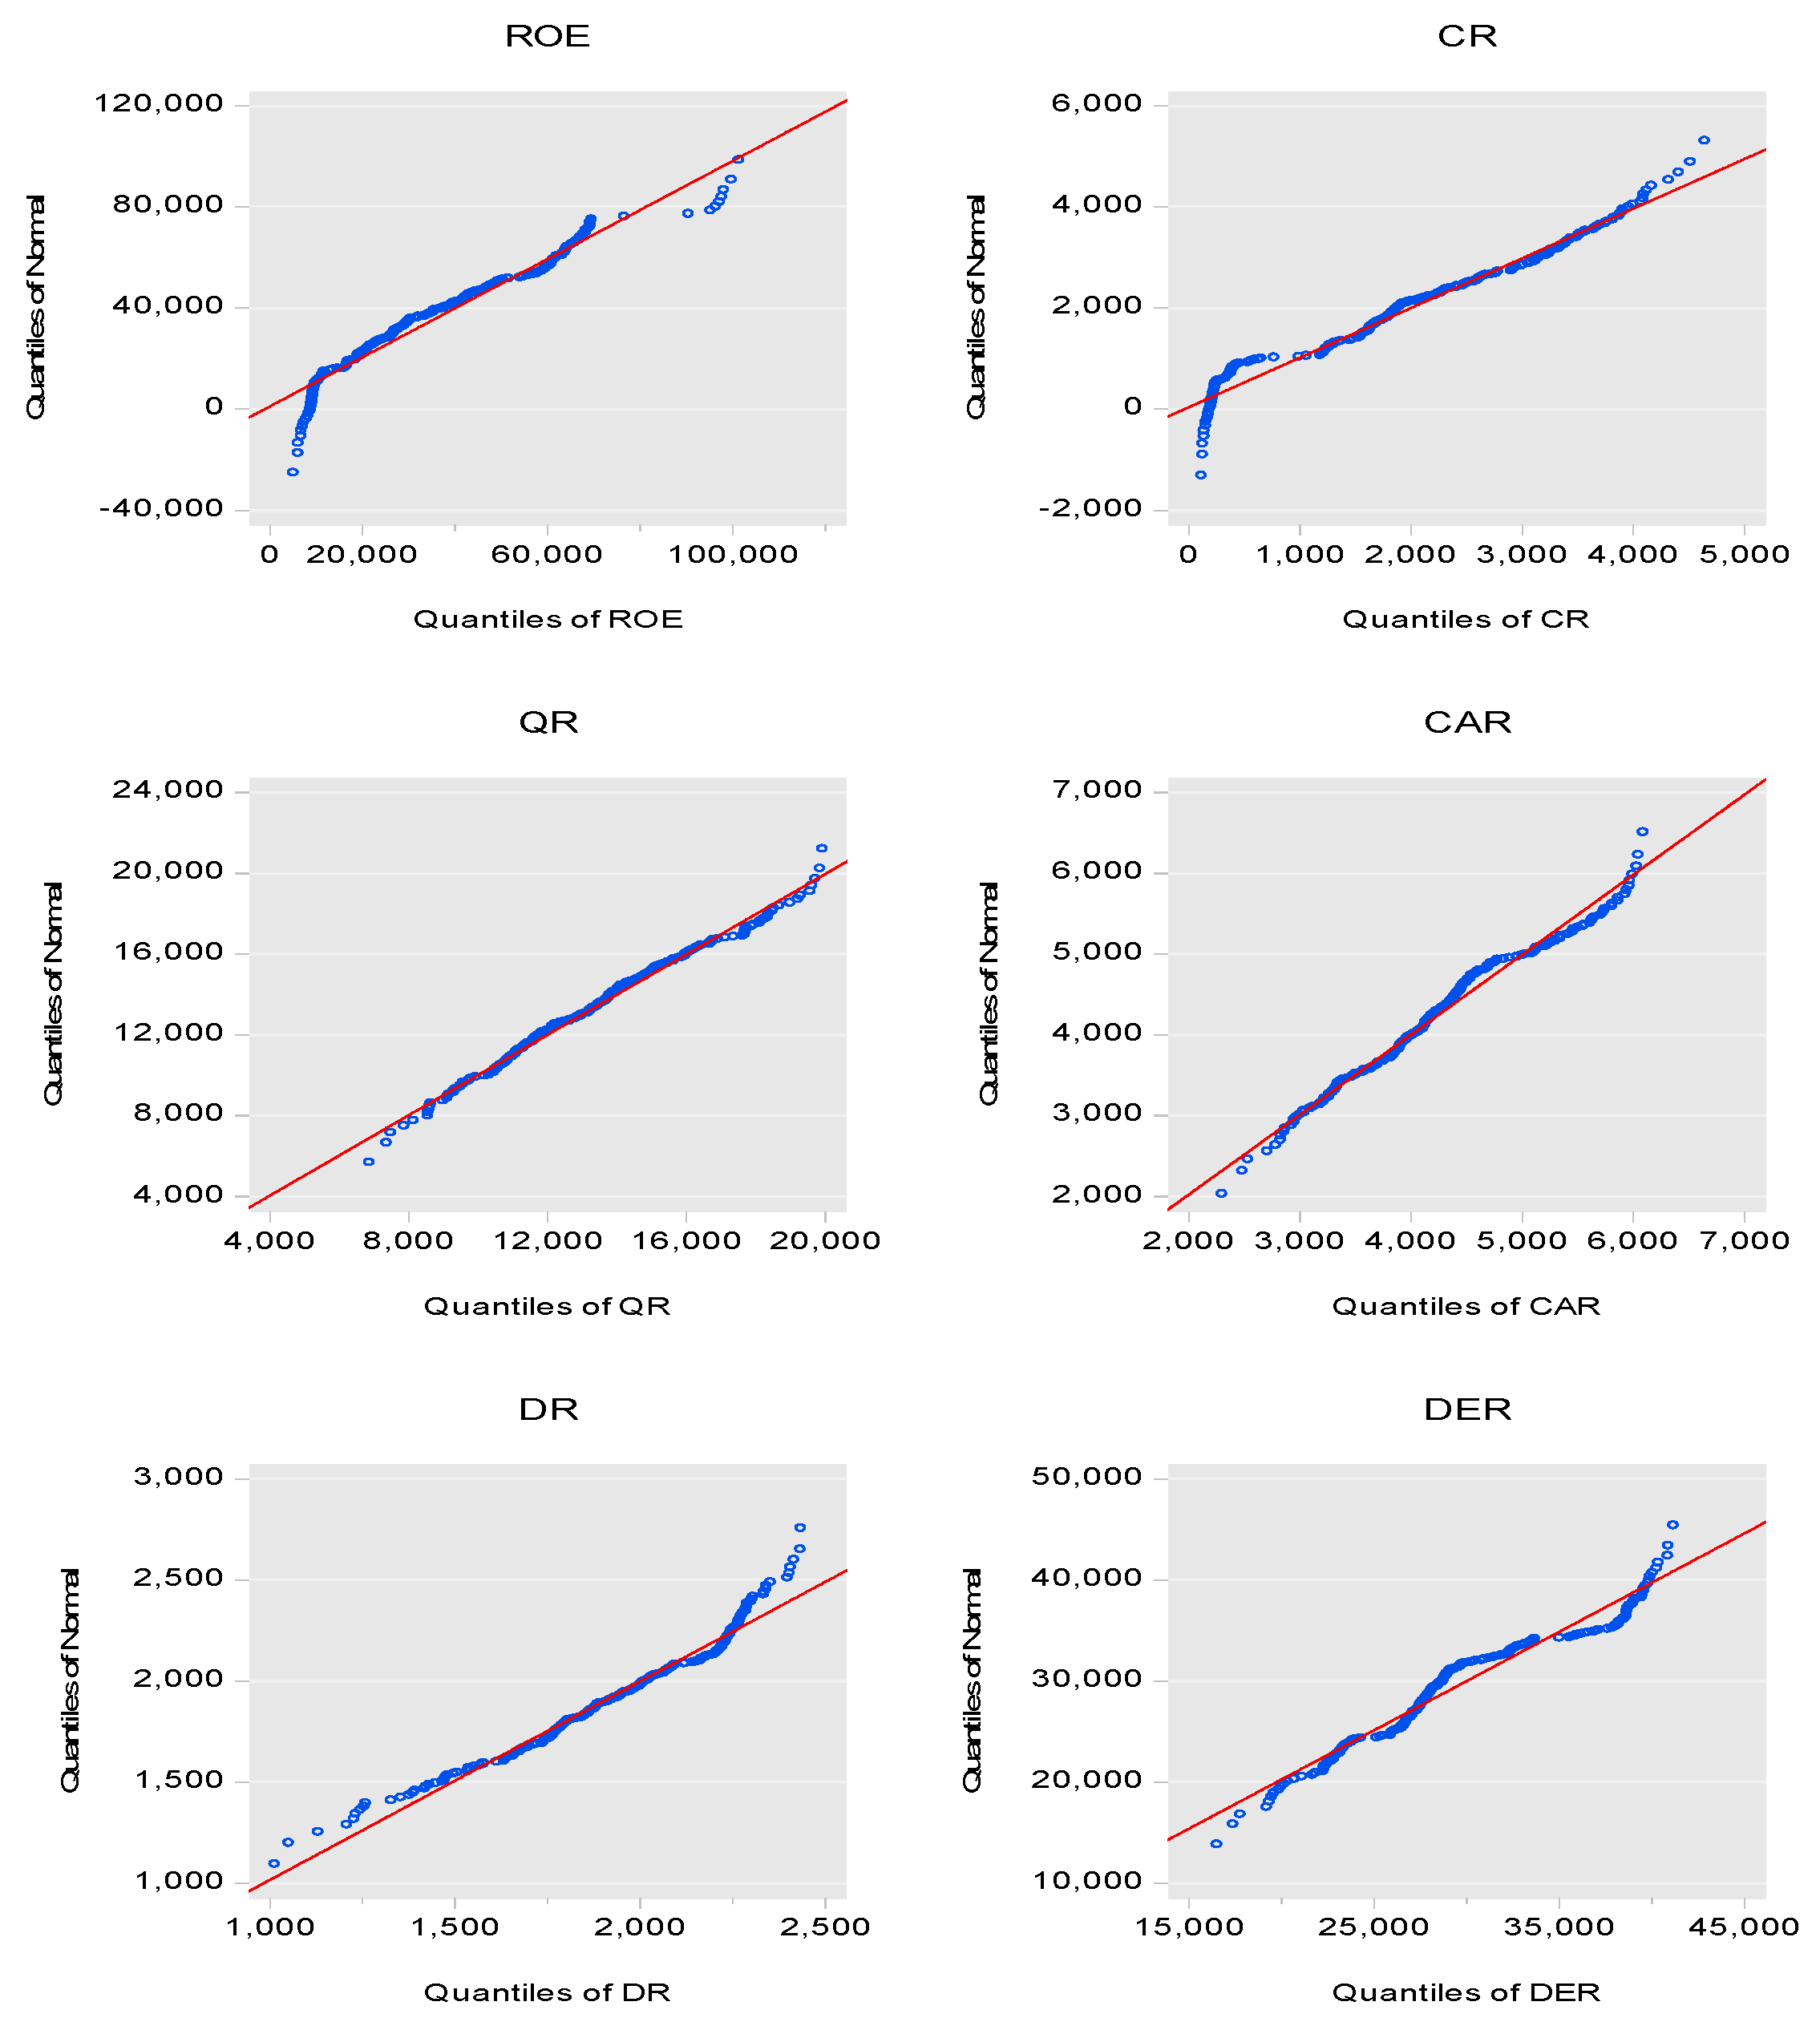
The analysis utilized both the IQR method to address outliers, as there were no missing data. The financial report data were subjected to a cross-verification process to ensure consistency. This evaluation of distributional assumptions utilized QQ plots to confirm the appropriate application of GARCH and PARCH models (See Figure 2). The blue dots are follows at near to red line. It indicates that model no outliers.
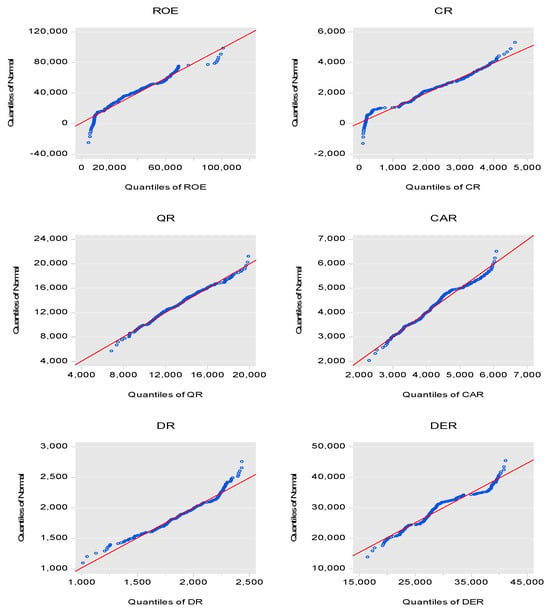
Figure 2.
Q-Q plots. Source: Author compilation.
Table 5 presents the findings from the PP and ADF tests regarding the ROE, liquidity ratios, and debt ratios. The results indicate that each variable is stationary in its initial differences. PP and ADF confirm that the current ratio, cash ratio, debt ratio, and debt–equity ratio have no difference in the stationary process at any level, while quick ratio and ROE have no difference in the stationary process at first difference.
Table 5.
Unit root estimation.
Table 6 presents the ARDL bound cointegration analysis, which indicates a long-term equilibrium relationship between the financial performance of airline companies and their liquidity and debt management ratios. This suggests that the values fall below the critical thresholds at the 1% level, indicating the existence of cointegration among the variables.
Table 6.
ARDL bound tests.
Table 7 shows that the OLS coefficient of liquidity ratios is positive, and debt ratios are negative. It suggests that if airline companies increase by 1% in current ratio, quick ratio, and cash ratio, then ROE will increase by 49%, 84%, and 6%. If airline companies increase by 1% in debt ratio and debt-to-equity ratio, then ROE will decrease by 6% and 3%. While the p-values of OLS are above the significance values. So, we run more tests to check the model’s validity and robustness. This study proceeds with several diagnostic tests.
Table 7.
OLS test estimation.
Table 8 presents estimations of heteroscedasticity. The p-value is below 0.05, indicating the presence of heteroscedasticity in the model. Heteroscedasticity significantly affects the validity of OLS estimates. The reliability of t-statistics in assessing the significance of coefficients may be undermined by potential bias in their standard errors.
Table 8.
Heteroscedasticity estimation.
Table 9 indicates that Prob. F (2, 43) < 0.0000, suggesting that the p-value is below 0.05, thereby demonstrating the statistical significance of the serial lag. The R-squared observed value is 27.34487. A high R-squared value signifies that a substantial proportion of the variance in financial performance is explained by the model. The P Chi-Square (2) is 0.0000, and the p-value is below 0.05, indicating that the observed R-squared is statistically significant.
Table 9.
Serial lagged estimation.
Table 10 illustrates a significant correlation among its error components across different time delays, as indicated by the remarkably high VIF value of 533.8286 for the current ratio. The airline’s financial performance may be misrepresented, leading to a delay in the current ratio. The quick ratio, cash ratio, debt ratio, and debt-to-equity ratio demonstrate VIF values under 10, suggesting moderate to low autocorrelation in the data. It is essential to recognize that even minor auto-lagging may affect the reliability of regression results. Neglecting auto-lagged variables can result in inaccurate conclusions regarding the relationship among debt management ratios, liquidity, and the financial performance of airlines.
Table 10.
Auto-lagged estimation.
The estimates presented in Table 11 of the Ramsey RESET indicated whether the model is specified correctly or not. The likelihood ratio (99.2193), F-statistic (315.8010), and t-statistic (17.77079) are statistically significant, with p-values below 0.05, suggesting that the model is correctly specified. Figure 3 shows a cusum plot to check the stability of the model. The blue line is in between the red lines. Hence, the model is stable.
Table 11.
Ramsey RESET estimation.
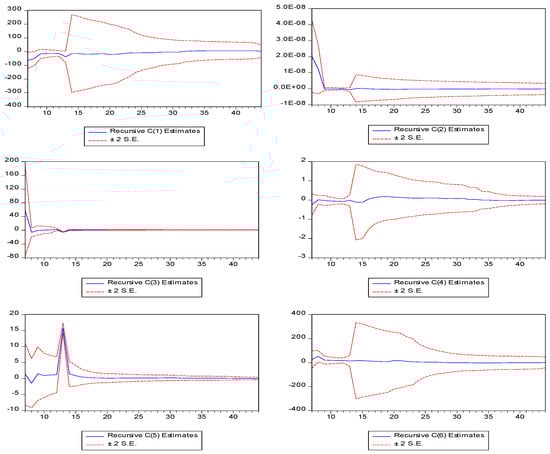
Figure 3.
Cusum plots. Source: Author compilation.
This study employs GARCH and PARCH models, as Table 8 confirms the presence of heteroscedasticity, indicating that the model is stable and correctly specified. The conditional heteroscedasticity identified in the regression model’s residuals, which examines the relationship between debt management ratios, liquidity, and the financial performance of airline businesses, is illustrated via GARCH estimations in Table 12. Conditional heteroscedasticity occurs when the variance of the residuals is not constant across different values of the independent variables. The violation of the homoscedasticity assumption in OLS regression results in biased and inefficient coefficient estimates.
Table 12.
GARCH estimation.
The positive coefficients for the current ratio, quick ratio, and cash ratio suggest that increases in these liquidity ratios are associated with increased volatility of the residuals. Increased liquidity, while generally beneficial for financial performance, can also result in greater variability in financial outcomes. The negative coefficient of the debt ratio indicates that an increase in the debt ratio correlates with a reduction in residual volatility. This may appear contradictory; however, it can be clarified by the idea that individuals with high debt levels tend to make more cautious financial decisions and demonstrate lower risk-taking behavior.
The constant term (−1.8665) in the GARCH estimates indicates the baseline volatility of the residuals, even in the absence of shocks. The financial performance of airline businesses is inherently volatile, even when liquidity and debt management ratios remain constant. Debt ratios decrease volatility, while liquidity ratios (current, quick, and cash) increase it. An elevated debt-to-equity ratio correlates with heightened volatility and financial risk. Baseline volatility remains evident despite the lack of changes in debt or liquidity. R-square confirms that there is a 74% variation in the model, which is good (Raza et al. 2024).
This study confirms the asymmetric shocks of liquidity and debt ratios on financial performance. Table 13 shows that liquidity ratios have positive asymmetric effects on financial performance and debt ratios have negative asymmetric effects on financial performance. Since all p-values are below 0.05. So, all variables are statistically significant. The R-square suggests that 80% of variations in financial performance are by liquidity and debt ratios.
Table 13.
PARCH estimation.
Discussion
Liquidity management is a crucial factor influencing financial performance in South Asian airline companies, as the current ratio yields both positive symmetric effects and positive asymmetric impacts on ROE. High liquidity positions allow airlines to meet their obligations promptly, thereby maintaining operations without incurring costly short-term financing measures. Enhanced liquidity leads to proportional increases in ROE, as effective liquidity management facilitates cost control and optimal asset utilization, thereby boosting shareholder profits. Financial instability or market volatility induces a pronounced asymmetric effect, as minor increases in liquidity result in significant enhancements in ROE. The company sustains financial stability in the face of unforeseen market challenges or downturns, thereby enhancing its resilience and increasing its attractiveness to investors. The robust liquidity positions of South Asian airlines contribute to improved financial outcomes, enabling them to navigate operational challenges and enhance profitability. Consequently, effective liquidity management is essential for sustainable growth and the expansion of long-term market value. Our results are enclosed by Alarussi and Alhaderi (2018) for 120 Malaysian companies registered in the stock market, Pordea et al. (2020) for construction companies in Romania, and Lim and Rokhim (2021) for pharmaceutical companies in Indonesia.
Airline companies exhibiting high liquidity, excluding inventory, show enhanced financial responsiveness to obligations, as they are not required to liquidate fewer liquid assets. This is evidenced by the positive symmetric and asymmetric relationship between the quick ratio and ROE. South Asian airline companies can improve profitability by optimizing liquidity management, as effectively managed liquid assets, such as cash and receivables, consistently enhance return on equity by decreasing reliance on debt. The lockdown effect becomes significant during periods of financial market instability, as cash enhances ROE at an unusually high rate. Airlines with elevated quick ratios demonstrate the robust capacity to withstand unforeseen financial difficulties while safeguarding shareholder returns. The focus on liquidity management, as indicated by the quick ratio calculation, enhances operational stability for airlines while reducing financial risks, resulting in improved long-term profitability and increased investor confidence. Our results are enclosed by Amponsah-Kwatiah and Asiamah (2021) for manufacturing companies in Ghana, Afinindy et al. (2021) for the beverage industry in Indonesia, and Raza et al. (2024) for the banking industry in Turkey.
South Asian airline companies exhibit significant ROE impacts attributable to the cash ratio, which reflects their capacity to meet short-term liabilities solely with cash and cash equivalents. Airline companies achieve improved operational efficiency and reduced financing requirements due to an enhanced financial position, which is bolstered by higher liquidity levels, particularly when managed as cash. An increase in the cash ratio leads to a corresponding improvement in ROE within airline operations, as elevated cash levels enable companies to decrease debt expenses, thereby enhancing shareholder returns. Organizations benefit from cash reserves during financial crises and market disruptions due to their asymmetric impact on return on equity. Maintaining additional cash reserves during periods of economic volatility enhances ROE, enabling airlines to safeguard shareholder value through financial stability. High cash ratios enhance the financial resilience of airlines by providing immediate liquidity during operations and mitigating financial risks, thereby supporting profit sustainability. The cash ratio is crucial for airlines aiming to optimize return on equity performance. Similar results were obtained by Rey-Ares et al. (2021) for fish canning companies in Spain, Kweh et al. (2024) for commercial banks in the USA, and Nguyen and Van Nguyen (2024) for real estate companies in Vietnam.
South Asian airline companies face negative and asymmetric effects on their ROE due to high debt ratios, highlighting the significant risks associated with excessive leverage in the airline sector. Airlines incur elevated debt levels for temporary financial benefits; however, they face rising loan costs that constrain profitability and hinder their ability to deliver substantial returns to shareholders. An equal decline in ROE transpires when the debt ratio increases, as debt expenses diminish profit margins. An increase in debt exposure during financial stress and economic uncertainty significantly reduces ROE. The financial performance of airline companies significantly deteriorates under external shocks due to their reliance on debt, which exposes them to increases in debt interest rates and declines in revenue. Elevated debt ratios heighten the risks of financial distress, leading to diminished investor confidence and concurrently impairing an airline’s capacity to generate sustainable returns. Maintaining control over debt ratios is crucial for airlines, as it safeguards their financial health, reduces potential risks, and ensures a stable and robust return on equity. Similar results were obtained by Raza et al. (2023) for the banking industry in Pakistan and Hiadlovský et al. (2016) for the tourism industry in Slovakia.
South Asian airline companies demonstrate that elevated financial leverage poses risks to their ROE performance, evidenced by a negative relationship with the debt-to-equity ratio. Airline companies with significantly higher levels of debt relative to equity exhibit elevated debt-to-equity ratios. Debt utilization enhances return on equity in favorable economic conditions yet increases operational vulnerability to financial risks during adverse economic periods. ROE decreases as airlines increase their reliance on debt due to elevated interest expenses and financial instability. Increased debt obligations restrict a company’s operational reinvestment and its ability to respond to market conditions, thereby adversely impacting shareholder profits. Elevated debt levels exhibit a detrimental correlation as they diminish operational flexibility and compel businesses to allocate significant resources toward debt repayment rather than investing in growth initiatives. High levels of debt relative to equity elevate the risk of bankruptcy for airlines, consequently diminishing their future profitability and ability to generate sustainable returns for investors. Airlines necessitate a balanced debt-to-equity ratio to attain financial stability and optimize their return on equity. Similar results were obtained by Raza et al. (2022) for the banking industry in Turkey, Waswa et al. (2018) for the sugar industry in Kenya, and Mirović et al. (2024) for the banking industry in Europe.
5. Conclusions
Accounting facilitates the assessment of the financial performance of South Asian airline companies via financial ratio analysis for the period spanning 2011 to 2022. Effective liquidity management leads to improvements in financial performance, while excessive debt usage results in negative impacts on financial performance. The integration of GARCH and PARCH models revealed statistically significant relationships between symmetric and asymmetric components of performance variations influenced by fluctuations in liquidity ratios and debt levels. The analysis highlights the necessity for airlines in the region to implement effective accounting practices for the management of liquid resources and debts to ensure stability and growth. Prioritizing financial practices leads to improved operational efficiency, decreased financial risks, and increased profitability. Future research should examine how various airlines manage financial metrics while considering external factors to enhance the development of the South Asian aviation sector through the establishment of more robust financial practices.
The Trade-Off Theory of Capital Structure illustrates the necessity for airline firms to achieve a balance between the advantages and disadvantages of debt. Effective cash flow management, evidenced by favorable liquidity ratios, suggests that airlines can reduce their reliance on debt and mitigate bankruptcy risks. The potential for tax savings associated with high debt ratios is acknowledged; however, companies assume increased insolvency risks as a consequence of this metric. The study indicates that South Asian airlines ought to achieve balance in their capital structure by enhancing liquidity to minimize borrowing requirements and strengthen debt management. This approach enables airlines to improve their financial stability and bolster industry and economic resilience.
Financial ratio analysis is a critical method for assessing South Asian airline companies, utilizing liquidity ratios and debt ratios in accordance with accounting principles. Airlines require liquidity ratios to safeguard their short-term obligations, as this guarantees sufficient cash flow for ongoing operations. Organizations that manage their debt ratios effectively mitigate overall financial risks, as excessive debt can diminish profits and jeopardize long-term financial stability. South Asian airline companies must accurately monitor these ratios to generate transparent financial statements, facilitating improved decision-making and ensuring regulatory compliance. Effective financial management of liquidity, combined with appropriate debt strategies, allows airlines to enhance resilience against market volatility and achieve improved long-term profitability. Financial planning methods informed by these ratios will enable airlines to manage economic challenges while maintaining their long-term growth. A standardized financial management system must be implemented to enhance financial stability in airlines and contribute to the progress and sustainability of the South Asian airline sector. This study examines the direct relationship between liquidity and debt management ratios. The future study can be expanded to include moderating variables such as leverage, firm size, market conditions, and industry type. Control variables such as operating margin, revenue growth, tax rate, and dividend payout ratio can enhance the robustness of future studies.
This study focuses solely on South Asian airline companies, thereby narrowing the research scope to a specific subsector, which may have implications for understanding general aviation financial dynamics. Liquidity ratios and debt ratios do not account for other essential financial metrics, including profitability and operational efficiency, which are necessary for a comprehensive assessment of financial performance.
Fuel expenses constitute a significant portion of airlines’ total operating costs, often surpassing financial interest expenses. Market risks, such as fluctuations in global oil prices, directly impact fuel costs, thereby increasing the volatility of airlines’ profitability. While financial expenses remain pertinent, their influence on the overall cost structure is typically overshadowed by fluctuations in fuel prices. Historical economic crises illustrate that significant rises in fuel prices can diminish profit margins, irrespective of debt levels remaining constant. Movements in fuel prices must be integrated into financial performance analysis, as they significantly affect the cost structure and the implications of financial leverage. Future studies should assess multiple financial ratios and analyze differences between full-service carriers and budget carriers to enhance research quality. Investigating the connection between airline financial performance and non-financial factors, customer satisfaction, and operational efficiency could yield valuable insights for enhancing airline financial management strategies. Future research may utilize multiple time series through the application of the MARCH model.
Funding
This research received no external funding.
Data Availability Statement
The data presented in this study are available on request from the corresponding author, due to confidentiality and privacy restrictions.
Conflicts of Interest
The author declares no conflicts of interest.
References
- Afinindy, Inne, Ubud Salim, and Kusuma Ratnawati. 2021. The effect of profitability, firm size, liquidity, sales growth on firm value mediated capital structure. International Journal of Business, Economics and Law 24: 15–22. [Google Scholar]
- Alamgir, Muhammad, and Ming-Chang Cheng. 2023. Co-Movement and performance comparison of conventional and Islamic stock indices during the pre-and post-covid-19 pandemic era. Risks 11: 146. [Google Scholar] [CrossRef]
- Alarussi, Ali Saleh, and Sami Mohammed Alhaderi. 2018. Factors affecting profitability in Malaysia. Journal of Economic Studies 45: 442–58. [Google Scholar] [CrossRef]
- Alsulami, Faizah, and Ali Raza. 2025. Financial Markets Effect on Cryptocurrency Volatility: Pre-and Post-Future Exchanges Collapse Period in USA and Japan. International Journal of Financial Studies 13: 24. [Google Scholar]
- Aman, Qaiser, and Sultan Altass. 2023. The impact of debt and equity decisions on business performance: Evidence from International Airline Corporation. Amazonia Investiga 12: 10–20. [Google Scholar] [CrossRef]
- Amihud, Yakov, and Shai Levi. 2023. The effect of stock liquidity on the firm’s investment and production. The Review of Financial Studies 36: 1094–147. [Google Scholar] [CrossRef]
- Amin, Halkawt Ismail Mohammed, and Kemal Cek. 2023. The effect of golden ratio-based capital structure on firm’s financial performance. Sustainability 15: 7424. [Google Scholar] [CrossRef]
- Amponsah-Kwatiah, Kofi, and Michael Asiamah. 2021. Working capital management and profitability of listed manufacturing firms in Ghana. International Journal of Productivity and Performance Management 70: 1751–71. [Google Scholar] [CrossRef]
- Belsley, David A. 1980. On the efficient computation of the nonlinear full-information maximum-likelihood estimator. Journal of Econometrics 14: 203–25. [Google Scholar] [CrossRef]
- Boumlik, Zouhair, Badia Oulhadj, and Olivier Colot. 2025. Determinants of Debt Financing Behavior of Unlisted Moroccan Family SMEs: A Panel Data Analysis. International Journal of Financial Studies 13: 6. [Google Scholar]
- Breitung, Jörg, and Philip Hans Franses. 1998. On Phillips–Perron-type tests for seasonal unit roots. Econometric Theory 14: 200–21. [Google Scholar] [CrossRef]
- Bui, Thi Ngoc, Xuan Hung Nguyen, and Kieu Trang Pham T. 2023. The effect of capital structure on firm value: A study of companies listed on the Vietnamese stock market. International Journal of Financial Studies 11: 100. [Google Scholar] [CrossRef]
- Ciptawan, Ciptawan, and Brian Owen Frandjaja. 2022. The Impact of Current Ratio and Gross Profit Margin Towards Financial Distress in Technology Sector Companies Listed in the Indonesia Stock Exchange for the Period 2016–2020. Journal of Industrial Engineering & Management Research 3: 197–214. [Google Scholar]
- Dickey, David A., and Wayne A. Fuller. 1979. Distribution of the estimators for autoregressive time series with a unit root. Journal of the American Statistical Association 74: 427–31. [Google Scholar]
- Ding, Zhuanxin, Clive W. J. Granger, and Robert F. Engle. 1993. A long memory property of stock market returns and a new model. Journal of Empirical Finance 1: 83–106. [Google Scholar] [CrossRef]
- Engle, Robert F. 1982. Autoregressive conditional heteroscedasticity with estimates of the variance of United Kingdom inflation. Econometrica: Journal of the Econometric Society, 987–1007. [Google Scholar] [CrossRef]
- Hasanudin, Hasanudin. 2023. Applying the Principles of Good Corporate Governance in Corporate Financial Management. MAR-Ekonomi: Jurnal Manajemen, Akuntansi Dan Rumpun Ilmu Ekonomi 1: 49–55. [Google Scholar]
- Hermuningsih, Sri, Pristin Prima Sari, and Anisya Dewi Rahmawati. 2023. The moderating role of bank size: Influence of fintech, liquidity on financial performance. Jurnal Siasat Bisnis 27: 106–17. [Google Scholar] [CrossRef]
- Hiadlovský, Vladimír, Ivana Rybovičová, and Miroslava Vinczeová. 2016. Importance of Liquidity Analysis in the Process of Financial Management of Companies Operating in the Tourism Sector in Slovakia: An Empirical Study. International Journal for Quality Research 10: 799–812. [Google Scholar] [CrossRef]
- Iqbal, Najam, Muhammad Saqib Manzoor, and Muhammad Ishaq Bhatti. 2021. Asymmetry and leverage with news impact curve perspective in Australian stock returns’ volatility during COVID-19. Journal of Risk and Financial Management 14: 314. [Google Scholar] [CrossRef]
- Irman, Mimelientesa, and Astri Ayu Purwati. 2020. Analysis of the influence of current ratio, debt to equity ratio, and total asset turnover toward Return on assets on the automotive and component company registered in the Indonesia Stock Exchange Within 2011–2017. International Journal of Economics Development Research (IJEDR) 1: 36–44. [Google Scholar] [CrossRef]
- Kamel, Mohamed S., Josiah Levi Davidson, and Mohit S. Verma. 2024. Strategies for Bovine Respiratory Disease (BRD) Diagnosis and Prognosis: A Comprehensive Overview. Animals 14: 627. [Google Scholar] [CrossRef] [PubMed]
- Kariuki, David W. K., Willy Muturi, and Agnes Njeru. 2021. Influence of liquidity on the financial performance of insurance companies in Kenya. Journal of Agriculture Science and Technology 20: 94–101. [Google Scholar]
- Khan, Muhammad Asim, Arsalan Hussain, Muhammad Muzaffar Ali, and Mohsin Ali Tajummul. 2022. Assessing the impact of liquidity on the value of assets return. Global Business Management Review (GBMR) 14: 54–76. [Google Scholar] [CrossRef]
- Kweh, Qian Long, Wen-Min Lu, Kaoru Tone, and Hsian-Ming Liu. 2024. Evaluating the resource management and profitability efficiencies of US commercial banks from a dynamic network perspective. Financial Innovation 10: 19. [Google Scholar] [CrossRef]
- Li, Kaodui, Mohammed Musah, Yusheng Kong, Isaac Adjei Mensah, Stephen Kwadwo Antwi, Jonas Bawuah, Mary Donkor, Cephas Paa Kwasi Coffie, and Agyemang Andrew Osei. 2020. Liquidity and firms’ financial performance nexus: A panel evidence from non-financial firms listed on the Ghana stock exchange. Sage Open Journal 20: 1–20. [Google Scholar] [CrossRef]
- Lim, Harianto, and Rofikoh Rokhim. 2021. Factors affecting profitability of pharmaceutical company: An Indonesian evidence. Journal of Economic Studies 48: 981–95. [Google Scholar] [CrossRef]
- Mirović, Vera, Branimir Kalaš, Nada Milenković, Jelena Andrašić, and Miloš Đaković. 2024. Modelling Profitability Determinants in the Banking Sector: The Case of the Eurozone. Mathematics 12: 897. [Google Scholar] [CrossRef]
- Mugambi, Pamela Makena, Willy Muturi, and Agnes Njeru. 2023. Effect of liquidity on financial performance of star-rated hotels in Nairobi County, Kenya. International Academic Journal of Economics and Finance 3: 305–22. [Google Scholar]
- Nanda, Swagatika, and Ajaya Kumar Panda. 2018. The Determinants of Corporate Profitability: An Investigation of Indian Manufacturing Firms. International Journal of Emerging Markets 13: 66–86. [Google Scholar] [CrossRef]
- Nguyen, Thuy Thi Cam, and Cong Van Nguyen. 2024. Does the education level of the CEO and CFO affect the profitability of real estate and construction companies? Evidence from Vietnam. Heliyon 10: e28376. [Google Scholar] [CrossRef] [PubMed]
- Pordea, Daniela, Delia David, and Dorel Mateș. 2020. The impact of operating cash flow and current ratio on the profitability in construction industry. Studia Universitatis Vasile Goldiș Arad, Seria Științe Economice 30: 22–32. [Google Scholar] [CrossRef]
- Ramlall, Indranarain. 2025. Unravelling the impact of COVID-19 on airline financial health in the world: Insights from Chernoff faces technique. Journal of Accounting & Organizational Change, ahead-of-print. [Google Scholar] [CrossRef]
- Ramsey, David. 1969. On the social rate of discount: Comment. The American Economic Review 59: 919–24. [Google Scholar]
- Raza, Ali, Ahsan-ul Haque Shaikh, Turgut Tursoy, Hashem Ali Almashaqbeh, and Sujood Mohammad Alkhateeb. 2022. Empirical analysis of Financial Risk on Bank’s Financial Perfor-mance: An Evidence from Turkish Banking Industry. ILMA Journal of Social Sciences & Economics (IJSSE) 1: 16–38. [Google Scholar]
- Raza, Ali, Turgut Tursoy, and Sadam Ali Balal. 2023. Sustainable Working Capital and Financial Performance in Cement Industry of Pakistan: An OLS Approach*. Innovation Economics Frontiers 26: 1–17. [Google Scholar] [CrossRef]
- Raza, Ali, Turgut Tursoy, Erum Shaikh, and Ahsan-ul-Haque Shaikh. 2024. Investigating the Symmetric Effects of Working Capital on Profitability in Turkish Banking: An ARDL Empirical Analysis. Studia Universitatis “Vasile Goldis” Arad–Economics Series 34: 74–97. [Google Scholar] [CrossRef]
- Rey-Ares, Lucia, Sara Fernández-López, and David Rodeiro-Pazos. 2021. Impact of working capital management on profitability for Spanish fish canning companies. Marine Policy 130: 104583. [Google Scholar] [CrossRef]
- Sany, Sany, and Natanael Yonatan. 2023. Liquidity and Profitability of Retail Companies: Evidence from Indonesia. International Journal of Organizational Behavior and Policy 2: 77–86. [Google Scholar] [CrossRef]
- Shabrina, Widya, and Niki Hadian. 2021. The influence of current ratio, debt to equity ratio, and return on assets on dividend payout ratio. International Journal of Financial, Accounting, and Management 3: 193–204. [Google Scholar] [CrossRef]
- Sogomi, Frankline Chasha, Mary Kavele Patrick, and Charles Guandaru Kamau. 2022. Working Capital Management, Liquidity, and Financial Performance: Context of Kenyan SMEs. Available online: https://papers.ssrn.com (accessed on 1 December 2024).
- Sohibien, Gama Putra Danu, Lilis Laome, Achmad Choiruddin, and Heri Kuswanto. 2022. COVID-19 pandemic’s impact on return on asset and financing of Islamic commercial banks: Evidence from Indonesia. Sustainability 14: 1128. [Google Scholar] [CrossRef]
- Tang, Mengxuan, Yang Hu, Shaen Corbet, Yang Greg Hou, and Les Oxley. 2024. Fintech, bank diversification, and liquidity: Evidence from China. Research in International Business and Finance 67: 102082. [Google Scholar] [CrossRef]
- Tarmizi, Rosmiati, Herry Goenawan Soedarsa, Indrayenti Indrayenti, and Deasy Andrianto. 2018. Pengaruh Likuiditas dan Profitabilitas Terhadap Return Saham. Jurnal Akuntansi Dan Keuangan 9: 13. [Google Scholar] [CrossRef]
- Tawfiq, Tawfiq Taleb, Hala Tawaha, Asem Tahtamouni, and Nashat Ali Almasria. 2024. The Influence of Environmental, Social, and Governance Disclosure on Capital Structure: An Investigation of Leverage and WACC. Journal of Risk and Financial Management 17: 570. [Google Scholar] [CrossRef]
- Waswa, Calistus Wekesa, Mohamed Suleiman Mukras, and David Oima. 2018. Effect of Liquidity on Financial Performance of the Sugar Industry in Kenya. International Journal of Education and Research 6: 29–44. [Google Scholar]
- Wijaya, Dennis Prasetya, and Ida Bagus Panji Sedana. 2020. Effects of quick ratio, Return on assets, and exchange rates on stock returns. American Journal of Humanities and Social Sciences Research (AJHSSR) 4: 323–29. [Google Scholar]
- Xiang, Hangqin, Erum Shaikh, Muhammad Nawaz Tunio, Waqas Ahmad Watto, and Yiqing Lyu. 2022. Impact of corporate governance and CEO remuneration on bank capitalization strategies and payout decision in income shocks period. Frontiers in Psychology 13: 901868. [Google Scholar] [CrossRef]
Disclaimer/Publisher’s Note: The statements, opinions and data contained in all publications are solely those of the individual author(s) and contributor(s) and not of MDPI and/or the editor(s). MDPI and/or the editor(s) disclaim responsibility for any injury to people or property resulting from any ideas, methods, instructions or products referred to in the content. |
© 2025 by the author. Licensee MDPI, Basel, Switzerland. This article is an open access article distributed under the terms and conditions of the Creative Commons Attribution (CC BY) license (https://creativecommons.org/licenses/by/4.0/).