
Integrative Analysis of Traditional and Cash Flow Financial Ratios: Insights from a Systematic Comparative Review


Abstract
:1. Introduction
2. Literature Review
3. Methodology
3.1. Research Questions
- What is the comparative effectiveness of traditional financial and cash flow ratios in predicting financial performance?
- What statistical methods and datasets have been used in previous studies to compare the ratios?
- What are the trends and gaps in the research related to financial ratio analysis?
3.2. Search Strategy
- Inclusion criteria:
- -
- Publication year: studies published between 2000 and 2024.
- -
- Study design: peer-reviewed journal articles that included empirical research.
- -
- Comparative analysis: studies must directly compare traditional financial ratios and cash flow ratios.
- -
- Predictive analysis: studies that evaluate the effectiveness of these ratios in predicting financial performance, such as financial health or distress.
- -
- Statistical methods: inclusion of sophisticated statistical or machine learning methods, such as logistic regression, discriminant analysis, or neural networks.
- -
- Language: articles published in English
- Exclusion criteria:
- -
- Non-empirical studies: theoretical papers, reviews, or meta-analyses without new empirical results.
- -
- Single-ratio studies: studies that focus exclusively on either traditional financial ratios or cash flow ratios but do not compare them.
- -
- Non-peer-reviewed material: conference papers, books, book chapters, and gray literature.
- -
- Incomplete data: studies with incomplete data or those that did not provide a clear methodology and result analysis.
- -
- Non-comparative studies: research that does not provide a direct comparison between traditional and cash flow ratios.
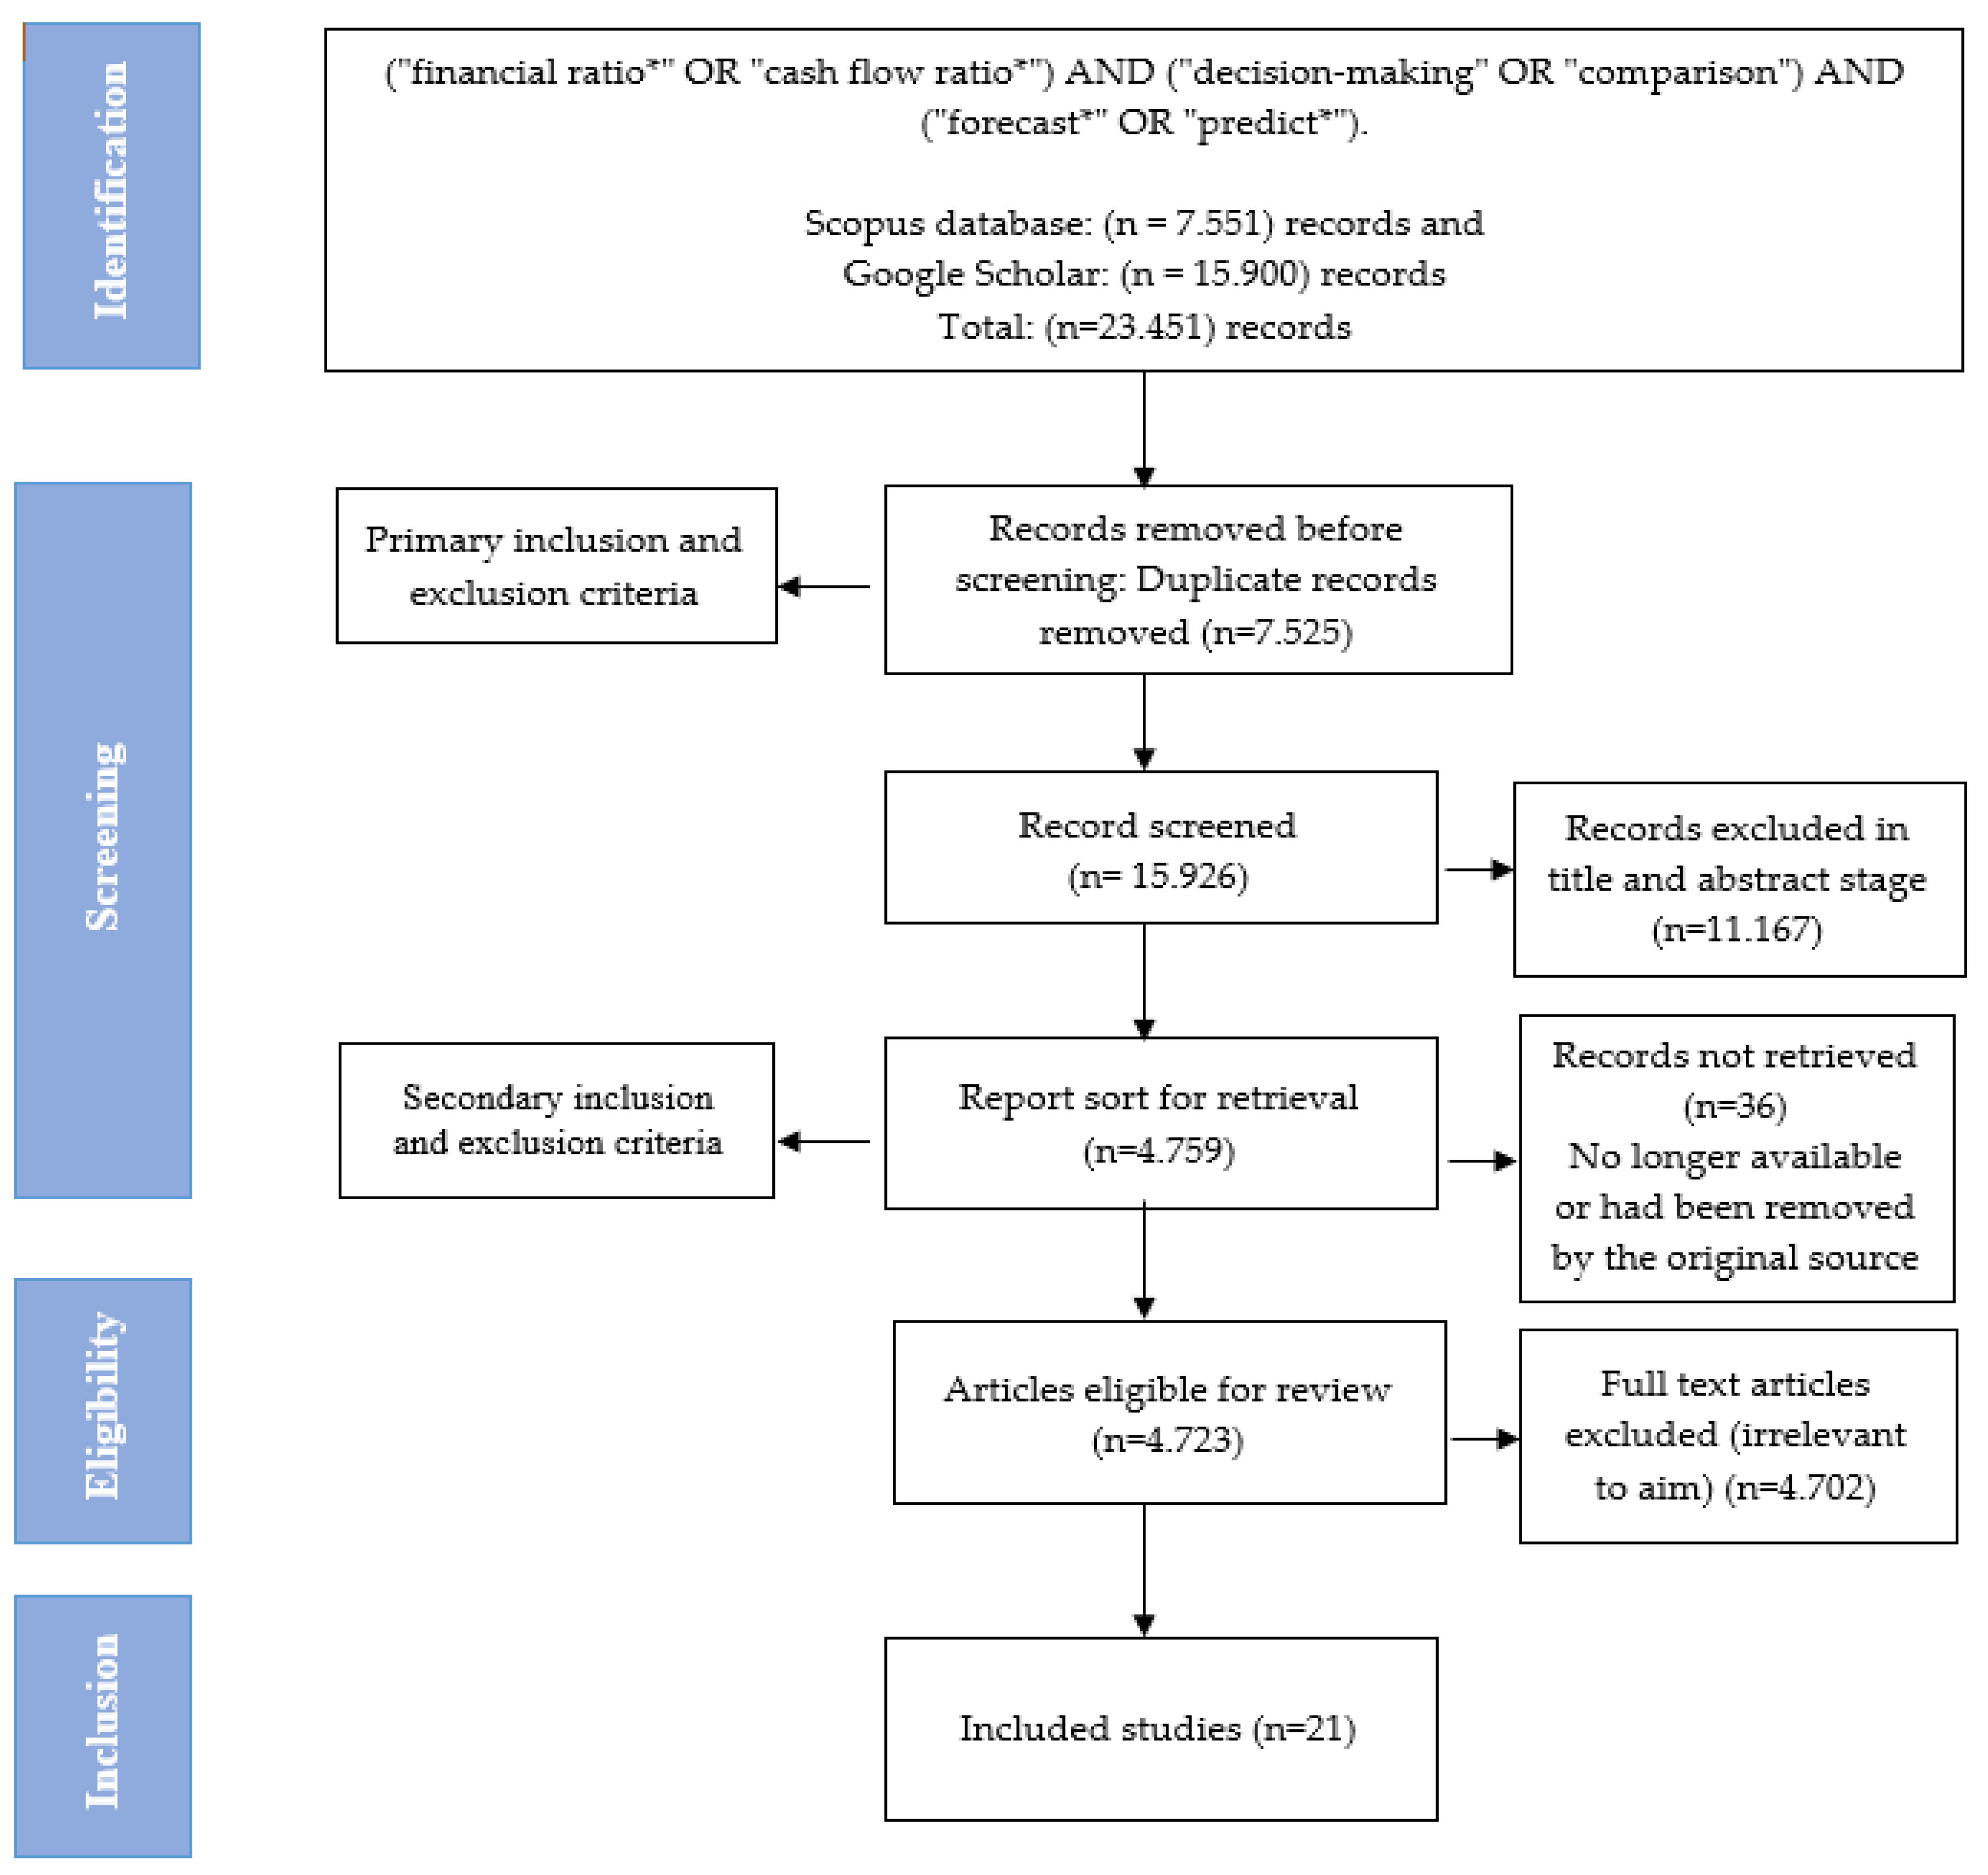
3.3. Data Screening and Selection
3.4. Data Analysis
- Yearly publication trends, influential authors, journals, and articles.
- Citation analysis to identify highly cited studies.
- Co-citation and keyword co-occurrence analyses were used to identify thematic clusters.
- The statistical methods used in this research include logistic regression and discriminant analysis.
3.5. Statistical Analysis
4. Results
4.1. Bibliometric Analysis
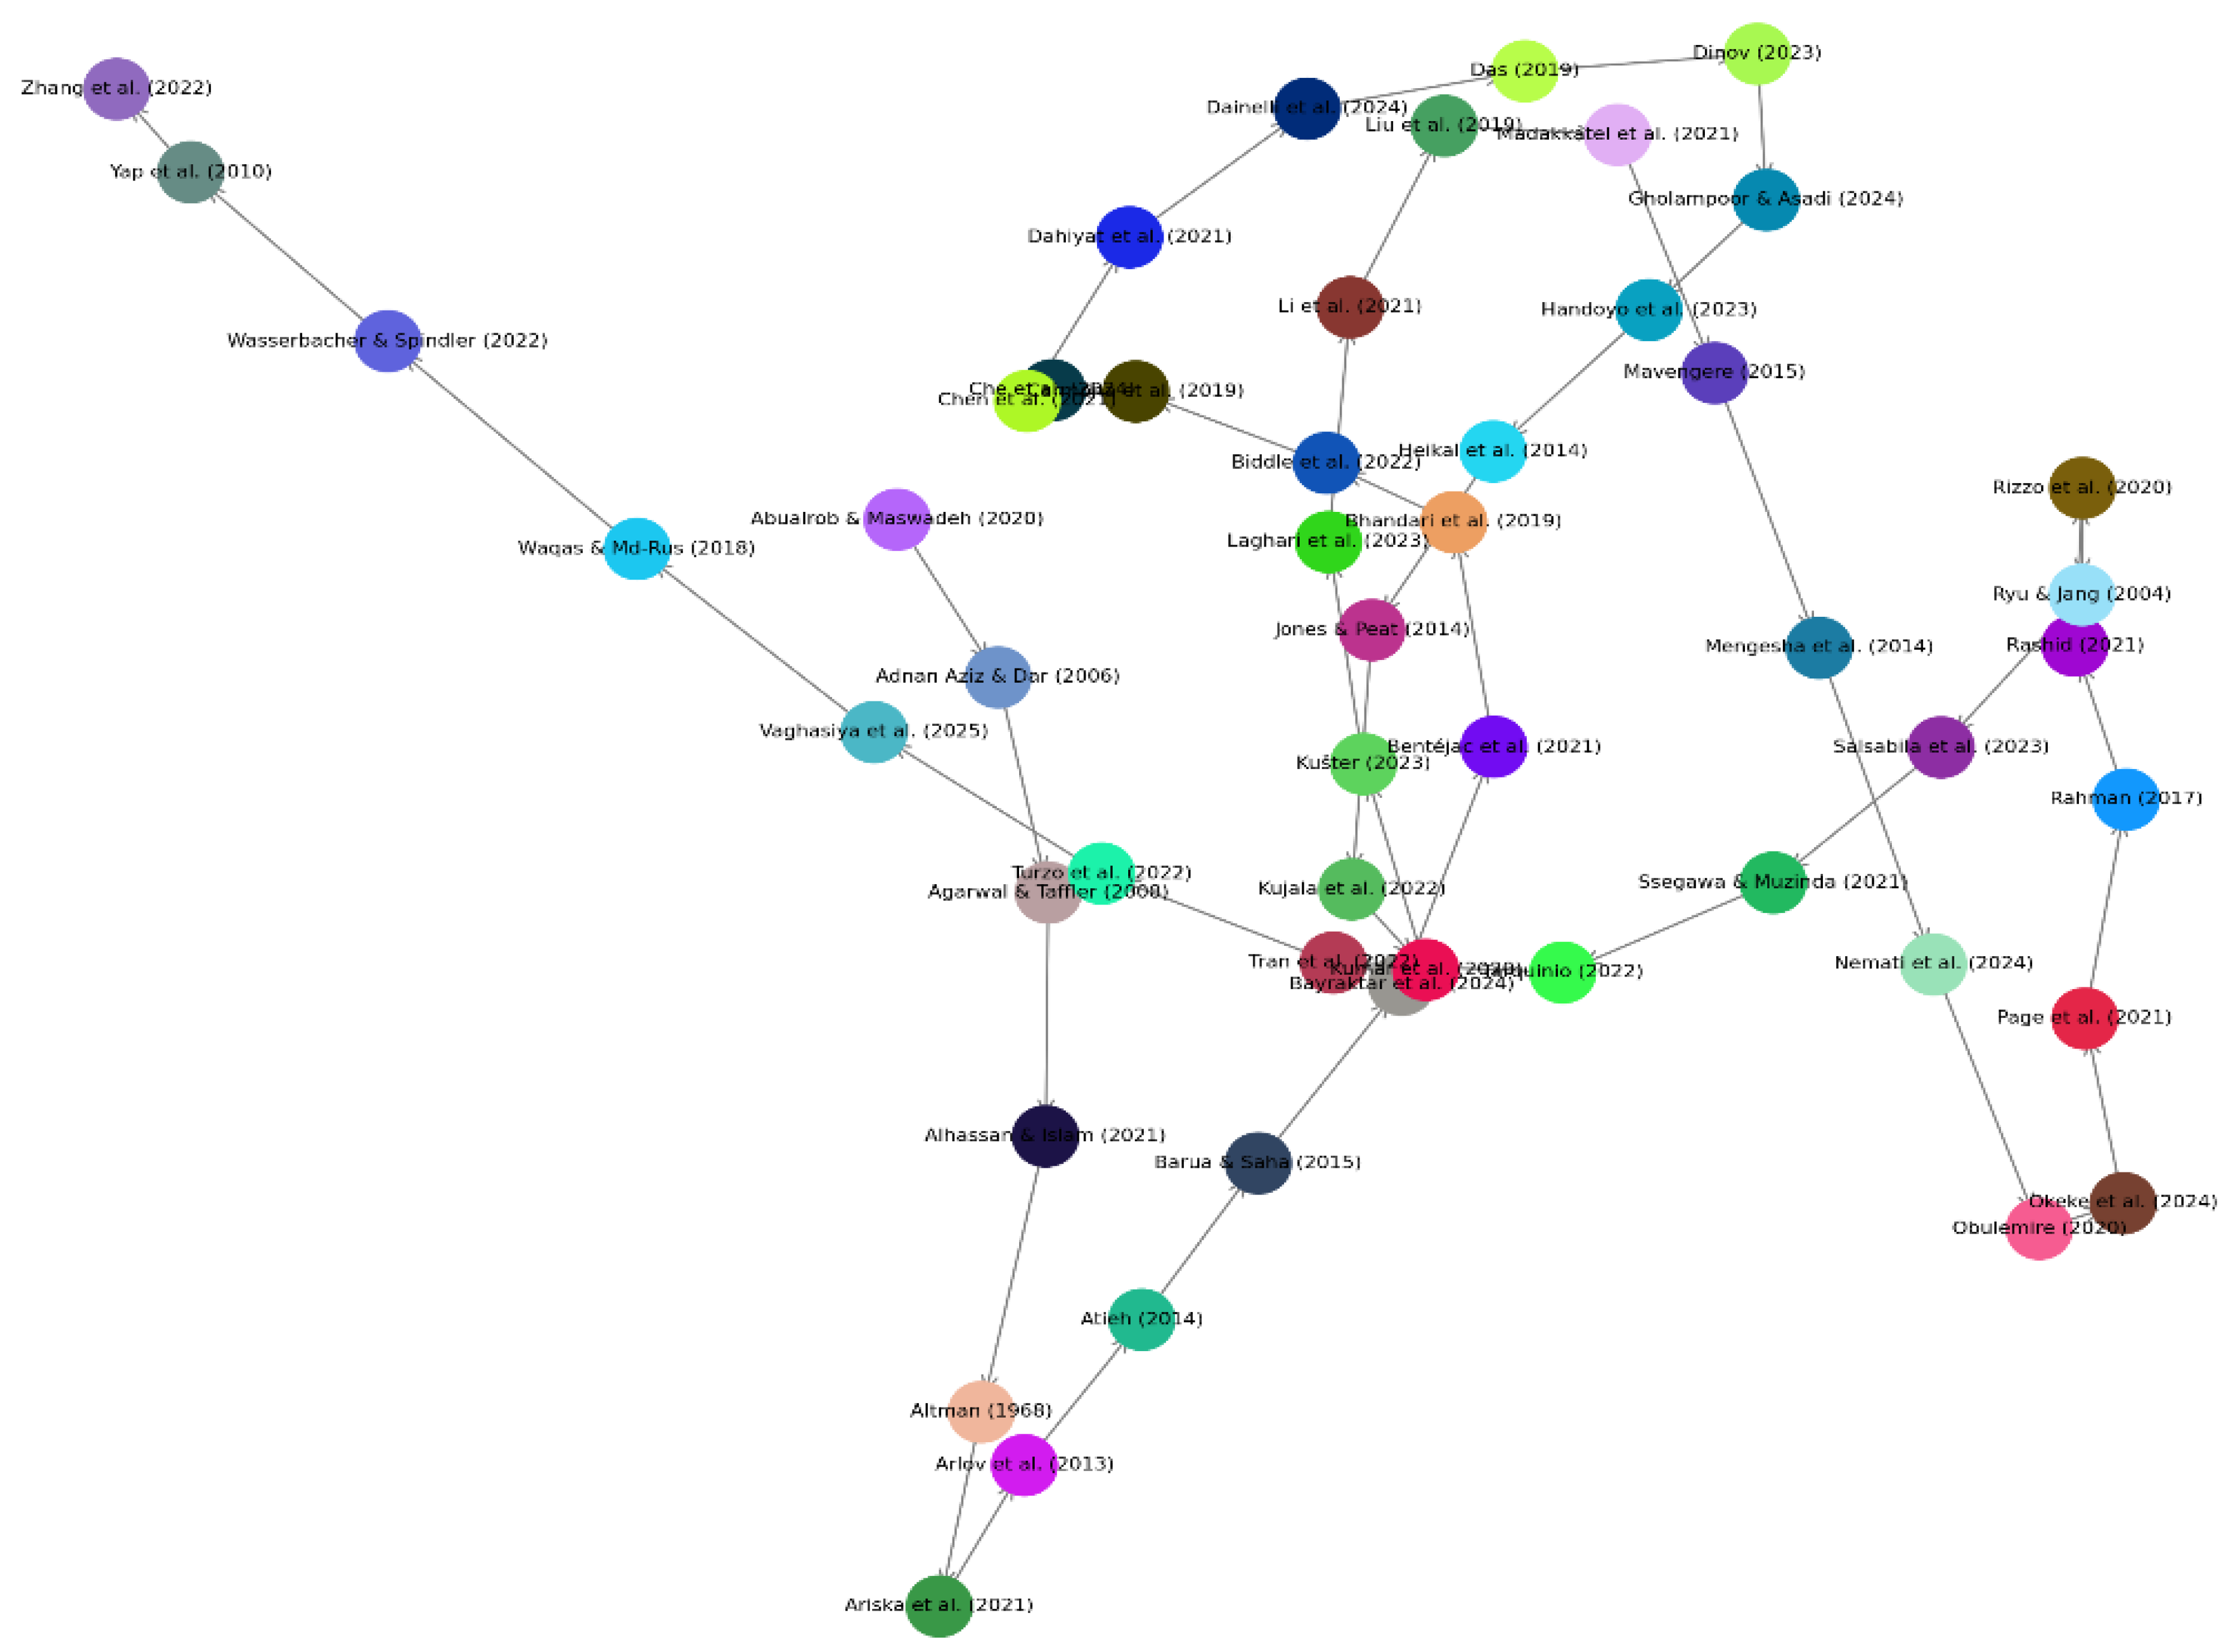
- Citation network visualization
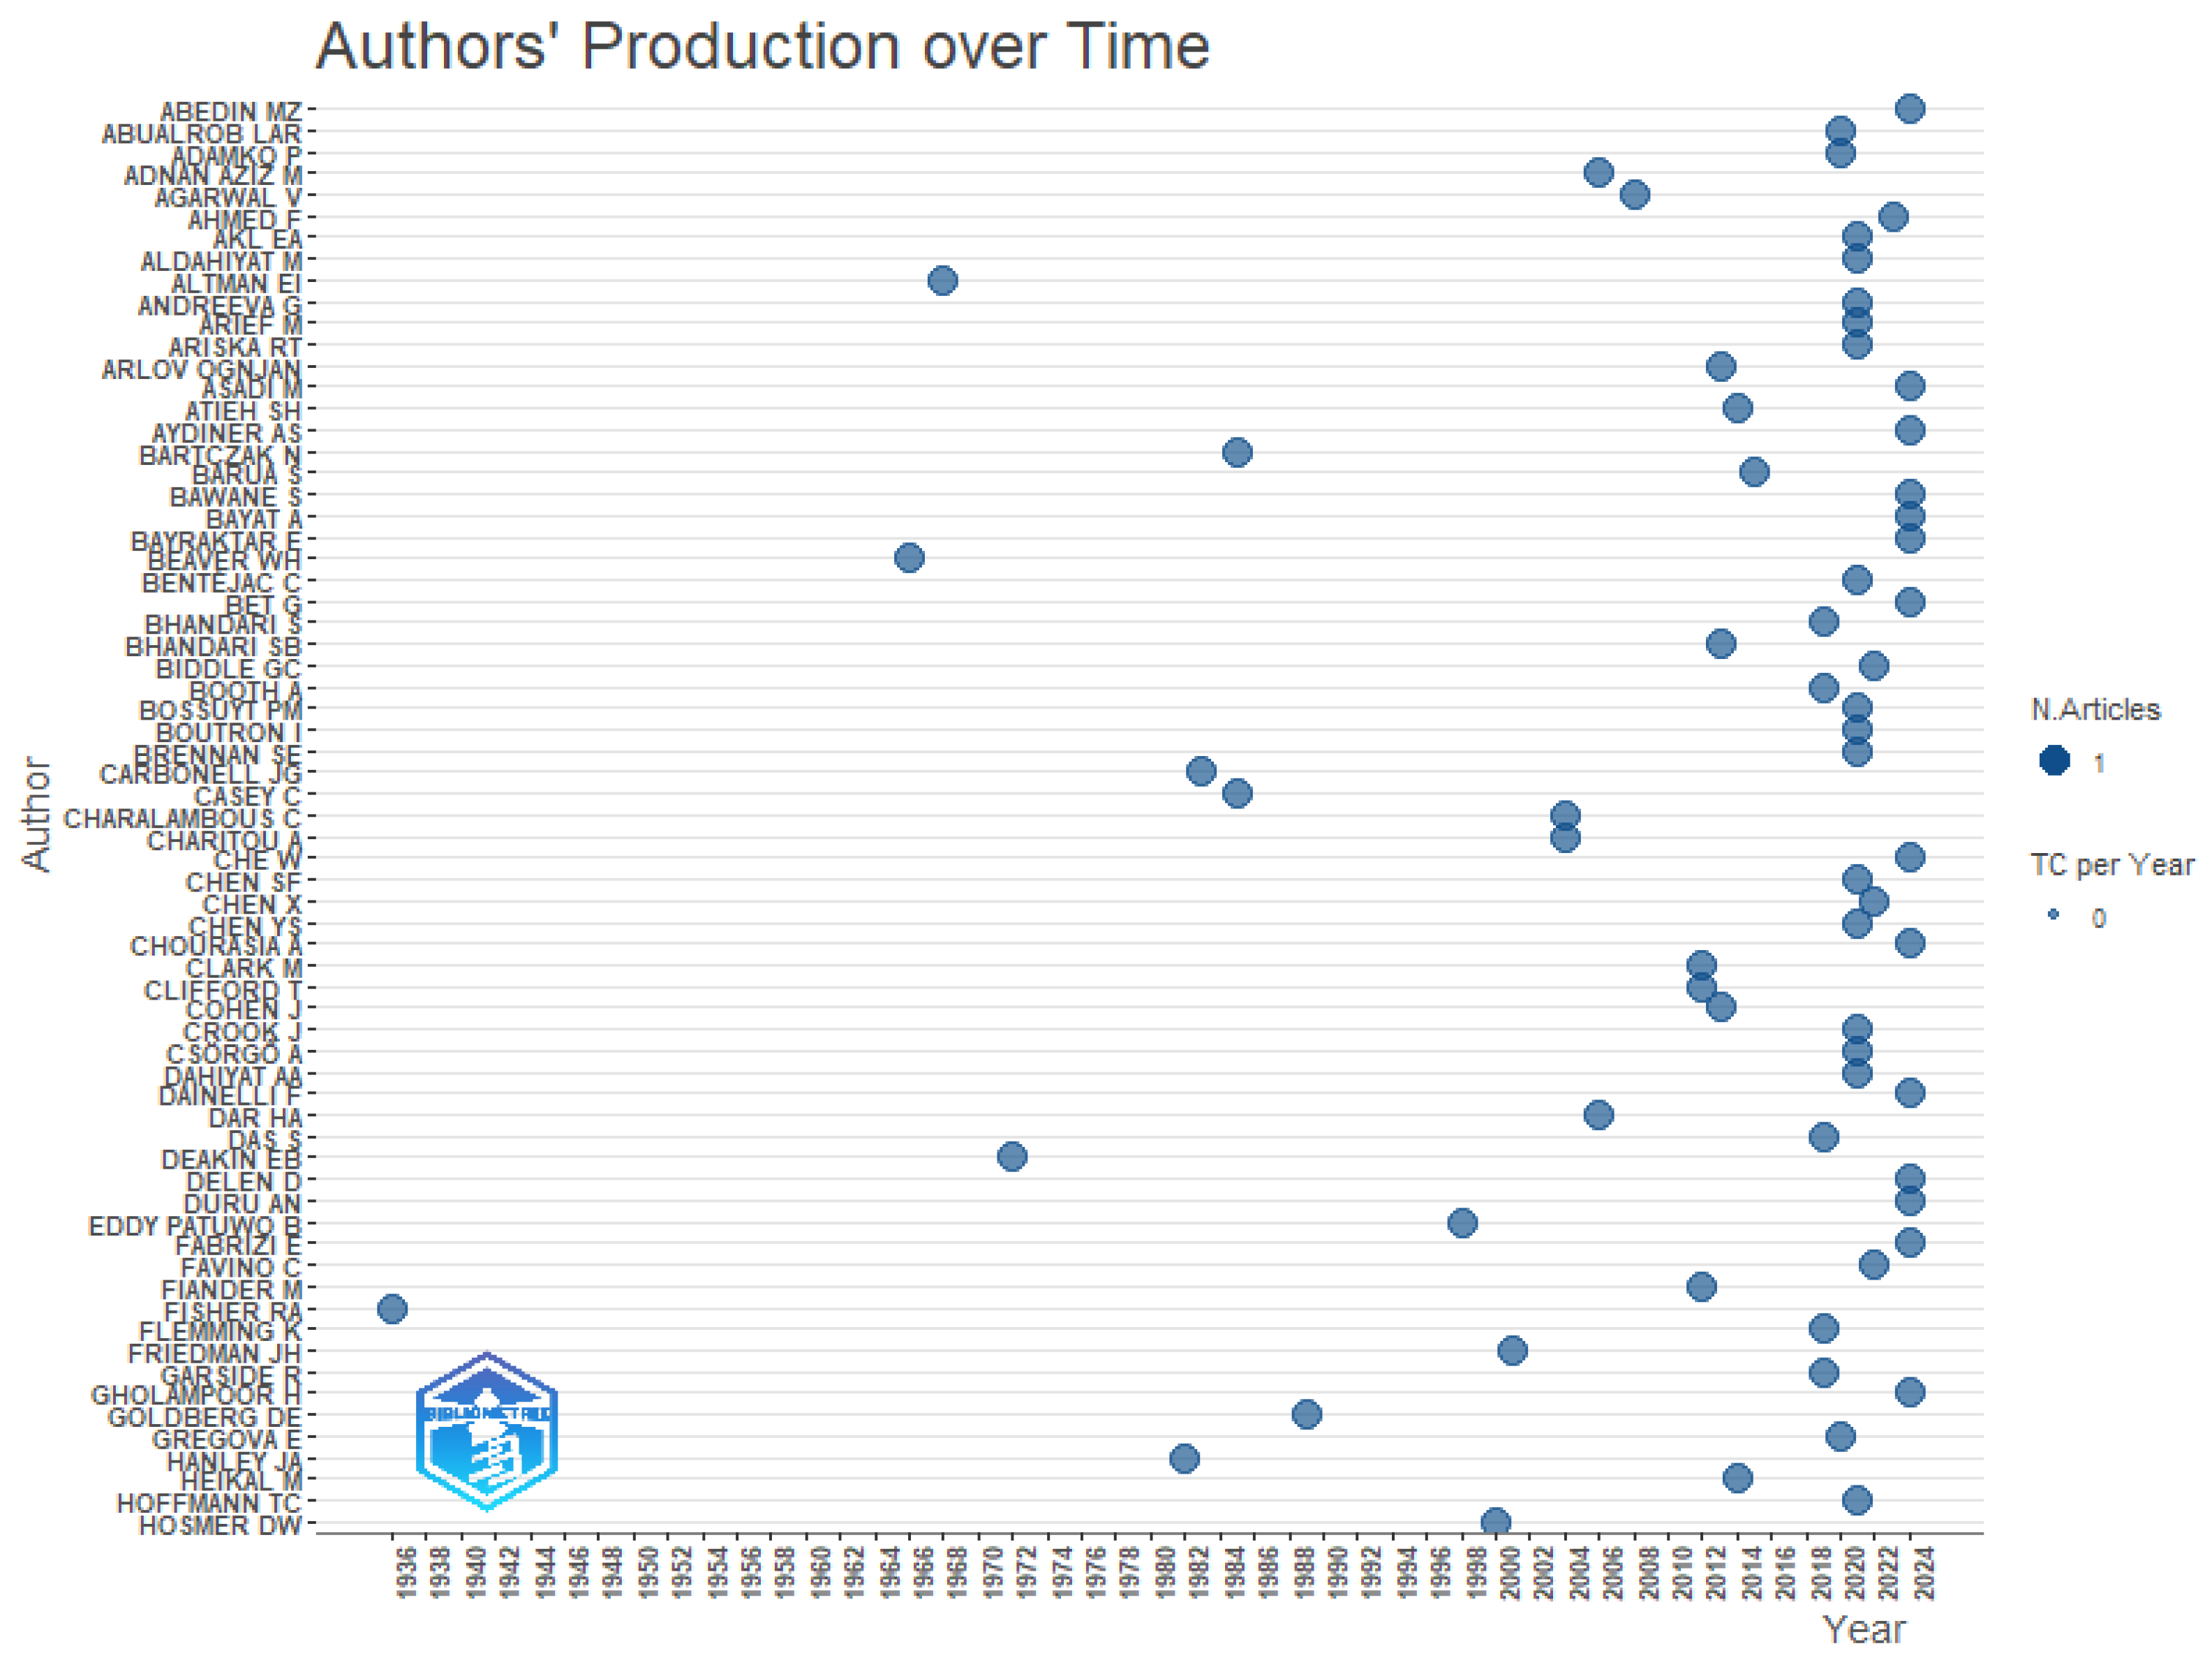
- Author analysis
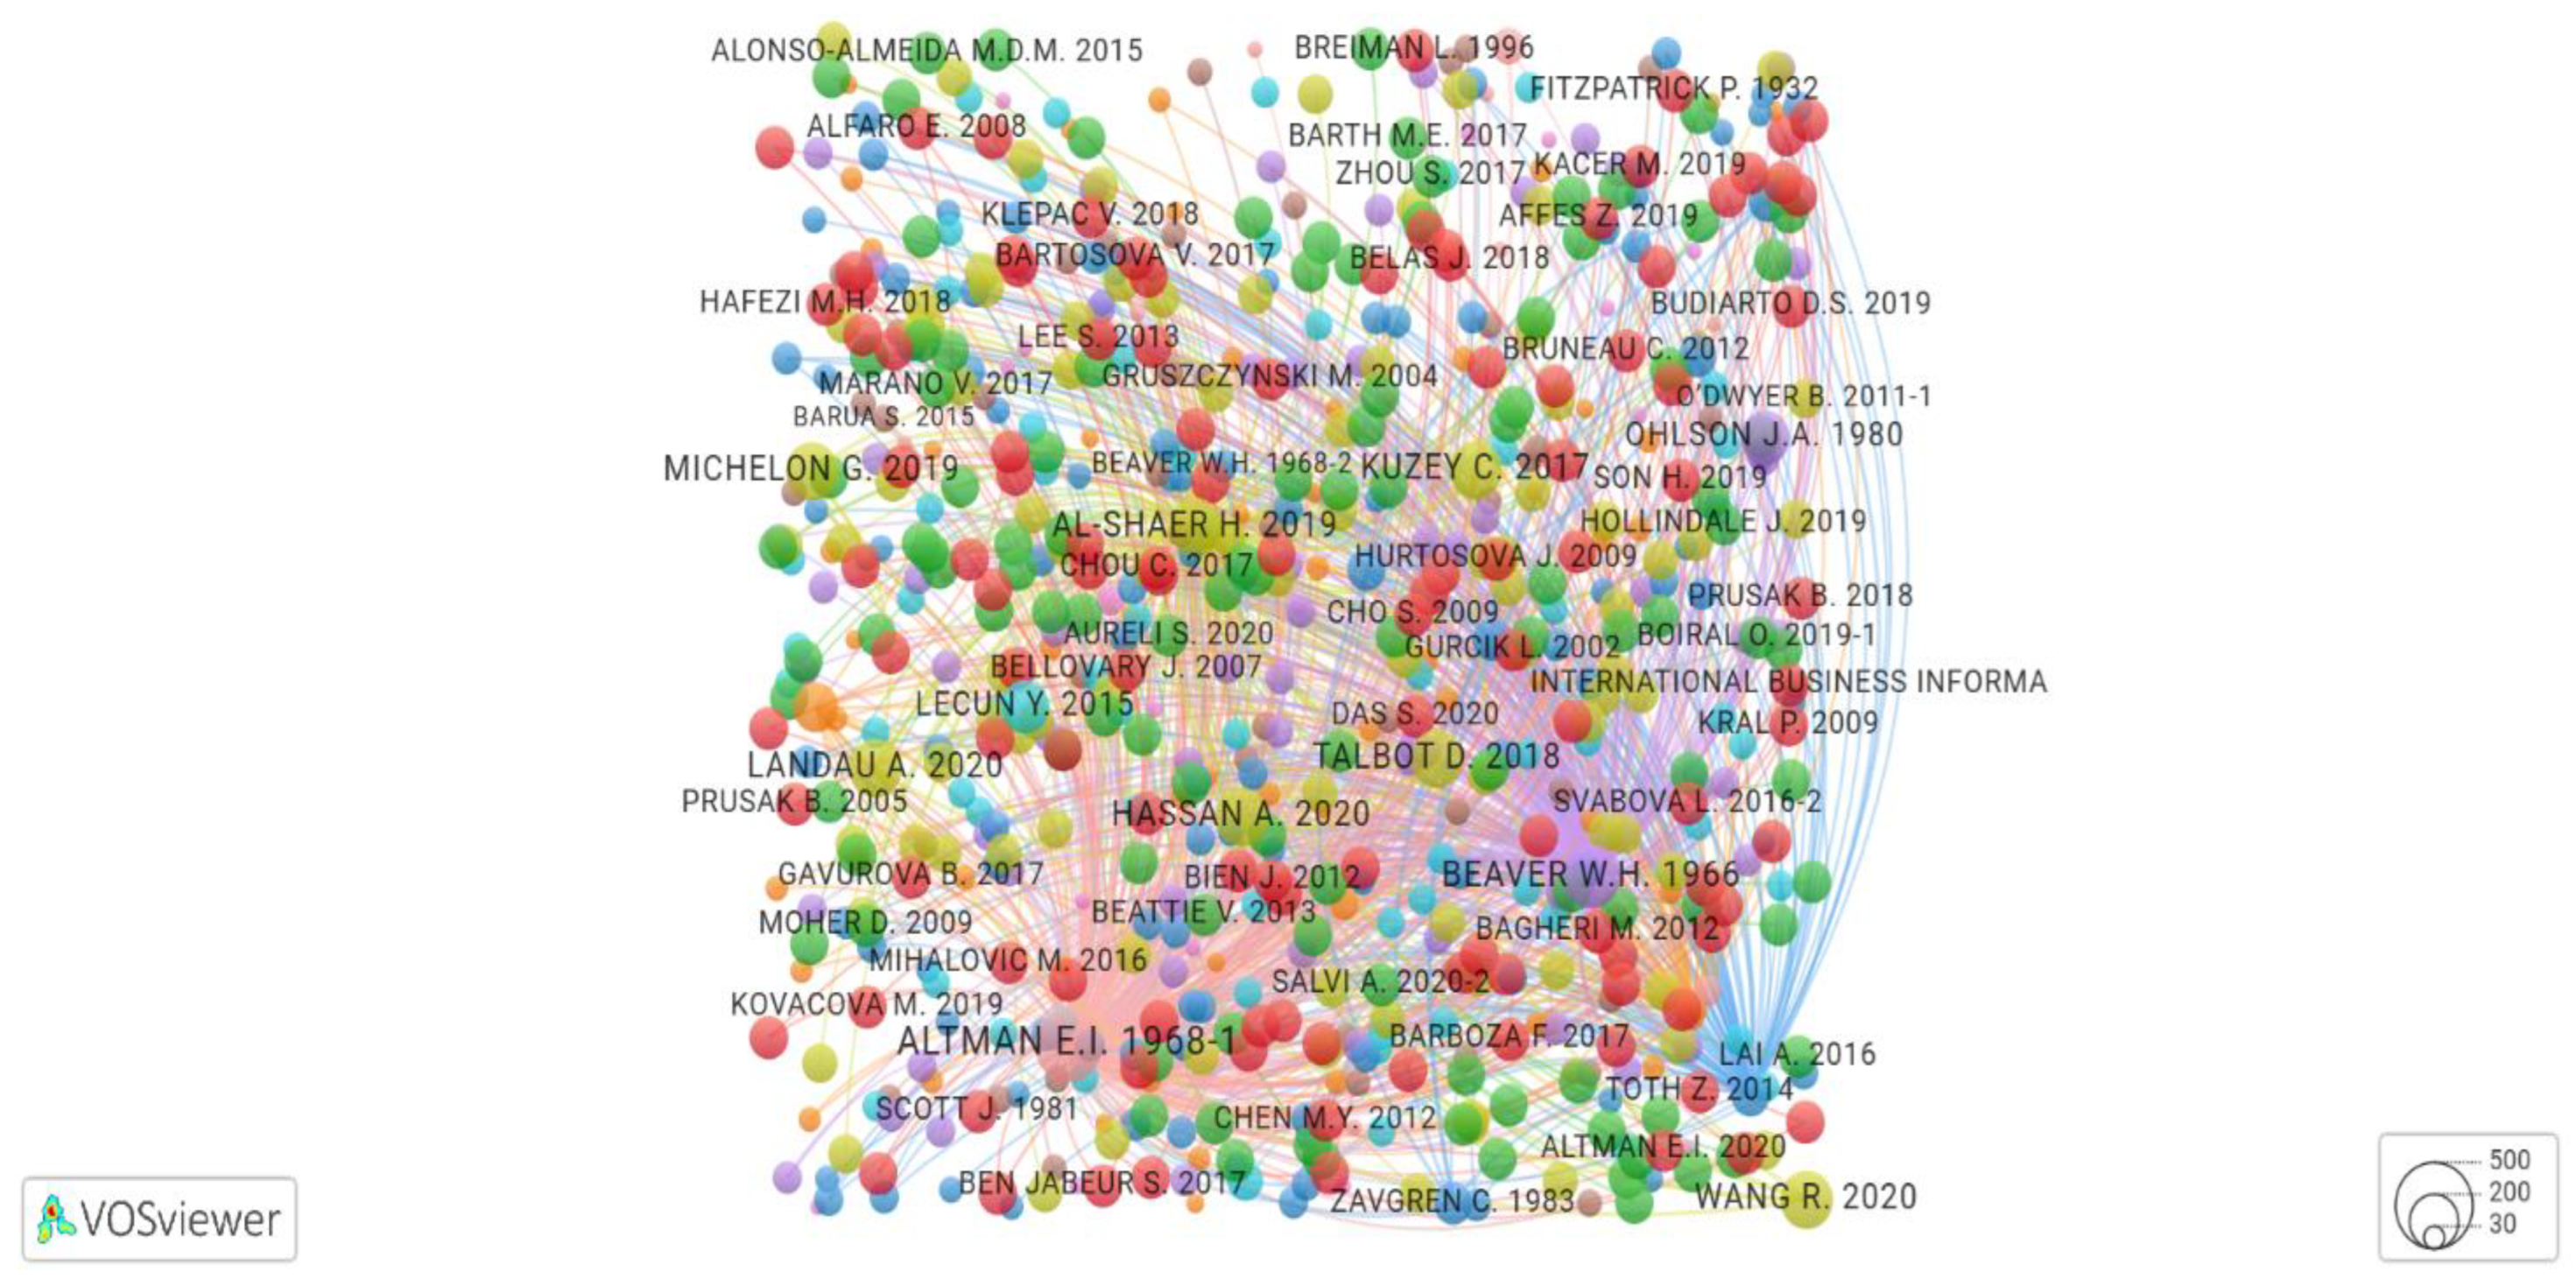
- Co-Citation patterns and theoretical foundations in financial distress research
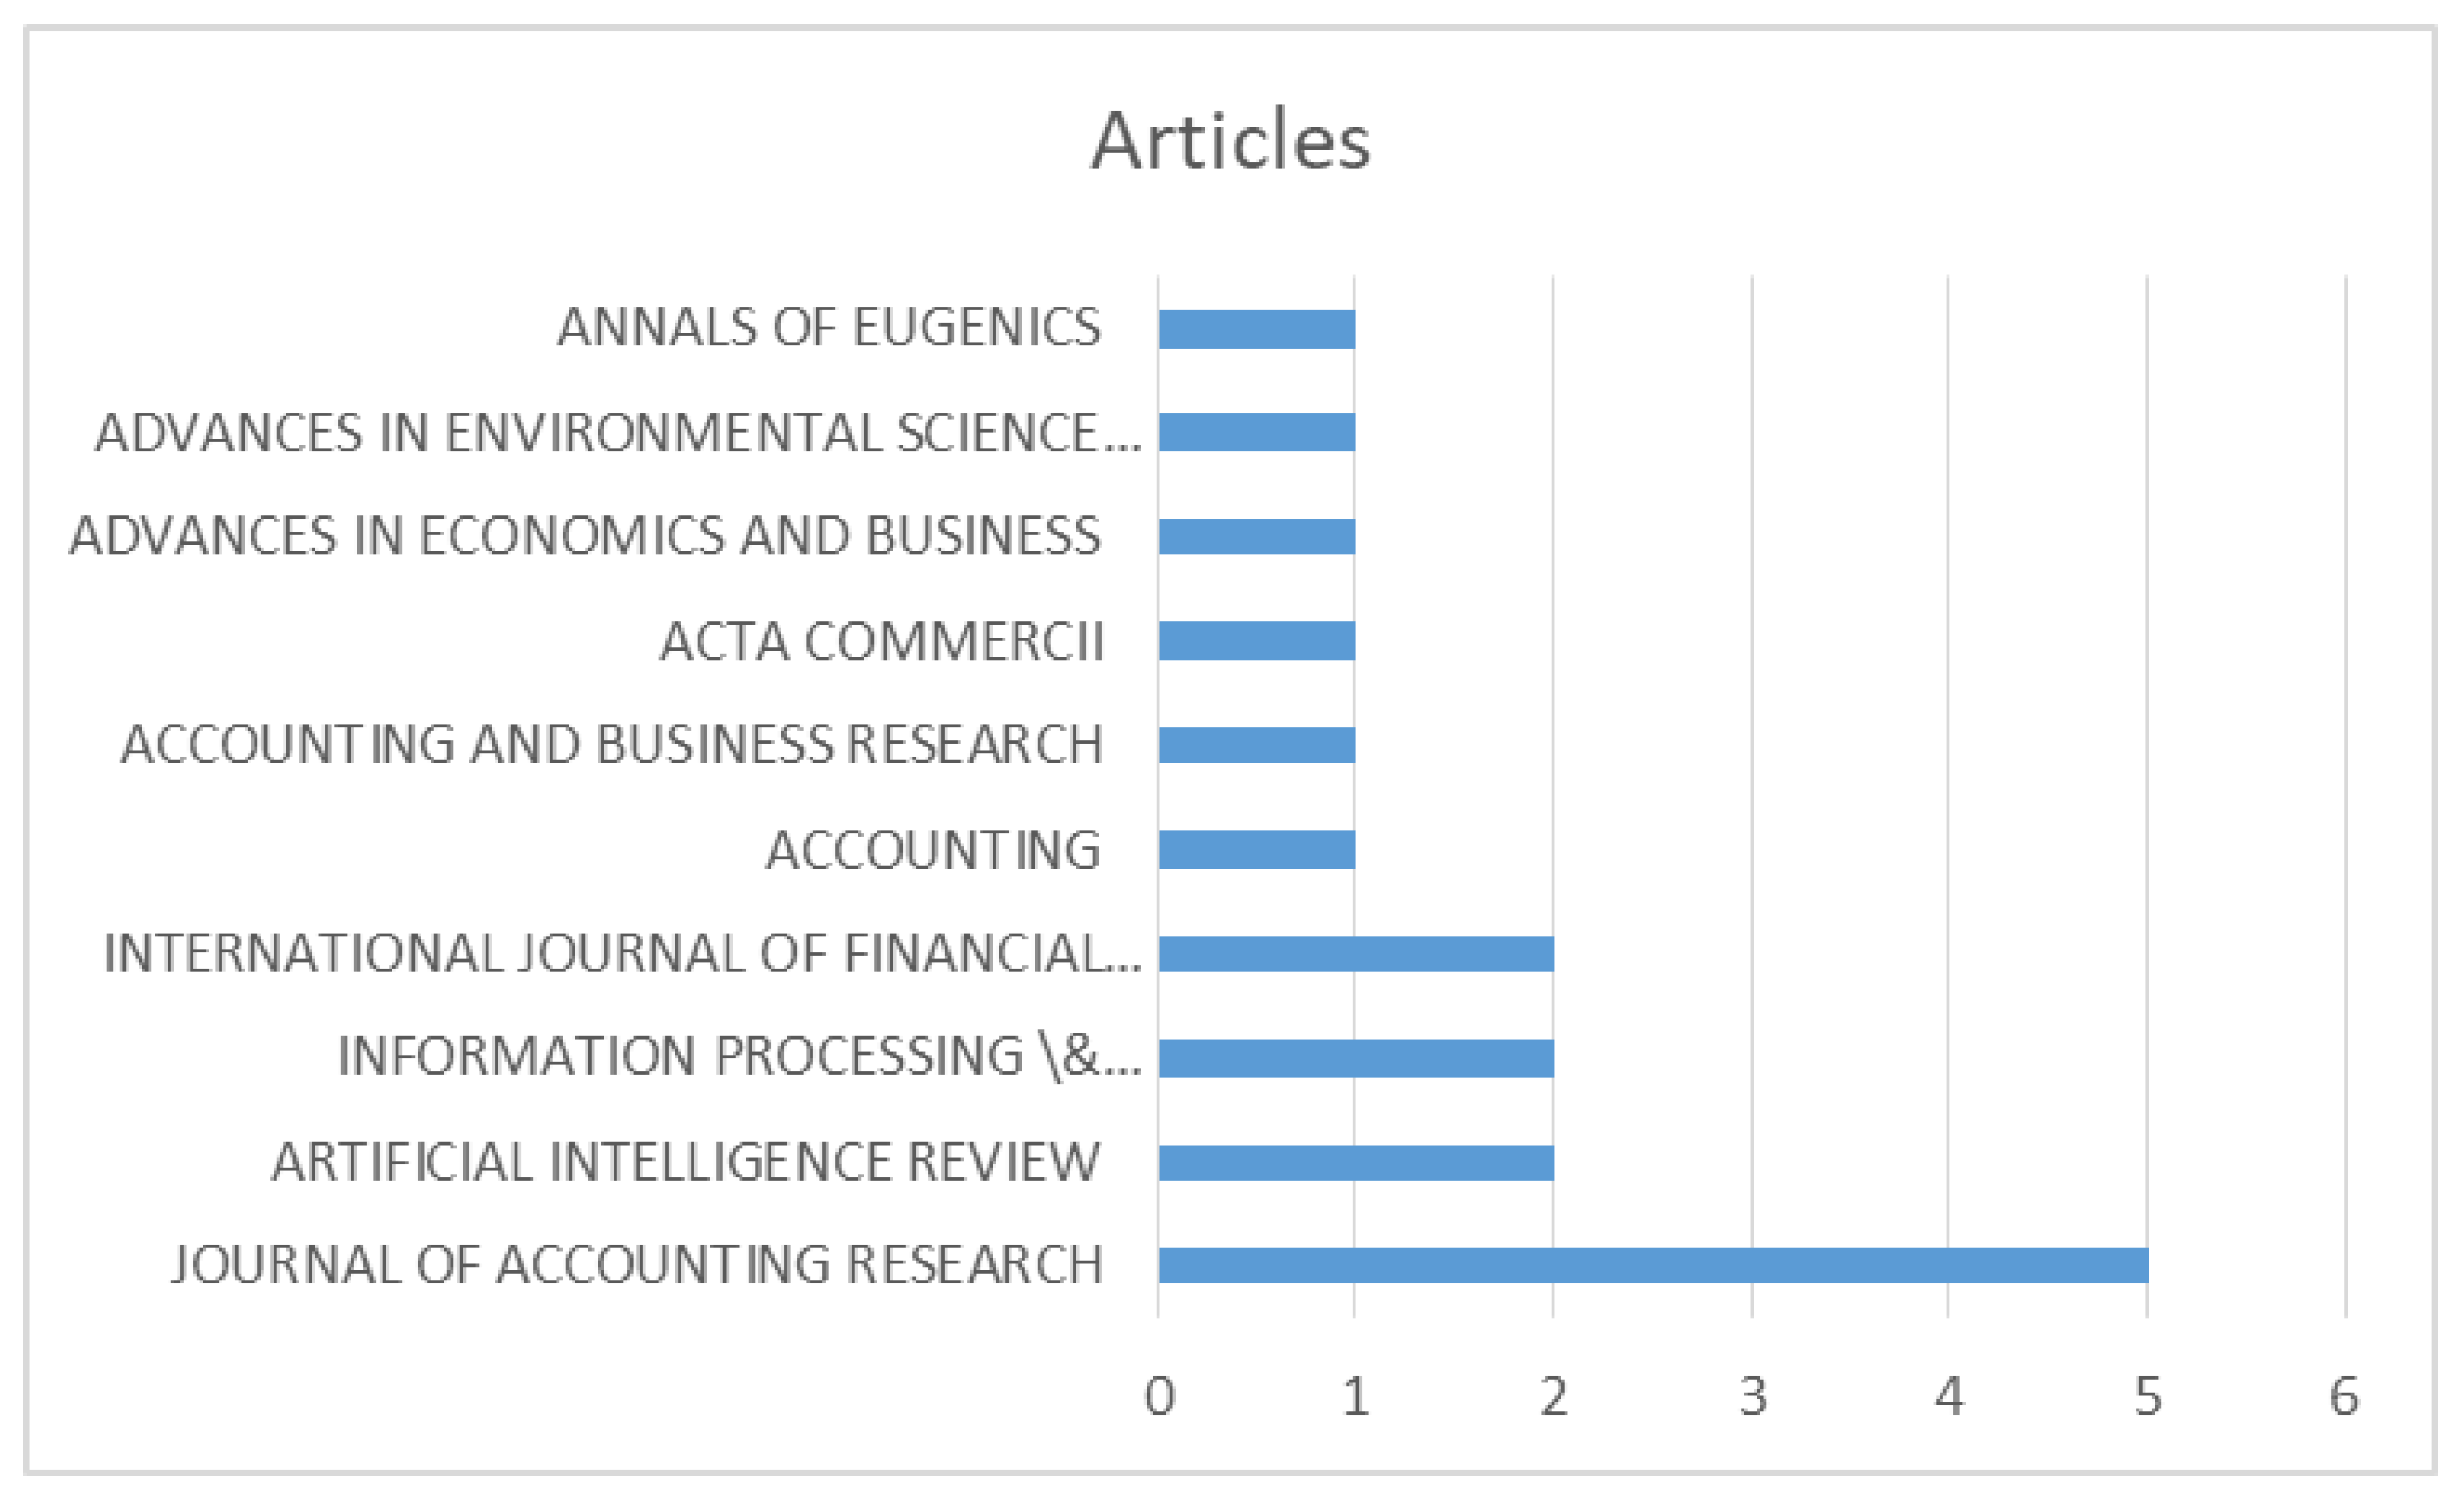
- Top journals
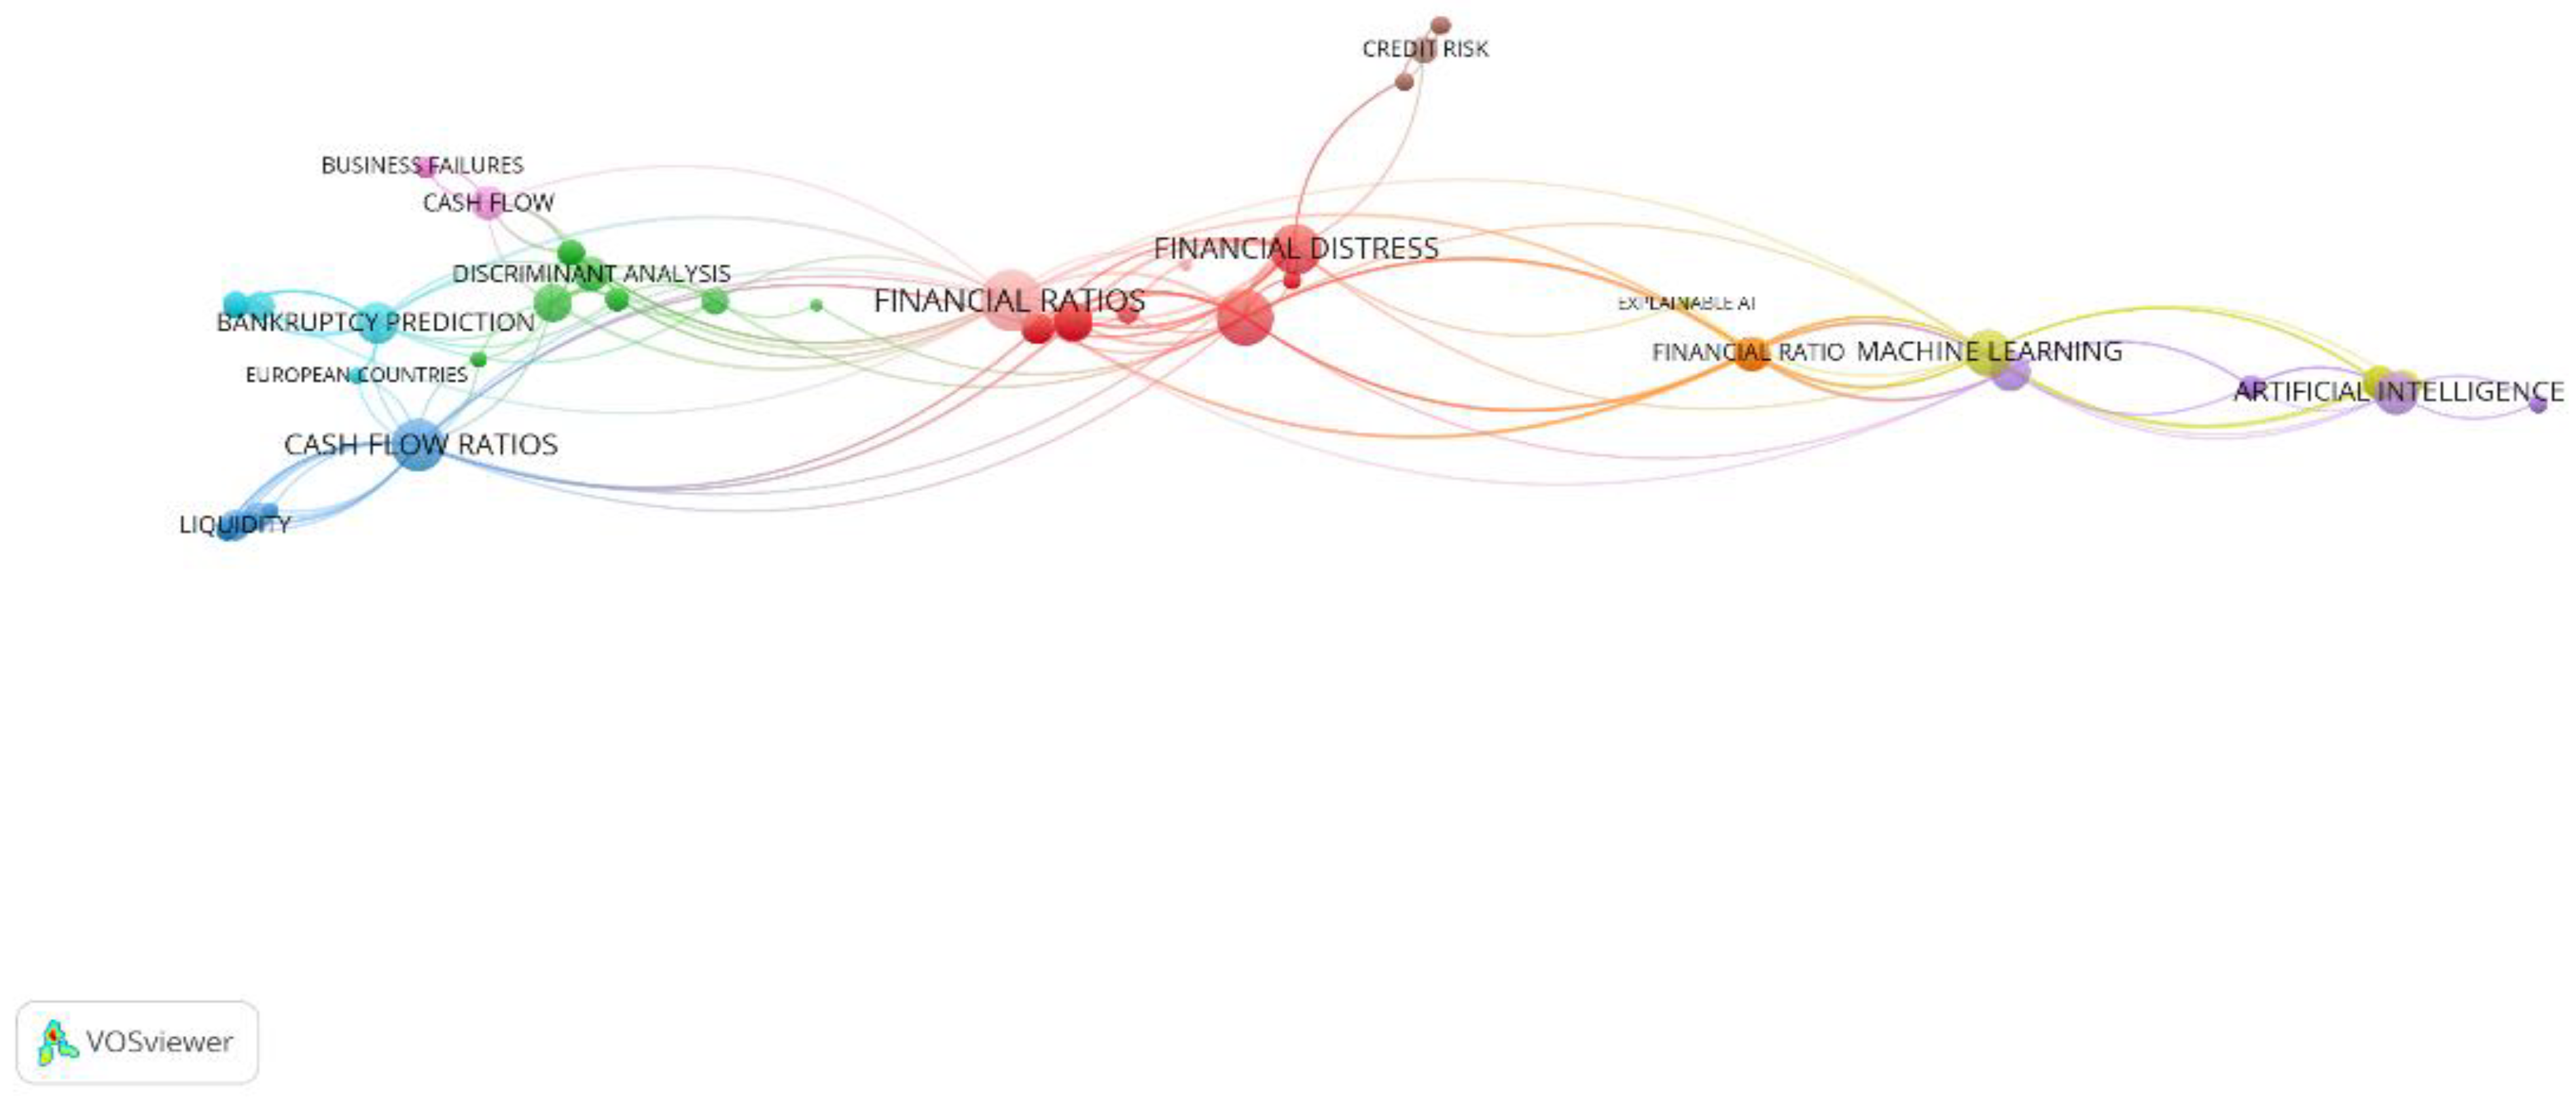
- Keyword co-occurrence network and density visualization
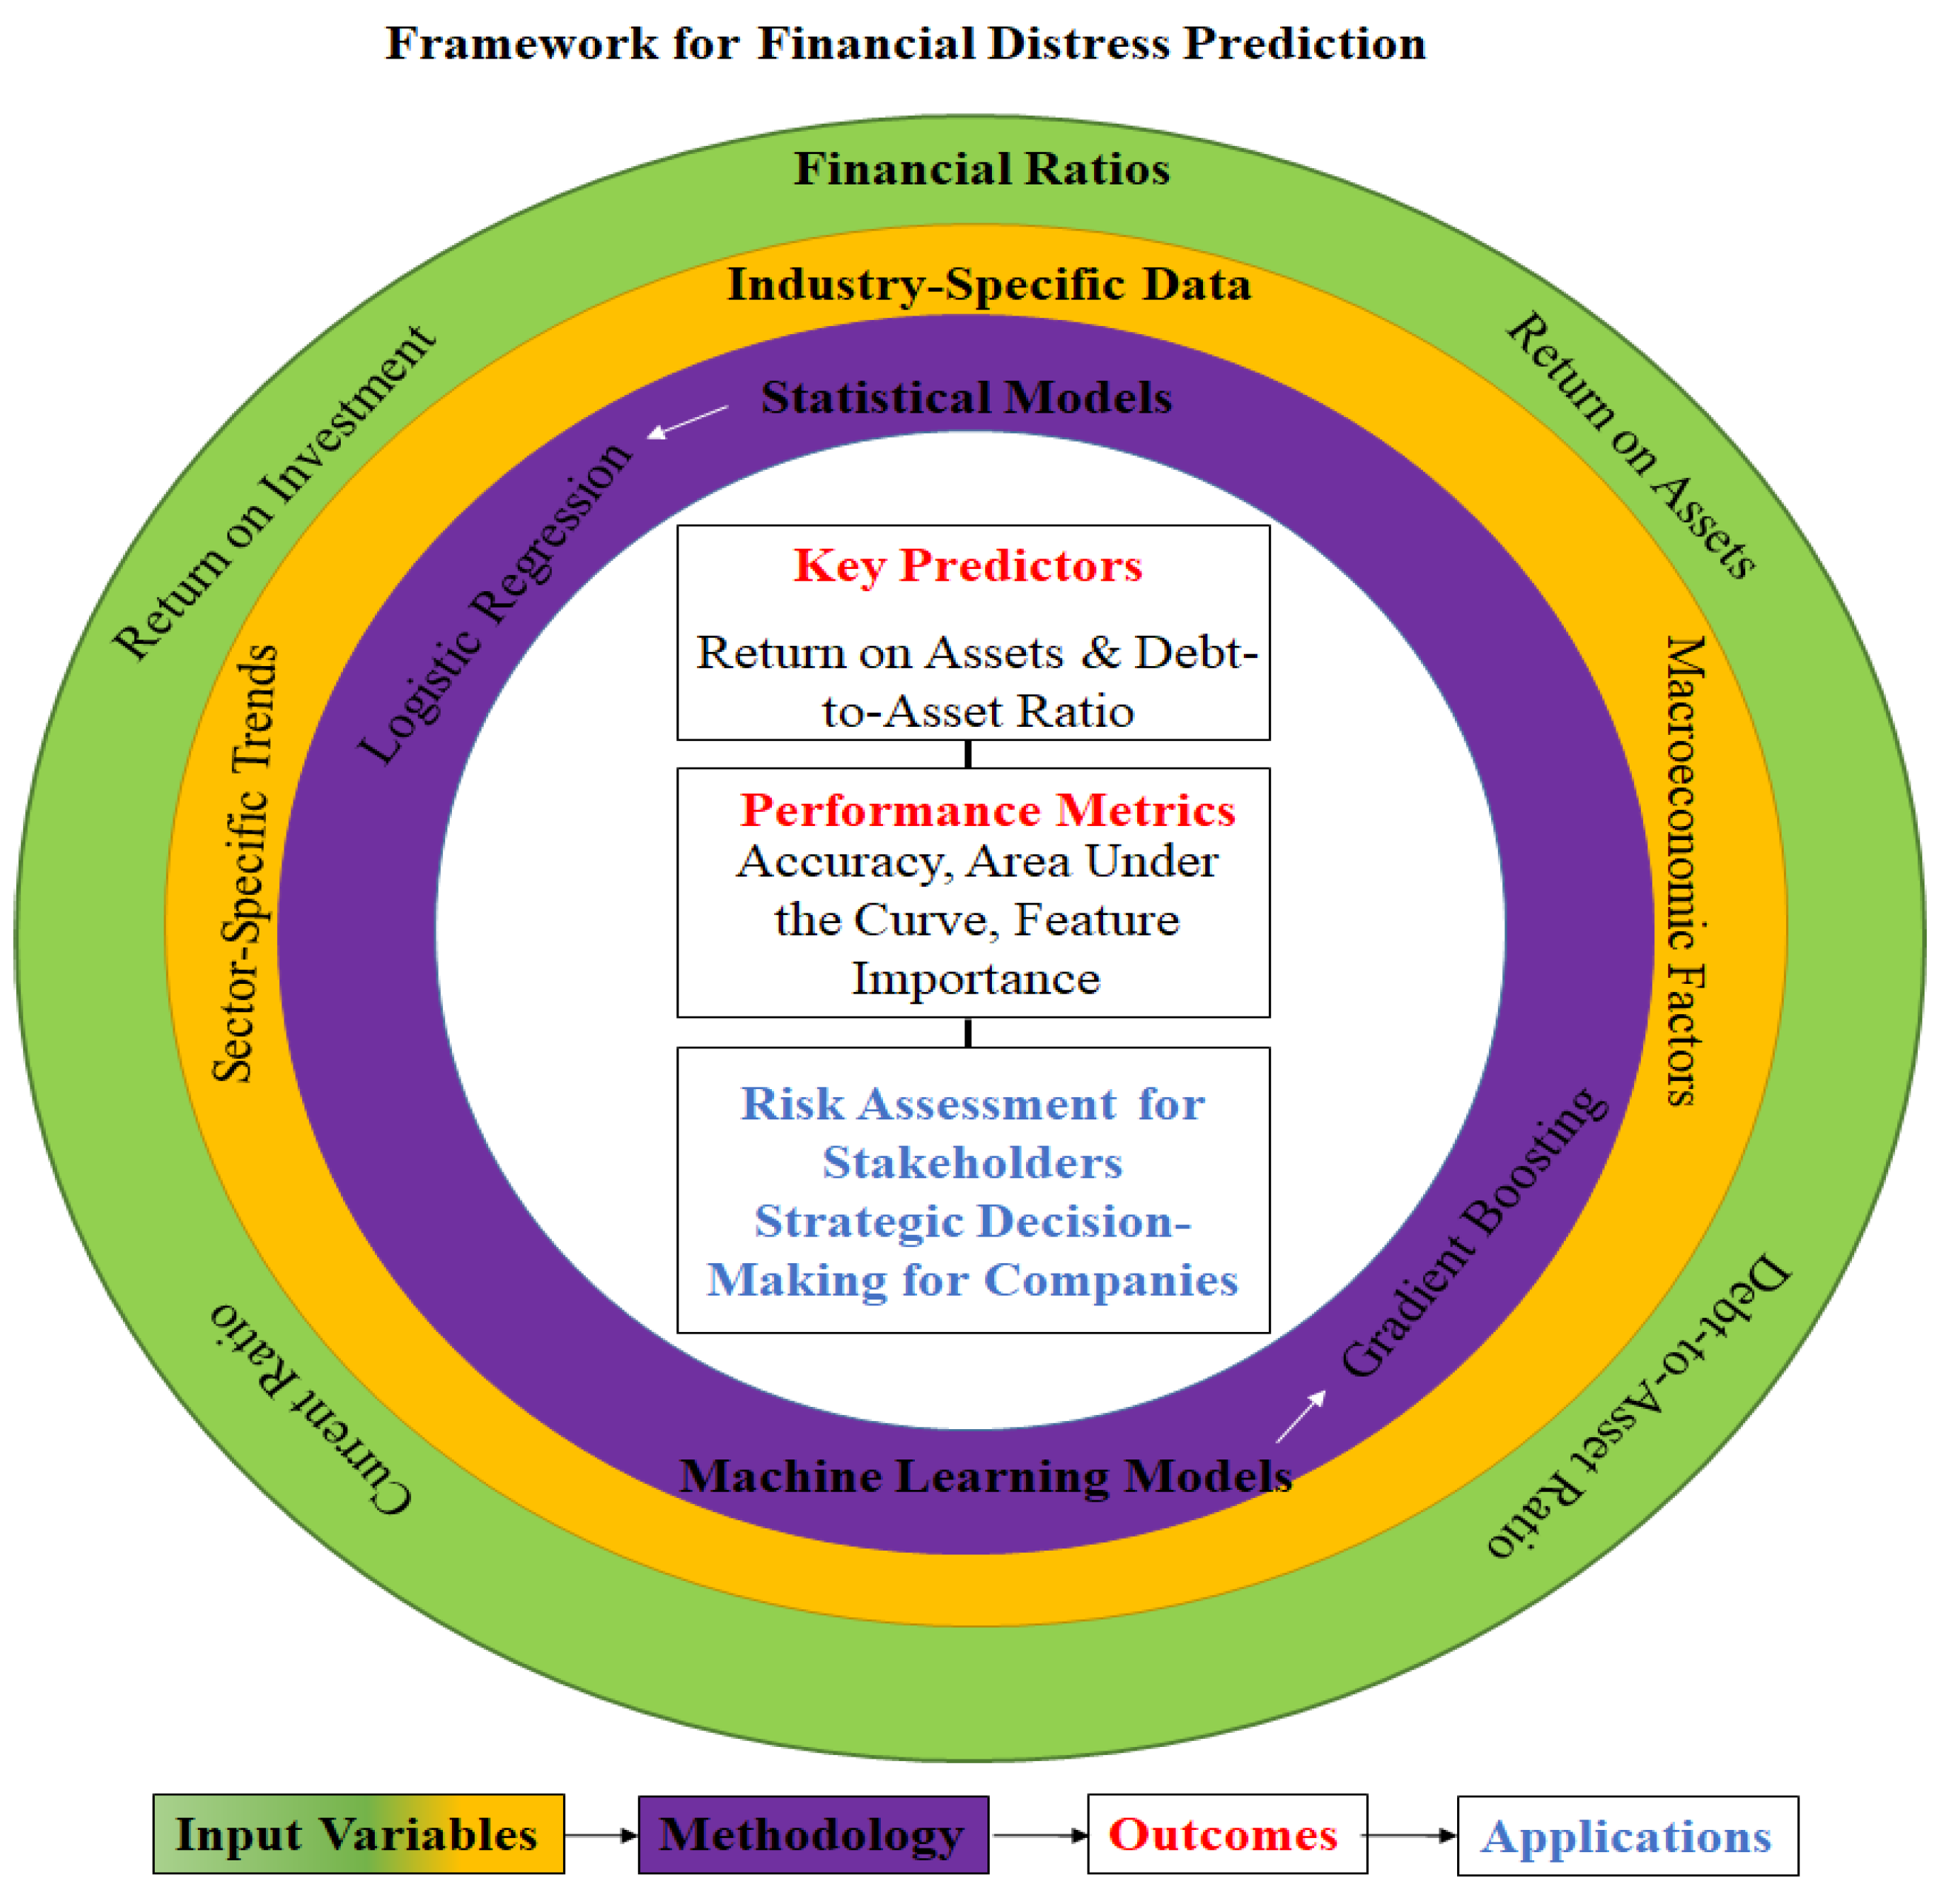
- Thematic evolution and future directions
4.2. Review of Empirical Studies on Financial Distress Prediction
5. Discussion
6. Conclusions, Limitations, and Future Research
Author Contributions
Funding
Data Availability Statement
Conflicts of Interest
References
- Abualrob, Laith Abdel Rahman, and Sanaa N. Maswadeh. 2020. The Effect of Financial Ratios Derived From Operating Cash Flows on Jordanian Commercial Banks Earnings per Share. International Journal of Financial Research 11: 394–404. [Google Scholar]
- Adnan Aziz, Muhammad, and Humayon A. Dar. 2006. Predicting corporate bankruptcy: Where we stand? Corporate Governance: The International Journal of Business in Society 6: 18–33. [Google Scholar] [CrossRef]
- Agarwal, Vineet, and Richard Taffler. 2008. Comparing the performance of market-based and accounting-based bankruptcy prediction models. Journal of Banking & Finance 32: 1541–51. [Google Scholar] [CrossRef]
- Altman, Edward I. 1968. Financial Ratios, Discriminant Analysis and the Prediction of Corporate Bankruptcy. The Journal of Finance 23: 589–609. [Google Scholar] [CrossRef]
- Ariska, Rita Tri, Mohammad Arief, and Prasetyono Prasetyono. 2021. The effect of gender diversity and financial ratios on financial destress in manufacturing companies Indonesia. International Journal of Economics, Business and Accounting Research (IJEBAR) 5: 537–51. [Google Scholar] [CrossRef]
- Arlov, Ognjan, Sinisa Rankov, and Slobodan Kotlica. 2013. Cash flow in predicting financial distress and bankruptcy. Advances in Environmental Science and Energy Planning 42: 421–41. [Google Scholar]
- Atieh, Sulayman H. 2014. Liquidity Analysis Using Cash Flow Ratios as Compared to Traditional Ratios in the Pharmaceutical Sector in Jordan. International Journal of Financial Research 5: 146–58. [Google Scholar] [CrossRef]
- Barua, Suborna, and Anup Kumar Saha. 2015. Traditional Ratios vs. Cash Flow based Ratios: Which One is Better Performance Indicator? Advances in Economics and Business 3: 232–51. [Google Scholar] [CrossRef]
- Bayraktar, Erkan, Ekrem Tatoglu, Arafat Salih Aydiner, and Dursun Delen. 2024. Business Analytics Adoption and Technological Intensity: An Efficiency Analysis. Information Systems Frontiers 26: 1509–26. [Google Scholar] [CrossRef]
- Beaver, William H. 1966. Financial Ratios as Predictors of Failure. Journal of Accounting Research 4: 71–111. [Google Scholar] [CrossRef]
- Bentéjac, Candice, Anna Csörgő, and Gonzalo Martínez-Muñoz. 2021. A comparative analysis of gradient boosting algorithms. Artificial Intelligence Review 54: 1937–67. [Google Scholar] [CrossRef]
- Bhandari, Shyam, Vince Showers, and Anna J. Johnson-Snyder. 2019. A Comparison: Accrual Versus Cash Flow Based Financial Measures’ Performance in Predicting Business Failure. Journal of Accounting and Finance 19: 6. [Google Scholar] [CrossRef]
- Bhandari, Shyam B., and Rajesh Iyer. 2013. Predicting business failure using cash flow statement based measures. Managerial Finance 39: 667–76. [Google Scholar] [CrossRef]
- Biddle, Gary C., Mary L. Z. Ma, and Frank M. Song. 2022. Accounting conservatism and bankruptcy risk. Journal of Accounting, Auditing & Finance 37: 295–323. [Google Scholar]
- Booth, Andrew, Graham Moore, Kate Flemming, Ruth Garside, Nigel Rollins, Özge Tunçalp, and Jane Noyes. 2019. Taking account of context in systematic reviews and guidelines considering a complexity perspective. BMJ Global Health 4 Suppl. S1: e000840. [Google Scholar] [CrossRef] [PubMed]
- Breiman, Leo. 2001. Random Forests. Machine Learning 45: 5–32. [Google Scholar] [CrossRef]
- Casey, Cornelius, and Norman Bartczak. 1985. Using Operating Cash Flow Data to Predict Financial Distress: Some Extensions. Journal of Accounting Research 23: 384–401. [Google Scholar] [CrossRef]
- Charitou, Andreas, Evi Neophytou, and Chris Charalambous. 2004. Predicting corporate failure: Empirical evidence for the UK. European Accounting Review 13: 465–97. [Google Scholar] [CrossRef]
- Che, Wanliu, Zhao Wang, Cuiqing Jiang, and Mohammad Zoynul Abedin. 2024. Predicting Financial Distress Using Multimodal Data: An Attentive and Regularized Deep Learning Method. Information Processing & Management 61: 103703. [Google Scholar] [CrossRef]
- Chen, You-Shyang, Chien-Ku Lin, Chih-Min Lo, Su-Fen Chen, and Qi-Jun Liao. 2021. Comparable Studies of Financial Bankruptcy Prediction Using Advanced Hybrid Intelligent Classification Models to Provide Early Warning in the Electronics Industry. Mathematics 9: 2622. [Google Scholar] [CrossRef]
- Dahiyat, Ahmad Abdelrahim, Sulaiman Raji Weshah, and Mohammad Aldahiyat. 2021. Liquidity and solvency management and its impact on financial performance: Empirical evidence from Jordan. The Journal of Asian Finance, Economics and Business 8: 135–41. [Google Scholar]
- Dainelli, Francesco, Gianmarco Bet, and Eugenio Fabrizi. 2024. The financial health of a company and the risk of its default: Back to the future. International Review of Financial Analysis 95: 103449. [Google Scholar] [CrossRef]
- Das, Somnath. 2019. Cash flow ratios and financial performance: A comparative study. Accounting 5: 1–20. [Google Scholar] [CrossRef]
- Deakin, Edward B. 1972. A Discriminant Analysis of Predictors of Business Failure. Journal of Accounting Research 10: 167–79. [Google Scholar] [CrossRef]
- Farooque, Muhammad, Abraham Zhang, Matthias Thürer, Ting Qu, and Donald Huisingh. 2019. Circular supply chain management: A definition and structured literature review. Journal of Cleaner Production 228: 882–900. [Google Scholar] [CrossRef]
- Gholampoor, Hadi, and Majid Asadi. 2024. Risk Analysis of Bankruptcy in the U.S. Healthcare Industries Based on Financial Ratios: A Machine Learning Analysis. Journal of Theoretical and Applied Electronic Commerce Research 19: 1303–20. [Google Scholar] [CrossRef]
- Gregova, Elena, Katarina Valaskova, Peter Adamko, Milos Tumpach, and Jaroslav Jaros. 2020. Predicting Financial Distress of Slovak Enterprises: Comparison of Selected Traditional and Learning Algorithms Methods. Sustainability 12: 3954. [Google Scholar] [CrossRef]
- Hanley, James A., and Barbara J. McNeil. 1982. The meaning and use of the area under a receiver operating characteristic (ROC) curve. Radiology 143: 29–36. [Google Scholar] [CrossRef]
- Heikal, Mohd, Muammar Khaddafi, and Ainatul Ummah. 2014. Influence Analysis of Return on Assets (ROA), Return on Equity (ROE), Net Profit Margin (NPM), Debt To Equity Ratio (DER), and current ratio (CR), Against Corporate Profit Growth In Automotive In Indonesia Stock Exchange. International Journal of Academic Research in Business and Social Sciences 4: 101. [Google Scholar] [CrossRef]
- Jones, Stewart, and Maurice Peat. 2014. Predicting corporate bankruptcy risk in australia: A latent class analysis. Journal of Applied Management Accounting Research 12: 13. [Google Scholar]
- Jooste, Leonie. 2007. An evaluation of the usefulness of cash flow ratios to predict financial distress. Acta Commercii 7: 1–13. [Google Scholar]
- Kirkham, Ross. 2012. Liquidity Analysis Using Cash Flow Ratios and Traditional Ratios: The Telecommunications Sector in Australia. Journal of New Business Ideas & Trends 10: 1–13. [Google Scholar]
- Kumar, Joginder, Vinod Kumar, Deepika Verma, and Somya Sharma. 2020. Prediction of Corporate Bankruptcy Based on Financial Ratios using Binary Logistic Regression. International Journal of Statistics and Reliability Engineering 7: 376–81. [Google Scholar]
- Kušter, Denis. 2023. Construction of bankruptcy prediction model using discriminant analysis and financial ratios. Ekonomija-Teorija I Praksa 16: 1–22. [Google Scholar]
- Laghari, Fahmida, Farhan Ahmed, and María de las Nieves López García. 2023. Cash flow management and its effect on firm performance: Empirical evidence on non-financial firms of China. PLoS ONE 18: e0287135. [Google Scholar] [CrossRef]
- LeCun, Yann, Yoshua Bengio, and Geoffrey Hinton. 2015. Deep learning. Nature 521: 436–44. [Google Scholar] [CrossRef]
- Lee, Tom. 1986. Laker Airways—The cash flow truth. In Towards a Theory and Practice of Cash Flow Accounting (RLE Accounting). London: Routledge. [Google Scholar]
- Li, Zhiyong, Jonathan Crook, Galina Andreeva, and Ying Tang. 2021. Predicting the risk of financial distress using corporate governance measures. Pacific-Basin Finance Journal 68: 101334. [Google Scholar] [CrossRef]
- Malik, Pankaj, Ankita Chourasia, Rakesh Pandit, Sheetal Bawane, and Jayesh Surana. 2024. Credit Risk Assessment and Fraud Detection in Financial Transactions Using Machine Learning. Journal of Electrical Systems 20: 2061–69. [Google Scholar] [CrossRef]
- Mavengere, Kudakwashe. 2015. Liquidity Analysis of Zimbabwe Stock Exchange (ZSE) Listed Retail Companies Using Traditional Ratios and Cash Flow Ratios. International Journal of Management Sciences and Business Research 4: 58–64. [Google Scholar]
- Metz, Charles E. 1978. Basic Principles of ROC Analysis. Seminars in Nuclear Medicine 8: 283–98. [Google Scholar] [CrossRef]
- Morrison, Andra, Julie Polisena, Don Husereau, Kristen Moulton, Michelle Clark, Michelle Fiander, Monika Mierzwinski-Urban, Tammy Clifford, Brian Hutton, and Danielle Rabb. 2012. The effect of English-Language restriction on systematic review-based meta-analyses: A Systematic review of empirical studies. International Journal of Technology Assessment in Health Care 28: 138–44. [Google Scholar] [CrossRef]
- Nemati, Zahra, Ali Mohammadi, Ali Bayat, and Abbas Mirzaei. 2024. Financial Ratios and Efficient Classification Algorithms for Fraud Risk Detection in Financial Statements. International Journal of Industrial Mathematics 7: 46. [Google Scholar] [CrossRef]
- Ohlson, James A. 1980. Financial Ratios and the Probabilistic Prediction of Bankruptcy. Journal of Accounting Research 18: 109–31. [Google Scholar] [CrossRef]
- Okeke, Salome Ogochukwu, Chike E. Nwoha, and Anastasia N. Duru. 2024. Cash Flow Ratios and Business Failure of Healthcare Firms in Nigeria. International Journal of Business and Management Review 12: 39–54. [Google Scholar] [CrossRef]
- Page, Matthew J., Joanne E. McKenzie, Patrick M. Bossuyt, Isabelle Boutron, Tammy C. Hoffmann, Cynthia D. Mulrow, Larissa Shamseer, Jennifer M. Tetzlaff, Elie A. Akl, and Sue E. Brennan. 2021. The PRISMA 2020 statement: An updated guideline for reporting systematic reviews. International Journal of Surgery 88: 105906. [Google Scholar] [CrossRef]
- Rahman, Abdul Aziz A. Abdul. 2017. The relationship between solvency ratios and profitability ratios: Analytical study in food industrial companies listed in Amman Bursa. International Journal of Economics and Financial Issues 7: 86–93. [Google Scholar]
- Rashid, Chnar. 2021. The efficiency of financial ratios analysis to evaluate company’s profitability. Journal of Global Economics and Business 2: 119–32. [Google Scholar]
- Rizzo, Lorenzo, Giorgio Valentinuz, Dario Obratil, and Valentino Pediroda. 2020. Bankruptcy Prediction: A Model Based on Cash Flow Ratios: Evidence From Selected European Countries. International Journal of Business Administration 11: 89. [Google Scholar] [CrossRef]
- Ryu, Kisang, and Shawn Jang. 2004. Performance Measurement Through Cash Flow Ratios and Traditional Ratios: A Comparison of Commercial and Casino Hotel Companies. The Journal of Hospitality Financial Management 12: 15–25. [Google Scholar] [CrossRef]
- Tabot, Lious Ntoung Agbor, Helena Maria Santos de Oliveira, and Cláudia Pereira. 2016. Classification of bankruptcy with cash flow information: Evidence from small size firms. Corporate Board: Role, Duties and Composition 2: 86–95. [Google Scholar]
- Taffler, Richard J. 1983. The Assessment of Company Solvency and Performance Using a Statistical Model. Accounting and Business Research 13: 295–308. [Google Scholar] [CrossRef]
- Tarquinio, Lara. 2022. Assurance of Nonfinancial Information: A Comprehensive Literature Review. In Non-Financial Disclosure and Integrated Reporting: Theoretical Framework and Empirical Evidence. Edited by Lino Cinquini and Francesco De Luca. Cham: Springer International Publishing, pp. 353–73. [Google Scholar] [CrossRef]
- Tran, Kim Long, Hoang Anh Le, Thanh Hien Nguyen, and Duc Trung Nguyen. 2022. Explainable Machine Learning for Financial Distress Prediction: Evidence from Vietnam. Data 7: 160. [Google Scholar] [CrossRef]
- Waqas, Hamid, and Rohani Md-Rus. 2018a. Predicting financial distress: Applicability of O-score model for pakistani firms. Business and Economic Horizons 14: 389–401. [Google Scholar]
- Waqas, Hamid, and Rohani Md-Rus. 2018b. Predicting financial distress: Importance of accounting and firm-specific market variables for Pakistan’s Listed firms. Cogent Economics & Finance 6: 1545739. [Google Scholar]
- Wasserbacher, Helmut, and Martin Spindler. 2022. Machine learning for financial forecasting, planning and analysis: Recent developments and pitfalls. Digital Finance 4: 63–88. [Google Scholar] [CrossRef]
- Yap, Ben Chin-Fook, David Gun-Fie Yong, and Wai-Ching Poon. 2010. How well do financial ratios and multiple discriminant analysis predict company failures in malaysia. International Research Journal of Finance and Economics 54: 166–75. [Google Scholar]
- Zhang, Zijiao, Chong Wu, Shiyou Qu, and Xiaofang Chen. 2022. An explainable artificial intelligence approach for financial distress prediction. Information Processing & Management 59: 102988. [Google Scholar] [CrossRef]
- Zmijewski, Mark E. 1984. Methodological Issues Related to the Estimation of Financial Distress Prediction Models. Journal of Accounting Research 22: 59–82. [Google Scholar] [CrossRef]


| Study ID | Aim | Methodology | Results | |
|---|---|---|---|---|
| 1 | (Ariska et al. 2021) | To examine gender diversity and financial ratios on financial distress in manufacturing firms. | Logistic regression analysis of 94 companies from 2014 to 2018. | Return on assets negatively impacts distress; working capital to total assets positively impacts distress. |
| 2 | (Atieh 2014) | To compare cash flow ratios and traditional ratios in assessing liquidity in Jordan’s pharmaceutical sector. | Statistical Package for the Social Sciences (SPSS) analysis of financial data from 7 companies between 2007 and 2012. | Cash flow ratios provide more insight into liquidity than traditional ratios. |
| 3 | (Barua and Saha 2015) | The main focus of this study is exploring the potential of traditional and cash flow ratios in the prediction of forthcoming cash flows in Bangladeshi companies. | The study analyzed financial data from non-manufacturing companies listed on the Dhaka Stock Exchange from 2001 to 2010. It used both traditional ratios derived from balance sheets and income statements and cash flow-based ratios derived from cash flow statements. | Based on empirical evidence, it has been established that the cash flow and accrual components of earnings are reliable indicators for forecasting future cash flows of Bangladeshi companies listed on the stock market. It has also been concluded that cash flow ratios are more effective in predicting future cash flows than traditional ratios. Nevertheless, it should be noted that the accuracy of the financial picture offered by cash flow ratios is sometimes superior and may vary. |
| 4 | (Bhandari and Iyer 2013) | To develop a new model for predicting business failure using primarily cash flow statement-based measures. | The study analyzed data from 100 firms (50 failed and 50 non-failed) using discriminant analysis. The predictor variables included operating cash flow divided by current liabilities, cash flow coverage of interest, operating cash flow margin, operating cash flow return on total assets, earning quality, quick ratio, and three-year sales growth. Data were sourced from COMPUSTAT and analyzed using IBM SPSS Statistic, Version 19.0 software. | The discriminant analysis model correctly classified 83.3% of the original grouped cases. The cross-validated method correctly classified 79.5% of cases. The model performed exceptionally well at distinguishing between failed and non-failed firms, with statistical significance achieved at the Wilks’ lambda test (p < 0.001). |
| 5 | (Bhandari et al. 2019) | To compare accrual vs. cash flow-based financial measures for predicting business failure. | Logistic regression to compare financial measures in predicting failure. | Cash flow-based measures outperform accrual measures for predicting business failures. |
| 6 | (Charitou et al. 2004) | To investigate the incremental information content of operating cash flows over traditional accounting measures in predicting financial distress using neural networks and logit analysis. | The study used a dataset of fifty-one matched pairs of failed and non-failed UK public industrial firms from 1988 to 1997. Neural networks and logit methodologies were applied to assess the predictive power of cash flow-based and traditional accrual-based financial ratios. Validation was performed using the out-of-sample ex-ante test and the Lachenbruch jackknife procedure. | The study found that models incorporating cash flow ratios, along with profitability and financial leverage ratios, provided a high classification accuracy of 83% one year prior to failure, demonstrating significant predictive power in assessing financial distress. |
| 7 | (Chen et al. 2021) | To develop hybrid models for financial distress prediction in Taiwan’s electronics industry. | Hybrid models combining machine learning and traditional methods. | Hybrid models achieved high accuracy, with liquidity and debt ratios as key predictors. |
| 8 | (Gregova et al. 2020) | To compare the effectiveness of logistic regression, random forest, and neural network models in predicting financial distress among industrial enterprises in Slovakia, aiming to identify the most accurate prediction model for this specific environment. | The study utilized a dataset of approximately 50,000 Slovak industrial enterprises from 2016 to 2018, evaluating the prediction accuracy of three different models (logistic regression, random forest, neural network) in the context of new legislation impacting financial crisis definitions. | All models showed high discrimination accuracy, with neural network models demonstrating superior performance across all evaluated metrics. This highlights the potential of machine learning techniques in enhancing the predictability of financial distress in specific national contexts |
| 9 | (Jooste 2007) | To evaluate the effectiveness of various cash flow ratios in predicting financial distress and potential bankruptcy, highlighting the potential of these ratios to serve as early warning indicators. | The study analyzed eight cash flow ratios across ten failed entities and compared them to similar non-failed entities in the same sectors for five years prior to failure. Mean values for each ratio were calculated annually to compare the financial states of the failed and non-failed entities. | The study found that cash flow ratios, particularly the cash flow to total debt ratio, effectively predicted financial failure up to three years in advance. Failed entities consistently showed poorer cash flow ratios compared to non-failed entities, indicating their inability to meet debt obligations and higher tendencies to incur debt. |
| 10 | (Kirkham 2012) | To examine the value of analyzing company liquidity using traditional ratios compared to the more recently devised cash flow ratios. | The study compared traditional liquidity ratios (current ratio, quick ratio, interest coverage ratio) with cash flow ratios (cash flow ratio, critical needs cash coverage ratio, cash interest coverage ratio) for twenty-five companies in the telecommunications sector in Australia over a five-year period. Data were sourced from the FinAnalysis database. | The study revealed that there were significant differences between traditional liquidity ratios and cash flow ratios. It found that decisions based solely on traditional ratios could lead to incorrect conclusions about a company’s liquidity, either overestimating or underestimating the true cash flow position of the companies. |
| 11 | (Kušter 2023) | To create a financial distress prediction model for Serbian companies using discriminant analysis. | Discriminant analysis on financial data from 74 companies. | Model achieved 71.6% classification accuracy; Altman Z-score variables were key predictors. |
| 12 | (Gholampoor and Asadi 2024) | To assess bankruptcy risks in U.S. healthcare industries using machine learning models. | Gradient boosting on financial data from 1265 firms using 40 financial ratios. | Gradient boosting achieved over 90% accuracy; ROI and ROA were key predictors. |
| 13 | (Kumar et al. 2020) | To predict corporate financial distress in Indian companies using logistic regression. | Logistic regression on financial data from 51 companies listed on BSE/NSE. | Interest coverage ratio, net profit margin, and working capital were significant predictors of insolvency. |
| 14 | (Mavengere 2015) | To analyze liquidity in Zimbabwean retail companies using traditional and cash flow ratios. | Comparison of liquidity ratios using company financial statements. | Cash flow ratios revealed insights missed by traditional ratios. |
| 15 | (Nemati et al. 2024) | To identify fraud risk detection methods in financial statements using classification algorithms. | Machine learning algorithms (Support Vector Machines (SVM), bagging, K-Nearest Neighbors (K-NN)) applied to financial data of 180 firms. | Bagging performed best, achieving an accuracy of 81.7%. |
| 16 | (Okeke et al. 2024) | To analyze cash flow ratios as predictors of business failure in Nigerian healthcare firms. | Multiple regression analysis of healthcare firms (2013–2022). | Operating cash flow and cash flow-to-debt ratios had non-significant effects on Altman Z-scores. |
| 17 | (Rizzo et al. 2020) | To test cash flow ratios in financial distress prediction using genetic algorithms and fuzzy logic. | Analysis of 719,124 companies across five European countries using machine learning models. | Model showed strong performance in predicting bankruptcy; country-level variations in performance noted. |
| 18 | (Ryu and Jang 2004) | To compare cash flow and traditional financial ratios in hospitality companies. | Independent t-tests of financial data from hotel companies. | Cash flow ratios were more reliable indicators of liquidity than traditional ratios. |
| 19 | (Tabot et al. 2016) | To evaluate the effectiveness of cash flow components in predicting bankruptcy among small, unlisted firms. | Logistic regression analysis of cash flows. | Cash flow components provided a superior prediction of bankruptcy compared to financial ratios. The study highlighted the particular effectiveness of certain cash flow ratios over traditional financial metrics in forecasting firm distress, emphasizing their utility in financial distress models for small firms. |
| 20 | (Waqas and Md-Rus 2018b) | To predict financial distress using accounting and market variables in Pakistani firms. | Logit regression analysis on financial data from 290 non-financial firms over 10 years. | Profitability, liquidity, and leverage ratios were significant predictors of financial distress. |
| 21 | (Waqas and Md-Rus 2018a) | Compare O-score model and logit model in predicting financial distress in Pakistani firms. | Empirical analysis of 290 firms (2006–2016) using financial ratios. | Logit model outperformed O-score model in predictive accuracy; cash flow ratios enhanced distress prediction. |
| Num. | Study ID | Region | Industry | Time Period | Sample Size | Financial Ratios Analyzed | Model(s) Used | Accuracy (%) | AUC | Key Predictors |
|---|---|---|---|---|---|---|---|---|---|---|
| 1 | (Ariska et al. 2021) | Indonesia | Manufacturing | 2014–2018 | 94 companies | Return on assets, net profit margin, current ratio, debt ratio | Logistic regression | 85 | 0.88 | Return on assets, working capital, debt ratio |
| 2 | (Atieh 2014) | Jordan | Pharmaceutical | 2007–2012 | 7 companies | Cash flow ratios, current ratio, quick ratio, operating cash margin | SPSS analysis | NA | NA | Current ratio, quick ratio, cash flow ratios |
| 3 | (Barua and Saha 2015) | Bangladesh | Non-manufacturing | 2001–2010 | 95 companies | Traditional financial ratios (e.g., ROA, ROE) and cash flow-based ratios (e.g., operating cash flow to total debt, free cash flow) | Comparative financial ratio analysis | NA | NA | Cash flow ratios were identified as better predictors of financial performance and future cash flows compared to traditional financial ratios |
| 4 | (Bhandari and Iyer 2013) | USA | Various industries | 2008–2010 | 100 firms (50 failed, 50 non-failed) | Operating cash flow divided by current liabilities, cash flow coverage of interest, operating cash flow margin, operating cash flow return on total assets, earning quality, quick ratio, three-year sales growth | Discriminant analysis (DA) | 83.3% (original grouped cases), 79.5% (cross-validated) | NA | Operating cash flow/current abilities, cash flow coverage of interest, operating cash flow margin, operating cash flow return on total assets, earning quality, quick ratio, three-year sales growth |
| 5 | (Bhandari et al. 2019 ) | USA | Mixed industries | NA | NA | Cash flow ratios vs. accrual measures | Binary logistic regression | 96.8 | NA | Cash flow ratios vs. accrual measures |
| 6 | (Charitou et al. 2004) | United Kingdom | Industrial (public firms) | 1988–1997 | 102 firms (51 matched pairs of failed and non-failed firms) | Cash flow ratios, profitability ratios, financial leverage ratios | Neural networks, Logit analysis | 83% | NA | Cash flow ratio, profitability ratio, financial leverage ratio |
| 7 | (Chen et al. 2021) | Taiwan | Electronics | 2000–2019 | 8 industries | Liquidity ratio, debt ratio, fixed assets turnover ratio | Hybrid intelligent models (logistic, K-Nearest Neighbors, decision trees (DT) | 92% | NA | Liquidity ratio, debt ratio, fixed assets turnover |
| 8 | (Gholampoor and Asadi 2024) | USA | Healthcare | 2022 | 1.265 companies | ROI, ROA, EV/EBIT | Machine learning (gradient boosting) | 90% | 0.92 | ROI, ROA, EV/EBIT |
| 9 | (Gregova et al. 2020) | Slovakia | Industrial | 2016–2018 | Approximately 50,000 enterprises | Return on capital (net), return on capital (gross), return on corporate revenues (net), asset turnover, current assets turnover, cash ratio, quick ratio, current ratio, net working capital ratio, RE–TA ratio retained, earnings/total assets, debt ratio, current debt ratio, financial debt ratio, debt–equity ratio. | Logistic regression, random forest, neural networks | The study mentions high discrimination accuracy with neural networks outperforming other models. | NA | NA. Involved a broad set of financial ratios used to feed the predictive models. |
| 10 | (Jooste 2007) | South Africa | Multiple sectors, excluding public utilities, transportation, investment, insurance, and financial institutions due to their unique financial structures | 2000–2004 | 10 failed entities compared with 14 non-failed entities (after excluding 6 non-financially sound entities from an initial group of 20) | Cash flow to sales, cash flow to assets, reinvestment ratio, cash flow to total debt, critical needs coverage, cash interest coverage, dividend coverage, cash flow to income | Comparative financial analysis using cash flow ratios | NA | NA | Cash flow to total debt, which was identified as the best indicator of failure among the studied ratios |
| 11 | (Kirkham 2012) | Australia | Telecommunications | 2007–2011 | 25 companies | Traditional ratios (current ratio, quick ratio, interest coverage ratio), cash flow ratios (cash flow ratio, critical needs cash coverage ratio, cash interest coverage ratio) | Comparative financial ratio analysis | NA | NA | The study did not specifically identify ’key predictors’ as it was not predictive modeling but did highlight the comparative effectiveness of cash flow ratios versus traditional ratios in liquidity analysis. |
| 12 | (Kušter 2023) | Serbia | General businesses | Pre-bankruptcy | 74 companies | Common financial ratios (Altman Z-Score variables) | Discriminant analysis, logistic models | 71.6 | NA | Financial Ratios (Altman Z-Score variables) |
| 13 | (Kumar et al. 2020) | India | Mixed sectors | NA | 51 companies | Net profit margin, interest coverage ratio, working capital ratio | Binary logistic regression | 96.8 | 0.94 | Net profit margin, interest coverage ratio |
| 14 | (Mavengere 2015) | Zimbabwe | Retail | 2010–2014 | Multiple | Current ratio, quick ratio, cash flow ratios | Comparative analysis | NA | NA | Current ratio, quick ratio, cash flow ratios |
| 15 | (Nemati et al. 2024) | Iran | Various sectors | 2014–2021 | 180 companies | Nine key financial ratios (post optimization) | Machine learning (bagging, SVM, etc.) | 81.7 | NA | Nine optimized financial ratios |
| 16 | (Okeke et al. 2024) | Nigeria | Healthcare | 2013–2022 | Multiple | Operating cash flow ratio, cash flow-to-debt ratio, price-to-cash flow ratio | Multiple Regression | NA | NA | Operating Cash flow, cash-flow-to-debt ratio |
| 17 | (Rizzo et al. 2020) | Europe | Multiple sectors | 2015–2018 | 719,124 companies | Cash flow ratios, genetic algorithms, and fuzzy logic | Genetic algorithms, fuzzy logic | NA | NA | Profitability, liquidity, leverage, cash flow ratios |
| 18 | (Ryu and Jang 2004) | USA | Hospitality | 5 years | Multiple | Liquidity, solvency, and operational efficiency ratios | T-test analysis | NA | 0.85 | Operating cash flow, debt ratios |
| 19 | (Tabot et al. 2016) | Spain | Various | 2008–2009 | 534 firms | Cash flow from operations/total liabilities, cash flow from operations/current liabilities, net liquid balance | Logistic regression | NA | NA | Cash flow from operations to total liabilities, cash flow from operations to current liabilities, net liquid balance |
| 20 | (Waqas and Md-Rus 2018b) | Pakistan | Various sectors | 2007–2016 | 290 firms | Profitability, liquidity, leverage, cash flow ratios, market factors | Logit regression | NA | NA | Liquidity, solvency, operational efficiency ratios |
| 21 | (Waqas and Md-Rus 2018a) | Pakistan | Various (Pakistan Stock Exchange) | 2006–2016 | 290 firms (45 distressed, 245 healthy) | Profitability, liquidity, leverage, cash flow ratios | Logit model, O-score model | Logit model had higher accuracy | Not explicitly reported | Cash flow ratios, leverage, profitability, liquidity |
Disclaimer/Publisher’s Note: The statements, opinions and data contained in all publications are solely those of the individual author(s) and contributor(s) and not of MDPI and/or the editor(s). MDPI and/or the editor(s) disclaim responsibility for any injury to people or property resulting from any ideas, methods, instructions or products referred to in the content. |
© 2025 by the authors. Licensee MDPI, Basel, Switzerland. This article is an open access article distributed under the terms and conditions of the Creative Commons Attribution (CC BY) license (https://creativecommons.org/licenses/by/4.0/).
Share and Cite
Seretidou, D.; Billios, D.; Stavropoulos, A. Integrative Analysis of Traditional and Cash Flow Financial Ratios: Insights from a Systematic Comparative Review. Risks 2025, 13, 62. https://doi.org/10.3390/risks13040062
Seretidou D, Billios D, Stavropoulos A. Integrative Analysis of Traditional and Cash Flow Financial Ratios: Insights from a Systematic Comparative Review. Risks. 2025; 13(4):62. https://doi.org/10.3390/risks13040062
Chicago/Turabian StyleSeretidou, Dimitra, Dimitrios Billios, and Antonios Stavropoulos. 2025. "Integrative Analysis of Traditional and Cash Flow Financial Ratios: Insights from a Systematic Comparative Review" Risks 13, no. 4: 62. https://doi.org/10.3390/risks13040062
APA StyleSeretidou, D., Billios, D., & Stavropoulos, A. (2025). Integrative Analysis of Traditional and Cash Flow Financial Ratios: Insights from a Systematic Comparative Review. Risks, 13(4), 62. https://doi.org/10.3390/risks13040062