Proactive Management of Regulatory Policy Ripple Effects via a Computational Hierarchical Change Management Structure

Abstract
:1. Introduction
1.1. Problem Statement
1.2. Motivation and Related Work
1.3. Study Objectives and the Expected Contribution
2. Related Literature
2.1. What is Banking Regulatory Policy and Its Importance?
2.2. Banking Regulatory Policy Challenges
2.3. How Does a Central Bank Policy Fail?
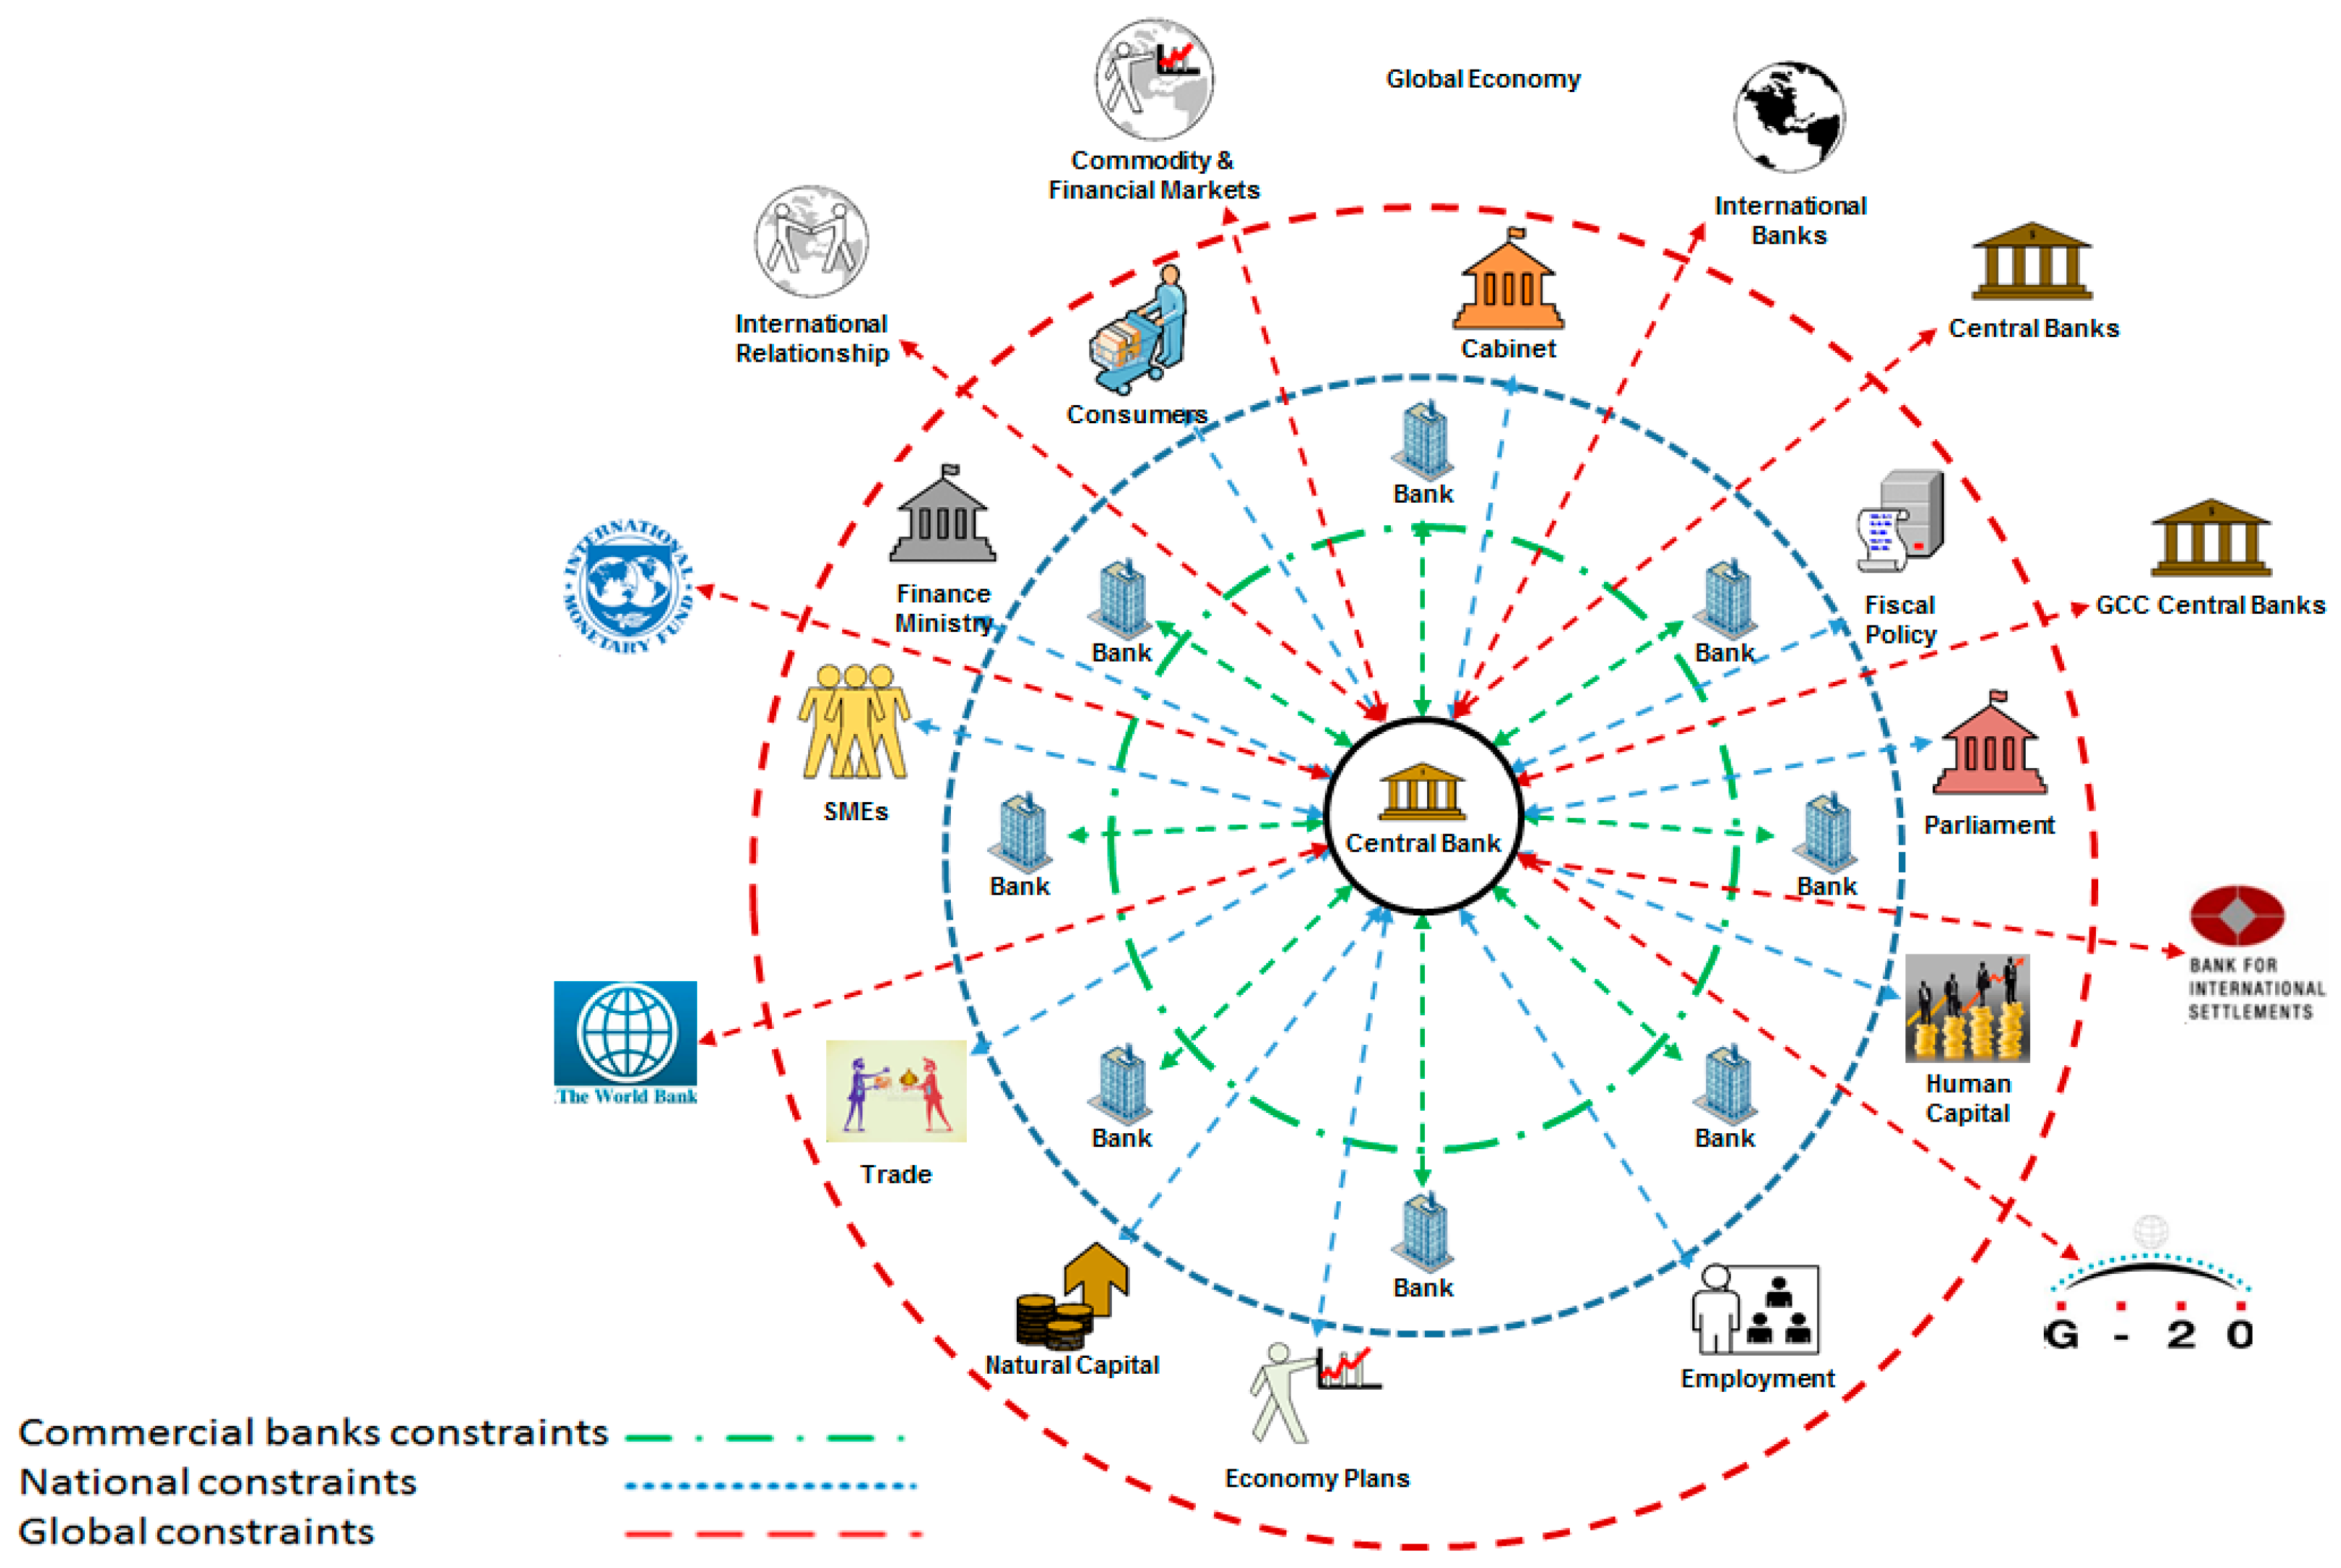
2.4. Regulatory Policy Impact on Commercial Banks, Consumers and Exogenous Organisations
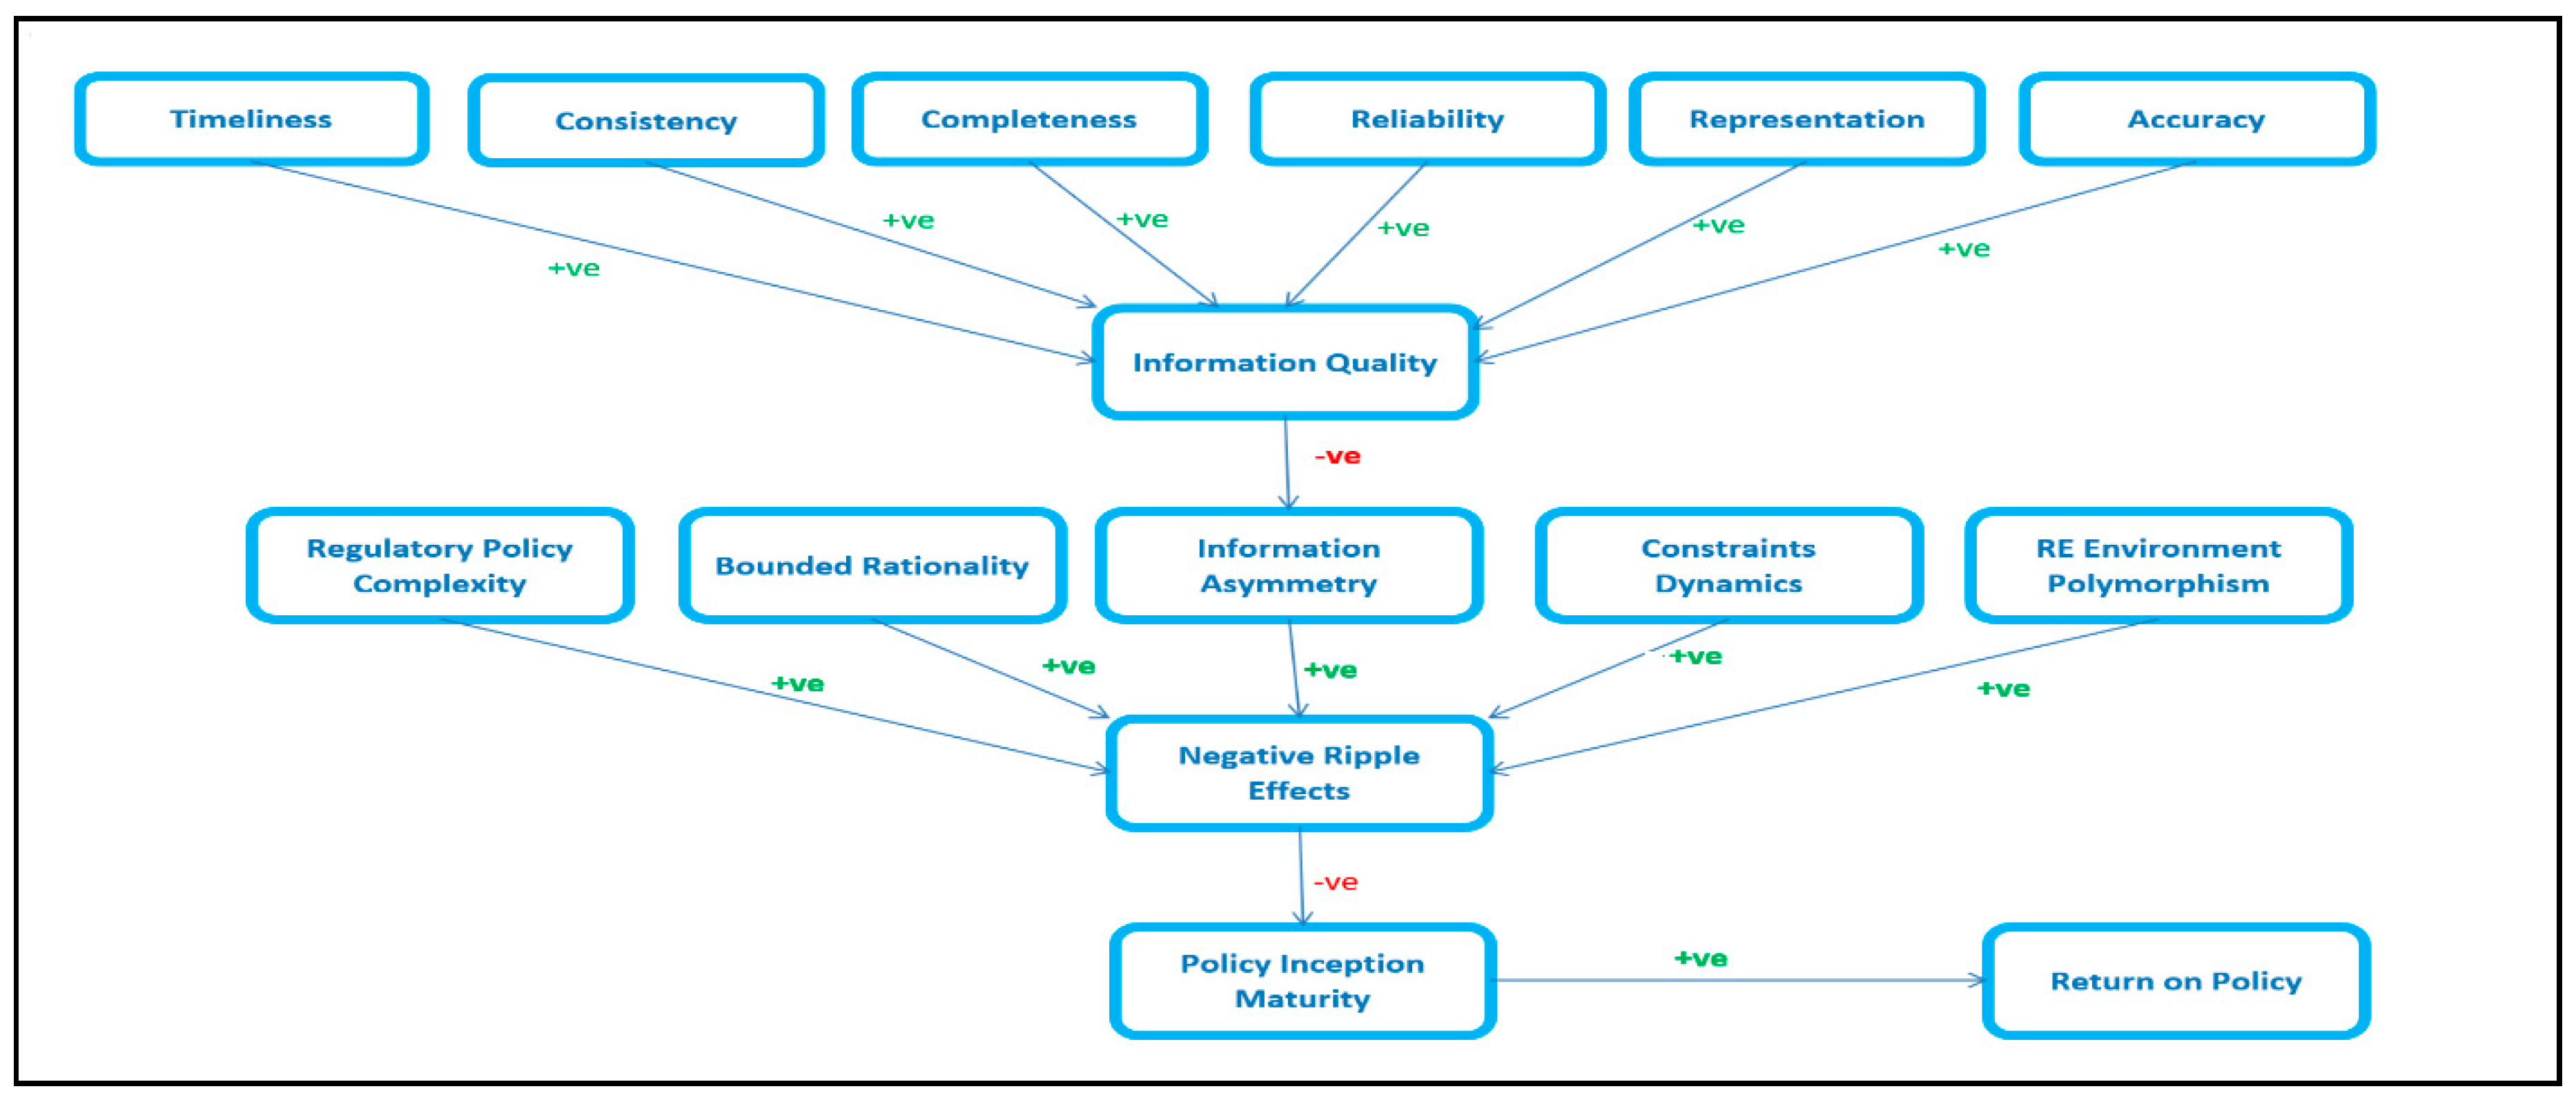
2.5. Feedback Loops, Ripple Effects and Complexity in Regulatory Policy Implementation
2.6. Causal Loop Analysis
2.7. Regulatory Risk Management
2.8. Knowledge Requirements for Regulatory Policy Execution
3. Materials and Methods
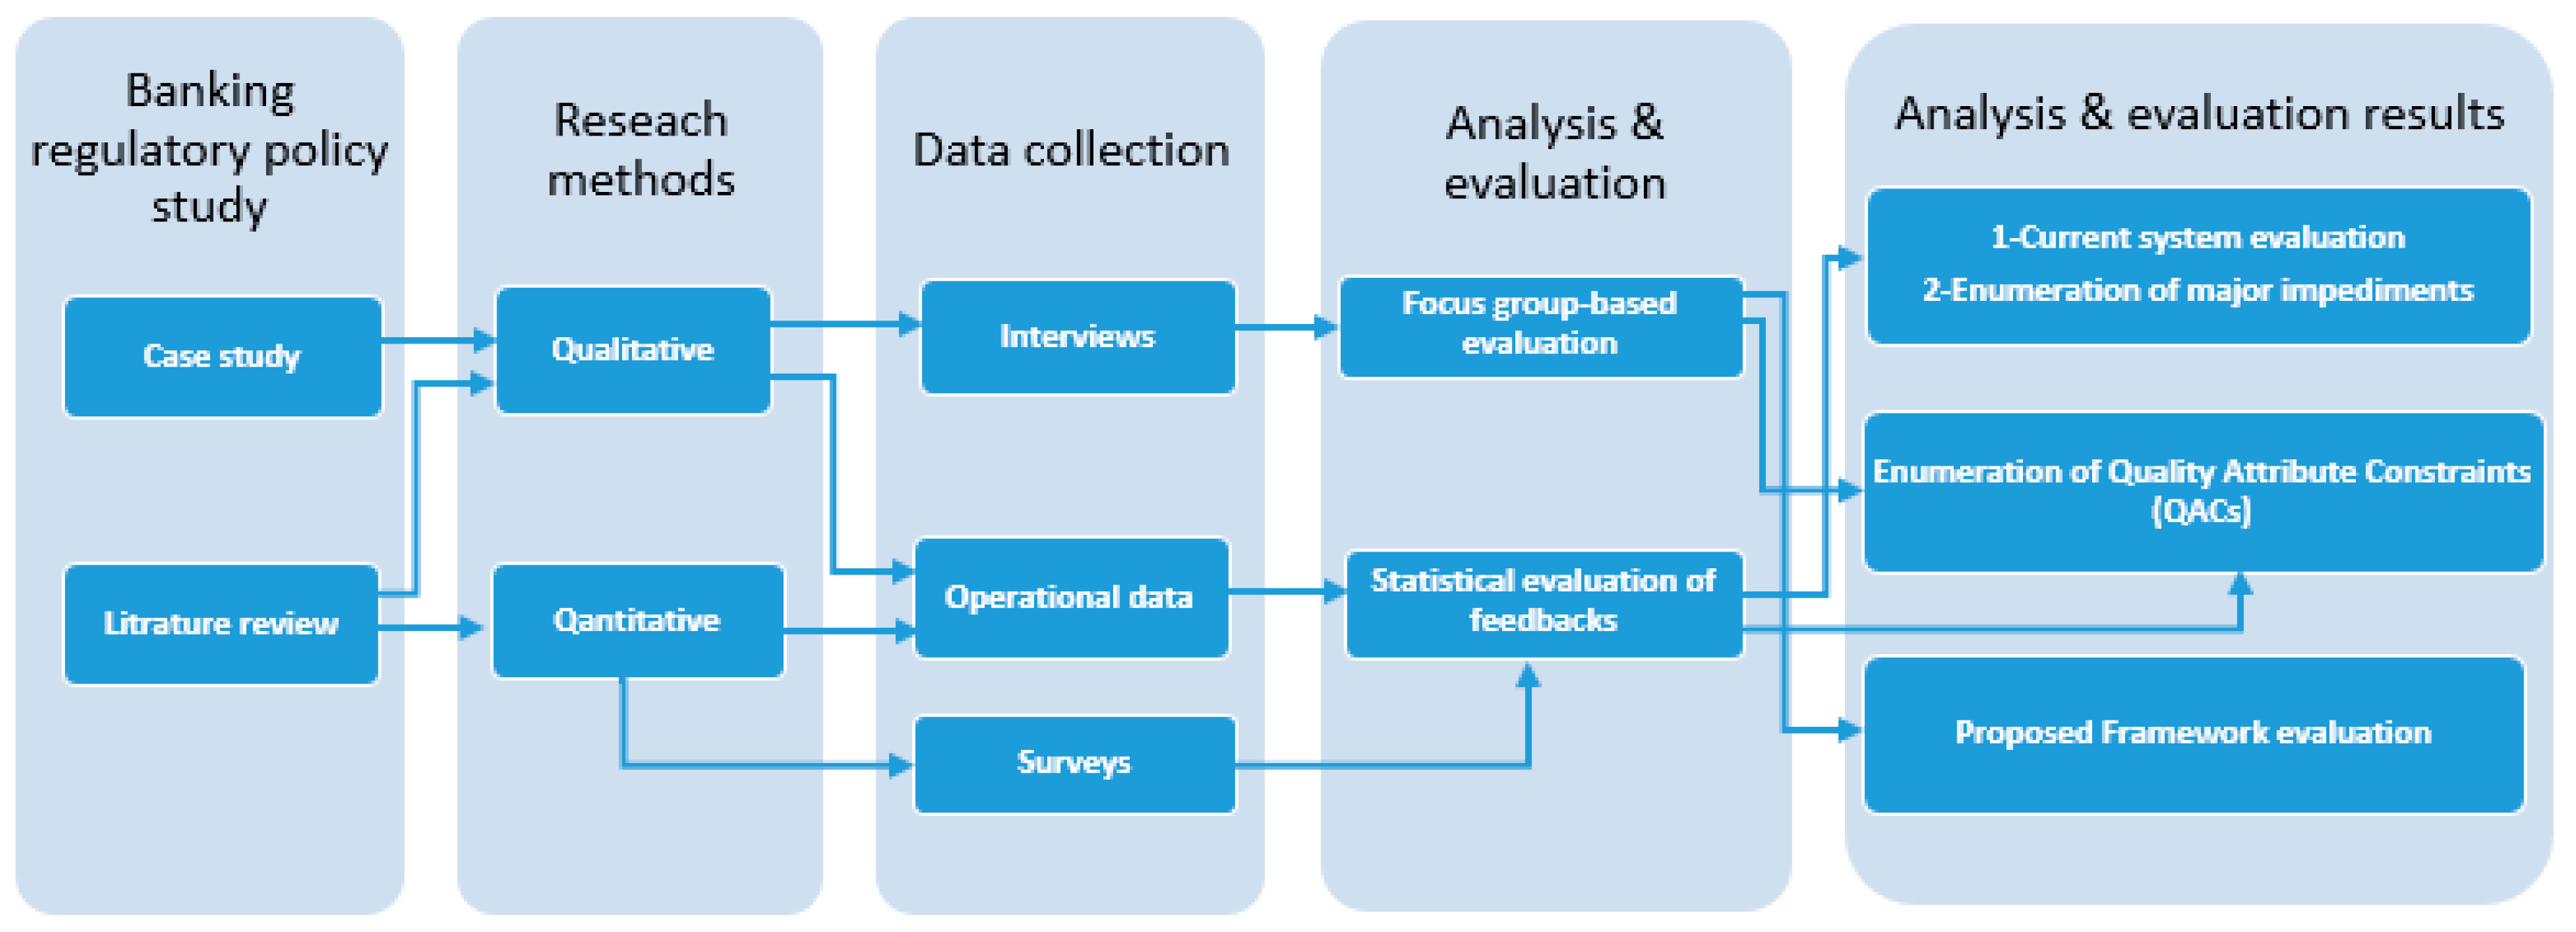
3.1. Research Design
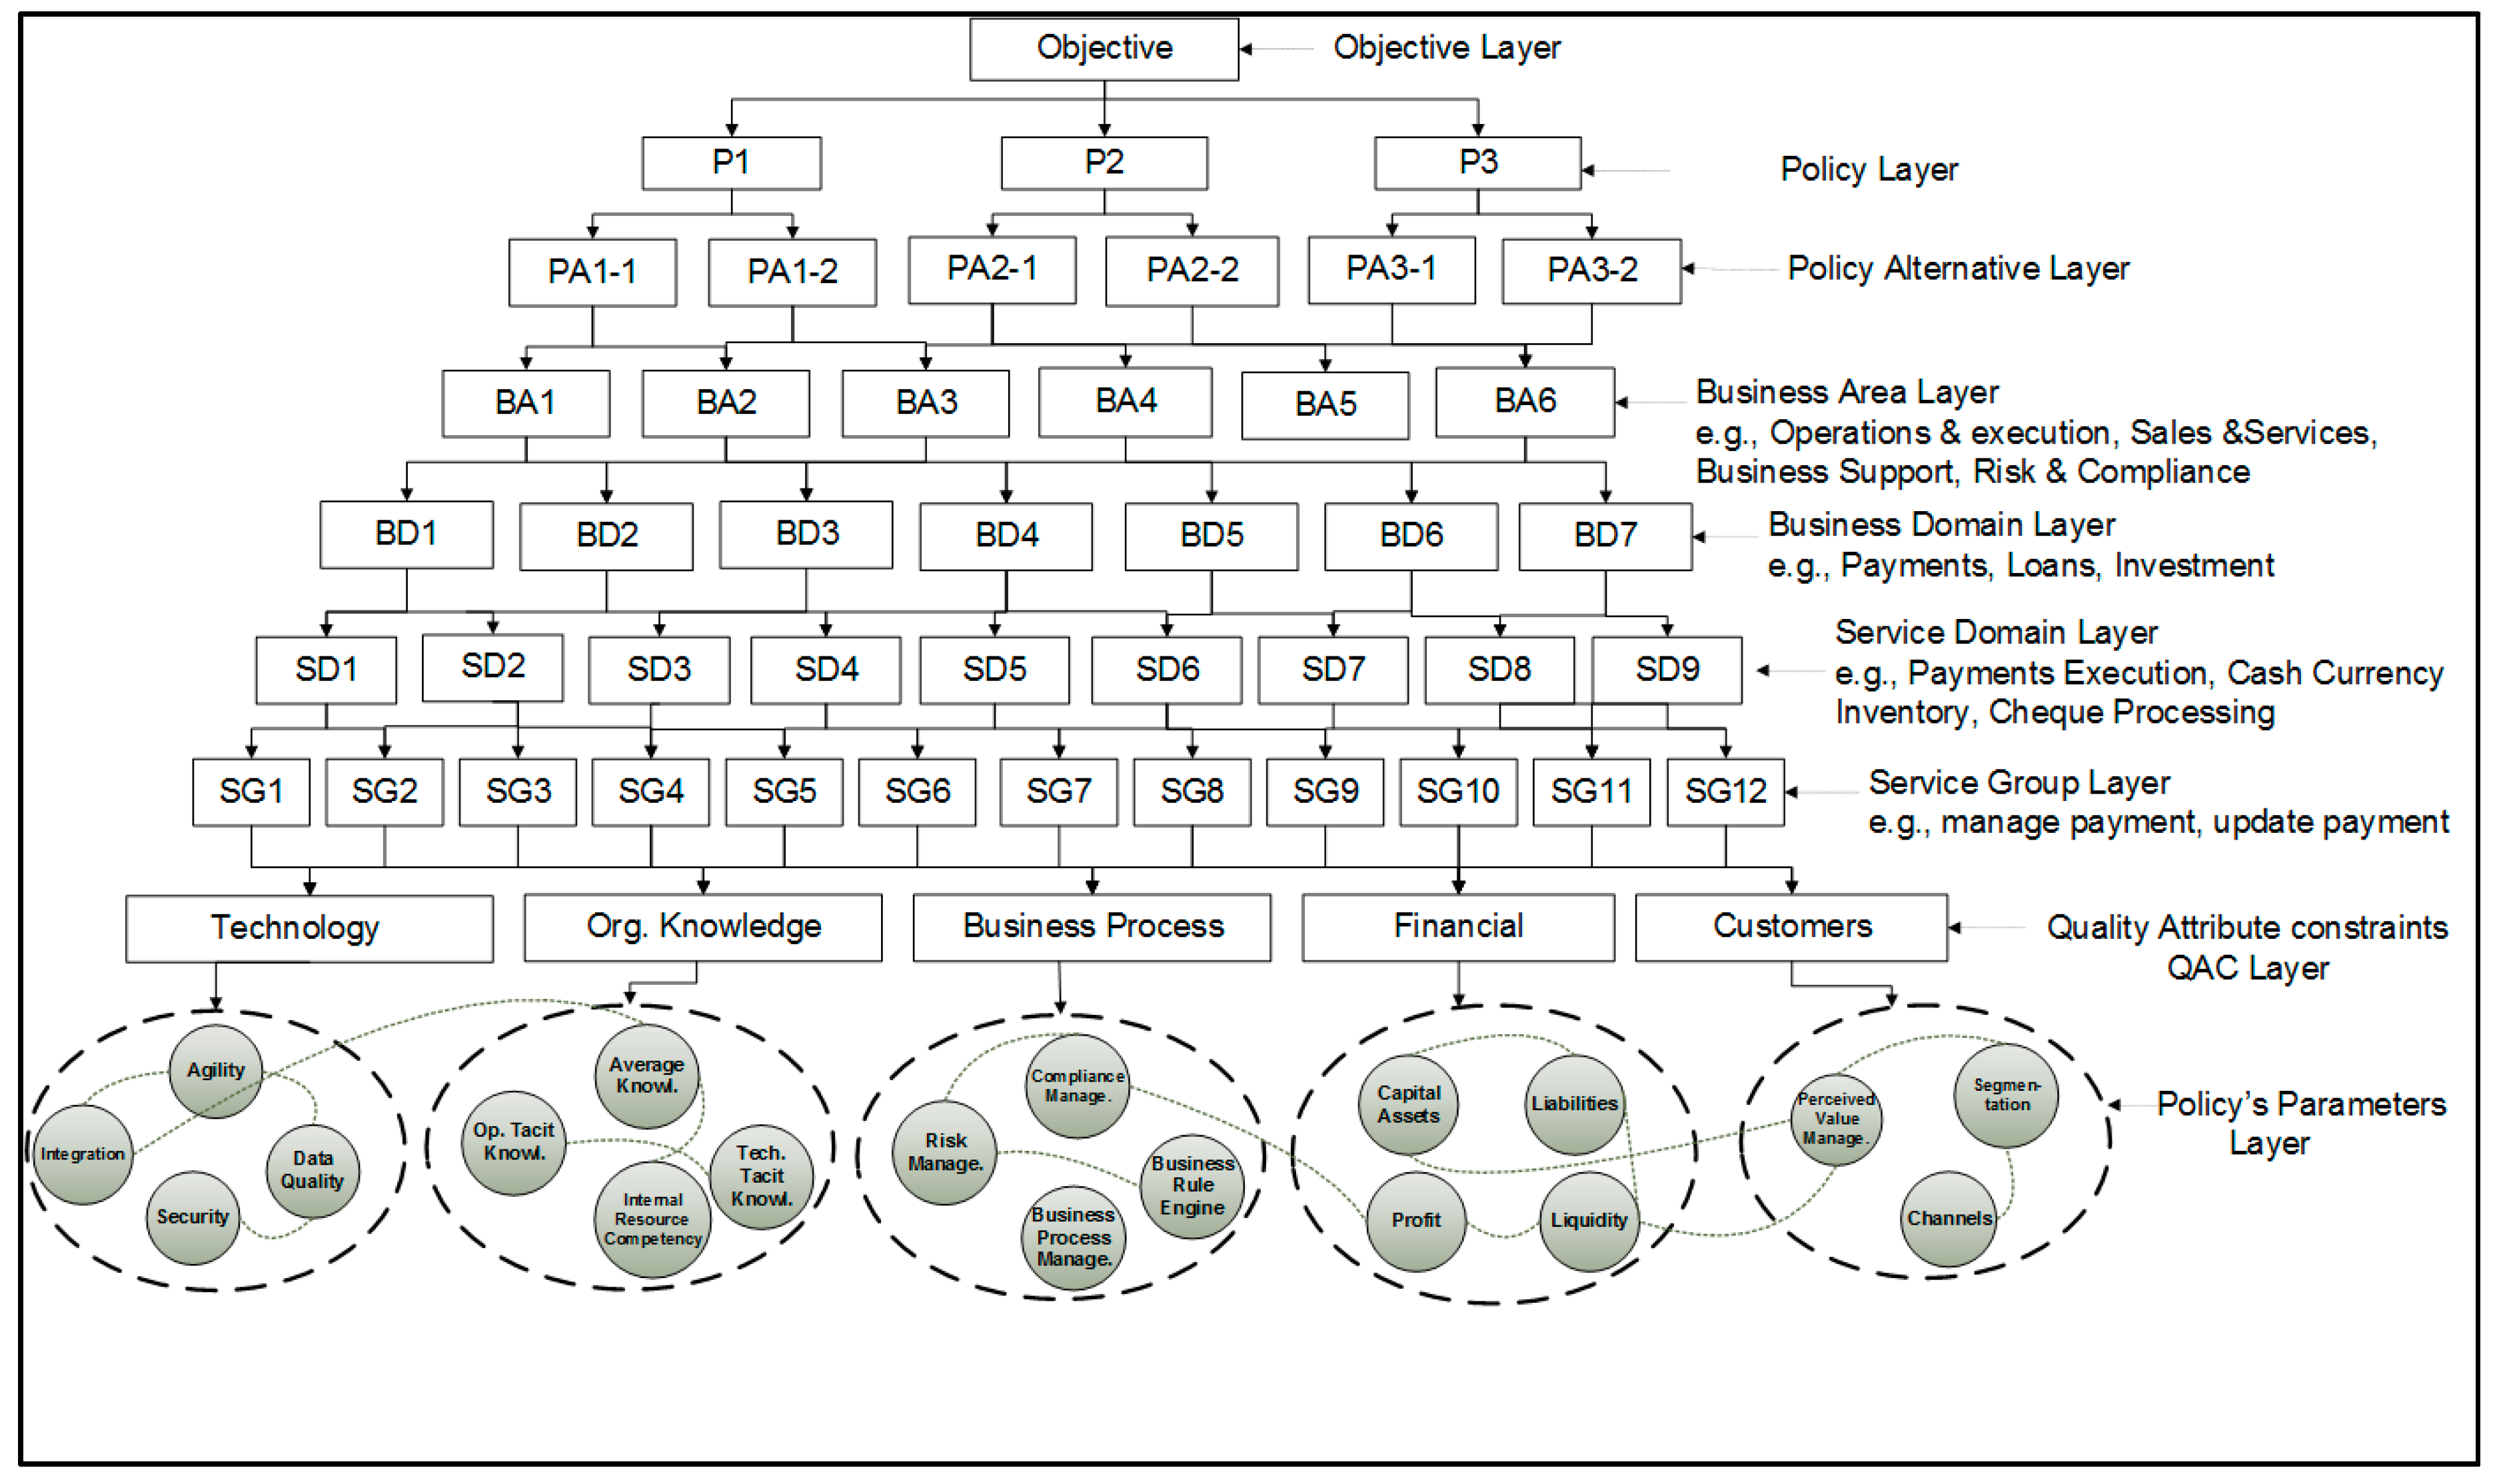
3.2. The Development of the Computational Regulatory Policy Change Governance Framework Structure
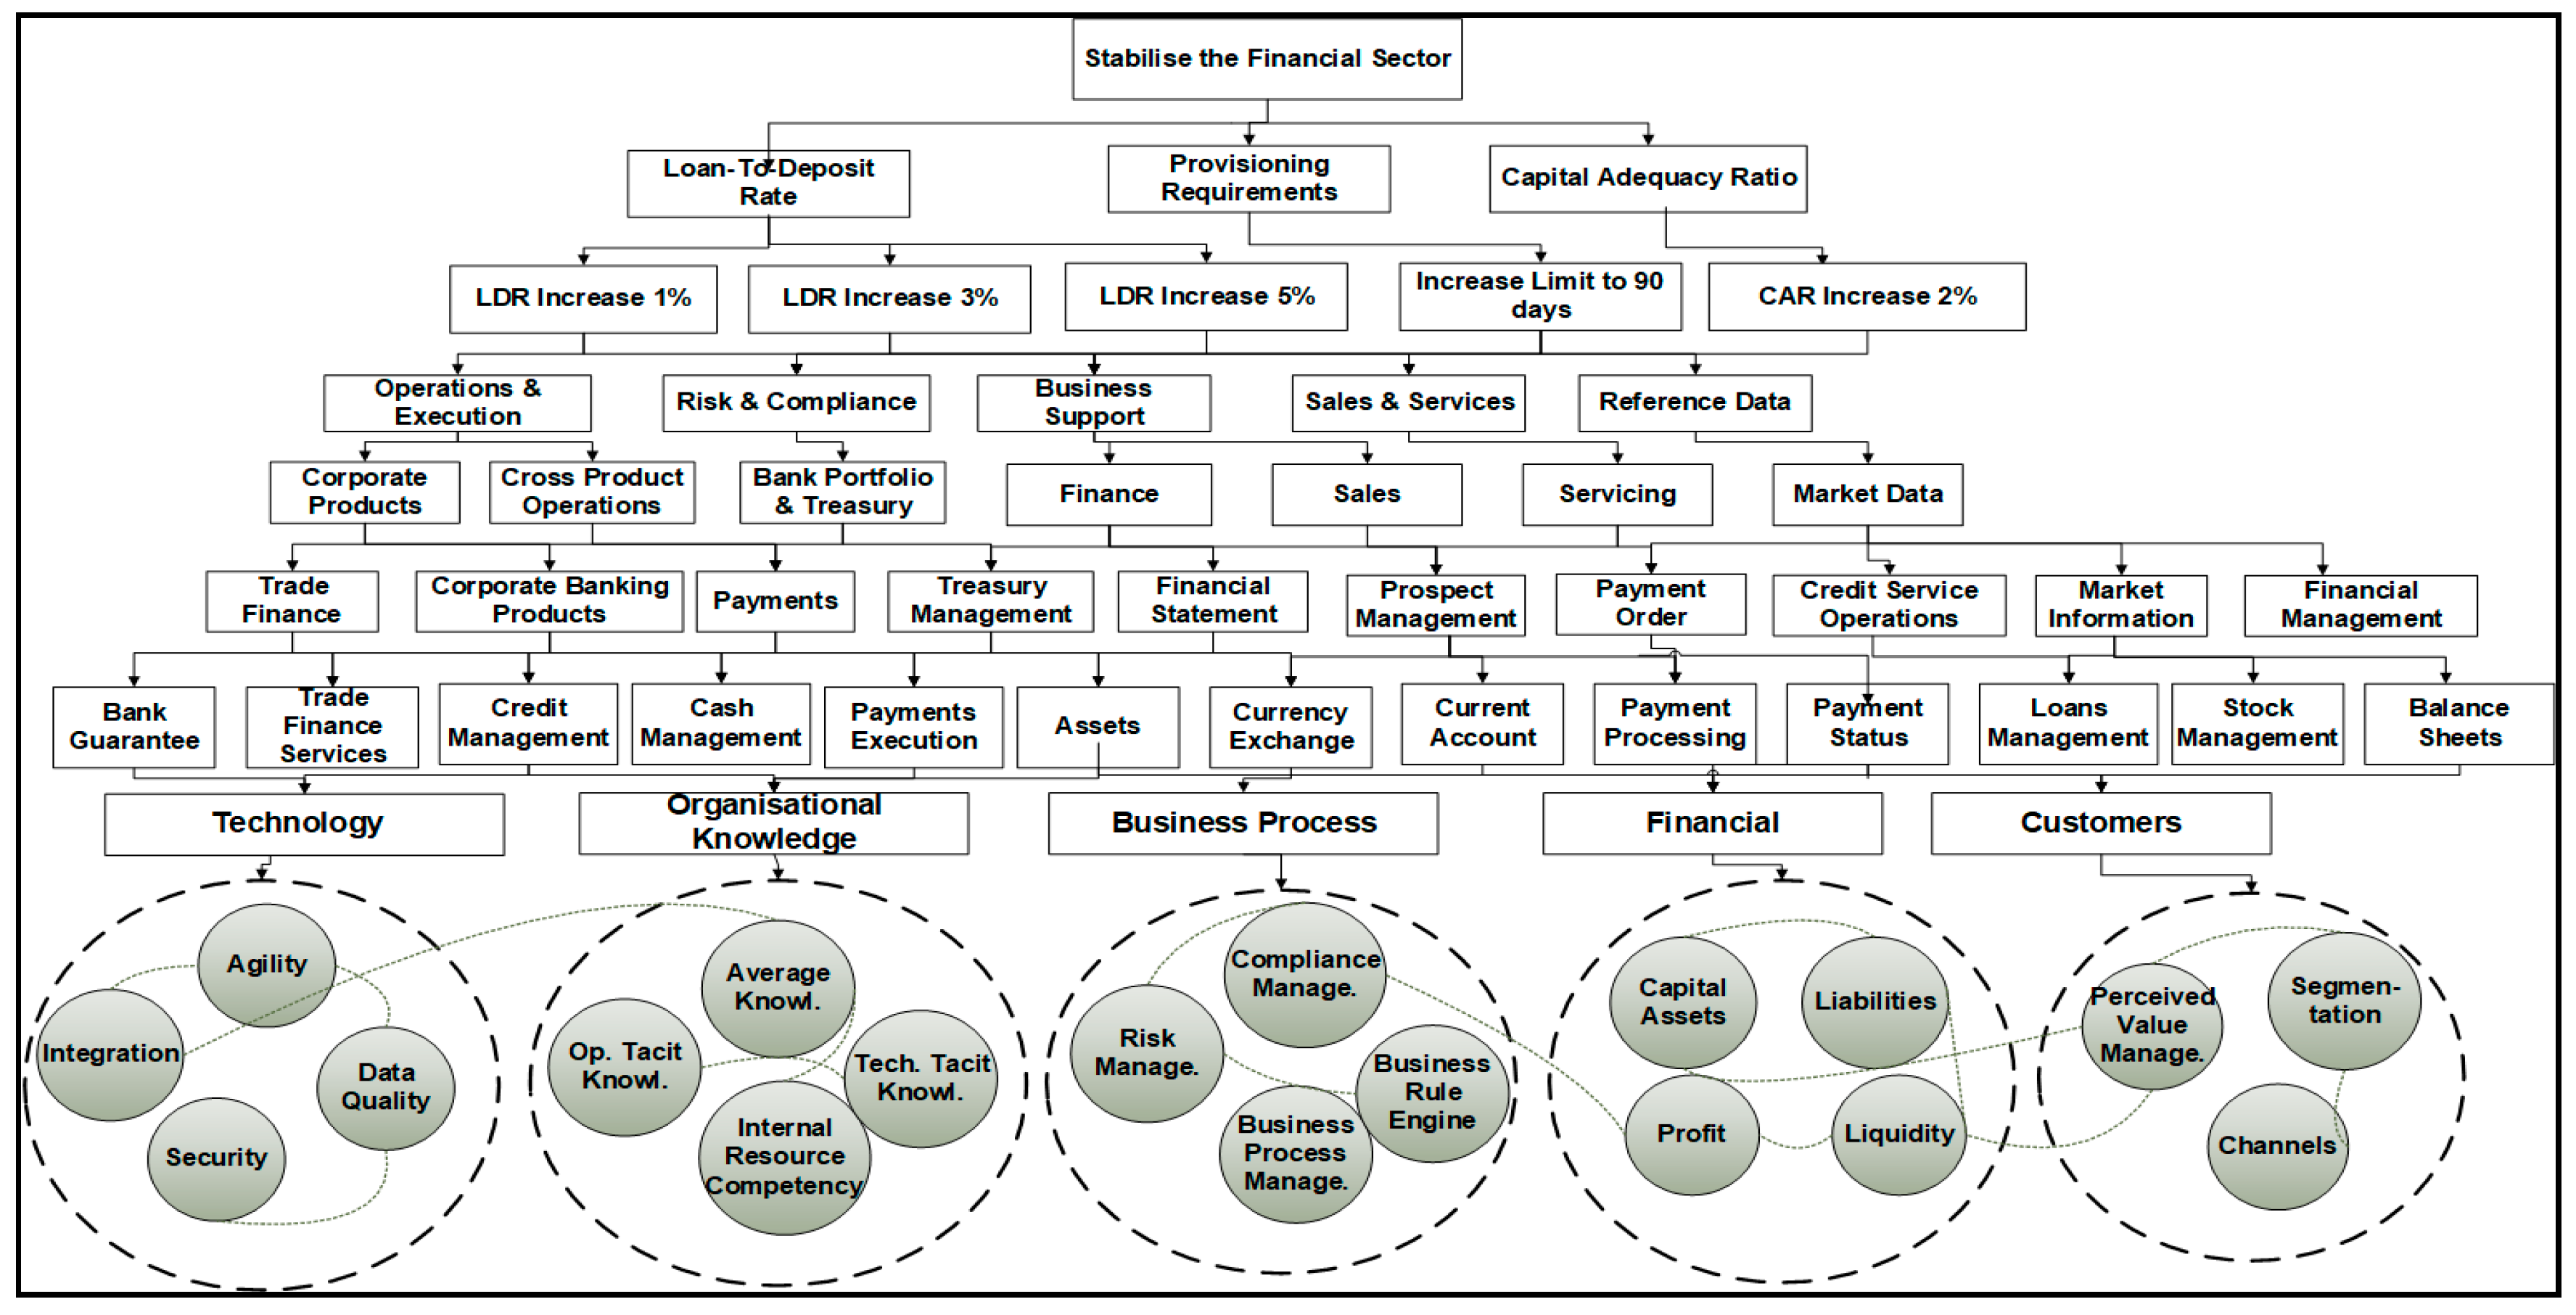
3.3. Application of Policy Instruments and Parameters
4. Results
5. Discussion
6. Conclusions
6.1. Implications to Theory and Practice
6.2. Key Lessons Learnt
6.3. Limitations of This Research
6.4. Future Research Recommendations
Author Contributions
Funding
Conflicts of Interest
Appendix A. Central Banks’ Regulatory Policy Multidimensional Constraints
Appendix B. Central Bank Regulatory Policy Quality-Attribute Constraints with Commercial Banks
Appendix C. Regulatory Policy Change Management Dimensions
Appendix D. Hierarchical Change Management Structure Computational Framework
Appendix E. The Generic Computational Regulatory Policy Change Governance Model (CRPCG)

Appendix F. Preliminary Data Analysis

| SAMA and Commercial Banks Preliminary and (Consolidated Surveys) | Related Quality Attribute Constraints | Average Score (No. of Participants = 10) Likert Scale (Low = 1, High = 5) | STD Average |
|---|---|---|---|
| 1. At what level you can predict the issues that the banks have during the implementation of SAMA’s policy? | Risk, Governance, Technology, Org. Knowledge | 1.81 | 0.457260 |
| 2. At what level do you rate the execution of SAMA’s regulations? | Business process, Technology, Org. Behaviour, Org. Knowledge | 3.14 | 0.776886 |
| 3. How do you rate the impact of SAMA’s policy implementation on the banks business processes? | Business process, Technology, Org. Knowledge | 3.82 | 0.740555 |
| 4. How do you rate the level of the interaction with the banks during SAMA’s policy? | Org. Behaviour, Customers | 3.19 | 0.657220 |
| 5. What is the data accuracy level of the implemented policies? | Governance, Technology | 2.26 | 0.402672 |
| 6. To what extent do you rate the new issues that arise after implementation of SAMA’s policy in the banks? | Org. knowledge, Governance, Technology | 3.32 | 0.431148 |
| 7. At what level do you rate the effectiveness of the implemented policy on banks’ operations? | Governance, Strategy, Financial | 3.01 | 0.543801 |
| 8. How do you rate the banks compliance with SAMA’s policy? | Risk, Financial, Governance | 3.00 | 0.444554 |
| 9. How do you rate the stability of SAMA’s policies? | Financial, Strategy | 3.08 | 0.552201 |
| 10. How do you rate the level of the executed policies? | Governance, Business process | 2.75 | 0.478427 |
| 11. How do you rate the dissatisfaction (negative impact) of exogenous entities (such as Ministry for Economic Planning, Ministry of Finance, Ministry of Labour, Royal Council) due to the implementation of new or updated regulatory policies? | Consumers, Strategy, Financial, Risk | 2.00 | 0.474455 |
| 12. How do you rate the frequency to update or modify the implemented policies? | Strategy, Org. knowledge, Org. behaviour, Governance | 3.09 | 0.598495 |
| 13. In what level do you rate the banks’ feedback and complaint (negative feedback and ripple effects) with SAMA’s policies? | Customers, Org. knowledge, Org. behaviour, Governance, Strategy, Risk | 3.14 | 0.542882 |
Appendix G. Quality Attribute Constraints Parameters
| # | Financial | Business Processes | Org. Knowledge | Technology | Customers |
|---|---|---|---|---|---|
| 1. | Capital Assets | Business Process Management | Technological Tacit Knowledge | Agility | Segmentation |
| 2. | Liabilities | Operations Management | Operational Tacit Knowledge | Performance Sensitivity | Experience Management |
| 3. | Profit | Compliance Management | Innovation Competencies | Dependency Complexity | Customer Integration |
| 4. | Liquidity | Product Management | Regulatory Compliance | Integration Affinity | Perceived Value (Inventory Management) |
| 5. | Wholesale Funding | Liquidity Management | Systemic Risk Continuous Stress Testing Strategy | Security Implementation | Channels e-channels, Social Channels |
| 6. | SIBOR | Business Rule Engine | Holistic Analysis | Data quality Implementation | Satisfaction |
| 7. | Credit Standard | Process Agility | Internal Resources Competencies | Reusability | |
| 8. | HQLA | Loosely coupled Implementation | Access to External Resources | Modularity | |
| 9. | Liquidity Risk | Bain Map Implementation | Average Knowledge Access Leadtime | Maturity (CMMI) | |
| 10. | Credit Growth | Risk Management Quantification | |||
| 11. | Total Loans | ||||
| 12. | Total Liabilities |
Appendix H. Research Design Chart
References
- Adem, Hamid. 2008. Analysis of Ripple Effects Triggered by the Implementation of New Regulatory Systems in Saudi Banks, Technical Report Presented to Bank Supervision Department, Retrieved from Riyadh, Saudi Arabia. Unpublished work.
- Adem, Hamid. 2010. Regulatory Policy Analysis Using Four Dimensional Agent Based Hybrid Nash Equilibrium Model, Technical Report Presented to Bank Supervision Department, Retrieved from Saudi Arabia. Unpublished work.
- Aldy, Joseph Edgar. 2014. Learning from Experience: An Assessment of the Retrospective Reviews of Agency Rules and the Evidence for Improving the Design and Implementation of Regulatory Policy. Administrative Conference of the United States. Available online: https://dash.harvard.edu/handle/1/23936082 (accessed on 12 March 2020).
- Alpanda, Sami, Gino Cateau, and Césaire Meh. 2014. A Policy Model to Analyze Macroprudential Regulations and Monetary Policy. Basel: BIS. [Google Scholar]
- Alrabiah, Abdulrahman. 2018. Optimal Regulation of Banking System’s Advanced Credit Risk Management by Unified Computational Representation of Business Processes Across the Entire Banking System. Cogent Economics and Finance 6: 1–22. [Google Scholar] [CrossRef] [Green Version]
- Alrabiah, Abdulrahman, and Steve Drew. 2018a. Deriving Organisational Business Process Change Factors using the Hierarchical Elicitation Workshop. International Journal of Business Process Integration and Management 9: 1–11. [Google Scholar] [CrossRef]
- Alrabiah, Abdulrahman, and Steve Drew. 2018b. Formulating optimal business process change decisions using a computational hierarchical change management structure framework: A case study. Journal of Systems and Information Technology 20: 207–40. [Google Scholar] [CrossRef] [Green Version]
- Anagnostopoulos, Yiannis, and Jackie Kabeega. 2018. Insider perspectives on European banking challenges in the post-crisis regulation environment. Journal of Banking Regulation 20: 136–58. [Google Scholar] [CrossRef]
- Anderson, Ron, Jon Danielsson, Chikako Baba, Udaibir S. Das, Heedon Kang, and Miguel A Segoviano Basurto. 2018. Macroprudential Stress Tests and Policies: Searching for Robust and Implementable Frameworks. Washington: International Monetary Fund. [Google Scholar]
- Armenia, Stefano, Camillo Carlini, and Riccardo Onori. 2014. Policy Modeling as a new area for research: Perspectives for a Systems Thinking and System Dynamics approach? Paper presented at 2nd International Symposium “SYSTEMS THINKING FOR A SUSTAINABLE ECONOMY. Advancements in Economic and Managerial Theory and Practice”, Universitas Mercatorum, Roma, Italy, January 23–24. [Google Scholar]
- Arnold, Bruce, Claudio Borio, Luci Ellis, and Fariborz Moshirian. 2012. Systemic risk, macroprudential policy frameworks, monitoring financial systems and the evolution of capital adequacy. Journal of Banking and Finance 36: 3125–32. [Google Scholar] [CrossRef]
- Ayadi, Rym. 2019. Banking Business Models: Definition, Analytical Framework and Financial Stability Assessment. Cham: Springer International Publishing. [Google Scholar]
- Ayadi, Rym, and Sami Mouley. 2013. Monetary Policies, Banking Systems, Regulatory Convergence, Efficiency and Growth in the Mediterranean. London: Palgrave Macmillan. [Google Scholar]
- Barth, James R., Tong Li, and Wenling Lu. 2010. Bank regulation in the United States. CESifo Economic Studies 56: 112–40. [Google Scholar] [CrossRef] [Green Version]
- Baudino, Patrizia, Roland Goetschmann, Jérôme Henry, Ken Taniguchi, and Weisha Zhu. 2018. Stress-testing Banks: A Comparative Analysis. In FSI Insights on Policy Implementation. Basel: FSI. [Google Scholar]
- Beck, Thorsten, Ross Levine, and Alexey Levkov. 2010. Big bad banks? The winners and losers from bank deregulation in the United States. Journal of Finance 65: 1637–67. [Google Scholar] [CrossRef] [Green Version]
- Bholat, David. 2016. Modeling Metadata in Central Banks. Statistics Paper Series. [Google Scholar] [CrossRef]
- BIAN. 2018. BIAN SERVICE LANDSCAPE 6.0. Available online: https://bian.org/deliverables/bian-standards/3154-2/ (accessed on 10 October 2018).
- Bicking, Melanie. 2011. Modeling and simulation to facilitate policy choices: The impact of policy modeling gaps on good governance. In Proceedings of the 12th Annual International Digital Government Research Conference: Digital Government Innovation in Challenging Times. College Park: Association for Computing Machinery, pp. 104–11. [Google Scholar]
- BIS. 2013. Integrated management of micro-databases. In Deepening Business Intelligence within Central Banks’ Statistical Systems. Porto: Irving Fisher Committee on Central Bank Statistics, vol. 37. [Google Scholar]
- Bank of International Settlements. 2015. Regulatory Change and Monetary Policy. Available online: https://www.bis.org/publ/cgfs54.htm (accessed on 11 March 2020).
- Bitetti, Rosamaria. 2018. Principles of the Austrian Tradition in the Policy Cycle. Austrian Economics: The Next Generation 23: 145–59. [Google Scholar]
- Black, Julia, and Stéphane Jacobzone. 2009. Tools for Regulatory Quality and Financial Sector Regulation. Paris: OECD Publishing. [Google Scholar]
- 2002. Political Intervention in Debt Contracts. Journal of Political Economy 110: 1103–34. [CrossRef] [Green Version]
- Bounds, Gregory. 2010. Challenges to Designing Regulatory Policy Frameworks to Manage Risks, In Risk and Regulatory Policy: Improving the Governance of Risk. Paris: OECD Publishing. [Google Scholar]
- Braun, Virginia, and Victoria Clarke. 2006. Using thematic analysis in psychology. Qualitative Research in Psychology 3: 77–101. [Google Scholar] [CrossRef] [Green Version]
- Brent, William H., and Charles K. Addo. 2012. Minimizing Information Asymmetry: Does Firm’s Characteristics Matter? Academy of Banking Studies Journal 11: 43. [Google Scholar]
- Broeders, Dirk, and Jermy Prenio. 2018. Innovative Technology in Financial Supervision (Suptech): The Experience of Early Users. Basel: Financial Stability Institute/Bank for International Settlements. [Google Scholar]
- Brown, Ashley C., Jon Stern, Bernard William Tenenbaum, and Defne Gencer. 2006. Handbook for Evaluating Infrastructure Regulatory Systems. Washington: World Bank Publications. [Google Scholar]
- Brunnermeier, Markus, José De Gregorio, Barry Eichengreen, Mohamed El-Erian, Arminio Fraga, and Takatoshi Ito. 2012. Banks and Cross-Border Capital Flows: Policy Challenges and Regulatory Responses. Committee on International Economic Policy and Reform. Washington: Brookings Institution. [Google Scholar]
- Jones, Bryan D., Graeme Boushey, and Samuel Workman. 2006. Behavioral rationality and the policy processes: Toward a new model of organizational information processing. In Handbook of Public Policy. London: SAGE Publications, pp. 49–74. [Google Scholar]
- Canuto, Otaviano, and Swati Ghosh. 2013. Dealing with the Challenges of Macro Financial Linkages in Emerging Markets. Herndon: World Bank Publications. [Google Scholar]
- Capano, Giliberto, and Jun Jie Woo. 2017. Resilience and robustness in policy design: A critical appraisal. Policy Sciences 50: 399–426. [Google Scholar] [CrossRef]
- Carstens, Agustín. 2017. Policymaking-Respecting the Life-Cycle of Policies. Available online: https://www.bis.org/review/r170816b.pdf (accessed on 10 July 2019).
- Cartwright, Peter. 2004. Banks, Consumers and Regulation. London: Bloomsbury Publishing. [Google Scholar]
- Cecchetti, Stephen G. 2018. Collaboration in Financial Regulatory Reform: The IMF, the Financial Stability Board, and the Standard Setting Bodies. IEO Background Paper No. BP/18-02/04. Washington: International Monetary Fund. [Google Scholar]
- Cerutti, Eugenio, Stijn Claessens, and Patrick McGuire. 2012. Systemic Risks in Global Banking: What Available Data Can Tell Us and What More Data Are Needed? Available online: https://www.nber.org/papers/w18531.pdf (accessed on 15 May 2019).
- Chorafas, Dimitris N. 2011. Basel III, the Devil and Global Banking. London: Palgrave Macmillan. [Google Scholar]
- Cœuré, Benoît. 2017a. Policy analysis with big data. In Speech at the Conference on "Economic and Financial Regulation in the Era of Big Data". Paris: European Central Bank. [Google Scholar]
- Cœuré, Benoît. 2017b. Setting standards for granular data. In Opening Remarks at the Third OFRECB-Bank of England workshop on "Setting Global Standards for Granular Data: Sharing the Challenge". Frankfurt: BIS. [Google Scholar]
- Cœuré, Benoît. 2019. The case for cooperation-cross-border CCP supervision and the role of central banks. In Conference on CCP Risk Management. Frankfurt: BIS. [Google Scholar]
- Coglianese, Cary. 2012. Measuring Regulatory Performance Evaluating the Impact of Regulation and Regulatory Policy. OECD Expert Paper No. 1. Paris: OECD, pp. 1–59. [Google Scholar]
- Coglianese, Cary. 2018. Optimizing Regulation for an Optimizing Economy. University of Pennsylvania Journal of Law & Public Affairs 4: 1. [Google Scholar]
- Commission. 2012. Regulatory Impact Analysis: Benchmarking Productivity Commission Research Report. Productivity Commission Research Report. Canberra: Productivity Commission. [Google Scholar]
- Constâncio, Vítor. 2016. The role of stress testing in supervision and macroprudential policy. In Stress Testing and Macroprudential Regulation. London: Centre for Economic Policy Research, pp. 51–68. [Google Scholar]
- Constâncio, Vítor, Inês Cabral, Carsten Detken, John Fell, Jérôme Henry, Paul Hiebert, Sujit Kapadia, Sergio Nicoletti Altimar, Fatima Pires, and Carmelo Salleo. 2019. Macroprudential Policy at the ECB: Institutional Framework, Strategy, Analytical Tools and Policies. ECB Occasional Paper (227). Frankfurt: European Central Bank. [Google Scholar]
- Crane, Daniel A., Markus Kitzmuller, and Graciela Miralles. 2017. Integrating Micro and Macro Policy Levers in Response to Financial Crises. Mich. Bus. and Entrepreneurial L. Rev. 7: 191. [Google Scholar]
- Daripa, Arup, and Simone Varotto. 2005. Ex ante versus ex Post Regulation of Bank Capital. Birkbeck: University of London, School of Economics, Mathematics and Statistics, pp. 1–51. [Google Scholar]
- Davies, Howard, and David Green. 2010. Banking on the Future: The Fall and Rise of Central Banking. Princeton: Princeton University Press. [Google Scholar]
- Dees, Stéphane, and Jérôme Henry. 2017. Stress-test analytics for macroprudential purposes: Introducing STAMP€. Frankfurt: European Central Bank, pp. 13–30. [Google Scholar]
- Dhameja, Nand. 2010. Global financial crisis: Impact, challenges and way-out. Indian Journal of Industrial Relations 45: 336–49. [Google Scholar]
- Dowd, Kevin. 2014. Math Gone Mad: Regulatory Risk Modeling by the Federal Reserve. Washington: Cato Institute Policy Analysis. [Google Scholar]
- Duncan, Alfred, and Charles Nolan. 2015. Objectives and Challenges of Macroprudential Policy. Glasgow: University of Glasgow Economics. [Google Scholar]
- Eijffinger, SSylvester, and Donato Masciandaro. 2012. Handbook of Central Banking, Financial Regulation and Supervision: After the Financial Crisis. Incorporated: Edward Elgar Publishing. [Google Scholar]
- Engelmann, Bernd, and Robert Rauhmeier. 2014. The Basel II Risk Parameters: Estimation, Validation, Stress Testing—With Applications to Loan Risk Management, 2th ed. Berlin and Heidelberg: Springer Science and Business Media. [Google Scholar]
- Enkhzaya, Chuluunbaatar. 2006. The Impact of Institutions on Lending. Berlin: Springer. [Google Scholar]
- Fischer, Frank, and Gerald J. Miller. 2017. Handbook of Public Policy Analysis: Theory, Politics, and Methods. London: Routledge. [Google Scholar]
- Freixas, Xavier, Luc Laeven, and José-Luis Peydró. 2015. New Challenges for Regulatory Policy. Cambridge: The MIT Press, p. 329. [Google Scholar]
- FSB, Financial Stability Board. 2017. Framework for Post-Implementation Evaluation of the Effects of the G20 Financial Regulatory Reforms. Basel: Financial Stability Board. [Google Scholar]
- Gai, Prasanna, Malcolm Kemp, Antonio Sánchez Serrano, and Isabel Schnabel. 2019. Regulatory Complexity and the Quest for Robust Regulation. SUERF Policy Note. Vienna: The European Money and Finance Forum, Available online: https://www.suerf.org/docx/f_7aee5d5dfa97b2516e5f639672c7e199_6581_suerf.pdf (accessed on 20 July 2019).
- Gong, Yiwei, and Marijn Janssen. 2017. The Impact of Social Business Process Management on Policy-making in e-Government. In Paper presented at the Proceedings of the 50th Hawaii International Conference on System Sciences, Waikoloa, HI, USA, January 4–7. [Google Scholar]
- Goodhart, Charles Albert Eric. 2011. The changing role of central banks. Financial History Review 18: 135–54. [Google Scholar] [CrossRef] [Green Version]
- Gramlich, Dieter, and Mikhail V. Oet. 2012. Systemic financial feedbacks–Conceptual framework and modeling implications. Paper presented at the 30th International Conference of the System Dynamics Society on ‘Model-based Management’, St. Gallen, Switzerland, July 22–26. [Google Scholar]
- Graue, Carolin. 2015. Qualitative data analysis. International Journal of Sales, Retailing and Marketing 4: 5–14. [Google Scholar]
- Gray, David E. 2019. Doing Research in the Business World. Thousand Oaks: Sage Publications Limited. [Google Scholar]
- Hartmann, P., H. Huang, and D. Schoenmaker. 2018. The Changing Fortunes of Central Banking. Cambridge: Cambridge University Press. [Google Scholar]
- Howlett, Michael, Giliberto Capano, and M Ramesh. 2018. Designing for Robustness: Surprise, Agility and Improvisation in Policy Design. Milton Park: Taylor and Francis. [Google Scholar]
- Howlett, Michael. 2019. Designing Public Policies: Principles and Instruments. London: Routledge. [Google Scholar]
- Ibtissem, Baklouti, and Abdelfettah Bouri. 2013. Credit risk management in microfinance: The conceptual framework. ACRN Journal of Finance and Risk Perspectives 2: 9–24. [Google Scholar]
- IFC. External Sector Statistics: Current Issues and New Challenges. IFC Bulletins. Washington: IFC.
- IFC. 2019. Are Post-Crisis Statistical Initiatives Completed? IFC Bulletins. Washington: IFC. [Google Scholar]
- IMF. 2009. The Financial Crisis and Information Gaps. Washington: International Monetary Fund. [Google Scholar]
- IMF. 2013a. Global Financial Stability Report: Transition Challenges to Stability. Washington: International Monetary Fund. [Google Scholar]
- IMF. 2013b. The Financial Crisis and Information Gaps: Fourth Progress Report on the Implementation of the G-20 Data Gaps Initiative. Washington: International Monetary Fund. [Google Scholar]
- IMF. 2017. Global Financial Stability Report, April 2017: Getting the Policy Mix Right. Washington: IMF. [Google Scholar]
- IMF. 2018. Republic of Korea Selected Issues. Washington: International Monetary Fund. [Google Scholar]
- Inoue, Hitoshi, Kiyotaka Nakashima, and Toshiaki Ogawa. 2019. The Impacts of Strengthening Regulatory Surveillance on Bank Behavior in Microprudential Policy. Available online: http://kiyotaka.sakura.ne.jp/Inoue_Nakashima_Ogawa_20190912.pdf (accessed on 11 January 2020).
- Jacobs, Scott. 2006. Current Trends in Regulatory Impact Analysis: The Challenges of Mainstreaming RIA into Policy-Making. Available online: http://regulatoryreform.com/wp-content/uploads/2015/02/Jacobs_Current__Trends_and_Processes_in_RIA_May_2006.pdf (accessed on 14 July 2019).
- Jerger, Jürgen. 2002. How strong is the case for a populist central banker? A note. European Economic Review 46: 623–32. [Google Scholar] [CrossRef]
- Jordan, Andrew J., and John R Turnpenny. 2015. The Tools of Policy Formulation: Actors, Capacities, Venues and Effects. Cheltenham: Edward Elgar Publishing. [Google Scholar]
- Kaufmann, Daniel, Aart Kraay, and Massimo Mastruzzi. 2011. The Worldwide Governance Indicators: Methodology and Analytical Issues. Hague Journal on the Rule of Law 3: 220–46. [Google Scholar] [CrossRef]
- Khan, Ashraf. 2018. A Behavioral Approach to Financial Supervision, Regulation, and Central Banking. Washington: International Monetary Fund. Washington: International Monetary Fund. [Google Scholar]
- Kim, Jungeun, Kyeong Pyo Ryu, and Doowoo Nam. 2010. An Analysis of the Ripple Effects of the Global Financial Crisis on the South Korean Economy and the Recovery. In The Financial and Economic Crises: An International Perspective. Cheltenham: Edward Elgar Publishing, pp. 105–20. [Google Scholar]
- Kim, Myeong Hyeon, and Baeho Kim. 2014. Systematic cyclicality of systemic bubbles: Evidence from the US commercial banking system. Journal of Macroeconomics 42: 281–97. [Google Scholar] [CrossRef]
- KPMG. 2014. The Changing Face of Regulatory Reporting: Challenges and Opportunities for Financial Institutions. Amstelveen: KPMG. [Google Scholar]
- Krueger, Richard A, and Mary Anne Casey. 2014. Focus Groups: A Practical Guide for Applied Research. Thousand Oaks: Sage Publications. [Google Scholar]
- Large, Andrew. 2015. Financial Stability Governance Today: A Job Half Done: Ongoing Question for Policymakers. Washington: Group of Thirty. [Google Scholar]
- Lee, Michelle L. 1998. Change Impact Analysis of Object-Oriented Software. Fairfax: George Mason University Virginia. [Google Scholar]
- Leone, Alfredo. 2010. Data and the crisis: Gaps, initiatives and challenges. Central Banking, Quarterly Journal 21: 74–80. [Google Scholar]
- Lim, Ivan, Jens Hagendorff, and Seth Armitage. 2016. Regulatory Monitoring, Information Asymmetry and Accounting Quality: Evidence from the Banking Industry. Available online: https://efmaefm.org/0EFMAMEETINGS/EFMA%20ANNUAL%20MEETINGS/2016-Switzerland/papers/EFMA2016_0504_fullpaper.pdf (accessed on 20 July 2019).
- Loi, Massimo, and Margarida Rodrigues. 2012. A Note on the Impact Evaluation of Public Policies: The Counterfactual Analysis. Luxembourg: Publications Office of the European Union. [Google Scholar]
- Longo, Justin, and Kathleen McNutt. 2018. From policy analysis to policy analytics. In Policy Analysis in Canada. Bristol: Policy Press, pp. 369–89. [Google Scholar]
- Luftman, Jerry N., Paul R. Lewis, and Scott H. Oldach. 1993. Transforming the enterprise: The alignment of business and information technology strategies. IBM Systems Journal 32: 198–221. [Google Scholar] [CrossRef]
- Müller, Stephan, and Deutsche Bundesbank. 2019. Creating Comprehensive Data Worlds Using Standardisation. IFC Bulletins Chapters. Washington: IFC, p. 49. [Google Scholar]
- Mahadeva, Lavan, and Gabriel Sterne. 2012. Monetary Policy Frameworks in a Global Context. Abingdon: Routledge. [Google Scholar]
- Mayer, Isabella. 2015. Qualitative research with a focus on qualitative data analysis. International Journal of Sales, Retailing and Marketing 4: 53–67. [Google Scholar]
- Miteski, Mite, Ana Mitreska, and Mihajlo Vaskov. 2018. The Risk-Taking Channel of Monetary Policy in Macedonia: Evidence from Credit Registry Data. Skopje: National Bank of the Republic of Macedonia. [Google Scholar]
- Moradi, Amir, and Elisabeth Paulet. 2014. A causal loop analysis of the austerity policy adopted to address the Euro crisis-effects and side effects. International Journal of Applied Decision Sciences 8: 1–20. [Google Scholar] [CrossRef]
- Morecroft, John D.W. 2015. Strategic Modeling and Business Dynamics: A Feedback Systems Approach. Hoboken: John Wiley and Sons. [Google Scholar]
- Moti, Haron O., Justo Simiyu Masinde, Nebat Galo Mugenda, and Mary Nelima Sindani. 2012. Effectiveness of credit management system on loan performance: Empirical evidence from micro finance sector in Kenya. International Journal of Business, Humanities and Technology 2: 99–108. [Google Scholar]
- Murphy, Edward V. 2013. Who Regulates Whom and How? An Overview of US Financial Regulatory Policy for Banking and Securities Markets. Ithaca: ILR School. [Google Scholar]
- Neuberger, Doris, and Roger Rissi. 2012. Macroprudential Banking Regulation: Does One Size Fit All? Thünen-Series of Applied Economic Theory Working Paper. Rostock: University of Rostock. [Google Scholar]
- OECD. 2007. Indicators of Regulatory Management Systems. OECD Working Papers on Public Governance, 2007/4. Paris: OECD Publishing. [Google Scholar] [CrossRef]
- OECD. 2010. Regulatory Policy and the Road to Sustainable Growth. Paris: Organization for Economic Co-Operation and Development. [Google Scholar]
- OECD. 2011. The Achievements of Regulatory Policy. Paris: OECD Publishing. [Google Scholar]
- OECD. 2012. Measuring Regulatory Performance. Paris: OECD Publishing. [Google Scholar]
- OECD. 2014a. The Governance of Regulators: Best Practice Principles for Regulatory Policy. Paris: OECD Publishing. [Google Scholar]
- OECD. 2014b. Regulatory Policy in Mexico: Towards a Whole-of-Government Perspective to Regulatory Improvement. Paris: OECD Publishing. [Google Scholar]
- OECD. 2015a. Regulatory Policy in Perspective. Paris: OECD Publishing. [Google Scholar]
- OECD. 2015b. OECD Regulatory Policy Outlook 2015. Paris: OECD Publishing. [Google Scholar]
- Oet, Mikhail V., and Oleg V. Pavlov. 2014. Feedback Mechanisms in the Financial System: A Modern View. Delft: Delft University of Technology. [Google Scholar]
- Orphanides, Athanasios, and John Williams. 2004. Imperfect knowledge, inflation expectations, and monetary policy. In The Inflation-Targeting Debate. Chicago: University of Chicago Press, pp. 201–46. [Google Scholar]
- Parker, David, and Colin Kirkpatrick. 2012. Measuring Regulatory Performance the Economic Impact of Regulatory Policy: A Literature Review of Quantitative Evidence. Paris: OECD Publishing. [Google Scholar]
- Renda, Andrea. 2006. Impact Assessment in the EU. Brussels: Centre for European Policy Studies. [Google Scholar]
- Renda, Andrea. 2015. Regulatory Impact Assessment and regulatory policy. Regulatory Policy in Perspective: A Reader’s Companion to the OECD Regulatory Policy Outlook 2015: 35–114. [Google Scholar]
- Richardson, George P. 1986. Problems with causal-loop diagrams. System Dynamics Review 2: 158–70. [Google Scholar] [CrossRef]
- Rosenberg, Zuzana, Marlen Jurisch, Michael Schermann, and Helmut Krcmar. 2014. Using Case Survey Methodology to Extract Variables and Causal Links: An Example from Studying Business Process Change. Paper presented at the 32nd International Conference of the System Dynamics Society, Wiley, Delft, The Netherlands, July 20–24. [Google Scholar]
- Saeed, Khalid. 2004. Designing an environmental mitigation banking institution for linking the size of economic activity to environmental capacity. Journal of Economic Issues 38: 909–37. [Google Scholar] [CrossRef]
- Sarlin, Peter. 2016. Macroprudential oversight, risk communication and visualization. Journal of Financial Stability 27: 160–79. [Google Scholar] [CrossRef] [Green Version]
- Sayyadi, Reza, and Anjali Awasthi. 2017. A system dynamics based simulation model to evaluate regulatory policies for sustainable transportation planning. International Journal of Modeling and Simulation 37: 25–35. [Google Scholar] [CrossRef]
- Schmitt-Grohé, Stephanie, and Martin Uribe. 2012. Prudential Policy for Peggers. Cambridge: National Bureau of Economic Research, p. 34. [Google Scholar]
- Smismans, Stijn. 2015. Policy evaluation in the EU: The challenges of linking ex ante and ex post appraisal. European Journal of Risk Regulation 6: 6–26. [Google Scholar] [CrossRef] [Green Version]
- Sobel, Russell S, and John A Dove. 2012. State Regulatory Review: A 50 State Analysis of Effectiveness. Arlington: Mercatus Center at George Mason University. [Google Scholar]
- Sterman, John. 2000. Business Dynamics: Systems Thinking and Modeling for a Complex World. New York: McGraw-Hill Education. [Google Scholar]
- Stiroh, Kevin. 2019. Policy Efficiency in Supervision. Available online: https://www.bis.org/review/r190326d.htm (accessed on 11 January 2020).
- Tosun, Jale, and Oliver Treib. 2018. Linking Policy Design and Implementation Styles. London: Routledge. [Google Scholar]
- Truong, Evelyn, and Bruno Tissot. 2019. Are the Post-Crisis Statistical Initiatives Complete? An Overview. IFC Bulletins Chapters. Washington: IFC, p. 49. [Google Scholar]
- Van Gool, Joris, Wouter Verbeke, Piet Sercu, and Bart Baesens. 2012. Credit scoring for microfinance: Is it worth it? International Journal of Finance and Economics 17: 103–23. [Google Scholar] [CrossRef]
- Vinals, Jose. 2010. Central Banking Lessons from the Crisis. Washington: International Monetary Fund. [Google Scholar]
- Vukoslavcevic, Drasko. 2012. The Crisis Of The Euro And New European Governance: Fiscal Union As Solution? Montenegrin Journal of Economics 8: 153. [Google Scholar]
- Wagner, Helmut. 2010. The causes of the recent financial crisis and the role of central banks in avoiding the next one. International Economics and Economic Policy 7: 63–82. [Google Scholar] [CrossRef]
- Waller, Christopher J. 2000. Policy boards and policy smoothing. Quarterly Journal of Economics 115: 305–39. [Google Scholar] [CrossRef]
- Walters, Daniel E. 2019. The Self-Delegation False Alarm: Analyzing Auer Deference’s Effects on Agency Rules. Columbia Law Review 119: 85–168. [Google Scholar]
- Witt, Emily, and Jannick Blaschke. 2019. ECB Data for Analysis and Decision-Making: Data Governance and Technology. IFC Bulletins Chapters 49. Washington: IFC. [Google Scholar]
- World Bank. 2014. Global Financial Development Report 2014: Financial Inclusion. Washington: World Bank Publications. [Google Scholar]
- Yau, Stephen S., James S. Collofello, and T. MacGregor. 1978. Ripple effect analysis of software maintenance. Paper presented at the IEEE Computer Society’s Second International Computer Software and Applications Conference COMPSAC’78, Chicago, IL, USA, November 13–16. [Google Scholar]
- Zedda, Stefano. 2017. Banking Systems Simulation: Theory, Practice, and Application of Modeling Shocks, Losses, and Contagion. Hoboken: Wiley. [Google Scholar]

| Theoretical stance | Study focus | Study the absence of computing frameworks between the CBs (regulators) and the banks that can undertake regulatory policy assessment checks and measure impacts, macro-level parameters and micro-level parameters, including the identification of their interactions. | |||||
| Literature review | Identified the quality attribute constraints (QACs) including other factors and impediments that hinder regulators from having optimal regulation. | ||||||
| Main objectives | Research and design a computational framework that can systematically model complex policy objectives and forecasts alternatives, including the identification of organisational and cross-organisational interactions, impacts and ripple effects measurement. | ||||||
| Research question | How does the development of ‘computational regulatory policy change governance framework’ improve the return on policy and resolving information asymmetry and bounded rationality in central banks’ regulations? | ||||||
| Study period 2015–2016 | Phase | Design | Sample | Method | Objective | ||
| Mixed methods approach | Data | 1 | Exploratory | Qualitative | SAMA and banks | Informal discussion | Defining the problems domain. |
| Findings |
| ||||||
| 2 | Preliminary | Mixed | 10 participants | Likert Scale 1–5 | Collect data to narrow the scope. | ||
| Findings |
| ||||||
| 3 | Interviews (1) | Qualitative | 10 participants | Semi-structured | Justify the collected answers and elicit more information. | ||
| Findings |
| ||||||
| 4 | Empirical | Quantitative | One bank | Direct | Test and simulate the developed framework with real data. | ||
| Findings |
| ||||||
| Analysis | 5 | Interviews (2) | Mixed | 10 participants | Likert Scale 1–5 | (A) Rate the current regulatory system, and (B) Rate the proposed framework. | |
| Findings |
| ||||||
| 6 | Focus-group | Qualitative | 10 participants | Evaluation | Findings evaluation | ||
| Findings | The discussion evaluated the findings and concluded that the proposed framework would be added value to bridging the gaps and shortages in the current system. | ||||||
| Policy Alternative | QAC: Financial | |||||||
|---|---|---|---|---|---|---|---|---|
| Impacted Parameters | ||||||||
| Loans | Wholesale Funding | Credit Growth | Risk Weighted Assets | Solvency | Profit | |||
| LDR | +1% | Change * | +0.47 | +0.72 | +0.07 | +0.5 | NA | +0.12 |
| Value ** | 15.6BN | 1.23BN | NA | NA | NA | NA | ||
| Impact | Affects CAR by decrease of 0.06% | |||||||
| +3% | Change | +1.13 | +2 | +0.12 | +1.45 | NA | +0.21 | |
| Value | 16.4BN | 2.75BN | NA | NA | NA | NA | ||
| Impact | Affects CAR by decrease of 0.12% | |||||||
| +5% | Change | +2.42 | +3.6 | +0.23 | +2.85 | NA | +37 | |
| Value | 18.2BN | 4.32BN | NA | NA | NA | NA | ||
| Impact | Affects CAR by decrease of 0.32% | |||||||
| CAR | +2% | Change | 0.55 | +0.66 | +0.78 | NA | 0.65 | |
| Provisioning Requirement | +90 days | CAR | Wholesale Funding | Credit Growth | Solvency | |||
| Impact | +5 | +0.78 | +0.56 | +6 | ||||
| QAC: Business process | ||||||||
| Impacted parameters | ||||||||
| Policy | Alternative | Compliance management | Operation management | Business Rule Engine | Risk management | |||
| LDR | 1% | +8 | +8 | NA | +4 | |||
| 3% | +8 | +8 | NA | +5 | ||||
| 5% | +8 | +8 | NA | +6 | ||||
| CAR | 2% | +8 | +8 | NA | +5 | |||
| Provisioning Requirement | +90 days | +7 | +8 | NA | +4 | |||
| QAC: Customers “SMEs” | ||||||||
| Impacted parameters | ||||||||
| Policy | Alternative | Segmentation | Perceived Value | Channels | Satisfaction | |||
| LDR | 3% | +5 | −2 | −3 | +4 | |||
| CAR | 5% | NA | +6 | −3 | NA | |||
| Provisioning Requirement | +90 days | +7 | +4 | NA | +8 | |||
| QAC# | Quality Attribute Constraints | Participants Rating Based on the Current System Using Likert Scale Scoring (1 = low, 5 = High) | Average Rating | |||||||||
|---|---|---|---|---|---|---|---|---|---|---|---|---|
| P1 | P2 | P3 | P4 | P5 | P6 | P7 | P8 | P9 | P10 | |||
| QAC1 | Strategy | 4 | 4 | 3 | 4 | 4 | 3 | 4 | 4 | 3 | 5 | 3.8 |
| QAC2 | Risk | 3 | 3 | 4 | 3 | 3 | 4 | 4 | 4 | 3 | 4 | 3.5 |
| QAC3 | Financial | 4 | 3 | 4 | 3 | 3 | 5 | 4 | 4 | 5 | 4 | 3.8 |
| QAC4 | Business Processes | 2 | 3 | 3 | 2 | 3 | 3 | 2 | 2 | 3 | 2 | 2.5 |
| QAC5 | Governance | 3 | 3 | 2 | 2 | 3 | 2 | 2 | 2 | 3 | 3 | 2.5 |
| QAC6 | Technology | 2 | 2 | 1 | 2 | 3 | 2 | 2 | 2 | 2 | 2 | 2.0 |
| QAC7 | Organisational Behaviour | 3 | 3 | 4 | 2 | 3 | 3 | 4 | 2 | 3 | 3 | 3.0 |
| QAC8 | Organisational Knowledge | 2 | 2 | 2 | 2 | 1 | 2 | 2 | 2 | 2 | 3 | 2.0 |
| QAC9 | Ergonomics | 3 | 3 | 2 | 3 | 3 | 4 | 2 | 2 | 3 | 3 | 2.8 |
| QAC10 | Customers | 3 | 3 | 2 | 4 | 2 | 3 | 3 | 4 | 3 | 3 | 3.0 |
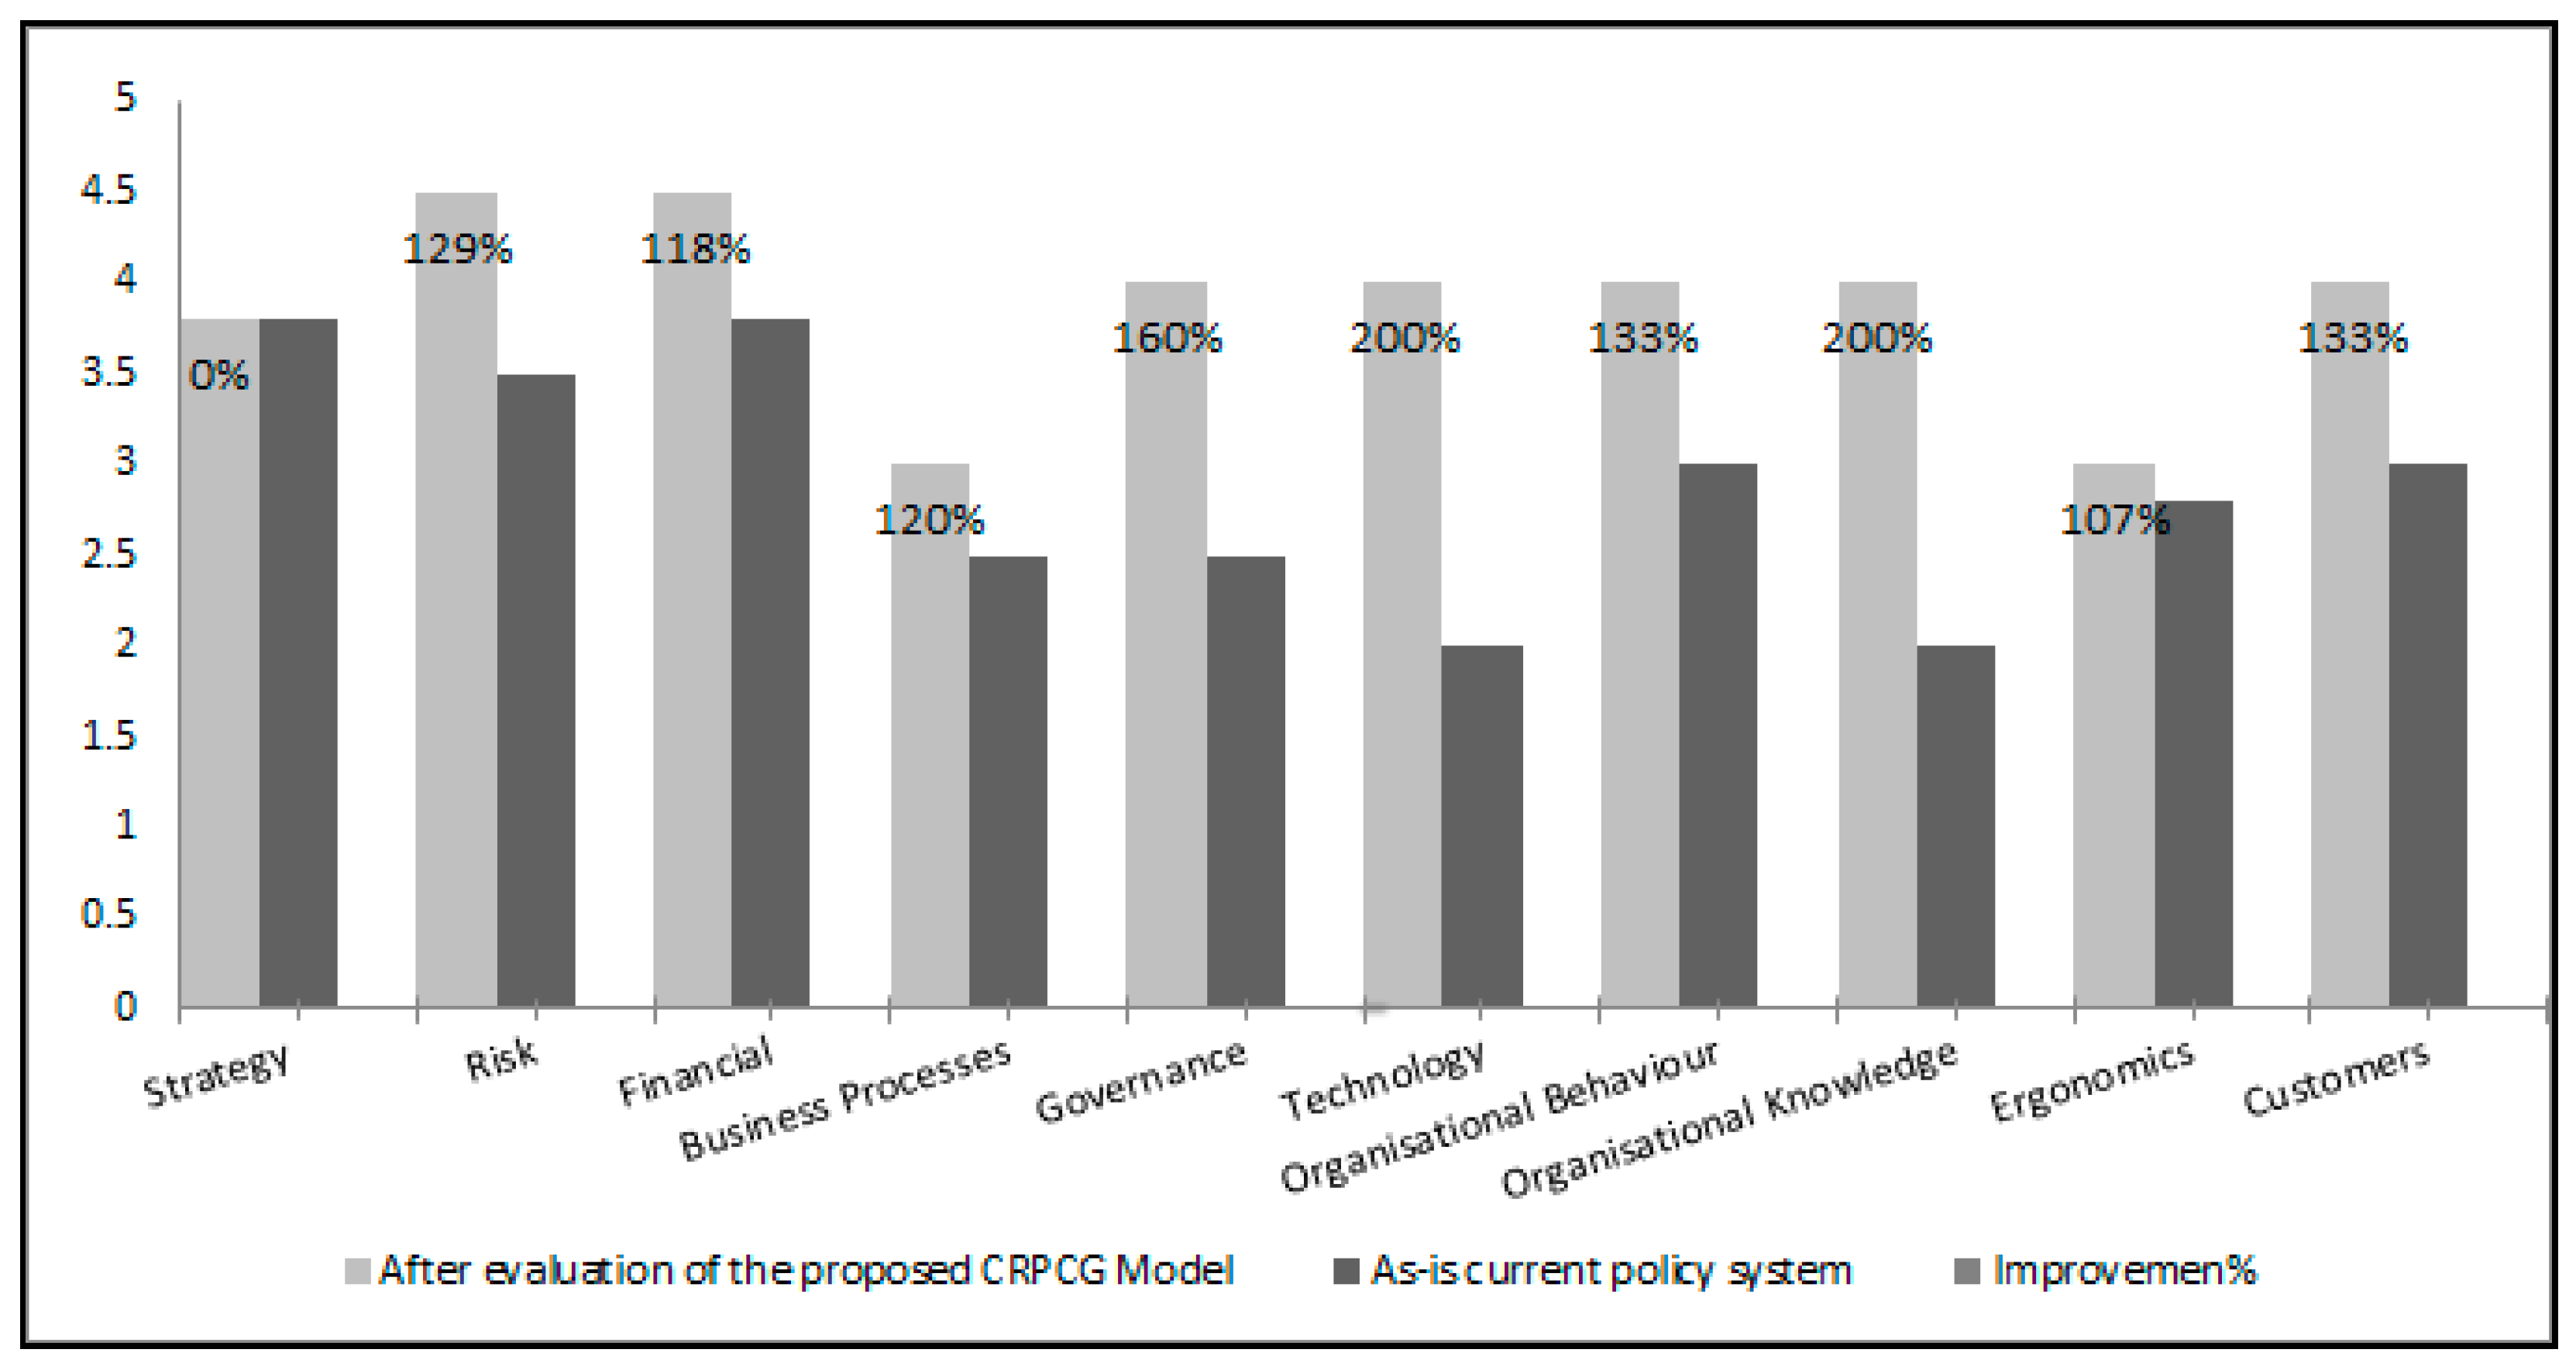
| QAC# | Quality Attribute Constraints | Current System (Average) | Evaluation of the Proposed Solution (Average) | Improvement % |
|---|---|---|---|---|
| QAC1 | Strategy | 3.8 | 3.8 | 0 |
| QAC2 | Risk | 3.5 | 4.5 | 129% |
| QAC3 | Financial | 3.8 | 4.5 | 118% |
| QAC4 | Business Processes | 2.5 | 3.0 | 120% |
| QAC5 | Governance | 2.5 | 4.0 | 160% |
| QAC6 | Technology | 2.0 | 4.0 | 200% |
| QAC7 | Organisational Behaviour | 3.0 | 4.0 | 133% |
| QAC8 | Organisational Knowledge | 2.0 | 4.0 | 200% |
| QAC9 | Ergonomics | 2.8 | 3.0 | 107% |
| QAC10 | Customers | 3.0 | 4.0 | 133% |
| Improvement Average 130% | ||||
© 2020 by the authors. Licensee MDPI, Basel, Switzerland. This article is an open access article distributed under the terms and conditions of the Creative Commons Attribution (CC BY) license (http://creativecommons.org/licenses/by/4.0/).
Share and Cite
Alrabiah, A.; Drew, S. Proactive Management of Regulatory Policy Ripple Effects via a Computational Hierarchical Change Management Structure. Risks 2020, 8, 49. https://doi.org/10.3390/risks8020049
Alrabiah A, Drew S. Proactive Management of Regulatory Policy Ripple Effects via a Computational Hierarchical Change Management Structure. Risks. 2020; 8(2):49. https://doi.org/10.3390/risks8020049
Chicago/Turabian StyleAlrabiah, Abdulrahman, and Steve Drew. 2020. "Proactive Management of Regulatory Policy Ripple Effects via a Computational Hierarchical Change Management Structure" Risks 8, no. 2: 49. https://doi.org/10.3390/risks8020049
APA StyleAlrabiah, A., & Drew, S. (2020). Proactive Management of Regulatory Policy Ripple Effects via a Computational Hierarchical Change Management Structure. Risks, 8(2), 49. https://doi.org/10.3390/risks8020049