2. Risk Approach in Compliance Management
In the last three decades, the extent of regulatory changes has led to their observance becoming an independent task. “Compliance is a rather complex concept, since it includes, among others, financial, economic, tax, business, legal, ethical, sustainability, and proprietary compliance as well” (
Boros 2019, p. 547).
COSO’s integrated internal control framework sets out international practices for internal control. In the model, internal control is a process designed to provide reasonable assurance of achieving organizational objectives such as efficient and effective operation, reliability of financial reporting, and compliance with applicable laws and regulations (
COSO 2013). Thus, the framework is also a fundamental document for the development of compliance functions. The risk-based and control-focused approach has gained ground since the 1990s. In the 20th century, “there was an increased demand for advanced risk management, corporate governance, management techniques, and information flow, so the design and development of internal control systems also gained ground” (
Kovács and Szóka 2016, p. 69).
The scope of compliance management varies from sector to sector (e.g., public administration, pharmaceutical industry). As with the internal control system, compliance management dynamically adapts to the expectations set by the company’s operating environment. The quality management system, compliance management, and risk management are functions supporting the internal control system. Their relationship is unique for each organization and is continuously changing. Even within a sector, each actor independently interprets the set of requirements that define its activities.
Banks are “dangerous” plants, as they face a wide range of risks in their operations, and the degree of risk is much higher than that of other business actors. “Corporate governance compliance level represents a company’s actions to fulfill regulatory obligations that aim to protect the public from potential investment losses in the banking industry” (
Zulfikar et al. 2020). Regulations and guidelines applicable to the sector (e.g., Solvency II) aim to reduce business risks. The control functions, described as the first–second–third line of defense since 2013 (
Institute of Internal Auditors 2013), protect the organization, while actively and proactively supporting the business/operational areas. The “three-line model”, significantly updated in July 2020 by the
Institute of Internal Auditors (
2020), focuses on the support function and risk management. In addition, developed and proven compliance solutions in the financial sector can also serve as a model for other sectors.
The goal of a compliance culture is essentially enacting a lasting change in workplace attitudes and behaviors (
Asthon 2015). Integrated compliance-integrity programs emphasize developing an ethical organizational culture. Organizational values may include customer focus, honesty, and fairness. Among the principles of corporate governance formulated by the Organization for Economic Co-operation and Development (
OECD 2015), transparency and fair treatment can be considered values. In practice, following organizational values appears as an independent goal, value-driven behavior, or work style (
Pulay 2021).
In compliance, there is a distinction between so-called hard and soft compliance. In the case of “hard compliance”, the compliance requirements are written down in law or as regulations, and the expectations are specific and measurable. As for “soft compliance”, compliance can be interpreted continuously, typically meaning the extent to which guidelines and recommendations are being followed.
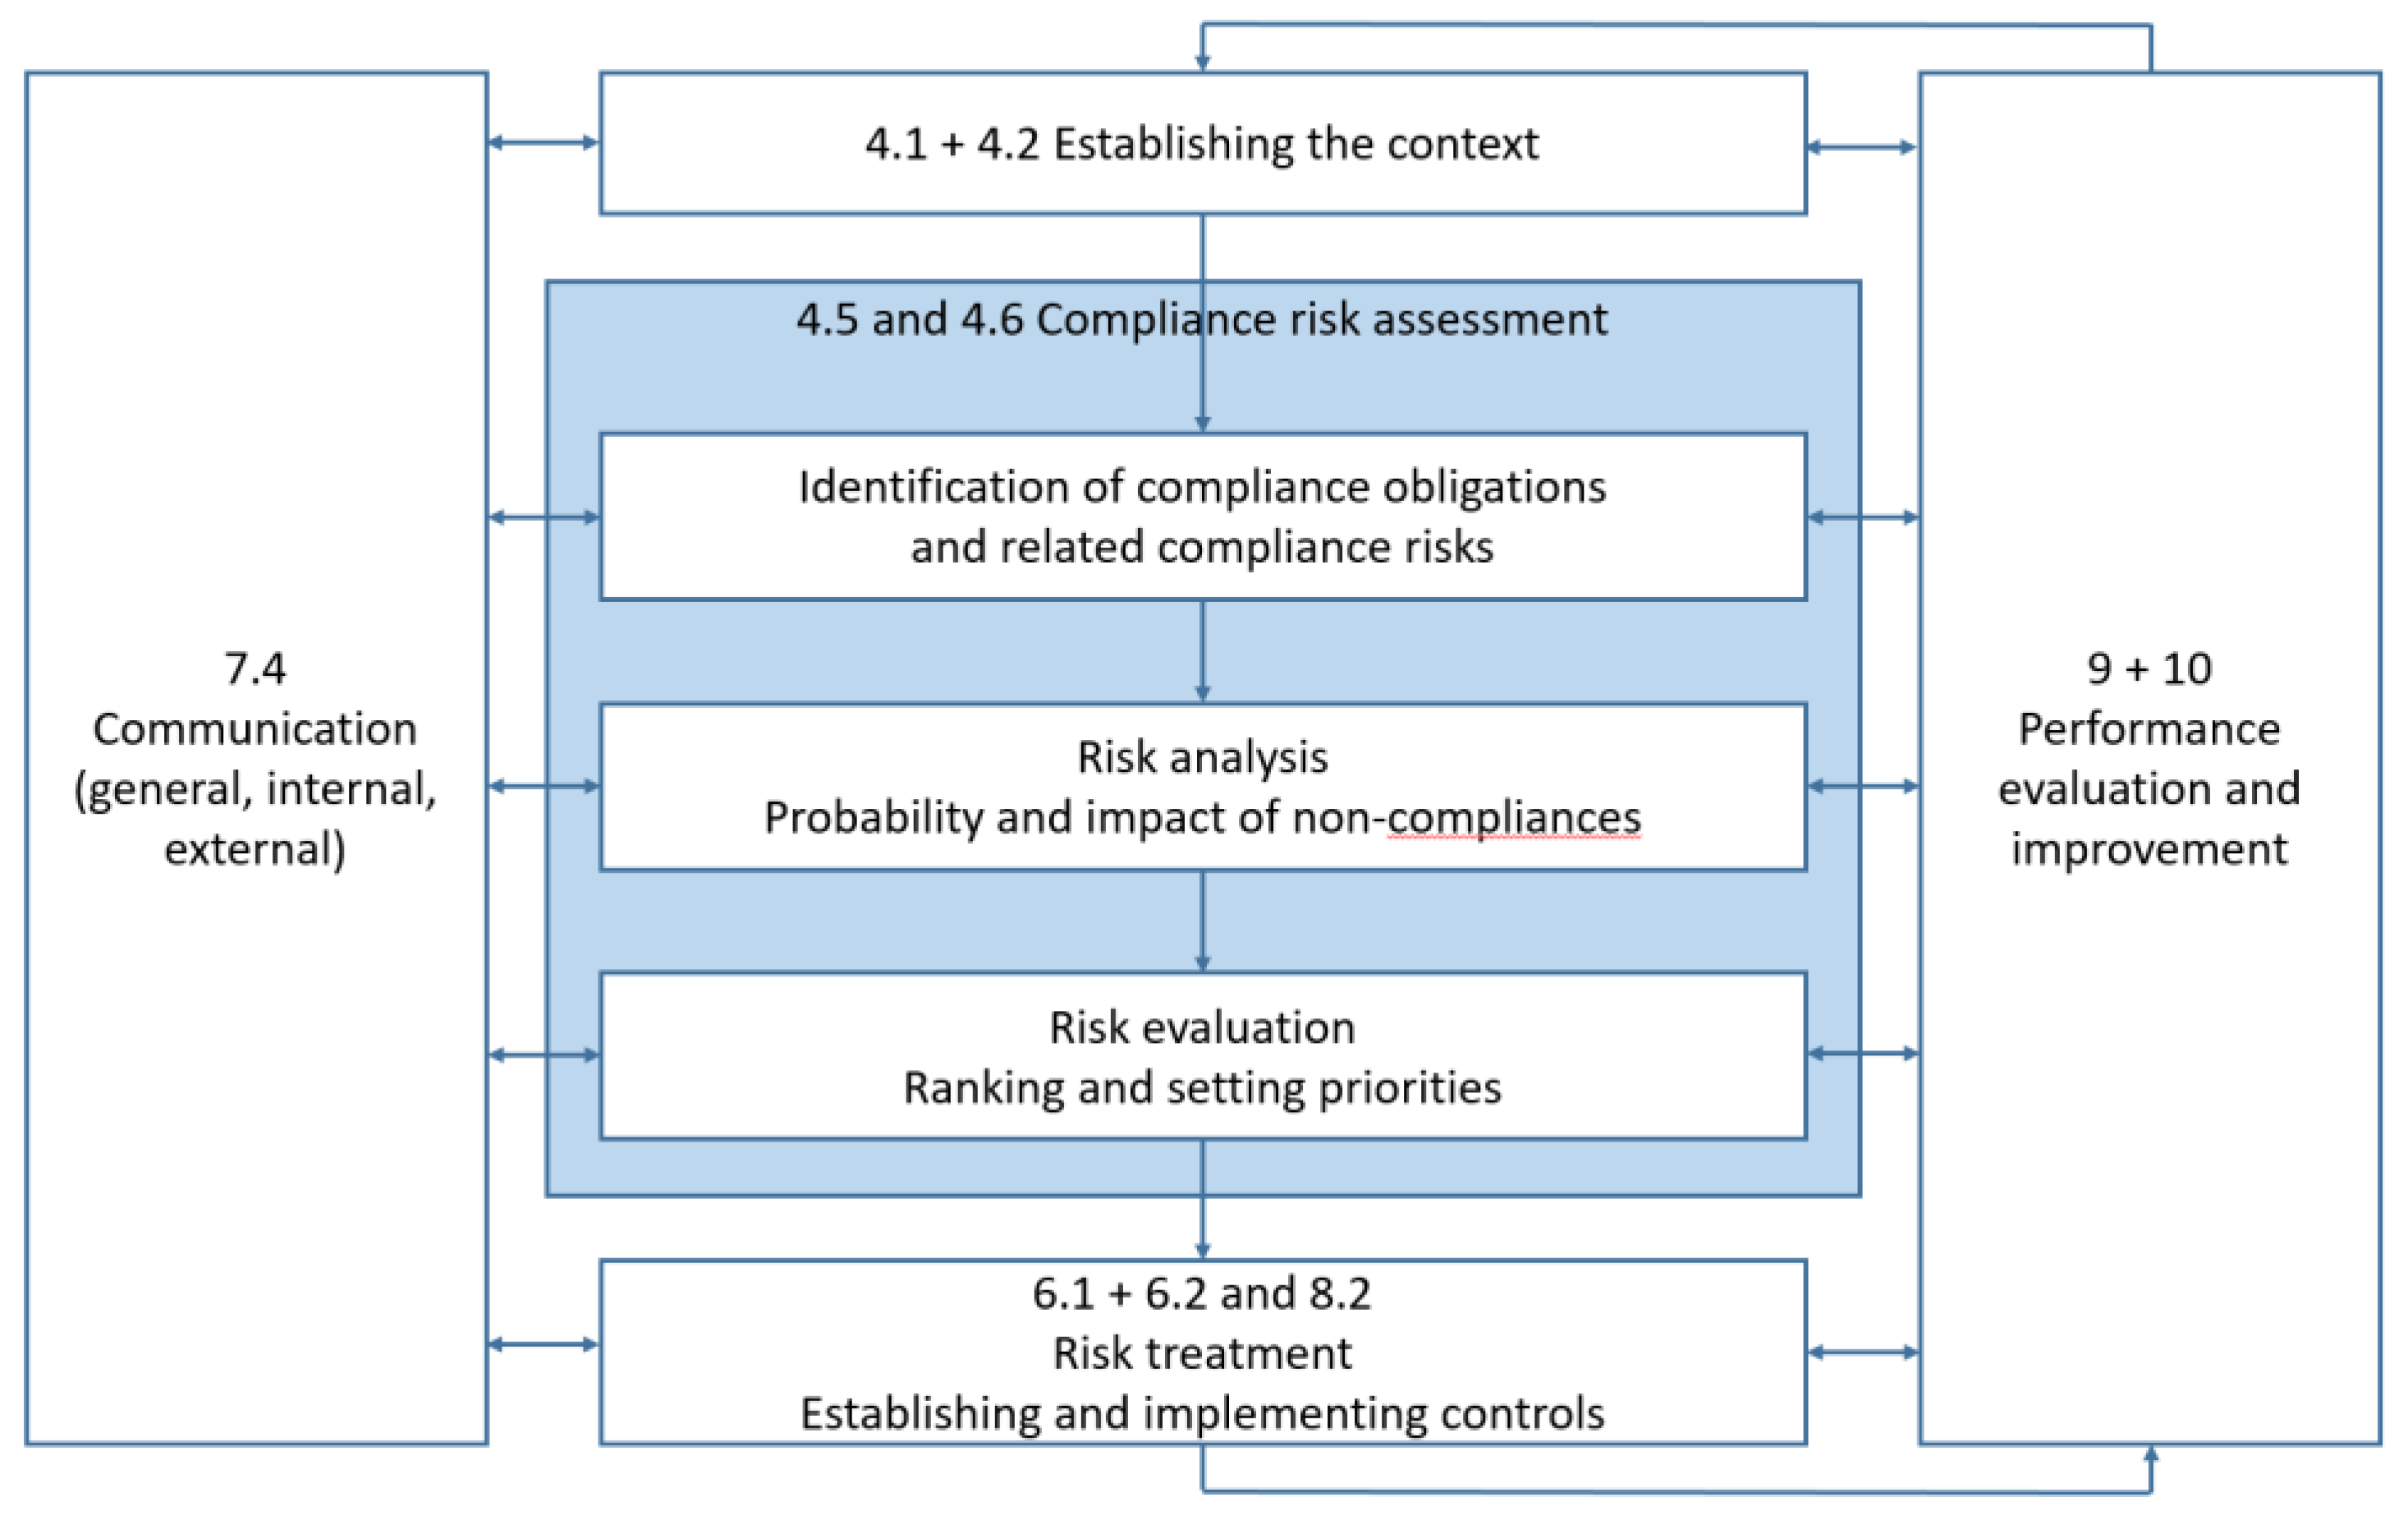
The ISO 19600:2014 guidelines facilitate the design, implementation, evaluation and maintenance of a compliance system.
Figure 1 shows the risk management logic of the guidelines. The starting point is understanding the organization’s context (in the middle top), as is usual for ISO standards. Then, risks are assessed in three steps. The first step is to identify the relevant risks and risk areas. Risk identification is followed by an analysis of the expected impacts and probabilities of occurrence. This is followed by a ranking of risks and prioritization in the risk assessment step. Finally, the process is closed with managing risks, designing and operating appropriate controls. Ranked risks can serve as input for strategy making. Performance can be measured at every point in the process described, and communication tasks are associated with each step.
Every organization operates in a dynamic environment. Some risks may be caused by external events (e.g., the COVID-19 pandemic), and others by internal events (e.g., IT disruptions). Therefore, understanding and actively shaping the environment is a key input factor in operation. Besides knowing the relevant expectations and rules, this includes knowing the audit logic and practice of the relevant auditing authorities.
An in-depth understanding of ongoing environmental changes enhances a more accurate assessment of risks. According to the risk approach, the negative consequences (e.g., sanctions, claims for damages) and the neutral or positive effects (e.g., reputation, strengthening of corporate values) must be considered before making a decision. In general, managers tend to misjudge uncertainty, i.e., the probability of events occurring (
Delen 2019). According to the model of bounded rationality theory (
Jones 2002), decision-makers accept the first satisfactory solution. Data analysis helps to estimate risks. The role of informatics is significant in detecting compliance incidents, as supplementing traditional expertise with data analysis tools can reveal suspicious patterns and trends indicating abuse (
Ambrus and Farkas 2019). The risk assessment should be carried out in a repetitive, almost continuous manner of refinement.
An integrated risk management system is a process-based risk management system that includes the complete identification, assessment and risk management preparation of the organization’s risks and monitoring action plans. For example, governance, risk and compliance management (GRC) is an integrated approach to corporate risk management. GRC, as a comprehensive system, ensures the sustainability of business operations by incorporating risk approach and compliance management into the corporate culture.
In summary, compliance management is closely related to risk management in the most general sense. The international recommendation ISO 19600:2014 recognizes a risk-based approach to compliance, a complex individual or organizational risk appetite. Diverse experiences and incentives can cause significant differences in the way in which individual experts assess risks, from assessing the context to incidents that arise.
3. Materials and Methods
Section 3.1 focuses on introducing FMEA methodology, and the applied statistical methods (Spearman correlation analysis and Kendall rank concordance analysis) are presented. Then, in
Section 3.2, the process of the data collection and the characteristics of the data are presented.
3.1. Methods
The traditional FMEA method was created in the 1960s, essentially as a tactical risk analysis methodology. However, the method has undergone significant development in the last sixty years, both in its application and methodological developments (
Liu et al. 2013). The purpose of the FMEA is to assess the risks, usually for a product or process, and then reduce them through action plans (
Huang et al. 2020). The traditional FMEA is a group method that builds on group assessment that develops during group members’ collective discussions. First, the team members involved in the risk assessment process determine what errors and failures may occur in the subject matter of the study, what the causes and consequences of these may be, and then assess the risks through several factors (
Lo and Liou 2018).
The FMEA method evaluates the following three factors: the severity of the consequences, the frequency of occurrence, and the probability of detectability (
Zhang et al. 2019). The method uses auxiliary tables for all three factors, which can characterize risks on a scale from one to ten in general, but not necessarily. The higher the risk, the higher the numerical value of that factor (
Braglia 2000). Based on the value of the three factors, the resulting risk can be calculated. This is called the risk priority number (RPN), and its value is obtained according to the following formula:
In the formula, “S” indicates severity, “O” indicates occurrence, and “D” indicates the risk value for the detection factor. It follows from the product of the three values that the value of the RPN can take on its theoretical extremes between 1 and 1000.
Sorting the examined cases in descending order by RPN number, the riskiest ones can be identified, for which it is expedient to prioritize risk mitigation actions. Once the actions have been completed, the risk assessment is repeated. Then, based on the new list in descending order by RPN, the process can be restarted.
In the last few decades, scholars exerted significant effort in the quantitative development of the FMEA methodology, while the qualitative development has remained in the background. The most dominant part of these developments is related to the multicriteria decision making (MCDM) methods, such as the grey relational analysis (GRA)-based method (
Chang et al. 2001), TOPSIS-based methods (
Braglia et al. 2003;
Lo et al. 2021), and many pairwise comparison methods using AHP or its variants (
Chang 2015). In addition, the DEMATEL-based method (
Seyed-Hosseini et al. 2006) has many citations in the quantitative methodological development of FMEA, as well as the VIKOR-based (
Liu et al. 2012) and several DEA-based (
Chin et al. 2009) methodologies. According to literature reviews, methodological developments have been increasing, especially in the last ten years (
Liu et al. 2019;
Huang et al. 2020).
One of the goals of FMEA is to provide a risk assessment on the interval scale measurement level. However, the scaling of the factors typically does not meet the preconditions of this level of measurement. Consequently, the RPN number can be best used to form ordinal scales. In this study, these variables are considered to compare individual peer reviews. Individual expert assessments are transformed to an ordinal measurement level so that individual expert opinions and group expert opinions can be professionally compared and examined. By examining the ranking statistically, it can be made visible how similar each expert opinion is. Spearman rank correlation calculation is used for these analyses.
Spearman’s rank correlation coefficient is a statistical method, which can be applied to describe the strength and direction of a relationship between two variables. The value of Spearman’s rank correlation coefficient is always between 1.0 and minus 1.0. If two rankings are the same, the coefficient will be equal to plus 1.0. If the two rankings are opposites, the coefficient will be minus 1.0. In the case of 0, the two rankings are independent of each other. In our empirical research, Spearman’s rank correlation coefficient was applied to analyze the pairwise similarity of the ranks of two compliance experts. In social sciences, 5% is set for the significance level of the coefficient. Therefore, in this research, a 5% significance level was applied.
Kendall’s rank concordance coefficient is a non-parametric test. However, this statistic is often applied as a prerequisite for aggregating individual assessments into group assessment results in the social sciences. Based on the value of the coefficient, the difference between ranks (two or more ranks) can be described. The statistic is often used to compare different rankings of judges or evaluators. The value of the coefficient is between 0 and 1.0. If the rankings are the same, the coefficient will be equal to 1.0. If the rankings are complete opposites, the coefficient will be 0. As in Spearman’s rank correlation, a 5% significance level is applied in the analysis. The coefficient is generally applied in assessing the level of agreement between a couple of evaluators. If the coefficient has a low value, the ranks are regarded as essentially random, so the aggregation of the ranks should not be executed.
Both coefficients (Spearman’s rank correlation and Kendall’s rank concordance) are often used in qualitative assessments based on focus groups, since these coefficients can compare a small number of records (even just two) to each other.
3.2. Materials
The primer data collection of the study was performed at one of the largest Central and Eastern European commercial banks in January 2021. According to the literature, the optimum size of a focus group is between three and fourteen participants, excluding researchers (
Bloor et al. 2001;
Gill et al. 2008). Thus, six people participated in the focus group—three compliance experts from the headquarters of the commercial bank, one external compliance expert and two moderators. The selected bank experts had to fulfil the following criteria: having more than ten years of experience in compliance management in the banking sector, with over five years of experience at the current bank. On the other hand, the external expert had grounded regulatory knowledge and general compliance experience but little knowledge of the bank’s specific internal processes, compliance management system, and philosophy.
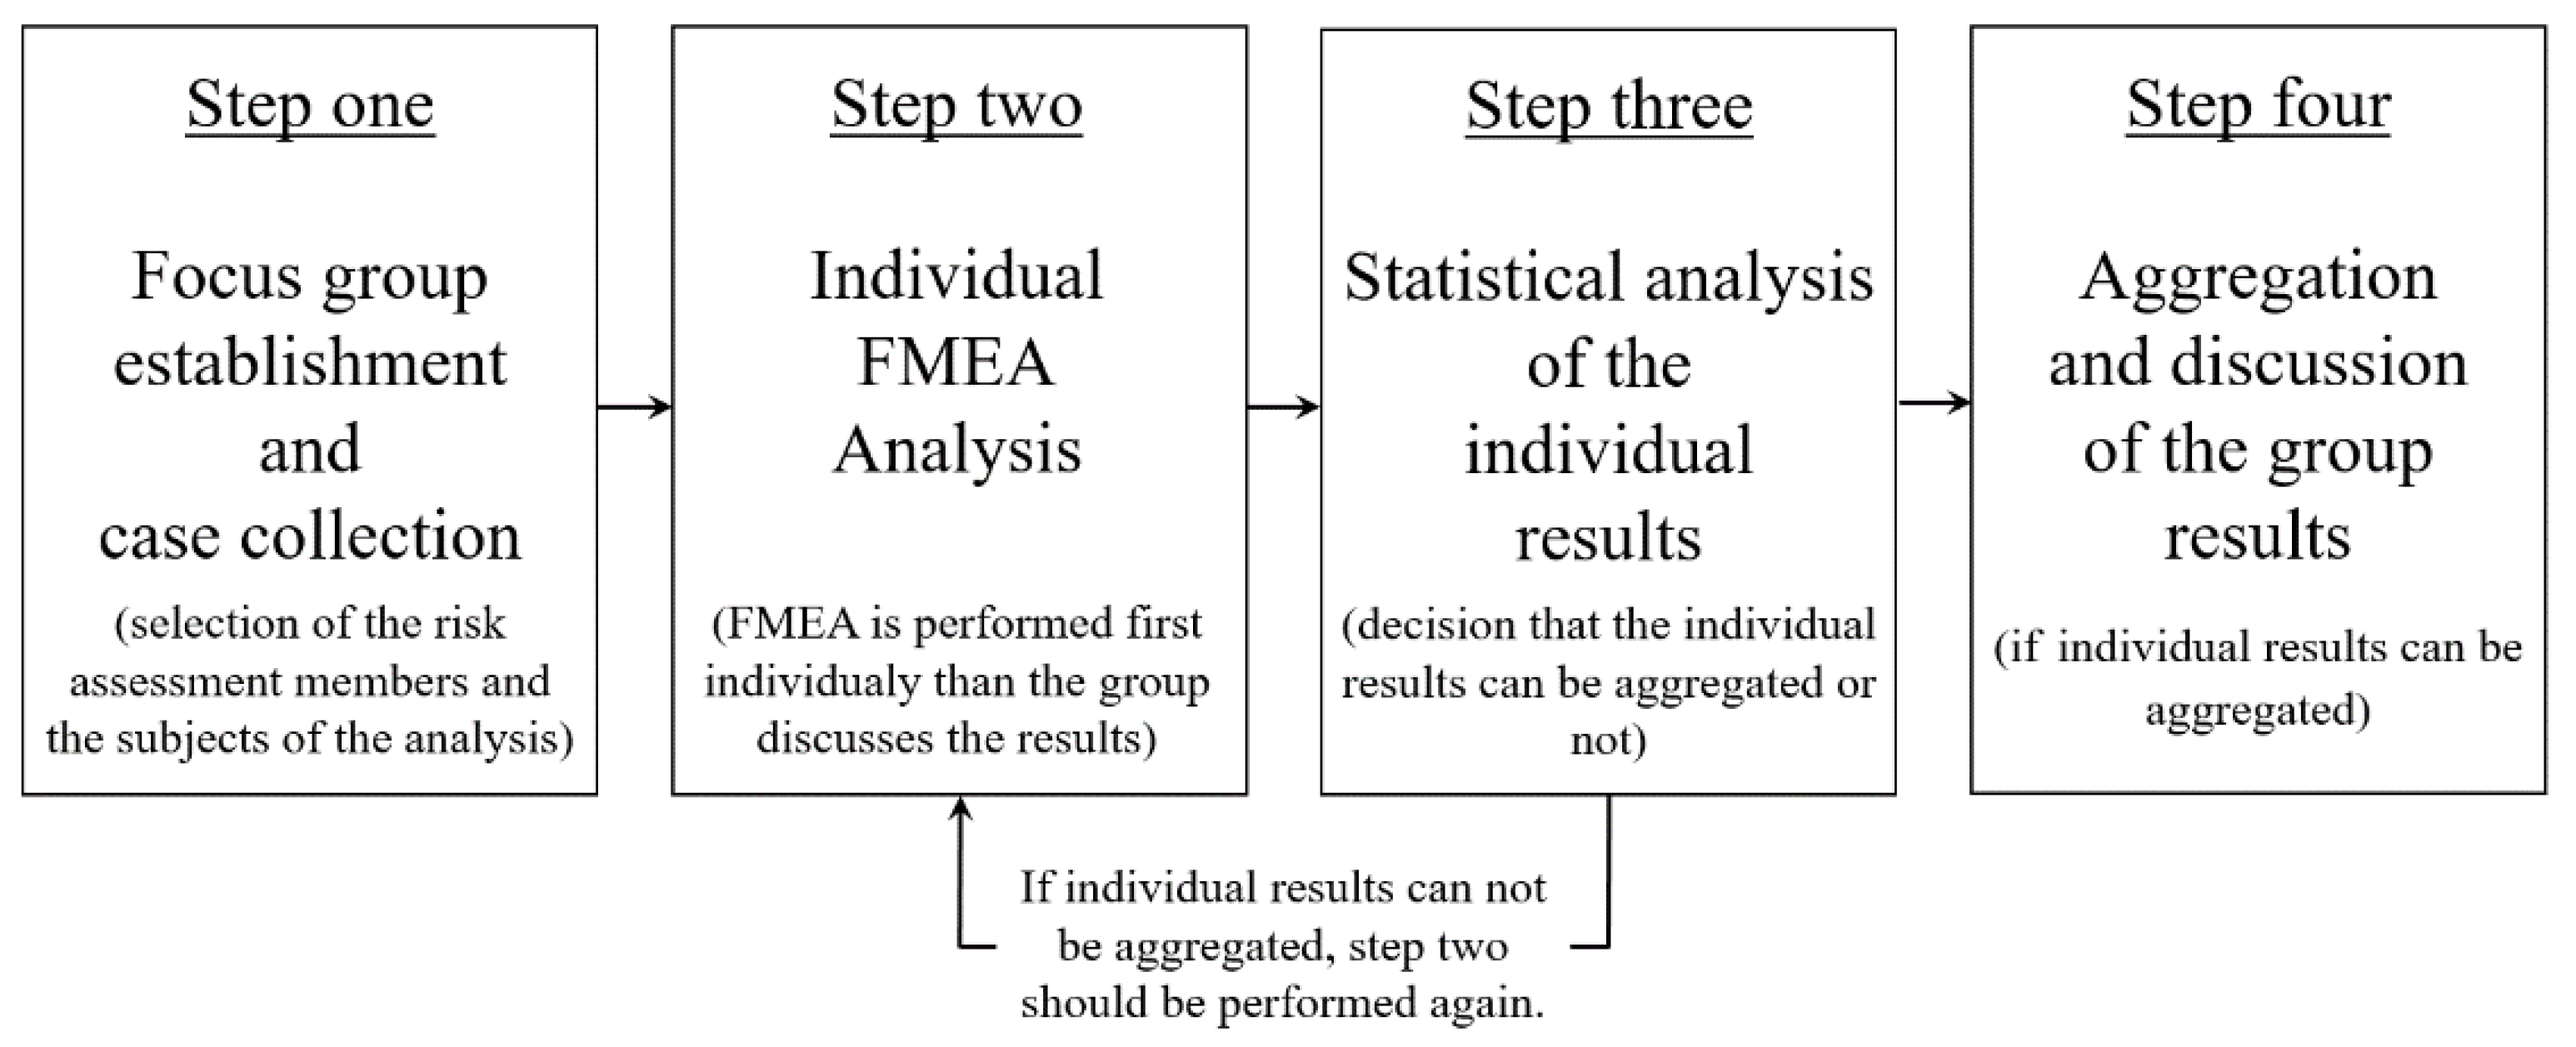
The steps of the empirical research are shown in
Figure 2.
Before the workshop, the bank was asked to describe existing compliance risks. The focus, among the broadly applicable compliance risks, was on the administration of the bank branch. In all cases, the emphasis was that the bank administrator does not make the right decision in a given situation, so there is a risk of compliance due to the wrong decision.
Numerous bank branch administration-related compliance risks can appear in the processes of every bank. In the case study, the focus on was presenting the steps of an assessment methodology. Out of the total sum of thirty cases provided by the bank, six cases were selected randomly for the analysis. The methodology would be the same if more or fewer cases were involved. The risk assessment of the randomly selected cases was the task of the four experts.
Table 1 briefly presents the situations selected for analysis.
In recent decades, there has been a broad theoretical consensus in the research community on which scales should be used to assess each dimension of risk assessment (
Liu et al. 2013). Nevertheless, in practice, scales are often modified to meet the measurement or estimation requirements of the analyzed product or process (
Bognár and Benedek 2021). The participants used the FMEA factor scales presented in
Table 2,
Table 3 and
Table 4.
The FMEA factors were evaluated using four-point scales. As a result, the value of the risk index (RPN), the product of the three factors, can be between 1 and 64.
During the focus group workshop, the selected cases were made available to the experts. The experts then carried out the risk assessment individually, independently of each other, as a nominal group. In doing so, the evaluators rated the six cases according to the three scales previously defined.
Table 5 summarizes the assessments of the four participants (“S”—severity, “O”—occurrence “D”—detection), including the calculated RPN values.
Table 6 shows the summary scoreboards. Two mergers of the individual results were performed. In one merger, the results of the risk assessment performed by all four experts were found. In the other case, only the results of compliance experts of the bank (“Compliance Expert 1”, “Compliance Expert 2”, “Compliance Expert 3”) were applied. The applied methodology for the aggregation was simple arithmetic averaging.
Based on the tables of individual and group risk assessments, it can be concluded that the risk assessment of each factor and the RPN indicator differ. Therefore, the tables describing the risk values are converted to the ranking tables shown in
Table 7 and
Table 8. Thus, the higher the risk value a case receives, the higher it ranks in the rankings.
4. Results
The research results are presented according to the research assumptions described in
Section 1.2. Therefore, the results related to the first assumption (A1) are described first.
Table 5 provides a partial answer to the first assumption, as the evaluation tables of the organization’s experts are different. The necessary step to complete the analyses was transforming the expert result tables into ordinal evaluations. These rankings are presented in
Table 7. Next, rank correlation and rank concordance analysis was performed.
Regarding the first assumption (A1), the differences between organizational peer reviews were examined separately using Spearman’s rank correlation and Kendall’s rank concordance coefficients.
Table 9 shows the results of Spearman’s rank correlation analysis. Again, the Spearman rho value is below 1.0 for any expert comparison, showing a significant difference in the result at the 5% significance level in only one case. This case is highlighted in the table.
Table 10 shows the results of Kendall’s rank concordance analysis.
The previous correlation analysis results show that the Kendall W values cannot reach 1.0 either. However, the table shows that the Kendall W values fluctuate around 0.9 and are significant at the 5% significance level in all cases.
The results related to the second assumption (A2) are described below.
Table 5 and
Table 7 provide data for this analysis. Finally,
Table 11 shows the correlations of the rankings of each internal expert and the external expert using Spearman’s rank correlation.
Including the external expert, the Spearman rho value is below 1.0, showing significant similarity at the 5% significance level of the results in only one case. This case is highlighted in the table.
Table 12 shows Kendall’s rank concordance analysis results calculated for the rankings of the external expert and the compliance experts of the bank.
For the four rankings formed with the involvement of an external expert, the Kendall W values are significant at the 5% significance level. Reading the results in
Table 10 and
Table 12 together shows that the Kendall rank concordance values were reduced with the involvement of an external expert. This phenomenon is particularly significant for RPN (dropping from 0.948 to 0.757).
6. Conclusions
This study aimed to describe a possible methodological process for monitoring group-level agreement on ranking compliance risks. First, a brief introduction to compliance management, compliance risk assessment and risk assessment methodologies was presented.
In response to the research question formulated in
Section 1.2, the process based on the FMEA method to assess compliance risks may be worthwhile. The proposed process can also be used in monitoring the level of group agreement. However, it can only be suitable for comparing expert assessments if they perform the FMEA-based risk analysis as a nominal group, i.e., independently.
Two assumptions have been examined in this paper. Considering the first assumption, the results highlight that FMEA used as a nominal group technique may provide an opportunity to compare the assessments of compliance risk evaluators and compare the individual assessments with the aggregated results. Understanding quantified disagreement in the views of experts can be beneficial in the development of compliance management systems. In addition, these differences draw attention to the differing interpretations of phenomena.
Considering the second assumption, the results show that applying the methodology may allow different expert assessments to be distinguished from the others. In addition to the regular monitoring of employee knowledge, this method can also provide an opportunity to identify new perspectives. If one assessment differs significantly from the others, it may contain essential new insights or other elements.
Section 2 presents how compliance management is closely related to risk management in the most general sense. ISO 19600:2014 recognizes a risk-based approach to compliance. Diverse experiences and incentives can cause significant differences in the ways in which individual experts assess risks, from assessing the operational context to incidents that arise.
The primary data collection of the case study was performed at one of the largest Central and Eastern European commercial banks in January 2021. The steps of the empirical research, the materials used, the FMEA methodology and the applied statistical methods (Spearman correlation analysis and Kendall rank concordance analysis) are detailed in
Section 3. The presented method goes beyond risk matrices, which are typically prevalent in the financial sector. Instead, the risk assessment methodology is based on the nominal group technique, in which the participants carry out the risk assessment independently.
The results are presented in
Section 4. The tables assessing the severity, occurrence, and ease of detection of compliance risks are sufficiently good descriptors of risk levels. The group-level agreement shows that the agreement between the compliance experts of the bank is significant.
Table 10 and
Table 12 together show that the levels of agreement on the ranking of compliance risks (Kendall rank concordance values) were reduced with the involvement of an external expert.
In
Section 5, the results are discussed. The risk assessment methodology based on the nominal group technique provides feedback on its applicability. It examines whether the independent expert opinions differ too much. In the case of significant discrepancies, averaging the evaluations would not give a reliable result. In this study, the external expert evaluated the organization’s compliance risks significantly differently, especially in evaluating the ease of detection.
In the future, it is worthwhile to carry out studies to see if there is any trend in the assessment of each type of risk for clearly identifiable risks. Similar to the above argument, it is agreed that the research should be carried out in the knowledge of regional categorizing variables in the bank’s domestic and international branch network, providing research opportunities, according to which the possible regional impact could be described.
Furthermore, future research could examine whether the individual expert results are more closely or weakly related to the group results if the risk assessment is performed as a nominal group.
By changing the described case study (number of cases, evaluators, application of relative scaling instead of auxiliary tables), evaluations and conclusions can be drawn using statistical methods formed based on high measurement level variables. Thus, it is possible to present a more nuanced image with a sufficiently large number of sample elements.


