Abstract
One of the key elements to consider in business management is the management of IT (Information Technology) departments by implementing processes as described in the ITIL (Information Technology Infrastructure Library) standard. This is particularly important in industries that are not directly related to ICT (Information and Communication Technologies), such as the tourism industry. In this paper, we present a methodology to sequence the implementation of the ITIL processes in any company to support its development. The methodology is based on an optimization algorithm and the information extracted from a survey. The optimal sequence is built from this information and from the information of the restrictions imposed by the company that implements the ITIL processes. We applied the methodology to a company in the tourism industry. The sequence obtained shows the need to implement operative processes (initial positions in the sequence), and afterwards strategic processes (final positions in the sequence). A comparison with other authors’ proposals shows differences in the order of processes proposed by this methodology. The main conclusion is that it is possible to use the information of companies to efficiently generate an optimal sequence of ITIL processes which enhances their management; this sequence is unique for every company that wants to implement ITIL in the tourism industry, and it is independent from the proposals of other authors who designed generic/non-optimal sequences.
1. Introduction
ITIL is considered the most important reference in the management of IT services [1,2]. However, the implementation of ITIL does not have a guide in the ITIL reference book. In fact, it is possible to find different approaches to the implementation of ITIL depending on the industry, the size of the company, the country, the type of company (public/private), or other specific factors [3,4,5,6,7]. The main problem for companies is the lack of clear criteria for the implementation of ITIL [8]. That is, there is no rule to follow during the implementation of ITIL. This is particularly important in the tourism industry because most companies are small or very small (small companies are commonly considered in Southern Europe as those with less than 50 employees). These small companies do not have enough resources to invest in IT and specifically in IT processes, so they usually need external help to improve their IT services.
The approaches for the implementation of ITIL can be classified as follows:
- A first and quite simple approach is to define a unique and generic sequence of the ITIL processes for all companies. This solution does not consider differences among industries, sizes, existing processes, or any other consideration. There are several authors who propose this solution (each one proposes a different sequence) [6,9,10,11]. The advantage of this sequence is that it is unique, so no more calculations are needed; each author proposes a static sequence of ITIL processes that could be used in any company (no matter the industry, size, previous implementation of processes, or any other consideration). The main disadvantage of these proposals is that the sequences are not adapted to the characteristics of the company, nor to its interests (for example, in adaptive sequences, it is possible to define an optimal sequence to draw closer to competitors or a different optimal sequence to draw closer to very small companies).
- A second approach is to define an adaptive sequence that considers the characteristics of the company (the industry, size, size of the IT department, and age, among others) to propose a specific sequence of the ITIL processes for that company. Papers such as [7,12,13,14] are good examples of this approach. The idea of these authors is to define specific sequences of the ITIL processes for each company. The way to define the sequence differs from one author to another. For example, [7,12] are based on a mathematical optimization fixed to some requisites defined by the company. In [13], the sequence is obtained from the priorities for the company, while [14] considers fuzzy logic to obtain different sequences for each company.
- An alternative to define a specific sequence is to determine which factors may help the implementation of ITIL: these are the so-called ‘critical implementation factors’. Different authors have worked on this area; the most relevant references are [15,16,17]. This approach does not clearly set the order of processes but defines the conditions to succeed with the ITIL implementation.
- An implementation project based on different periods or phases [18,19]. This strategy is focused on general tasks for the implementation of ITIL; it is not oriented to specifically define the order of processes but rather to manage the implementation as a whole project and define the phases needed to succeed.
- The main conclusion after reviewing the state of the art is that there is no clear methodology to know the sequence of the ITIL processes for their implementation, especially for small companies. In the literature review, we found some general approaches to set the order of processes, but they are mainly designed for big companies or specific cases.
Tourism Industry
The transformation in the tourism industry in recent years is based on the massive use of information and communication technologies. In fact, it is one of the industries that has invested the most in information technologies [20], not only in the beginning of the pandemic period, but starting years ago [21,22]. The investments have mainly targeted specific systems such as PMS (Property Management System) to gain benefits from the use of technology over competitors [23], although this is not as common in small and medium companies. The authors of [24] explain how more and more companies delegate all responsibilities about business information security, personal data of clients, the integration of systems, and the transition to cloud computing in the IT departments, but not all small companies rely on the effectiveness of this automation of processes and instead keep using spreadsheets to manage business operations. This hinders their involvement in the technological transition.
It is commonly accepted that changes in recent years have become strategic for companies to survive—the adoption of technologies and the implementation of processes to satisfy business requirements are essential for any company in the tourism industry. As exposed in [24,25], the adoption of these technologies and processes in the IT departments of tourism companies solves the following points:
- Room and visit management: check-in and check-out processes, room management, visitor management, selling terminals through a PMS (Property Management System) [26,27];
- Reservation management: CRS (Central Reservation System) [28], mainly oriented to manage the reservation of rooms;
- Client communications: CRM (Customer Relationship Management) [26,29], specially designed for a complete management of the relationship with the clients;
- Revenue management: YRM (Yield Revenue Management) [26,30] systems, initially designed to manage the yield in hotels.
The main finding in [23,24,25,26,27,28,29,30] is the considerable importance of IT in the tourism industry. Nevertheless, there are two important issues that emerge: the first is that the solutions based on technology are not being adopted by small companies as they are by big companies; the second is that even in cases where technology (such as CRS, CRM, YRM, and others) supports business tasks, the lack of IT processes (for example, ITIL) makes it difficult to benefit from the technology solutions [2], mainly because different approaches may be adopted depending on the characteristics of the company [4,5,6].
It is important to address the importance of very small, small, and medium companies in Southern Europe and specifically in Spain. Considering the information in [31], more than 99% of companies are medium, small, and very small companies; the ratios are not different in the tourism industry, where a typical company has a small or very small size [32].
The objective of this paper is to propose a methodology to obtain a sequence of ITIL processes which considers restrictions in the ITIL processes and takes the objectives of the company into account. This methodology has been applied to the tourism industry, especially to small companies in the tourism industry, due to the high percentage of these companies.
The result of the application of the methodology is an optimal sequence of the ITIL processes to be implemented in companies in the tourism industry. The sequence considers the most extended characteristics of small companies in this industry (although the methodology has been proven within tourism companies, it is possible to apply it to any industry by just updating the database with information of companies in that specific industry; thus, the methodology presented in the next section can be applied to any industry).
In this research, we performed a survey to gather information about the characteristics of tourism companies and the status of their implementation of ITIL processes. This information was combined with the approach of [12] to create a new optimization methodology that generates an optimal and more efficient sequence of ITIL processes. This sequence can be used in small and very small companies in the tourism industry. Moreover, the approach presented in this paper improves the approach of [12], as the sequence can be defined from a subset of all ITIL processes, which enhances the performance of the implementation project. Thus, in this paper, we present an improvement of the approach in [12] to avoid unnecessary processes and make the ITIL implementation project more efficient. The initial mathematical model was modified to consider new restrictions imposed by the company that implements ITIL. These restrictions consider the requirements of the company regarding delaying the implementation of processes, avoiding processes, or including processes previously excluded. The main advantage of this approach is that any small company in the tourism industry can use the list of processes proposed or define a new one (specifically adapted to that company) without hiring external experts or consultants.
The next sections present the survey carried out, the mathematical basis, and the enhanced methodology to obtain the optimal sequence for companies in the tourism industry. The result is the sequence itself, which is compared to other generic sequences (not specific for any industry) proposed by other authors. This comparison reveals the independence of the sequence obtained. Finally, the conclusions and future works are presented.
2. Materials and Methods
We conducted this research from a quantitative perspective, based on a structured form, aiming to gather information from tourism companies. The information gathered concerned the characteristics of the companies and the level of implementation of ITIL processes, used as a basis for the methodology to sequence the ITIL processes for other companies.
A web-based survey was developed to gain knowledge about the status of ITIL implementation in the tourism industry. The data are available in the public repository included in the Supplementary Materials. The survey was distributed to 200 companies by email and phone calls and, if needed, completed with face-to-face interviews, although the results were always finally introduced in a web form. Some initial checks were executed to avoid inconsistencies or redundant data.
The collected data were saved in a database to apply the new optimized methodology based on [12]. The new methodology proposed in this paper improves the results given because the optimal sequence is obtained not only by applying the criteria chosen by the company that implements ITIL, but also by imposing restrictions on the list of ITIL candidates (processes). The restrictions on the processes are oriented to avoid the implementation of some particular processes, to postpone some others, and/or to enable a process as a candidate to be implemented. This improvement of the methodology returns the sequence that best fits the needs and restrictions of the company. Of course, it is not the global optimal sequence, but the optimal one fixed to the restrictions imposed.
The implementation of the model in a web-based tool can be found in the public repository mentioned in the Supplementary Materials. The methodology is applied to a representative company by setting the parameters and restrictions of the company in the model. More specifically, the methodology was applied to a representative tourism center, which hopefully will help other centers implement ITIL processes. This representative tourism center has the most common characteristics of small centers in the tourism industry, which can be summarized as follows:
- Its main activity is in the tourism industry;
- It has less than 50 employees;
- The IT department has less than five employees;
- It operates in international markets but offers national destinations;
- It has a medium level of implementation of ITIL processes, as observed from the analysis of the survey responses.
The diagram in Figure 1 is a schema of the methodology applied, based on an improvement of the method in [12]. The steps are explained below.
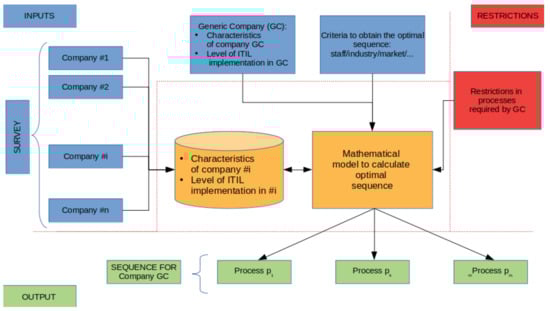
Figure 1.
Materials and methods.
- I.
- The data initially obtained through the survey are stored in a database. These data represent the characteristics of the tourism companies and the level of implementation of ITIL processes in each one.
- II.
- Once the data from the survey are stored in the database, a representative company in the tourism industry is set up in the system.
- III.
- The criteria to obtain the optimal sequence of ITIL processes is also set up. This step requires identifying how the optimal sequence is obtained. There are different possibilities for optimization: a generic optimization, a single parametric optimization, or a multiple parametric optimization. To obtain a more general solution, a generic optimization has been proposed.
- IV.
- The restrictions imposed by the representative company are modeled and introduced into the system. The method proposed in this article allows us to exclude some processes from the set of candidates.
- V.
- The mathematical model implemented to obtain an optimal sequence returns the set of ordered ITIL processes that best fit the criteria previously defined (satisfying the restrictions imposed by the company).
2.1. Scope of the Study
The scope defined is the set of companies related to the tourism industry (excluding the food industry) in Spain (there are no significant differences between European companies), considering both small and medium companies (which represent more than 99% of the total number of companies). The companies considered amount to around 50,000 (in 2021) and mainly engage in the following activities:
- Travel agencies;
- Hotels;
- Car renting;
- Cultural industry.
This percentage of small companies (95%) is similar to that of other close countries [33], and the characteristics of the companies are also similar to European ones. The survey aimed to collect information about the characteristics of every company answering the survey, namely, information regarding the staff, the working region, the number of IT employees, and the age, among others, as well as the level of the ITIL implementation in each company. The survey is detailed in Table A1.
The selection of companies for the survey was carried out randomly, and the survey was conducted from December 2021 to February 2022.
2.2. Data Storage
The database has been used to store data from the survey. It was important to save these data not only for analysis purposes, but mainly because they are used by the mathematical model to propose optimal ITIL sequences. The companies received an email to participate in a web questionnaire. The main results of this survey are the data of the ITIL implementation in every company, which are used by the mathematical model to obtain the optimal sequence. The characteristics of the companies are used to select which companies take part in the calculus of the optimal sequence. That is, the optimal sequence for company X is calculated from the data obtained in the survey, selecting just the companies with the characteristics specified by X.
As we explain later, the mathematical model considers all the information gathered in the survey (and other parameters) to propose an ITIL sequence to any company that seeks to implement the ITIL processes in an optimal way. The database stores information gathered in the survey. This information is:
- I.
- Characteristics of every company surveyed: staff, IT staff, industry, working region, and age;
- II.
- The status of implementation of every ITIL process. The possible answers for each ITIL process are:
- No, the process is not implemented, and it is not planned;
- The process is being implemented or it is medium-term planned;
- It is already implemented, or it will be in the short term.
2.3. Technical Aspects about the Survey
The way we selected the companies for the survey was by random selection (one step). The criteria used to recruit companies for the survey served to maintain the same ratios of the mentioned characteristics in the whole population of companies. Once the characteristics of the companies we sent the questionnaire to were chosen, and once the number of required responses was calculated, the survey was distributed to more companies than needed, but only the first responses received (up to the number required) were accepted.
Table 1 details the technical aspects of the survey.

Table 1.
Technical description of the survey.
The minimum responses needed were calculated from Equation (1):
where n is the sample size, that is, the number of responses needed; N is the population (total number of companies in the tourism industry in Spain); p, q are parameters related to the validity of the elements in the sample, both typically equal to 0.5; k is a constant that depends on the confidence level selected, e.g., for a confidence level of 90% to 99%, k varies from 1.65 to 2.58; and e is the sample error.
2.4. Methodology
As remarked previously, the starting point for this enhanced method to calculate the ITIL sequence is the methodology to obtain the optimal sequence with no restrictions [12].
It has been observed that the companies usually consider the optimal sequence obtained simply as a reference, but in most cases, they would prefer to restrict the number of ITIL processes to be included in the result. This limitation obliges us to impose new restrictions on the optimization model. So, let us define NP* as the parameter to calculate and obtain the optimal restricted sequence. Let NP* be:
fixed to
This means that the optimal processes cannot be selected from all the ITIL processes, but only from a subset of the ITIL processes, given by Equation (3). Therefore, the calculus of the NP in Equation (2) is not extended to all the ITIL processes (as pointed out in [12]), but only to a subset given by Equation (3). This new calculus is denoted by NP*. The values of the αj and γj parameters are useful to select the criteria used to optimize and fix their weights in the optimization formula. The values M and V are measures of the distance between the current situation of an ITIL process in a company and its complete implementation (for a specific company φNE and for the companies that satisfy the optimization criteria in the database, respectively). For example, if a specific ITIL process (process i) is not implemented in the company φ, then the value of Vi will be far from zero. On the other hand, if a specific ITIL process (process i) is implemented in the company φ (or it will be in the short term), then the value of Vi will be close to zero. In the same way, if the companies considered for the optimization (that is, those that satisfy the characteristic that j equals value k) have implemented the process i, then the value of M will be close to zero (that is, the average value will be close to zero); if the companies considered for the optimization have not implemented the process i, then the value of M will be far from zero. So, NP is a measurement of the level of implementation of a particular process i in the companies (selected by their characteristics j) versus the level of implementation of that particular process in the company φ. It can be concluded that NP is a measurement of the relative position of a company in terms of the level of implementation of a particular ITIL process i. That is, a small value of NP for a process i implies that the company φ is in a worse position than the companies that are taken as a reference for the optimization (chosen by their characteristics j). Moreover, a large value of NP for a process i implies that the company φ is in a better position than the companies that are taken as a reference for the optimization.
Finally, the set of processes φsubITIL is the set of processes of interest for the company φNE (the company that seeks to obtain the optimal restricted sequence of ITIL processes).
At this point, it is important to clarify the need to exclude the processes with no interest for φNE—as those processes will never take part in the optimal solution, there is no need to calculate anything about them. The most remarkable reasons to exclude these processes are the high cost of their implementation, the time needed to implement them, and the absence of a clear need in that particular company to implement them.
So, the sequence of the ITIL processes based on the characteristics chosen by the company with the restrictions fixed by that company is obtained by the iterative calculus given by the expression in Equation (4):
until ΦsubITIL is empty.
This solution is optimal in the subset of the ITIL processes desired by the company. That is, the initial calculus returned the optimal solution among all the ITIL processes, but this new calculation returns the optimal solution among the selected candidates. This calculation is aligned with the strategies of other authors [8,13,34,35,36], where only a subset of the ITIL processes is considered to define the optimal sequence (see Appendix B for a pseudo code program).
2.5. The Methodology to Obtain the Sequence
In order to apply the optimization formula (Equation (4)), it is necessary to use a methodology based on an iterative algorithm that progressively chooses the optimal process. The steps are as follows.
- The starting point is to provide the database with data. The algorithm needs information about the characteristics of the organizations and companies and data about the level of implementation of every ITIL process in those companies.
- Afterwards, to collect data about company X interested in obtaining an ITIL sequence of processes, both the characteristics of the company and the level of implementation of ITIL processes are required by the mathematically enhanced model.
- Generate the S_ITIL set of processes. This set of processes must not include the processes already implemented in company X, referenced by the set IMP. So, S_ITIL = S_ITIL-IMP.
- Set SSEL = {}. This is an empty set of selected processes.
- Generate the set Ex: set the processes excluded from optimization and recalculate S_ITIL = S_ITIL–Ex.
- Set the criteria for optimization by adjusting the αj weights and γj characteristics. In most cases, αj = 1, γj = 0 is enough.
- Obtain NP through the optimization formula for each process in S_ITIL.
- Choose the process pSEL as pointed out and include it in the set SSEL.
- Eliminate pSEL from the set S_ITIL.
- Repeat from step 7 until S_ITIL is empty.
- The ordered optimal sequence is contained in SSEL.
A full and detailed development of the algorithm to sequence the processes and optimize the management can be found in Appendix B.
3. Results
3.1. Application to the Tourism Industry
The next step in our research was to prove the application of the methodology to a specific case. To this end, a representative company in the tourism industry was selected. The next paragraphs explain how to apply this improved methodology and the differences obtained compared to the previous methodology. The objectives are (a) to show how the methodology can be applied to a real case and (b) to obtain a list of processes ready to be used by small tourism companies, if needed.
The representative company was defined from the data received in the survey. The median values for the characteristics and the level of ITIL implementation were used to set the representative company. These values were the input values to the mathematical model for calculating the optimal sequence.
3.1.1. Characteristics of the Sample
We used the sequencing methodology in the tourism industry to obtain the ordered list of the ITIL processes to be implemented in a representative case. This representative company is a small company with less than 50 employees and no more than five people in the IT department [31]. The small center is located in Spain and exhibits a medium level of ITIL implementation. It is a national company, although it manages international markets for national destinations. The values obtained for each ITIL process can be found in Table A2.
These values (description of the representative company and the level of ITIL implementation) are used as inputs in the model shown in Figure 1. We also needed to define the criteria for optimization. Due to the fact that, in the common case, the companies are interested in obtaining a sequence of ITIL processes to be implemented to draw closer to competitors, let us assume that the criterion which best fits this need for optimization is to take into account the companies in the tourism industry (no matter their size, age, or region). Let us remember that the model yields an optimal sequence considering the size of the company, the IT staff of the company, the age, or a combination of characteristics. Thus, we set ‘industry’ as the criteria to obtain the optimal sequence.
3.1.2. Calculation of the Optimal Restricted Sequence of the ITIL Processes
The application of the ordering algorithm returns an ordered set of processes to implement in any company in the tourism industry. The software that implements the calculations made, as well as the database, are available in the Supplementary Materials.
The application of the Delphi method with experts, as described in [13], advised us to exclude the processes listed in Table 2.
Table 2.
Restrictions: list of processes to exclude from the optimization.
Table 3.
Proposal of ordered list of ITIL processes for a representative tourism company.
4. Discussion
4.1. Analysis of the Sequence Obtained
This set of processes represents the ordered list of the ITIL processes that will most enhance the relative position of a company compared to competitors once the processes have been implemented. That is, this is the proposal of the processes to be implemented in a company that want to position themselves closest to competitors.
If we look at the list of processes obtained, the first one is ‘Incidence management’. This result agrees with the results obtained by other researchers [2]. The reason for this is that the optimal sequence was obtained by comparing all companies in the tourism industry, which, in general, are more advanced in terms of ITIL implementation. This is something common to all industries: the leaders (usually big companies) have a process-based management and are taken as references for smaller companies. The second one is ‘Continuous improvement management’; this process is not usually proposed by any author [4,5,6,7,8]. Nevertheless, the data gathered in the survey reveal that this process is implemented in many companies. So, even if authors do not propose it, the results obtained with the application of this methodology show us that a company that is implementing ITIL needs to have a continuous improvement process. The processes proposed by different authors [4,5,6,7,8] are much more focused on operating the IT departments than on the strategic processes or the improvement processes. The next three processes consider the requirements, the testing, and the transition into production of IT services, which is logical because IT departments are specially focused on having requirements for new services, implementing them, and moving them into production environments.
Following these processes, the next ones are proposed, including ‘Provider management’, based on the fact that e-commerce is forcing online interaction with providers, which obliges better management of them. After this, ‘Security management’ is proposed, also based on the increasing online activity of tourism companies. The final processes in this optimal sequence are ‘Capacity management’ and ‘Access management’ (the complete list obtained with the methodology can be found in Table A3).
4.2. Comparison to Other Methodologies
4.2.1. Comparison to Methodology with No Restrictions
In order to highlight the improvements when using the methodology proposed in this paper, let us compare the results with those obtained in [12]. The comparison is shown in Table 4.
Table 4.
Proposal of ordered list of ITIL processes applying the improved methodology.
When comparing Table 3 and Table 4, it is observed that the first five processes proposed are identical. The sixth to tenth processes are different due to the new restrictions imposed in the solution, addressed in Table 2. Only the first 10 processes have been listed to be aligned with the number of processes proposed by other authors [3,4,5,6,7,8,9]. Moreover, the processes in Table 2 are more oriented to operative issues than old ones, which are more focused on strategical and conceptual issues. This difference is based on the fact that the restrictions imposed avoid the selection of non-operative processes; that is, the companies initially prefer to choose the operative processes instead of strategical or conceptual processes.
4.2.2. Comparison to Other Authors Proposals
The new optimal sequence that has been obtained must be compared to the results and sequences proposed by other authors. This comparison will show if the optimal sequence is close to these or, on the other hand, is different. That is, we are interested in knowing if the sequence given in Table 2 is independent from the well-known sequences given by authors [8,13,35,36,37,38].
The procedure to evaluate that the two series of data, i.e., two sequences, are not correlated is based on the Spearman test and the Kendal test [39]. The Spearman test considers the following hypotheses:
where (di − dj) represents the difference of positions in the sequences for the same process.
H0.
Series are not dependent.
H1.
by evaluating the parameter:Series are correlated.
The Kendal test considers the same hypothesis by evaluating another parameter:
where nc and nd represent the concordant and discordant pairs, respectively.
It is usually considered that two sequences are not dependent when the null hypothesis H0 is validated by both tests. If the null hypothesis is just validated by one test, then the refutation of H0 is not definitive; in case both tests reject H0, then we conclude that the series are correlated (i.e., the sequences are not statistically different).
This comparison is shown in Table 5.
Table 5.
Comparison to other authors’ sequences (confidence level α = 95%).
Table 5 shows the comparison with the results of other authors. It is possible to deduce that the optimal sequence proposed in this article is different from the main authors’ sequences, except in the case of [13], where the independence is not statistically significant.
The main conclusion obtained is that the sequence proposed with the optimized methodology (with restrictions) improves the previous one by removing some processes (not desired by the company) and offering a specific sequence statistically different from the published ones. We must remember that the sequence obtained is based on data gathered though a survey and on the optimization criteria defined by the company.
4.2.3. Extensive Use of the Improved Methodology
Our improved methodology is based on a general method to optimize ITIL sequences. The initial mathematical basis is not defined for a specific industry—what makes it useful for a specific industry is the content of the database, i.e., it is necessary to have data from tourism companies to apply the methodology to that specific industry. In fact, the original methodology [12] was applied to a leisure company, and the improved methodology presented in this article was also applied to a representative tourism company that will successfully finish the implementation of the first processes soon. The importance of the contribution is that companies have a clear sequence to implement ITIL that satisfies their objectives. The application to any other company is achieved by entering its characteristics and obtaining an adapted ITIL sequence. Therefore, it can be concluded that the limitation to the application of the presented methodology is just the content of the database and not the mathematical model, and this issue can be easily solved with more surveys.
5. Conclusions
An improved methodology to manage business processes and to obtain the sequence of ITIL processes is proposed and applied to a case in the tourism industry. The methodology returns the optimal sequence of the ITIL processes that a company should implement to satisfy the requirements established. These requirements are fixed by the company depending on its interests (draw closer to competitors, be similar to other small companies, etc.). These requirements and the data in the database (information gathered through a survey) are used in the optimization formula to obtain the best sequence of ITIL processes. The main contribution is the possibility to exclude some processes from the optimization calculus, so the final sequence considers not only criteria for optimization, but also a set of non-eligible processes. Thus, the sequence obtained is the one that best fits the needs of the company.
In comparison with the other alternatives analyzed in the article, this proposal has the advantage of being fully adaptive to the company that wants to implement ITIL. The company can obtain a specific sequence of ITIL processes for its purposes. On the other hand, the other approaches found in the literature review propose a non-adaptive sequence (i.e., a unique sequence independent of the characteristics of the company) or a minimal subset of ITIL processes—it has not been possible to identify an adaptive full sequence of ITIL processes.
Moreover, this method is based on a mathematical model that optimizes the sequence to fulfill the requirements of the company. This is not the case of the other methodologies and algorithms analyzed in the state of the art review. Those alternatives are either based on empirical observations or on the opinion of experts, but no mathematical model supports the proposals.
Another advantage is the public availability of this methodology, as it is published in a public repository, ready to be used by any company that wants to implement ITIL. Even a sequence proposal is presented in this paper for a representative company in the tourism industry, which can be used by any company in the tourism industry.
The improved methodology to sequence the ITIL processes presented in this paper overcomes the situation where a company is not interested in a particular process due to its implementation cost, implementation time, or any other reason. As explained in the Methodology section, it has been possible to improve the initial methodology by focusing only on the ITIL processes that make sense for the company. This method helps make the methodology more efficient as well as avoid non-desired processes in the sequence.
As pointed out before, the methodology is used to define the best sequence for a representative standard tourism industry company, but research works are open. Future works will allow us to include some more improvements in terms of cost, time, and other parameters to obtain (even) more precise sequences. For example, some improvements can be made to enhance the optimization function. As it considers the differences between the current level of ITIL implementation of a company and the desired situation, the function could consider the cost, the time, or the handicaps associated with the implementation of each process. That is, a mathematical model could be imagined that considers the difficulty to implement, for example, the access management process because the company is geographically distributed and there is no unified access system. The consideration of these topics could improve the results of the methodology and help the companies that use it even more.
Another way to improve the methodology consists of including more companies and characteristics of companies, which will clearly improve the quality of the proposed sequences. The refinement of the optimization function with new characteristics will help yield better results.
Supplementary Materials
The following supporting information can be downloaded at https://doi.org/10.5281/zenodo.6470763: 1. Web app to generate the ITIL sequence; 2. Data gathered from the survey to be used in the algorithm.
Author Contributions
Conceptualization, J.L.R.S.; methodology, J.L.R.S., O.M.M. and M.R.G.R.; software, J.L.R.S.; validation, O.M.M. and M.R.G.R.; formal analysis, J.L.R.S., O.M.M. and M.R.G.R.; investigation, O.M.M. and M.R.G.R.; resources, O.M.M. and M.R.G.R.; data curation, O.M.M. and M.R.G.R.; writing—original draft preparation, J.L.R.S.; and writing—review and editing, J.L.R.S., O.M.M. and M.R.G.R. All authors have read and agreed to the published version of the manuscript.
Funding
This research received no external funding.
Institutional Review Board Statement
Not applicable.
Informed Consent Statement
Not applicable.
Data Availability Statement
Data supporting the reported results can be found in the Supplementary Materials.
Conflicts of Interest
The authors declare no conflict of interest.
Appendix A
Table A1.
Questionnaire used in the survey about ITIL processes.
Table A1.
Questionnaire used in the survey about ITIL processes.
| Process Id | Process Description | Question |
|---|---|---|
| 1 | Strategic management of IT services | Give a value (1-3) for the strategic management of IT services in your company |
| 2 | Portfolio management of IT services | Give a value (1-3) for the portfolio management of IT services in your company |
| 3 | Financial management | Give a value (1-3) for the financial management of IT services in your company |
| 4 | Demand management | Give a value (1-3) for the demand management of IT services in your company |
| 5 | Business relationship management | Give a value (1-3) for the business relationship management of IT services in your company |
| 6 | Design coordination | Give a value (1-3) for the design coordination of IT services in your company |
| 7 | Service catalog management | Give a value (1-3) for the service catalog management of IT services in your company |
| 8 | Availability management | Give a value (1-3) for the availability management of IT services in your company |
| 9 | Service level management | Give a value (1-3) for the service level management of IT services in your company |
| 10 | Continuity management | Give a value (1-3) for the continuity management of IT services in your company |
| 11 | Security management | Give a value (1-3) for the security management of IT services in your company |
| 12 | Provider management | Give a value (1-3) for the provider management of IT services in your company |
| 13 | Capacity management | Give a value (1-3) for the capacity management of IT services in your company |
| 14 | Transition scheduling | Give a value (1-3) for the transition scheduling management of IT services in your company |
| 15 | Change management | Give a value (1-3) for the change management of IT services in your company |
| 16 | Deploy and version management | Give a value (1-3) for the deploy and version management of IT services in your company |
| 17 | Validation and test management | Give a value (1-3) for the validation and test management of IT services in your company |
| 18 | Asset and configuration management | Give a value (1-3) for the asset and configuration management of IT services in your company |
| 19 | Change assessment | Give a value (1-3) for the change assessment of IT services in your company |
| 20 | Knowledge management | Give a value (1-3) for the knowledge management of IT services in your company |
| 21 | Problem management | Give a value (1-3) for the problem management of IT services in your company |
| 22 | Incident management | Give a value (1-3) for the incident management of IT services in your company |
| 23 | Access management | Give a value (1-3) for the access management of IT services in your company |
| 24 | Event management | Give a value (1-3) for the event management of IT services in your company |
| 25 | Requests management | Give a value (1-3) for the requests management of IT services in your company |
| 26 | Continuous improvement | Give a value (1-3) for the continuous improvement management of IT services in your company |
Table A2.
Values used for ITIL processes in a representative company.
Table A2.
Values used for ITIL processes in a representative company.
| ITIL Process | Average; [Value] | ITIL Process | Average; [Value] | ITIL Process | Average; [Value] | ITIL Process | Average; [Value] |
|---|---|---|---|---|---|---|---|
| 1 | 2.02; [2] | 8 | 2.17; [2] | 15 | 2.16; [2] | 22 | 1; [1] |
| 2 | 2.15; [2] | 9 | 2.20; [2] | 16 | 2.24; [2] | 23 | 2.23; [2] |
| 3 | 2.20; [2] | 10 | 2.20; [2] | 17 | 2.28; [2] | 24 | 2.25; [2] |
| 4 | 2.18; [2] | 11 | 2.23; [2] | 18 | 2.22; [2] | 25 | 2.27; [2] |
| 5 | 1; [1] | 12 | 2.24; [2] | 19 | 2.24; [2] | 26 | 2.33; [2] |
| 6 | 2.09; [2] | 13 | 2.23; [2] | 20 | 2.24; [2] | - | |
| 7 | 2.13; [2] | 14 | 2.26; [2] | 21 | 2.33; [2] | - |
Table A3.
Proposal of ordered list of ITIL processes for a representative tourism company.
Table A3.
Proposal of ordered list of ITIL processes for a representative tourism company.
| List Order | Process |
|---|---|
| 1 | Incidence management |
| 2 | Continuous improvement management |
| 3 | Validation and testing management |
| 4 | Requirement management |
| 5 | Transition scheduling management |
| 6 | Provider management |
| 7 | Version and deploy management |
| 8 | Security management |
| 9 | Capacity management |
| 10 | Access management |
| 11 | Asset and configuration management |
| 12 | Service level management |
| 13 | Continuity management |
| 14 | Demand management |
| 15 | Availability management |
| 16 | Change management |
| 17 | Service portfolio management |
| 18 | Service catalog management |
Appendix B
- procedure sequence_ITIL ()
- {
- #Require data, level of ITIL implementation, restrictions and
- #objectives from the #company X. Evaluate distance to maximum
- #implementation
- #
- #At the beginning, the characteristics of company X are required
- for each characteristic
- input (ch[j]) #for company X
- #For company X, the implementation for a process is required
- for each ITIL_process p_i
- {
- require (dist[p_i]); #for company X
- V[p_i] = MAX_VALUE_IMPLEMENTATION–dist[p_i];
- }
- #Create initial vector of candidate processes
- Scandidates = {}
- #Create vector of processes excluded
- for each ITIL_process p_i
- input (ex[j]) #for company X
- for each ITIL_process p_i
- {
- #exclude already fully implemented
- if (dist[p_i] <> MAX_VALUE_IMPLEMENTATION ) &&
- (NOT ex[p_i])
- Scandidates = Scandidates U {process p_i}
- }
- #Create the set SSEL={}. This is an empty set of
- processes.
- SSEL = {}
- #Create vectors t and T from the data in database
- for each ITIL_process p_i in Scandidates
- {
- for each characteristic ch[j]
- {
- for each possible value of ch[j]
- {
- evaluate t[i][j][k]; #optimization expression
- T[i][j][k]= MAX_VALUE_IMPLEMENTATION-t[i][j][k];
- }
- }
- }
- #Initialize the criteria for optimization:
- #gj = 0 for the characteristics will not be present in optimization
- #1>=aj>0 to weight the characteristics will be in optimization
- for each characteristic ch[j]
- {
- input (int g[j]); # g[j] =0 or g[j]=1
- input (float a[j]); # 1 >= a[j] >0
- }
- while SSEL <> {}
- {
- #Calculate NP for every process in Scandidates and choose the
- #min value
- #
- #At beginning, NP_min is the process number 1
- NP_min = NP[Scandidates [1]];
- pSEL = 1; #Process with NP_min
- for i = 2 until {number of processes in Scandidates}
- {
- evaluate NP[Scandidates [i]]; #apply expression for optimization
- if NP[Scandidates [i]] < NP_min
- NP_min = NP[Φcandidates [i]] #new minimum value
- pSEL = i; # New process with new NP_min value
- }
- #Select the process pSEL and include it in the set SSEL.
- SSEL = SSEL U {Scandidates [pSEL]} #include in SSEL list
- Scandidates = Scandidates - {Scandidates [pSEL]}#delete in
- Scandidates
- }
- #The optimal sequence is contained in SSEL.
- print SSEL
- }
References
- Gervalla, M.; Preniqi, N.; Kopacek, P. IT infrastructure library (ITIL) framework approach to IT governance. IFAC PapersOnLine 2018, 51, 181–185. [Google Scholar] [CrossRef]
- Polard, C.; Cater-Steel, A. Justifications, Strategies, and Critical Success Factors in Successful ITIL Implementations in U.S. and Australian Companies: An Exploratory Study. Inf. Syst. Manag. 2009, 26, 164–175. [Google Scholar] [CrossRef]
- Cater-Steel, A.; Tan, W.G. Implementation of IT infrastructure library (ITIL) in Australia: Progress and success factors. In Proceedings of the 2005 IT Governance International Conference, Auckland, New Zealand, 14–16 November 2005. [Google Scholar]
- Tan, W.-G.; Cater-Steel, A.; Toleman, M.; Seaniger, R. Implementing centralized IT service management: Drawing lessons from the public sector. IFAC PapersOnLine 2007, 51, 181–185. [Google Scholar]
- Tawar, T. Applying ITIL Based Software Inside University’s ICT Centre toward Continual Service Improvement. In Proceedings of the Information Systems International Conference (ISICO), Bali, Indonesia, 2–4 December 2013; Volume 2. [Google Scholar]
- Orlandi, T.; Santos Dantas, F.; Souza Neto, J. The use of portfolio management for strategic alignment—A survey with Brazilian Companies. J. Inf. Syst. Technol. Manag. 2020, 17, e202017004. [Google Scholar] [CrossRef]
- Schaefer, J.; Baierle, I.; Nara, E.; Benitez, G.; Haetinger, C. Corporate Governance and Information Technology: A Hybrid Vision Based on COBIT and ITIL for Small Companies. In Proceedings of the XL Encontro Nacional de Engenharia de Producao, Foz do Iguaçu, Brazil, 20–23 October 2020. [Google Scholar]
- Lema, L.; Calvo-Manzano, J.A.; Colomo-Palacios, R.; Arcilla, M. ITIL in small to medium sized enterprises software companies: Towards an implementarion sequence. J. Softw. Evol. Process 2015, 27, 528–538. [Google Scholar] [CrossRef]
- Masarat, A.; Mohammad, S.; Shamsul, S.; Sulaimi, I. Adoption Factors and Implementation Steps of ITSM in the Target. In Proceedings of the 2009 Third Asia International Conference on Modelling & Simulation, Bali, Indonesia, 25–29 May 2009; pp. 369–374. [Google Scholar]
- Lema, L. ITIL in Small to Medium-Sized Enterprises: Toward a Proposal Based on an ITIL Processes Implementation Sequence and a Profile Scheme Strategy for Implementing the First Process in the Sequence. Master’s Thesis, Lenguajes y Sistemas Informáticos e Ingeniería del Software, Universidad Politécnica de Madrid, Madrid, Spain, 2015. Available online: http://oa.upm.es/36237/ (accessed on 5 April 2022).
- Cater-Steel, A.; Toleman, M.; Tan, W.-G. Implementing IT service management: A case study focusing on critical success factors. J. Comput. Inf. Syst. 2009, 50, 1–9. [Google Scholar]
- Rubio Sánchez, J.L. Model to Optimize the Decision Making on Processes in IT Departments. Mathematics 2021, 9, 983. [Google Scholar] [CrossRef]
- Miller, A.C. Implementation Priority of the ITIL Framework Based on a Process Sequencing Model. Ph.D. Thesis, The George Washington University, Washington, DC, USA, 2017. [Google Scholar]
- Shojafar, M.; Zarrazvand, H. The Use of Fuzzy Cognitive Maps in Analyzing and Implementation of ITIL Processes. arXiv 2012, arXiv:1206.2297. [Google Scholar]
- Cater-Steel, A.; Toleman, M.; Tan, W.-G. Transforming IT service management—The ITIL impact. In Proceedings of the 17th Australasian Conference on Information Systems, Adelaide, South Australia, 6–8 December 2006. [Google Scholar]
- Cater-Steel, A.; Pollard, C. Conflicting views on ITIL implementation: Managed as a project–or business as usual. In Proceedings of the 2008 International Conference on Information Resources Management, Niagara Falls, ON, Canada, 18–20 May 2008. [Google Scholar]
- Iden, J.; Eikebrokk, T.R. The impact of senior management involvement, organisational commitment and group efficacy on ITIL implementation benefits. Inf. Syst. e-Bus. Manag. 2015, 13, 527–552. [Google Scholar] [CrossRef][Green Version]
- Belalcázar, A. Incorporation of good practices in the development and deployment of dpplications through alignment of ITIL and Devops. In Proceedings of the 2017 International Conference on Information Systems and Computer Science, Quito, Ecuador, 23–25 November 2017. [Google Scholar] [CrossRef]
- Case, G. ITIL V3. Where to Start and How to Achieve Quick Wins. 2007. Available online: https://www3.pinkelephant.com/articles/itilv3wheretostarthowtoachievequickwins.pdf (accessed on 4 May 2022).
- Romero, R. El Sector Hotelero En La Era Covid: Cae La Demanda Pero Crece La Inversión. Available online: https://www.elconfidencial.com/mercados/2020-12-18/estrategias-inversion-sector-hotelero-bra_2875863/ (accessed on 3 November 2021).
- Sayles, C.I. New York Hilton data-processing system. Cornell Hotel. Restaur. Adm. Q. 1963, 4, 20–41. [Google Scholar]
- Roach, S. Services under Siege—The Restructuring Imperative. Harv. Bus. Rev. 1991, 5, 82–92. [Google Scholar]
- Garayar, R. Los Seis Pilares de la Tecnología en Gestión Hotelera. June 2022, de Instituto Tecnológico Hotelero Sitio Web. 2021. Available online: https://www.ithotelero.com/blog/los-6-pilares-de-la-tecnologia-en-gestion-hotelera/ (accessed on 4 May 2022).
- Hotelogix. 4 Claves Que Todo Equipo De IT De Grupos De Múltiples Hoteles Debe Considerar. 2014. Available online: https://www.hotelogix.com/es/blog/2014/04/17/4-claves-que-todo-equipo-de-it-de-grupos-de-multiples-hoteles-debe-considerar/5/ (accessed on 3 November 2021).
- Figueroa Domecq y Talón Ballestero, P. La gestión de la información en el sector hotelero madrileño la inversión en TICS, la importancia de la conectividad y las características del hotel. In Proceedings of the XXI Congreso Anual AEDEM, Universidad Rey Juan Carlos Base de Datos, Madrid, Spain, 6–8 June 2007; Volume 1, p. 26. [Google Scholar]
- Jones, N. Defining YM and measuring its impact on hotel performance. In YM: Strategies for the Service Industries; Ingold, A., McMahon-Beattie, U., Yeoman, I., Eds.; Continuum: London, UK, 2000. [Google Scholar]
- Arteaga, J.M.; Fernández, J.M.; Fa, M.C. El uso de las tecnologías de la información en el sector hotelero. In Proceedings of the VI Congreso “Turismo y Tecnologías de la Información y las Comunicaciones”, Valladolid, Cuba; 2006; Volume 11, pp. 47–58. [Google Scholar]
- Jafari, J.; Medina, V.M.P. Enciclopedia Del Turismo; Síntesis: Madrid, Spain, 2000. [Google Scholar]
- Arellano Díaz, H.O. La calidad en el servicio como ventaja competitiva. Rev. Científica Dominio Cienc. 2017, 3, 72–83. [Google Scholar]
- Kimes, S. The principles of YM: An overview. In YM: Strategies for the Service Industries; Yeoman, I., Ingold, A., Eds.; Cassell: London, UK, 1997. [Google Scholar]
- Ministerio de Industria. Comercio y Turismo. In Cifras Pyme; Gobierno de España: Madrid, Spain, 2020. [Google Scholar]
- CIGREF. Les Référentiels de la DSI—Usages Et Bonnes Pratiques. 2009. Available online: https://www.cigref.fr/cigref_publications/RapportsContainer/Parus2009/Referentiels_de_la_DSI_CIGREF_2009.pdf (accessed on 25 December 2021).
- Urueña, A.; Ballestero, M.P.; Castro, R.; Cadenas, S.; Maira, M.; Prieto, E. Análisis Sectorial de la Implantación de las TIC en las Empresas Españolas. Informe ePYME; Ministerio de Asuntos Económicos y Transformación Digital: Madrid, Spain, 2019; ISSN 2341-4030.
- Calvo, J.A.; Lema, L.; Arcilla, M.; Rubio, J.L. How small and medium enterprises can begin their implementation of ITIL? Rev. Fac.Ing. Univ. Antioq. 2015, 77, 127–136. [Google Scholar]
- Pastuszak, J.; Czarnecki, A.; Orlowski, C. Ontologically Aided Rule Model for the Implementation of ITIL Processes. In Advances in Knowledge-Based and Intelligent Information and Engineering Systems; Graña, M., Toro, C., Posada, J., Howlett, R.J., Jain, L.C., Eds.; IOS Press: Amsterdam, The Netherlands, 2012; pp. 1428–1438. [Google Scholar]
- Marrone, M.; Gacenga, F.; Cater-Steel, A.; Kolbe, L. IT Service Management: A Cross-national Study of ITIL Adoption. Commun. Assoc. Inf. Syst. 2014, 34, 49. [Google Scholar] [CrossRef]
- Zareravasan, A.; Mansouri, T.; Mehrabioun, M. Supporting the module sequencing decision in ITIL solution implementation: An application of the fuzzy TOPSIS approach. Int. J. Inf. Technol. Syst. Approach 2014, 7, 41–60. [Google Scholar] [CrossRef]
- Lucio-Nieto, T.; González-Bañales, D.L. Exploring ITIL® Implementation Challenges in Latin American Companies. Int. J. Inf. Technol. Syst. Approach 2019, 12, 73–86. [Google Scholar] [CrossRef]
- Zhang, L.; Lu, D.; Wang, X. Measuring and testing interdependence among random vectors based on Spearman’s ρ and Kendall’s τ. Comput. Stat. 2020, 35, 1685–1713. [Google Scholar] [CrossRef]

Publisher’s Note: MDPI stays neutral with regard to jurisdictional claims in published maps and institutional affiliations. |
© 2022 by the authors. Licensee MDPI, Basel, Switzerland. This article is an open access article distributed under the terms and conditions of the Creative Commons Attribution (CC BY) license (https://creativecommons.org/licenses/by/4.0/).