Article

A Comprehensive CFD Assessment of Wheat Flow in Wheat Conveying Cyclone Validation and Performance Analysis by Experimental Data

by
Sajed Naiemi Dizajyekan
1,
Gholamhossein Shahgholi
1,*,
Adel Rezvanivand Fanaei
2,
Vahid Rostampour
2,
Vali Rasooli Sharabiani
1,
Mariusz Szymanek
3,* and
Andrzej Marczuk
3
1
Department of Biosystems Engineering, University of Mohaghegh Ardabili, P.O. Box 179, Ardabil, Iran
2
Department of Mechanic of Biosystems Engineering, Urmia University, P.O. Box 165, Urmia, Iran
3
Department of Agricultural, Forest and Transport Machinery, University of Life Sciences in Lublin, Głęboka 28, 20-612 Lublin, Poland
*
Authors to whom correspondence should be addressed.
Processes 2022, 10(1), 1; https://doi.org/10.3390/pr10010001
Submission received: 24 November 2021 / Revised: 15 December 2021 / Accepted: 15 December 2021 / Published: 21 December 2021

Abstract

:
Cyclone is often used in the Industry due to its low maintenance costs, simple design, and ease of operation. This work presents both experimental and simulation evaluation on the effect of inlet velocity and mass flow rate on the performance of a wheat conveying cyclone. According to the great importance of the pressure drop and separation efficiency on the separation phenomenon in the cyclone, a comprehensive study has been conducted in this regard. A computational fluid dynamics (CFD) simulation was realized using a Reynolds stress turbulence model, and particle-air interactions were modeled using a discrete phase model. The result showed a good agreement between the measured value and CFD simulation on the pressure drop and tangential velocity with a maximum deviation of 6.8%. It was found that the separation efficiency increased with inlet velocity up to 16 m s−1 but decreased slightly at a velocity of 20 m s−1. The pressure drop increased proportionally with inlet velocity. However, optimum performance with the highest separation efficiency (99%) and acceptable pressure drop (416 Pa) was achieved at the inlet velocity of 16 m s−1 and mass flow rate of 0.01 kg s−1.

1. Introduction

A cyclone separator separates the solids from a gas–solid mixture using a centrifugal force created by swirling flow. A cyclone is often used in a wide range of processes ranging from food processing to air pollution control due to its simplicity, low operational, and maintenance costs. For instance, a cyclone is used in many agricultural food processing plants. Cyclones are also commonly used in cement plants and sawmills for dust removal.
The gas stream behavior in cyclones is complex, despite its simple design [1]. Cyclones usually separate particles bigger than 10 μm in size. However, conventional cyclones often have lower than 90% separation efficiency, unless the particle size is greater than 25 μm [2].
Primary studies concerning cyclone separators can be categorized in several subjects, including (1) study of the inlet velocity, mass flow rate, and temperature effects on cyclone performance; (2) the effects of cyclone dimensions on pressure drop, separation efficiency, and velocity field; and (3) the surface roughness effects on cyclone performance and optimization of various cyclone dimensions in order to obtain the best performance (maximum efficiency and minimum pressure drop).
A CFD study covering the temperature and inlet velocity effects on cyclone pressure drop was conducted. In this research, four empirical models to predict the pressure drop were reviewed. Additionally, several empirical models were evaluated to predict cyclone efficiency [3,4,5]. In the following, the effect of the inlet duct angle on cyclone performance (separation efficiency and pressure drop) was analyzed [6]. Brar et al. studied the cyclone height as a vital geometry parameter, and they conducted that increasing the cyclone length by up to 5.5 times the cyclone diameter resulted in a 34% saving in pressure drop and increased separation efficiency by about 10% [7].
In the following, some mathematical models were applied to study the surface roughness in cyclone separators. The results showed that separation efficiency and pressure drop decreased when surface roughness increased [8,9]. Multi-objective optimization is another interesting field related to cyclone separators. Sun et al. performed a multi-objective optimization using response surface methodology combined with CFD to improve cyclone performance by minimizing the pressure drop and enhancing separation efficiency [10]. Sun and Yoon carried out a multi-objective optimization using a genetic algorithm and CFD [11]. The effect of the eccentric vortex finder on cyclone performance was studied. Additionally, the performance parameters of the cyclone were optimized [12].
Hydrodynamics of aero-cyclones and its simulation in high temperature carried out by Gimbun [3]. The Reynolds stress model was applied in turbulent modeling, and particle trajectory calculation was made by Discrete Phase Model (DPM). A good agreement was reported between simulation results and experimental data (error about 5%) [5].
In some studies, novelties were added to cyclone geometry. The effects of utilizing ribs on the performance of cyclone and flow patterns were investigated. The authors applied RSM based on the SIMPLE scheme to model the turbulence in the flow. The results indicated that utilizing ribs leads to a higher pressure drop and higher collection efficiency [13]. In another study, various discretization schemes were performed in the simulation of the dispersed phase of the cyclone separator. The Reynolds Stress Turbulent Model (RSM) was used in the simulations. According to the results, high order schemes show good potential to predict the collection efficiency of smaller particles. The CFD method, utilizing a trapezoidal scheme, is the optimum choice for the simulation of the dispersed (second) phase of a cyclone separator [14].
Additionally, the study of separation cyclones with multiple inlets [15,16,17], new vortex finders [18,19], as well as the use of new techniques, such as the non-invasive environmentally friendly acoustic emission technique [20], was performed by various authors.
Despite all the previous experimental and modeling studies on the cyclone, the effects of inlet parameters such as how velocity and solid flow rate on turbulence intensity may affect the cyclone performance and durability, are not yet fully understood. Previous works have mainly focused on the effect of geometry on cyclone performance.

2. Materials and Methods

2.1. Cyclone Geometry and Experimental Setup

The cyclone used in experiments is illustrated in Figure 1a. This cyclone is a high-efficiency Stairmand cyclone with a tangential entrance section. The dimensions of the cyclone’s different sections are presented in Figure 1b. Additionally, cyclone separator dimensions are presented in Table 1. Velocity was measured by a hot-wire anemometer, whereas the pressure drop was measured using a differential pressure gauge. The experimental set-up is shown in Figure 2.

2.2. Separation Efficiency

The particles separation efficiency ( η ) was computed as follows:
η = E i E e E i × 100
where Ei is the wheat seeds mass (kg) at cyclone inlet, and Ee is the wheat seeds mass (kg) at cyclone exit. The calculations are based on collecting wheat seeds from cyclone inlet and exit.

2.3. Numerical Procedure and Simulation Setup

ANSYS Fluent 15 is a commercial software that operates the finite volume formulation to conduct segregated and coupled calculations [21]. The selection of a proper turbulence model is vital to resolve the highly anisotropic swirling flow in cyclones. Based on the previous work by [3], the two-equation turbulence model, which assumes an isotropic turbulence intensity cannot predict the flow field and performance of cyclone correctly. Therefore, a Reynolds Stress Model (RSM) that assumes an isotropic turbulence stress was used in this work. The RSM model is given as follows:
d t ( ρ u i u j ¯ ) + x k ( ρ u k u i u j ) = D i j + P i j + i j + ε i j + S
where the left two terms are the local time derivatives of stress and convective transport term, respectively. The stress diffusion is modeled as follows:
D i j = x k [ ρ u i u j u k + ( p u j ) ¯ δ i k + ( p u i ) ¯ δ j k μ ( x k u i u j ¯ ) ] ¯
The shear production is given by:
p i j = ρ [ u i u k ¯ u j x k + u j u k ¯ u i x k ]
The pressure strain term is modeled as:
i j = p ( u i x j + u j x i )
The dissipation term is assumed to be isotropic, modeled by:
ε i j = 2 μ u i x k u j x k ¯
and S is the source term.

2.4. Boundary Condition

The appropriate definition of boundary conditions in a turbulent flow plays a vital role in numerical simulations. The physical condition of problem and mathematical relations are essential parameters in selecting the proper boundary condition. The boundary conditions used in simulations are presented in Table 2.
The Eulerian–Lagrangian model was used to simulate the solid phase in the conveying process. This model is described in detail in Section 3.4. Solid-phase properties applied in the DPM model are presented in Table 3.
Additionally, the numerical schemes for simulations are presented in Table 4.

2.5. Discrete Phase Model

The discrete phase model (DPM) was used to model the particle-fluid interactions using the Eulerian–Lagrangian approach. The dispersed phase is solved by tracking particles through the calculated flow field, and the fluid phase is considered a continuum by solving the time-averaged Navier–Stokes equations. It should be noted that the dispersed phase fluid phases could exchange mass, momentum, and energy. The primary assumption of DPM is that the dispersed phase engrosses less than 10–12% of the volume fraction [22]. The particle motion equation in the Eulerian–Lagrangian approach is defined as below:
d u p i d t   =   18 μ d p 2 ρ p C d R e p 24 ( u i u p i ) + g i ( ρ p ρ ) ρ p
d x p i d t   =   u p i
R e p   =   ρ p d p | u u p | μ
where µ and ρ are dynamic viscosity (Pa s) and gas density (kg m−3), respectively. Additionally, 18 μ d p 2 ρ p C d R e p 24 ( u i u p i ) is the drag force per unit of particle mass. dp and ρp are the particle diameter (m) and density, respectively (kg m−3), CD is the drag coefficient, upi and ui are the particle velocity (m s−1) and gas velocity (m s−1), respectively, in i direction, Rep is the relative Reynolds number and gi is the gravitational acceleration in i direction [23]. For non-spherical particles Haider and Levenspiel, (1989) developed the following correlation [24]:
C D = 24 Re ( 1 + b 1 Re b 2 ) + b 3 Re b 3 + Re
b 1 = exp ( 2.3288 6.4581 ϕ + 2.4486 ϕ 2 )
b 2 = 0.0964 + 0.5565 ϕ
b 3 = exp ( 4.905 13.8944 ϕ + 18.4222 ϕ 2 10.2599 ϕ 3 )
b 4 = exp ( 1.4681 + 12.2584 ϕ 20.7322 ϕ 2 + 15.8855 ϕ 3 )
where ϕ is the shape factor.

2.6. Cyclone Meshing and Grid Independence Test

The 3D computational model using in the simulation is shown in Figure 3. A grid refinement was employed in the cyclone vortex core to resolve the reverse vortex flow feature correctly. Four different mesh densities (i.e., coarse = 425,700, medium = 612,600, fine = 812,410, and very fine = 1,146,100) were used for the grid independence test. The results showed that the discrepancy among pressure drop between the gas inlet and vortex finder outlet was less than 2.5% when the grid cells above 612,600 were used. Therefore, the mesh containing 612,600 cells was used in the simulations.

3. Results and Discussion

3.1. Validation

CFD simulations must be validated to guarantee the results. Then, the pressure drop, and inlet velocity were presented in both experimental and numerical results. Figure 4 illustrated the experimental and numerical pressure drop at the barrel section of the cyclone separator. There is good agreement between numerical and experimental data. In both, with increasing inlet velocity, the pressure drops increased. It was concluded that the created simulation was reliable to extract other desired parameters of cyclone performance. Additionally, validation between numerical and experimental data for the tangential velocity in vin = 16 m s−1 is presented in Figure 5.

3.2. Comparison of Various Inlet Velocities and Mass Flow Rates

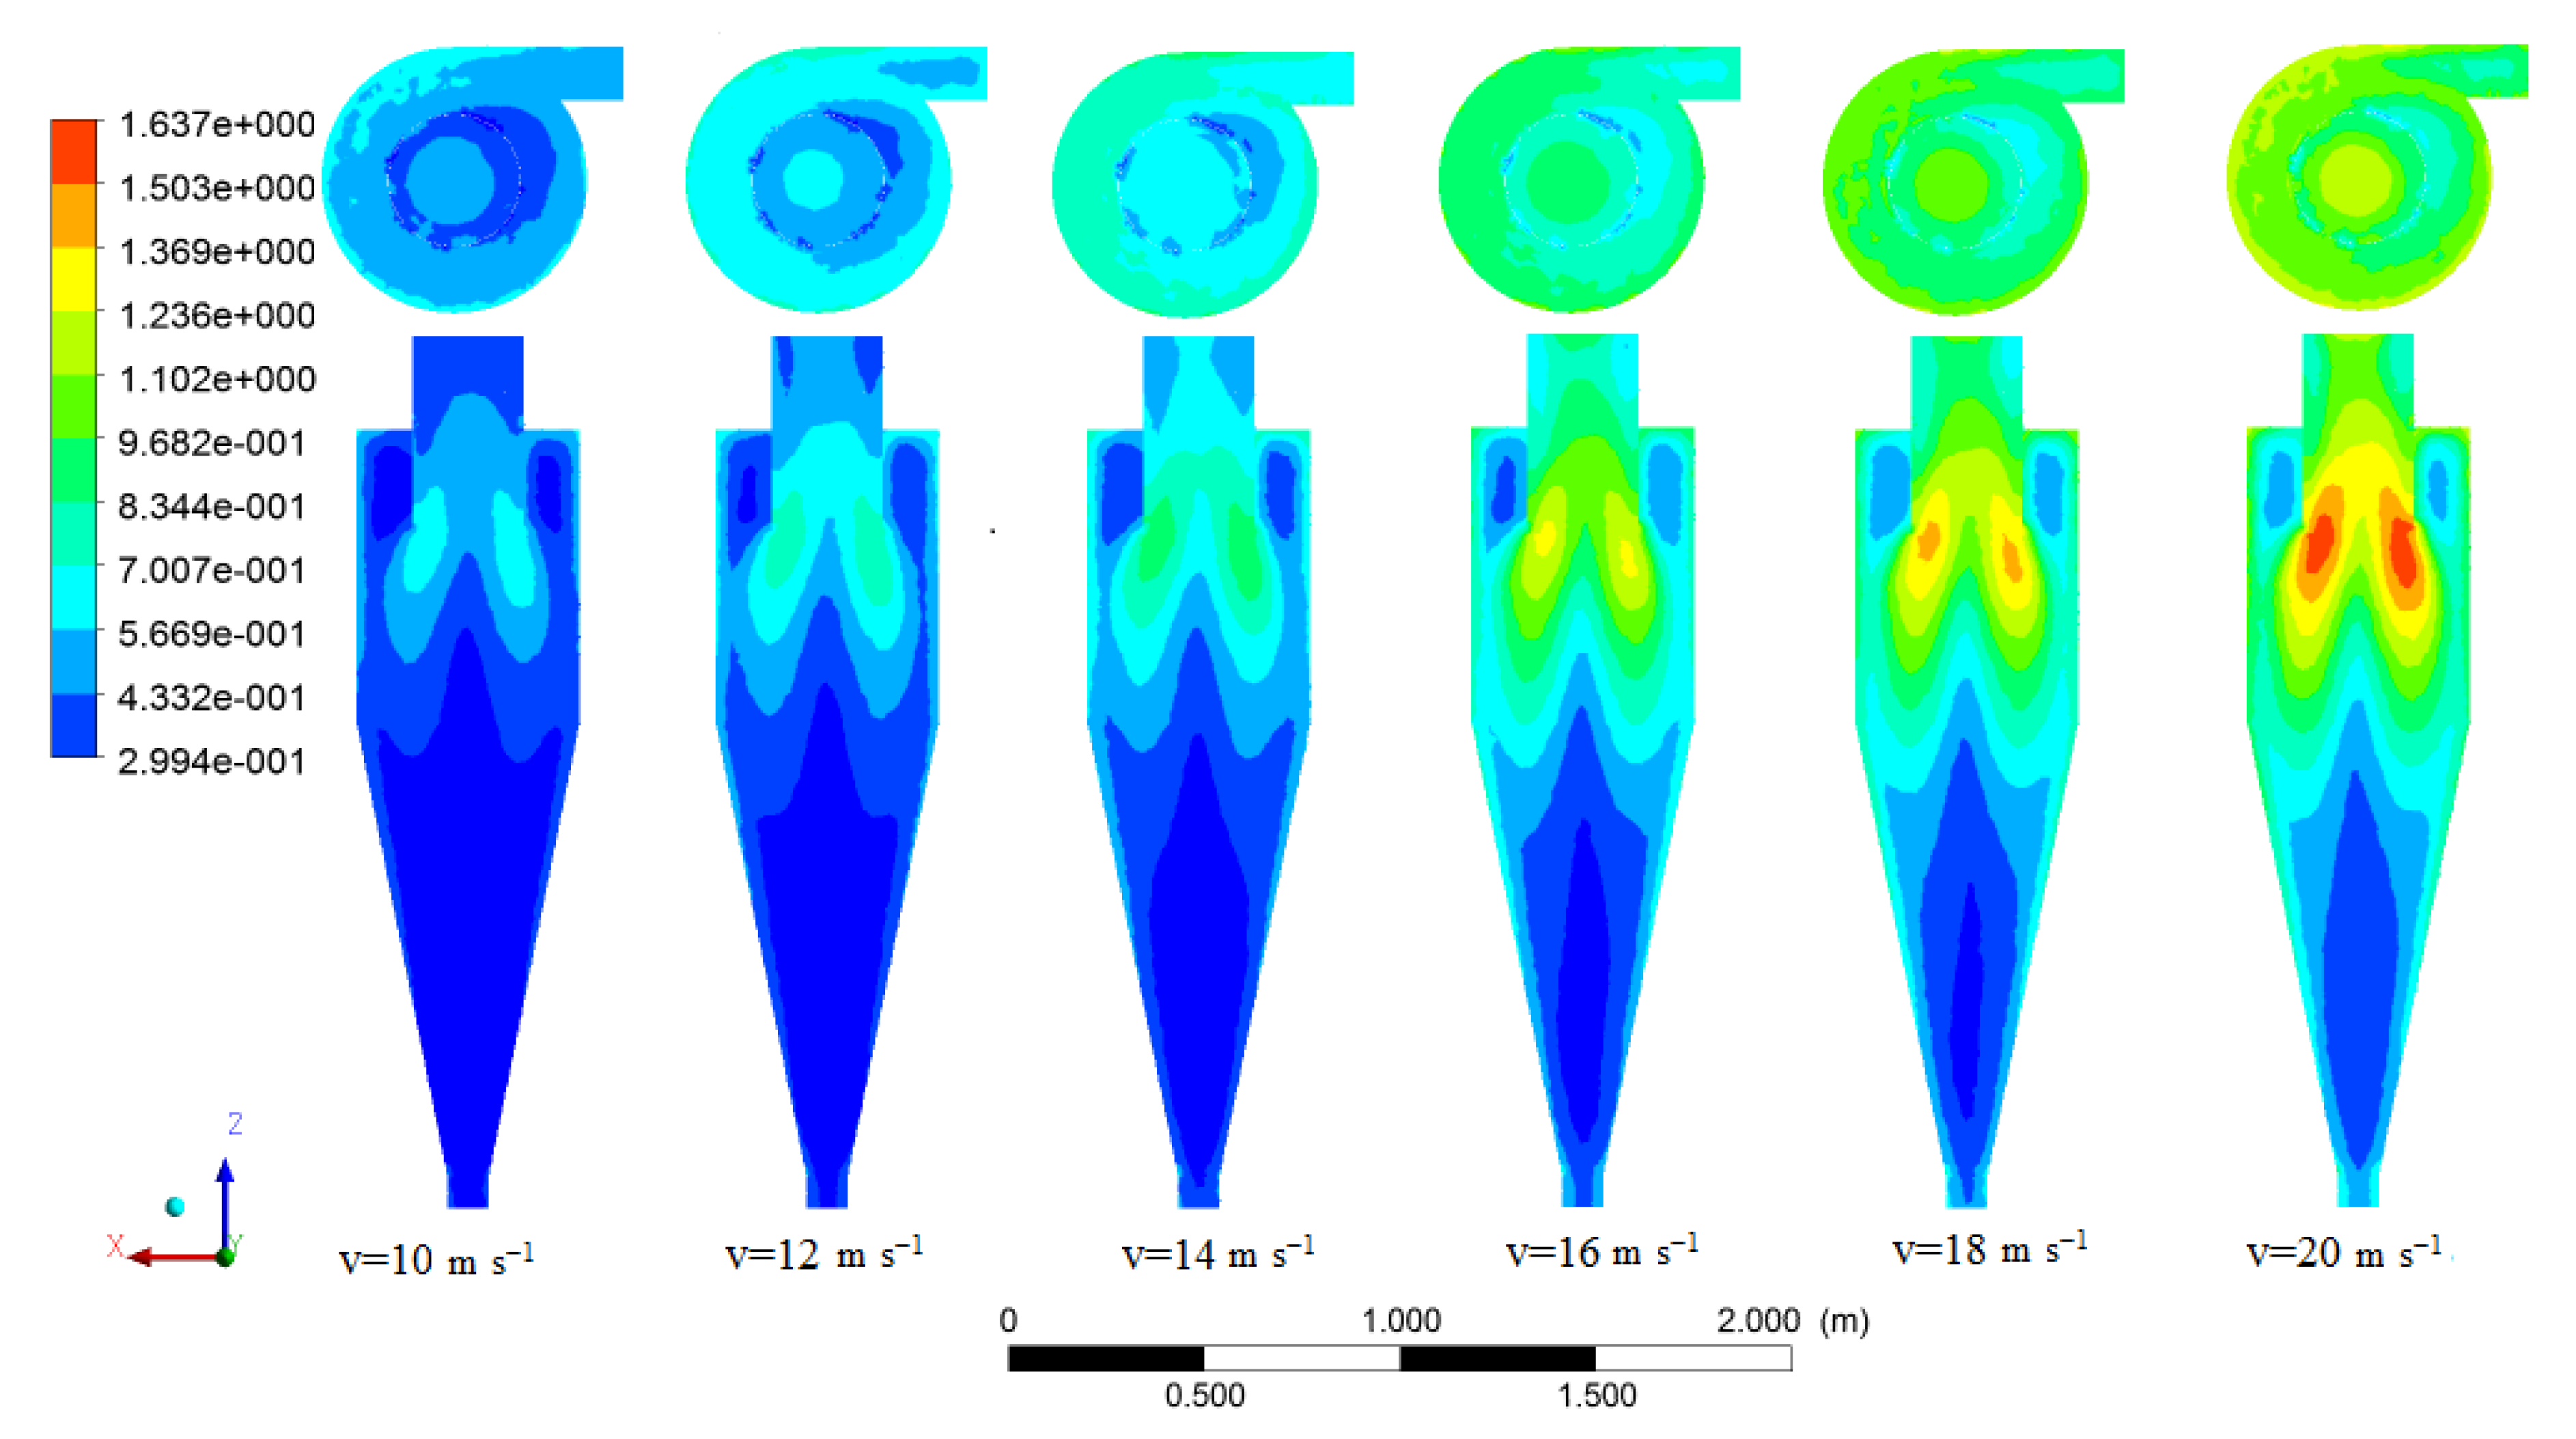
In six inlet velocities including 10 m s−1, 12 m s−1, 14 m s−1, 16 m s−1, 18 m s−1, 20 m s−1, and mass flow rate of 0.01 kg s−1 the axial velocity contours are shown in Figure 6. To better compare the inlet velocity efficacy on various parameters, the rainbow value index is fixed in various inlet velocities.
Additionally, comparisons of tangential velocity, turbulent intensity and static pressure were carried out in three mass flow rates, including 0.01, 0.05, and 0.1 kg s−1. In these simulations, the inlet velocity was kept constant at an optimum value of 16 m s−1 with acceptable values of pressure drop and separation efficiency.

3.3. Axial Velocity

In conveying particles along with the cyclone, the axial velocity performs an important role. The volumetric flow rate impacts the axial velocity such that the increasing volumetric flow rate increases the axial velocity, even though the tangential velocity pattern does not change. Upstream and downstream are two main streams of gas-particle flow. The concentration of axial velocity in the vortex finer could lead to a better performance of the cyclone by improving the separation efficiency. The axial velocity variations can be discussed in four sections, as shown in Figure 6. The four sections are (1): vortex finder, (2): bottom section of vortex finder until the middle of the cone, (3): near the wall, and (4): exit section of particles. The maximum value for axial velocity obtained for the vortex finder bottom section and the minimum amount appeared in the exit section of the particles.
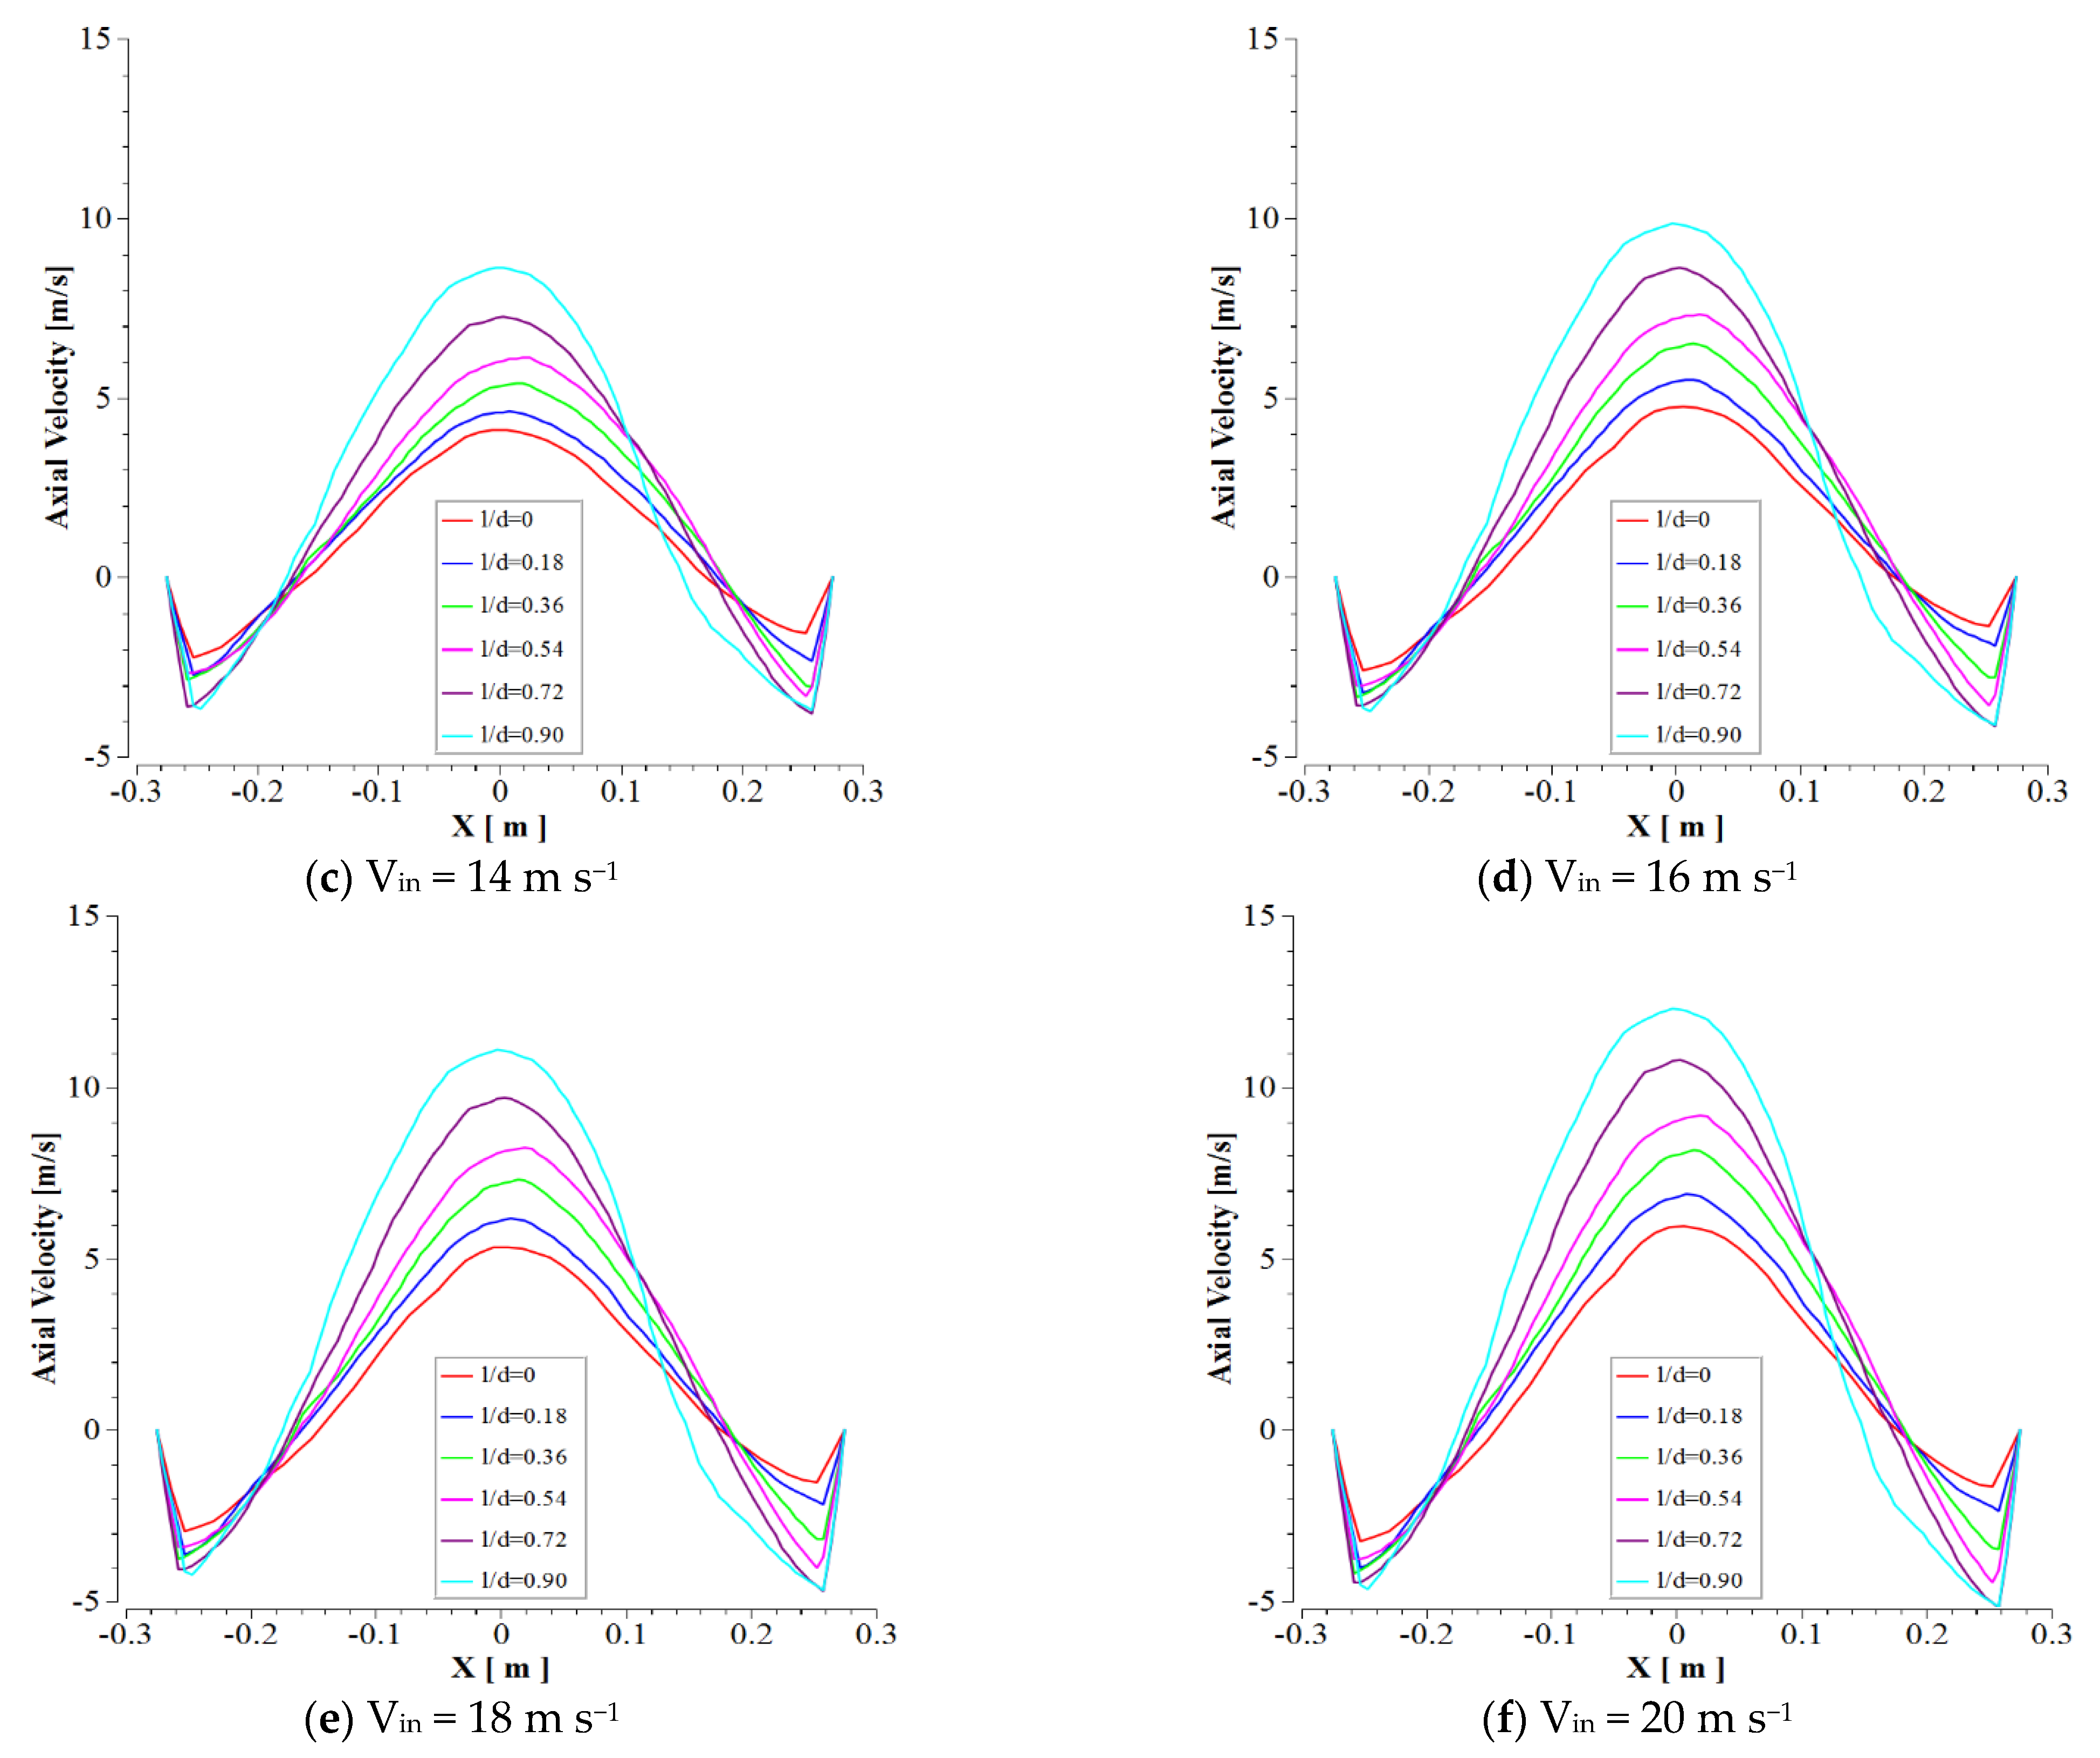
An essential issue in the cyclone body is the variation of axial velocity in the x-direction. As shown in Figure 7, the variations of axial velocity in several cyclone cylinder heights were presented. The plots indicate a decreasing–increasing treatment concerning axial velocity in various ratios of heights, so that from the wall to a small distance, the axial velocity was decreased and then dramatically increased to the maximum value in the center section of the cyclone. On the positive side of the axial axis, the treatment reverses and significantly decreases, and finally increases near the cyclone wall. With increment l/d ratio value and inlet velocity, maximum values of axial velocity increased.
The axial velocity plots in six various heights of cyclones are illustrated in Figure 7. As shown in Figure 7, the variation of an axial velocity in several cyclone cylinder heights (l/d = 0, l/d = 0.18, l/d = 0.36, l/d = 0.54, l/d = 0.72, l/d = 0.9) are presented. The six portions were achieved based on (0, 0.1, 0.2, 0.3, 0.4 and 0.5 m, divided by cyclone cylinder heights.
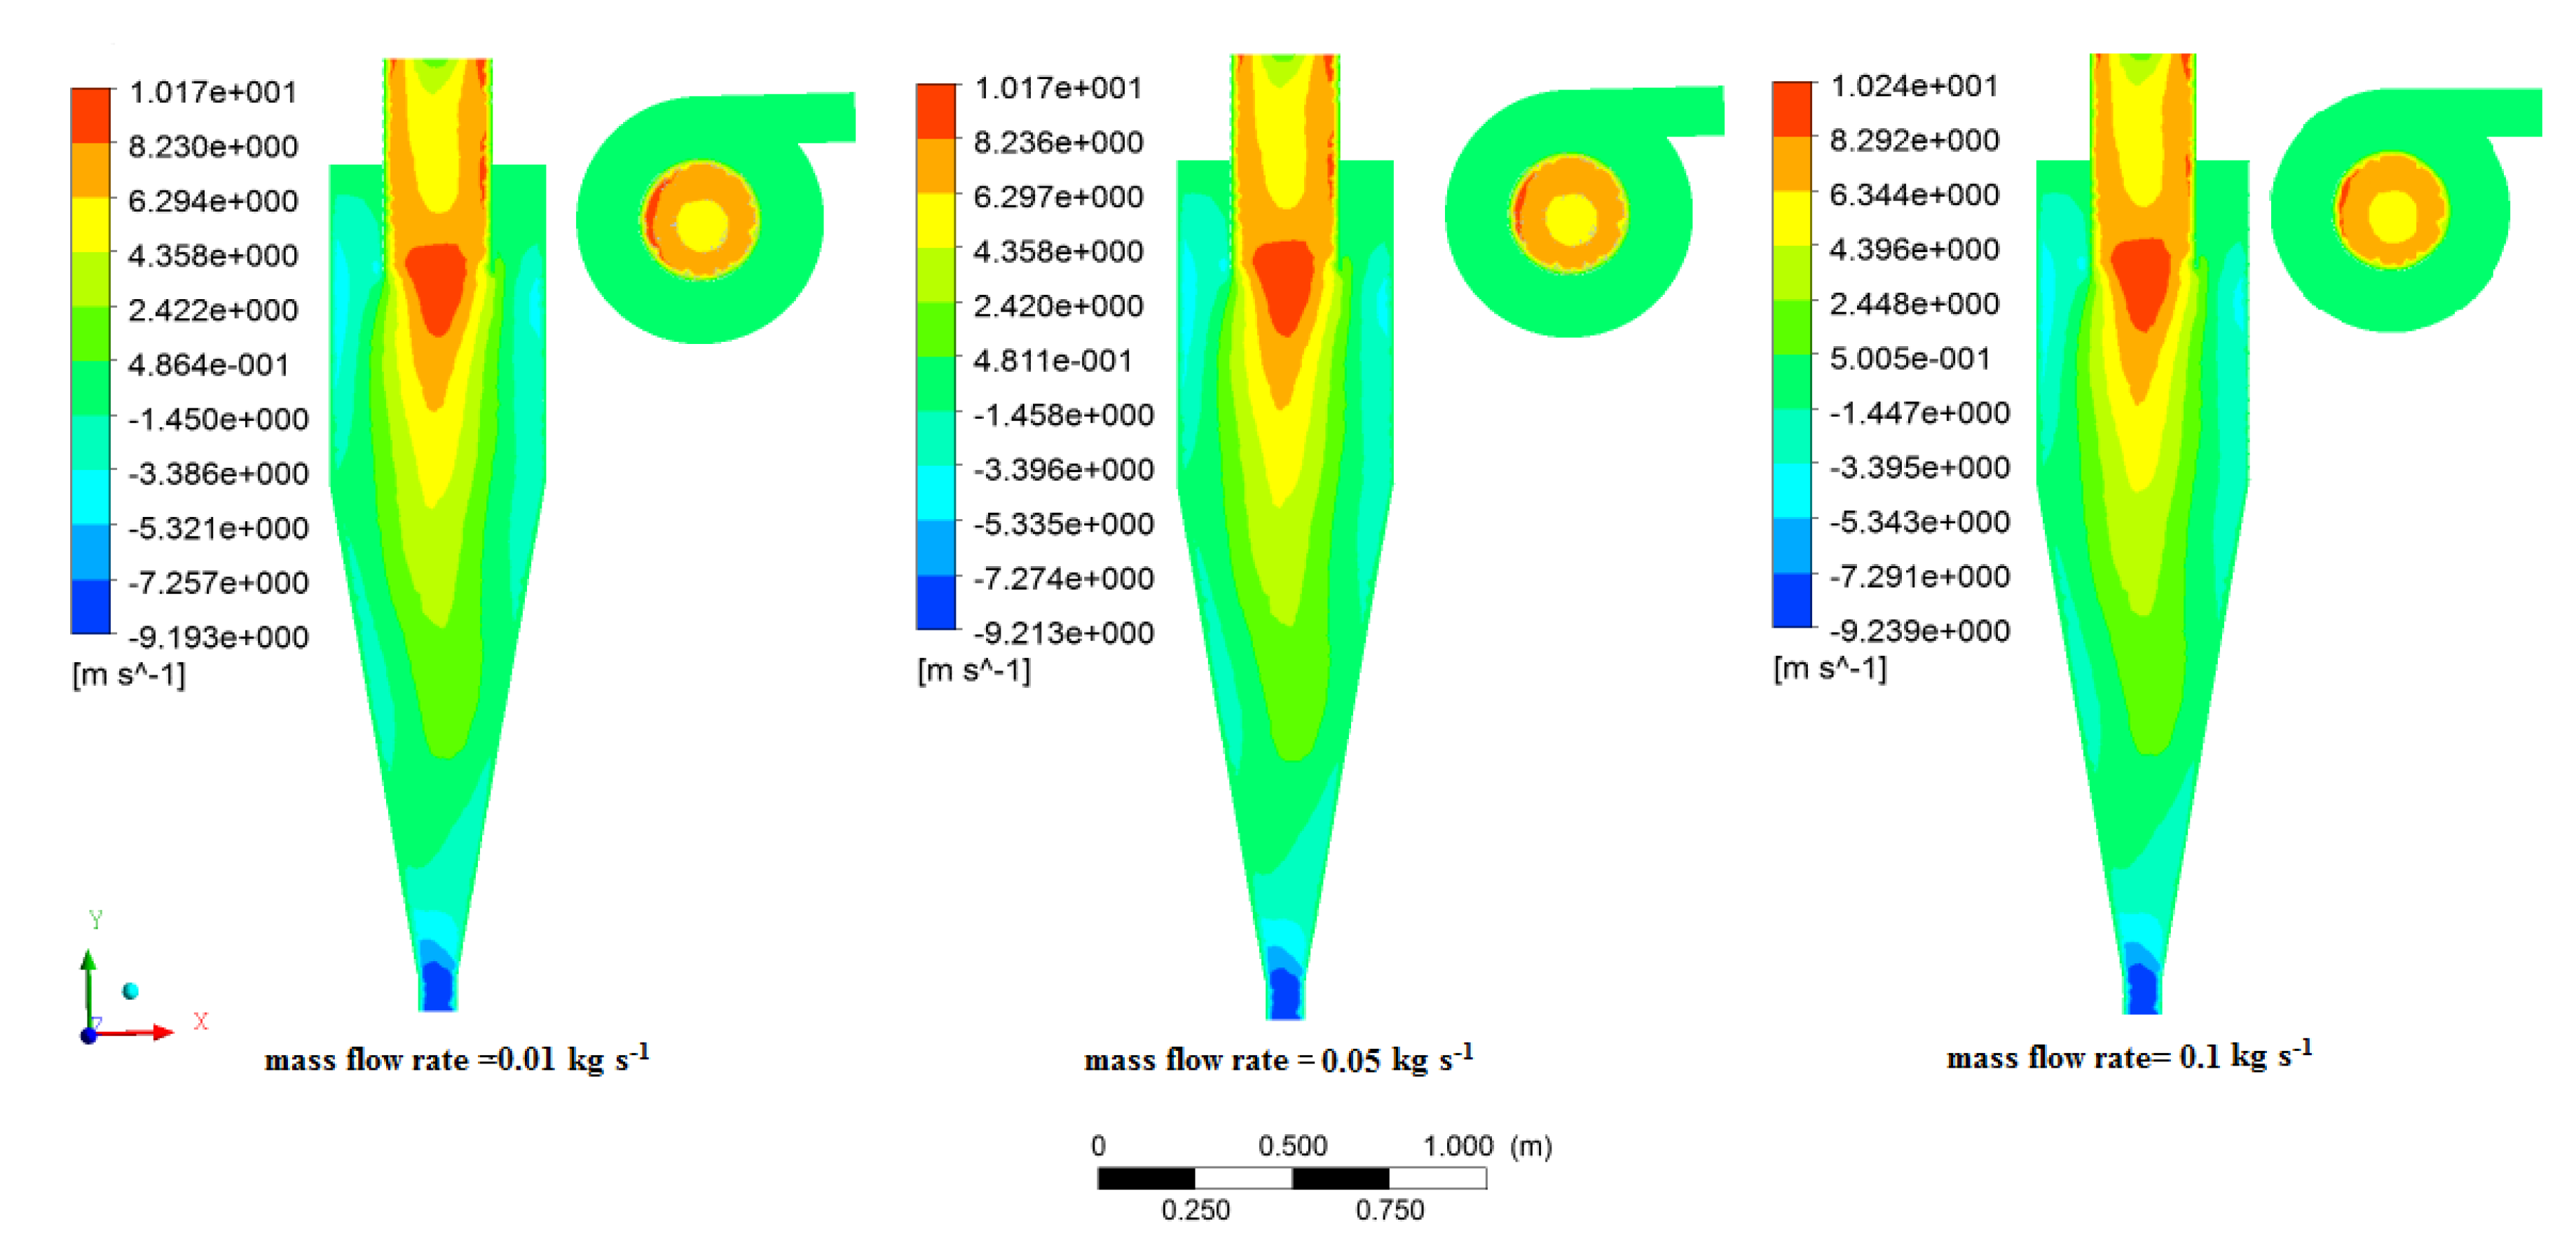
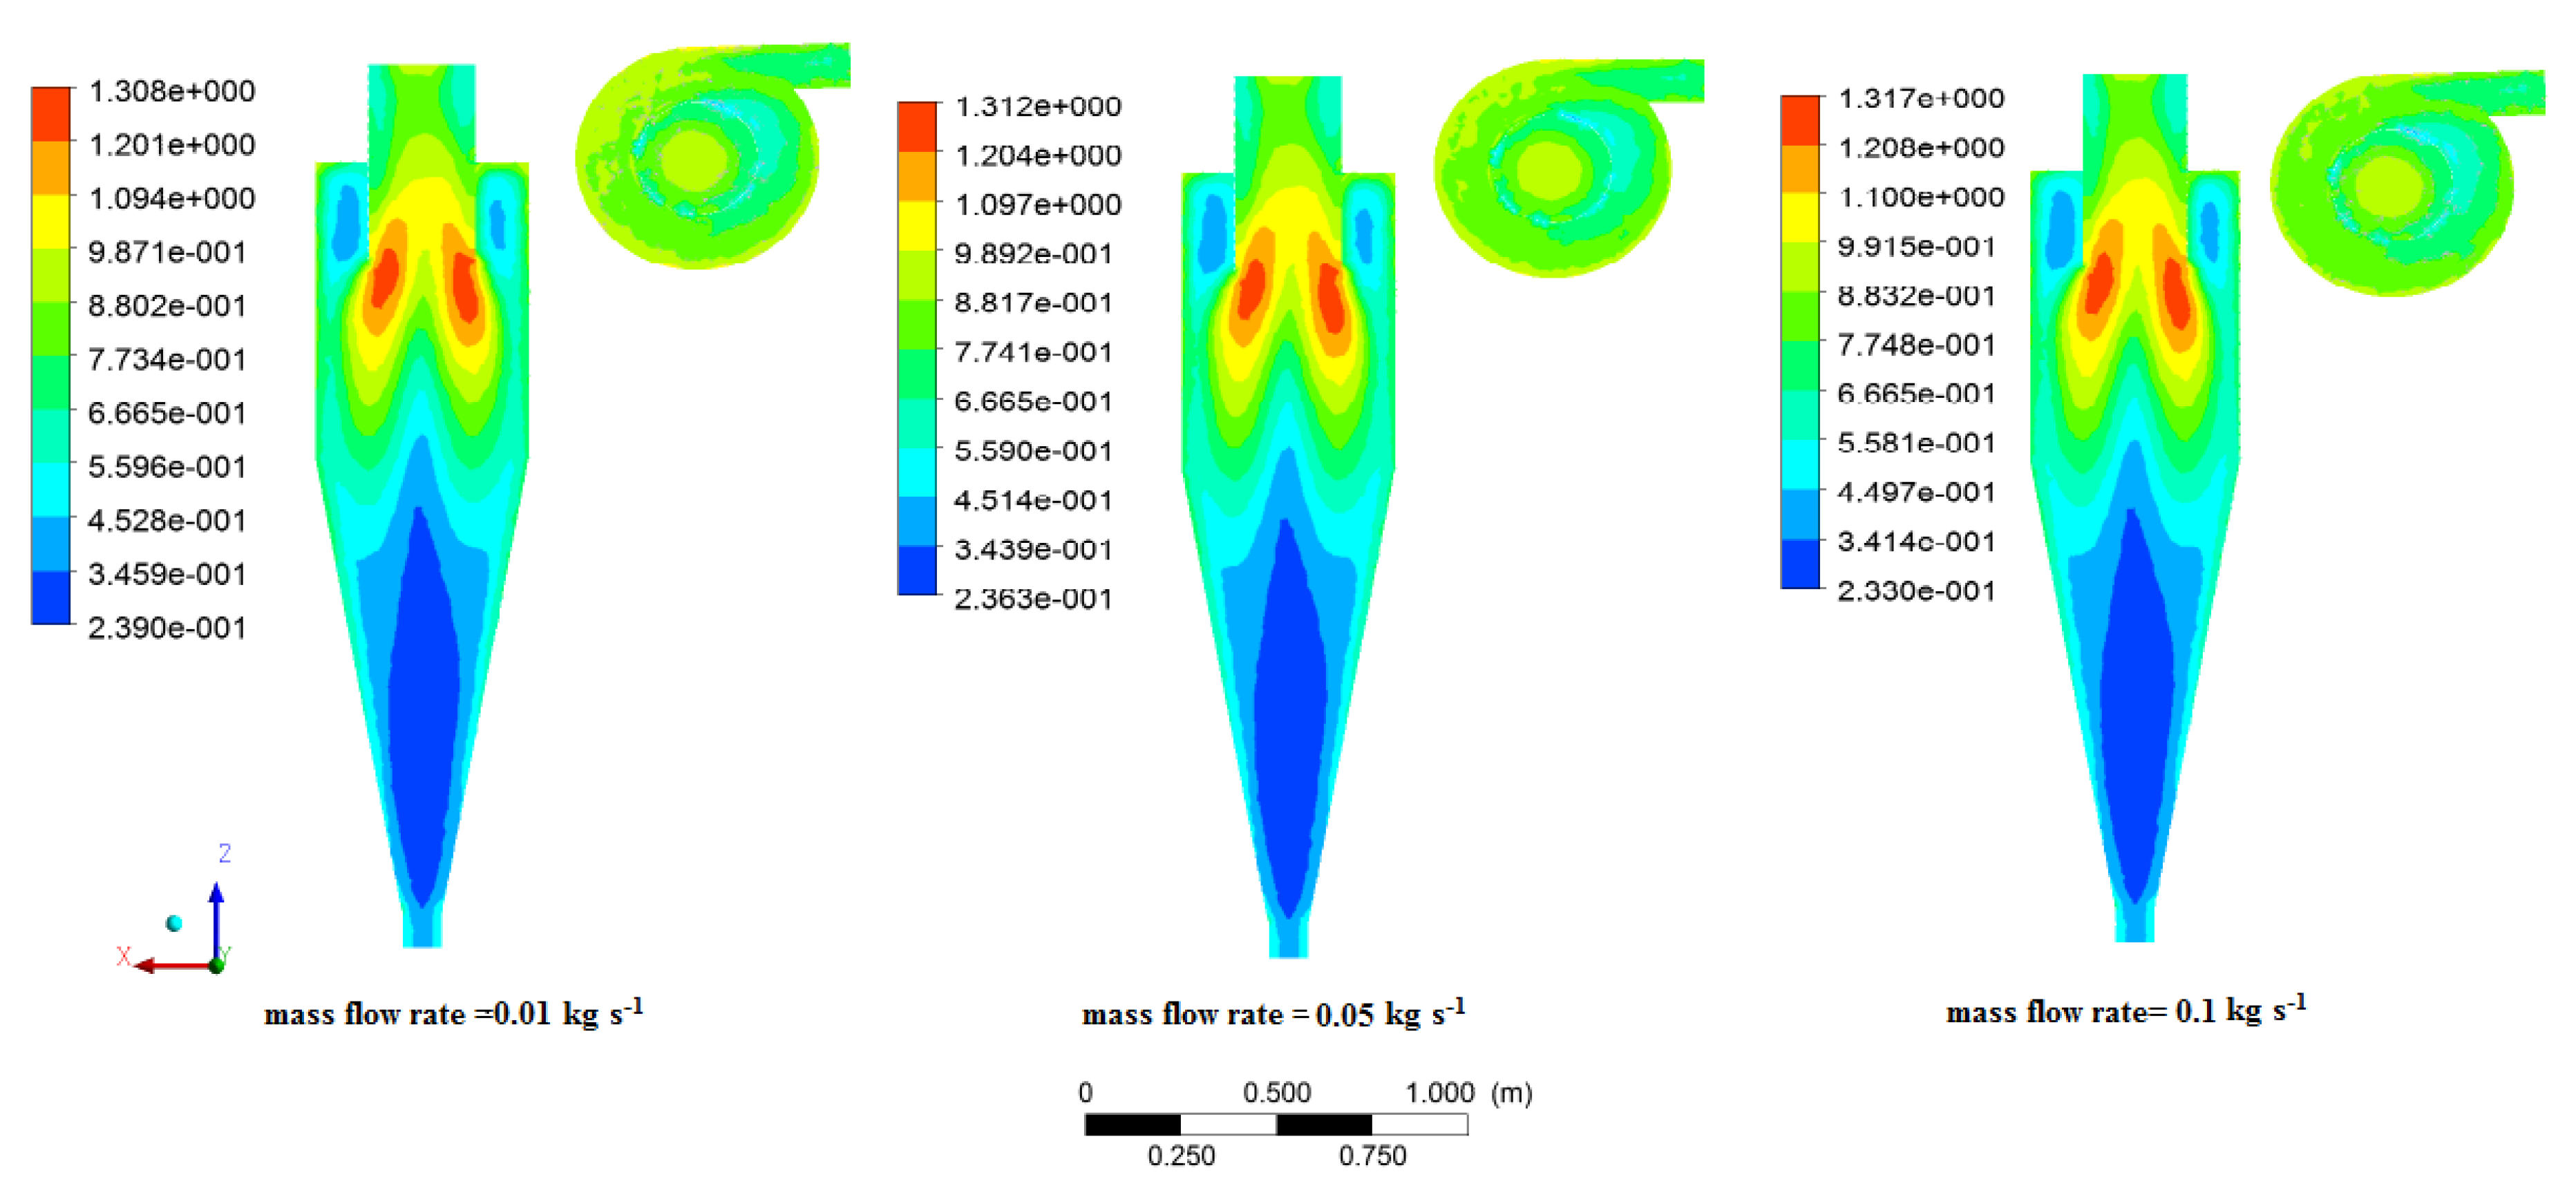
The use of various mass flow rates in the simulation has an insignificant effect on axial velocity contours. Referring to Figure 8, the axial velocity distribution, as well as its value in different mass flow rates, were the same for 0.01 and 0.5 kg s−1 mass flow rates. Then, the comparison of results between 0.5 and 0.1 indicated that a slight change occurred in this range. The main reason for the low impact of mass flow rates was a constant value of inlet velocity as the axial velocity was mostly affected by the volumetric flow rate (air flow rate).

3.4. Tangential Velocity

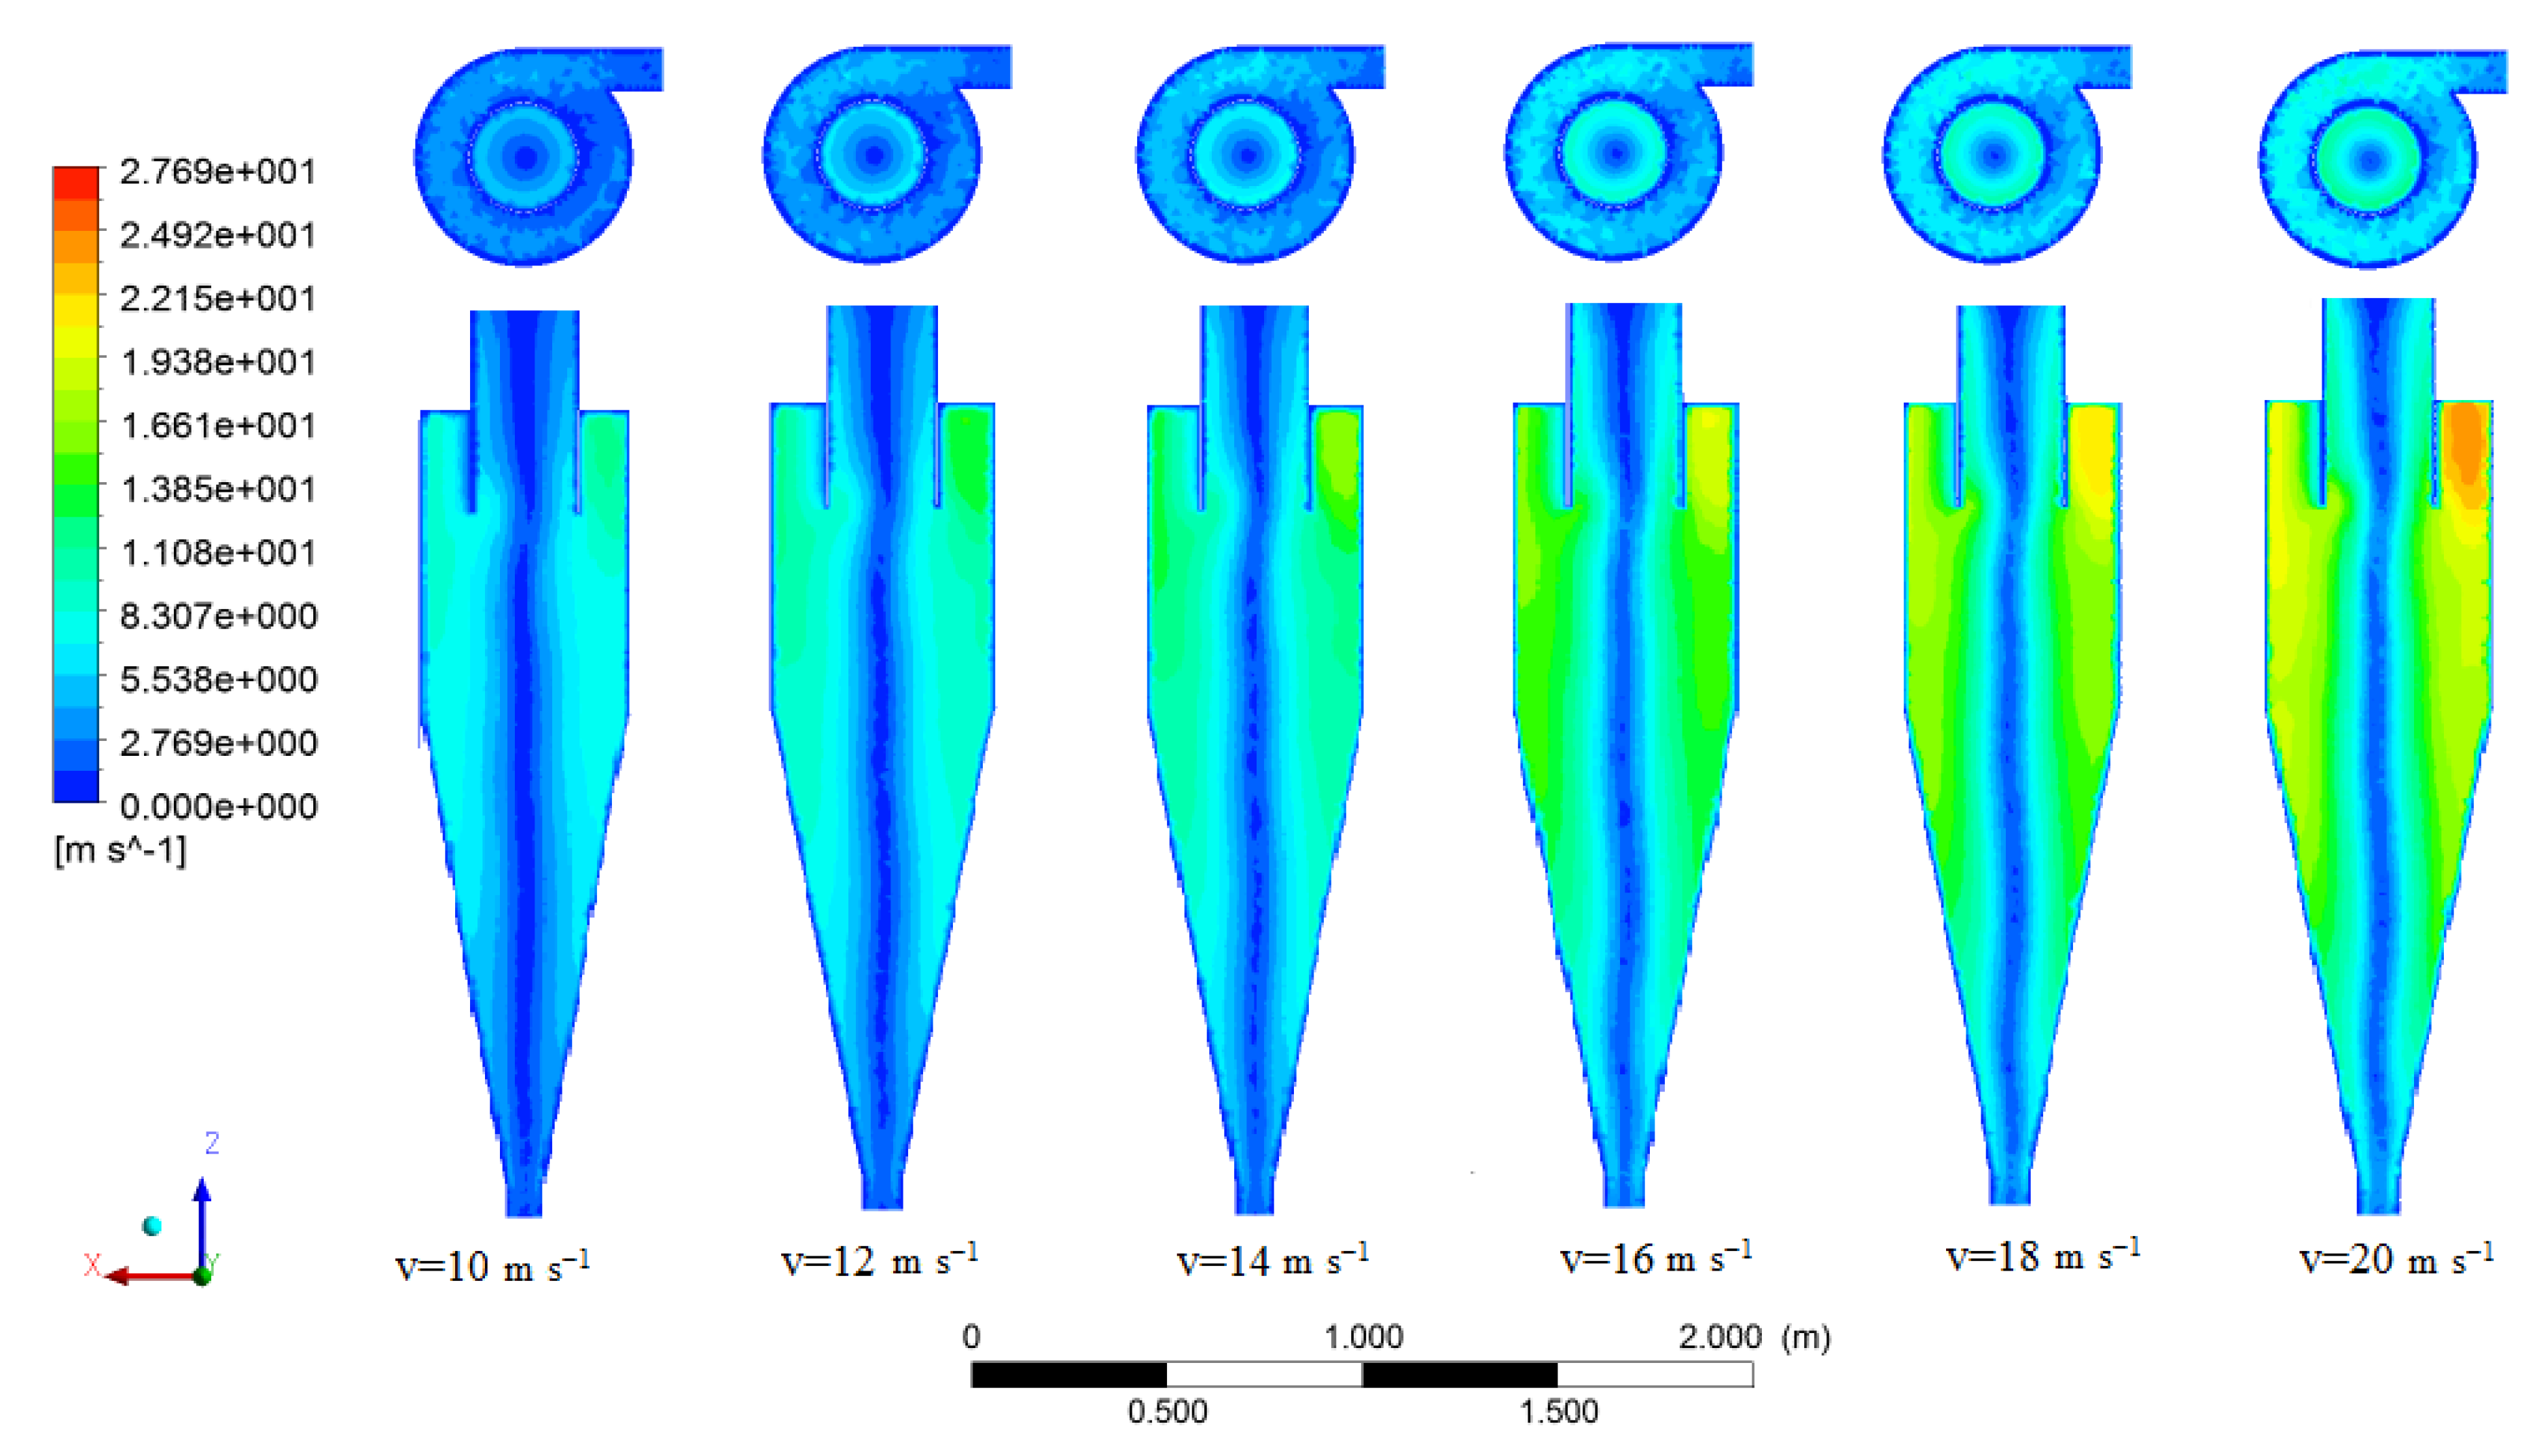
The Tangential velocity contours for various inlet velocities are illustrated in Figure 9. In the inlet section and the tangential direction of the cyclone, the tangential velocity is the maximum, whereas along the vertical axis connected to the top and bottom of it, the tangential velocity is the minimum. The mediocrity of the two mentioned sections is the third section with an intermediate value of tangential velocity.
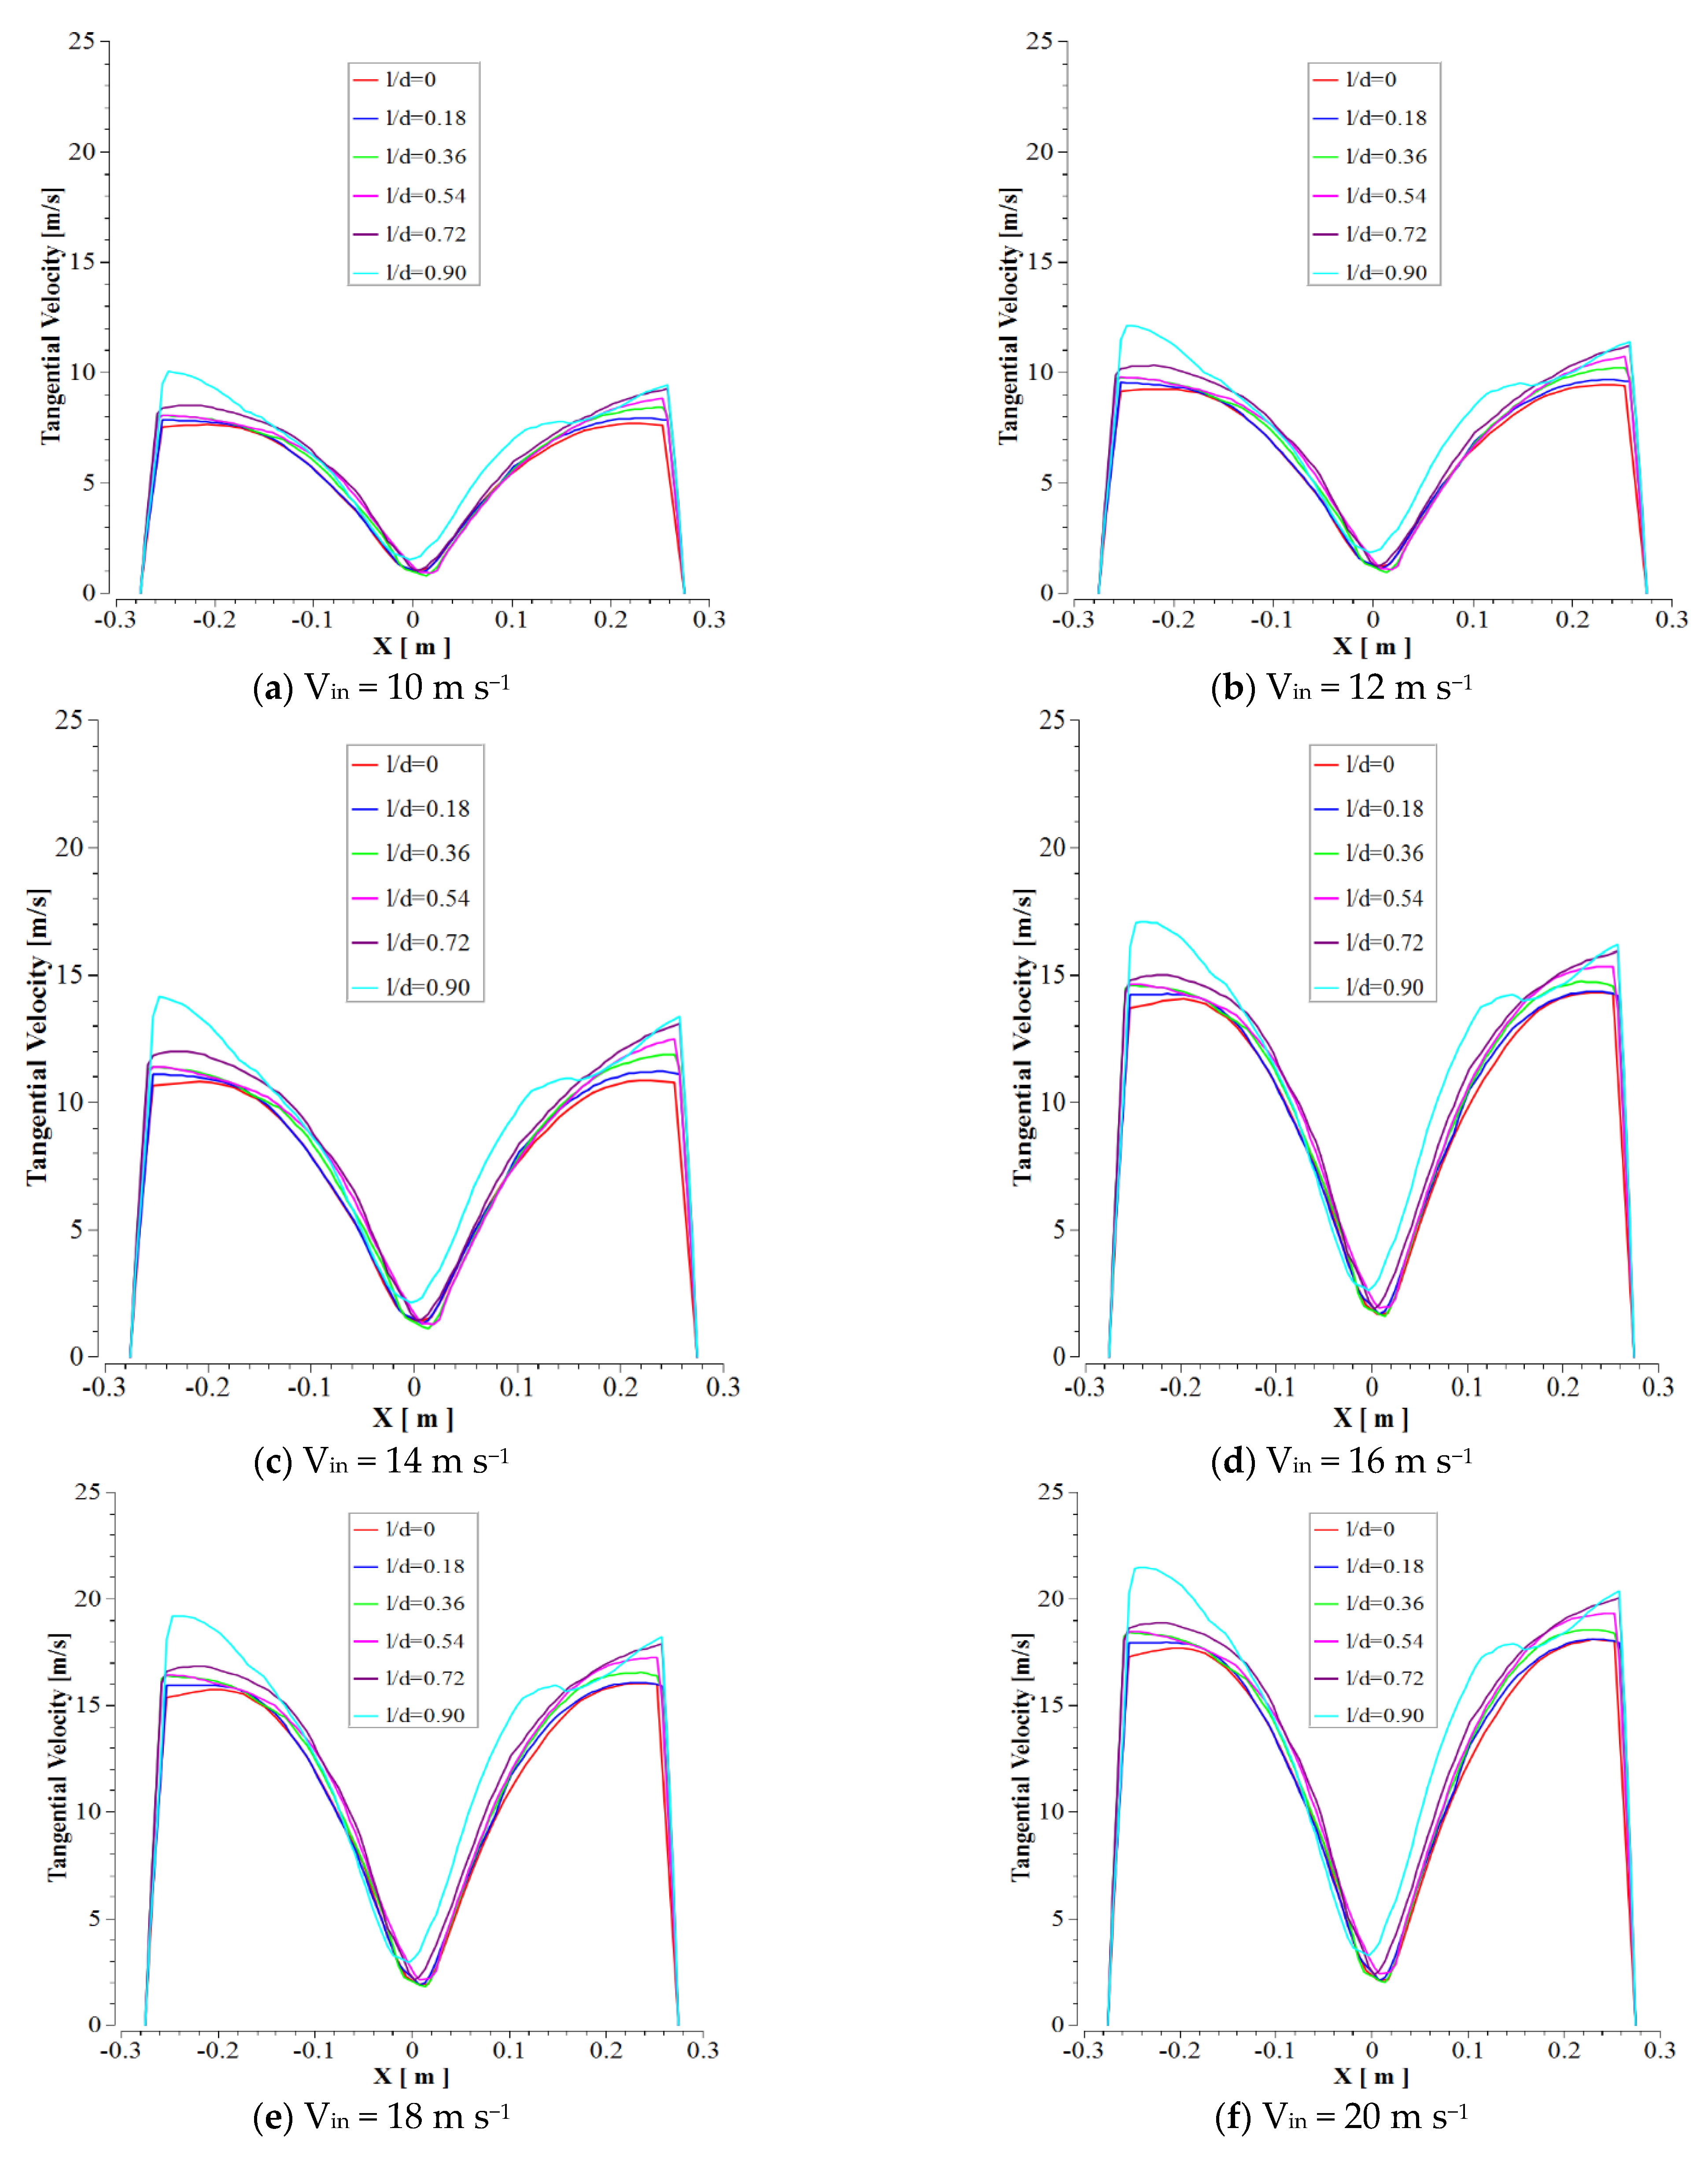
Additionally, the change in the tangential velocity profile pattern is insignificant in various inlet velocities. In Figure 10, the variations of the three mentioned sections are illustrated in various inlet velocities and l/d ratios. Xiang and Lee indicated that decrement in tangential velocity is responsible for the lower separation efficiency, whereas the higher tangential velocity will not necessarily lead to higher separation efficiency [25].
In the different situations of axial velocity contours in various mass flow rates, applying the different mass flow rates has a direct effect on tangential velocity. Referring to Figure 11, the tangential velocity reduced to 21.7 m s−1 for the mass flow rate of 0.5 kg s−1 (decrement of 0.36 m.s−1), whereas this decrement was 0.4 at mass flow rate of 0.1 k/s and the axial velocity reached 21.3 m s−1. Increasing the mass flow rate regarding constant inlet velocity (16 m s−1) resulted in the decrement of the tangential component of the velocity field. These patterns of contours and plots for static pressure, axial and tangential velocity have been presented in Elsayed and Lacor’s work about optimization of the cyclone [7,26], which were similar results to this research.

3.5. Turbulent Intensity

The turbulent intensity has a direct effect on the separation efficiency of cyclone separators. The study of this parameter is essential, especially in the vortex finder. The increment of the inlet velocity has a direct impact on the increment of the turbulent intensity. The vortex finder has a significant role in the separation process in the cyclone. Increasing the turbulent intensity in the vortex finder was an important factor in decreasing the separation efficiency at high inlet velocities (18 and 20 m s−1) (Figure 12).
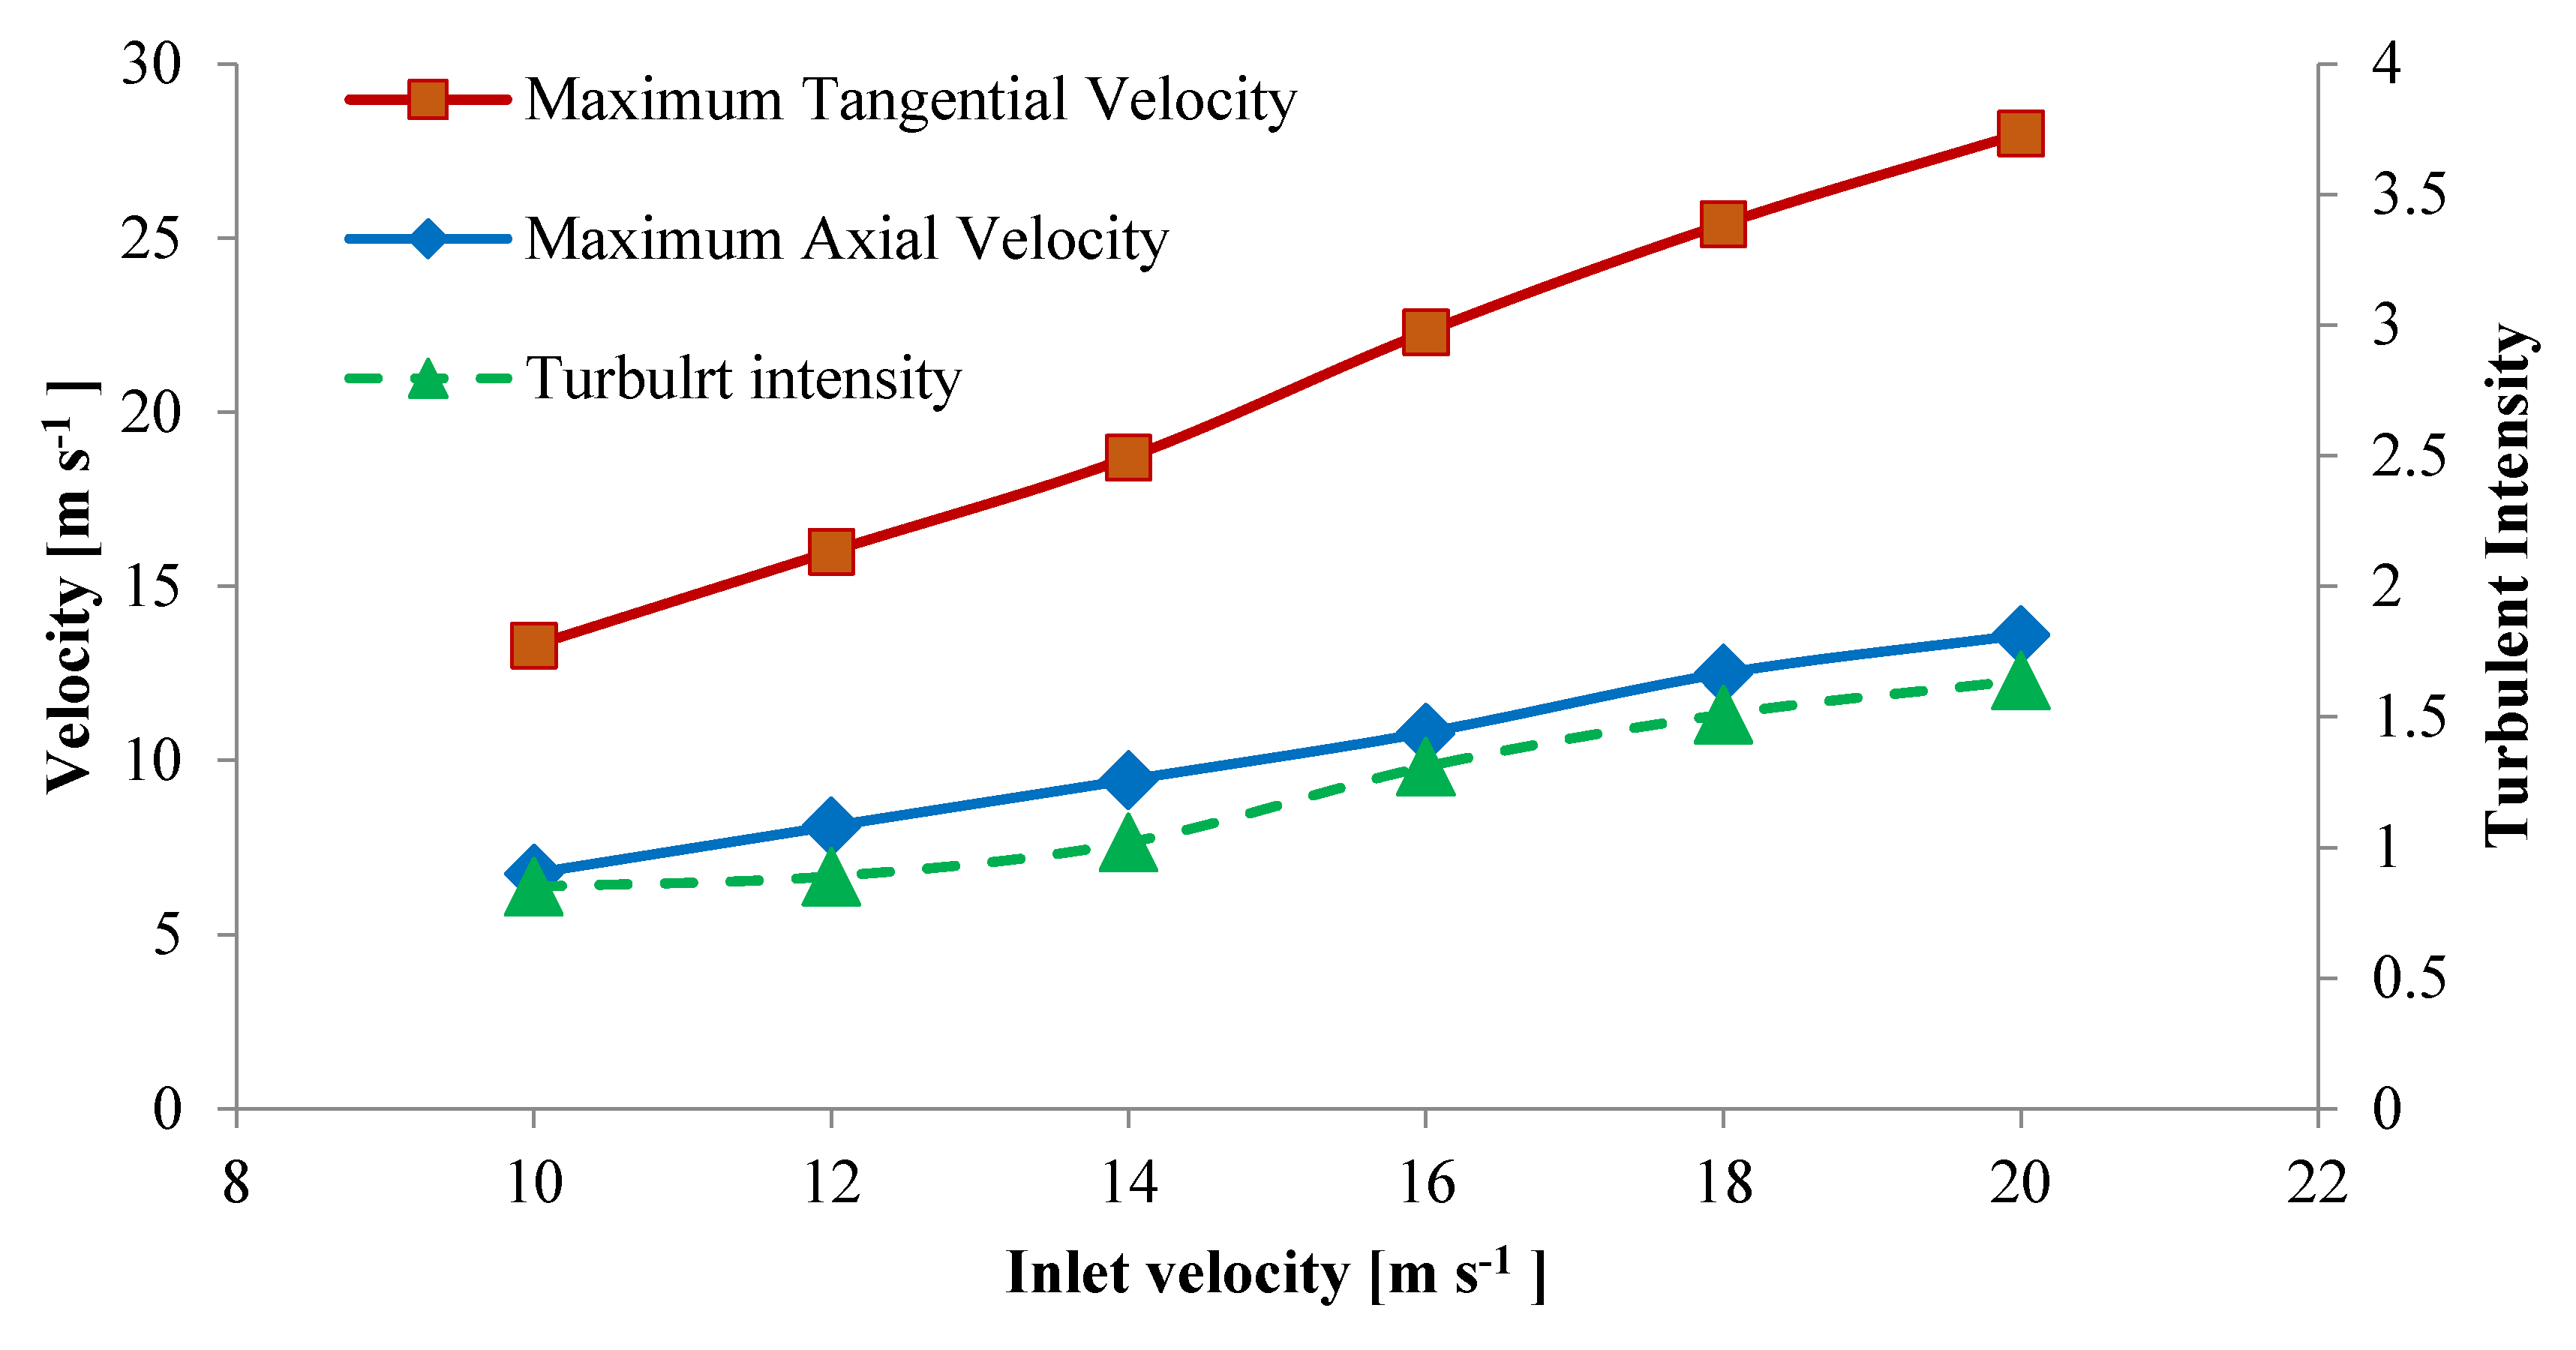
A comparison trend of variations of maximum tangential velocity, axial velocity, and turbulent intensity of mentioned parameters in various inlet velocities is presented in Figure 13. The increase of tangential velocity is sharper with inlet velocity increase, while both axial velocity and turbulent intensity increased moderately with increasing inlet velocity.
The increase in the mass flow rate has an insignificant effect on the distribution of turbulent intensity. This trend is illustrated in Figure 14.

3.6. Static Pressure

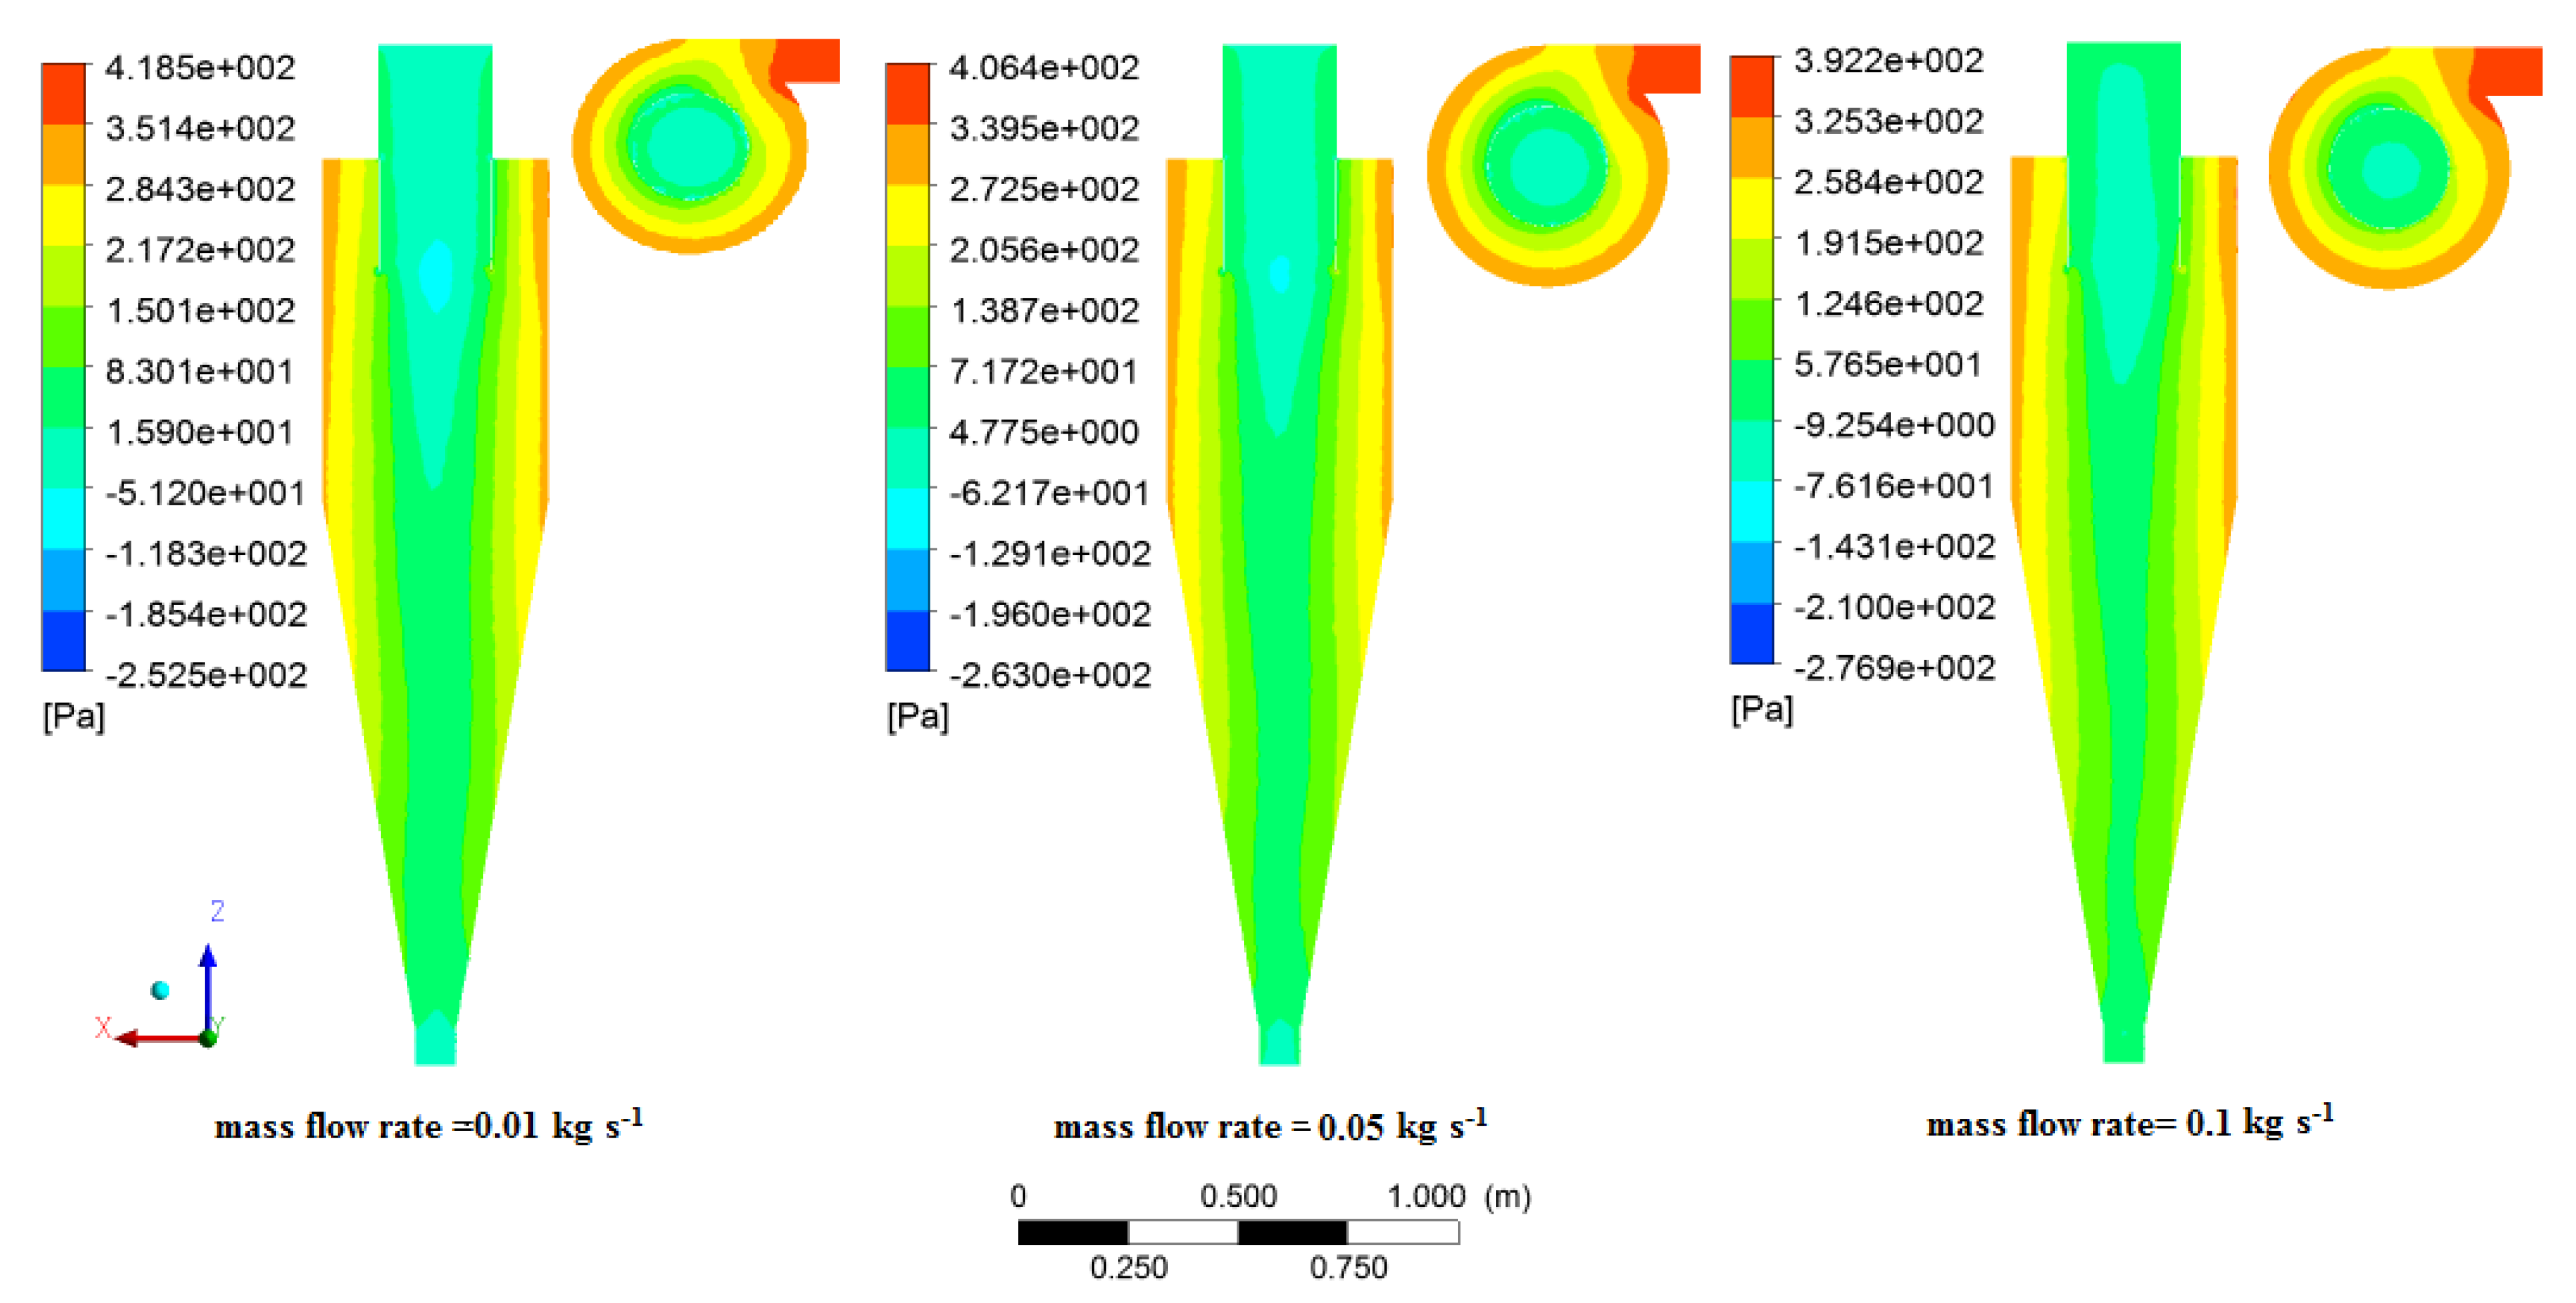
The static pressure contours can be discussed in three main sections of cyclones. High static pressure values were obtained in the top section of the cyclone wall and cyclone inlet due to the high friction in this area. Low pressure drop values were attained in the axis of the vortex finder as the reverse flow was created in this section. Intermediate values of pressure drop occurred in the area between the two mentioned sections due to the attenuation of the intensity of the mentioned parameters. As a significant point, the minimum pressure occurred in the middle part of the vortex finder (Figure 15). This trend (increase in the pressure drop with increasing inlet velocity) was reported in several studies [3,27,28]
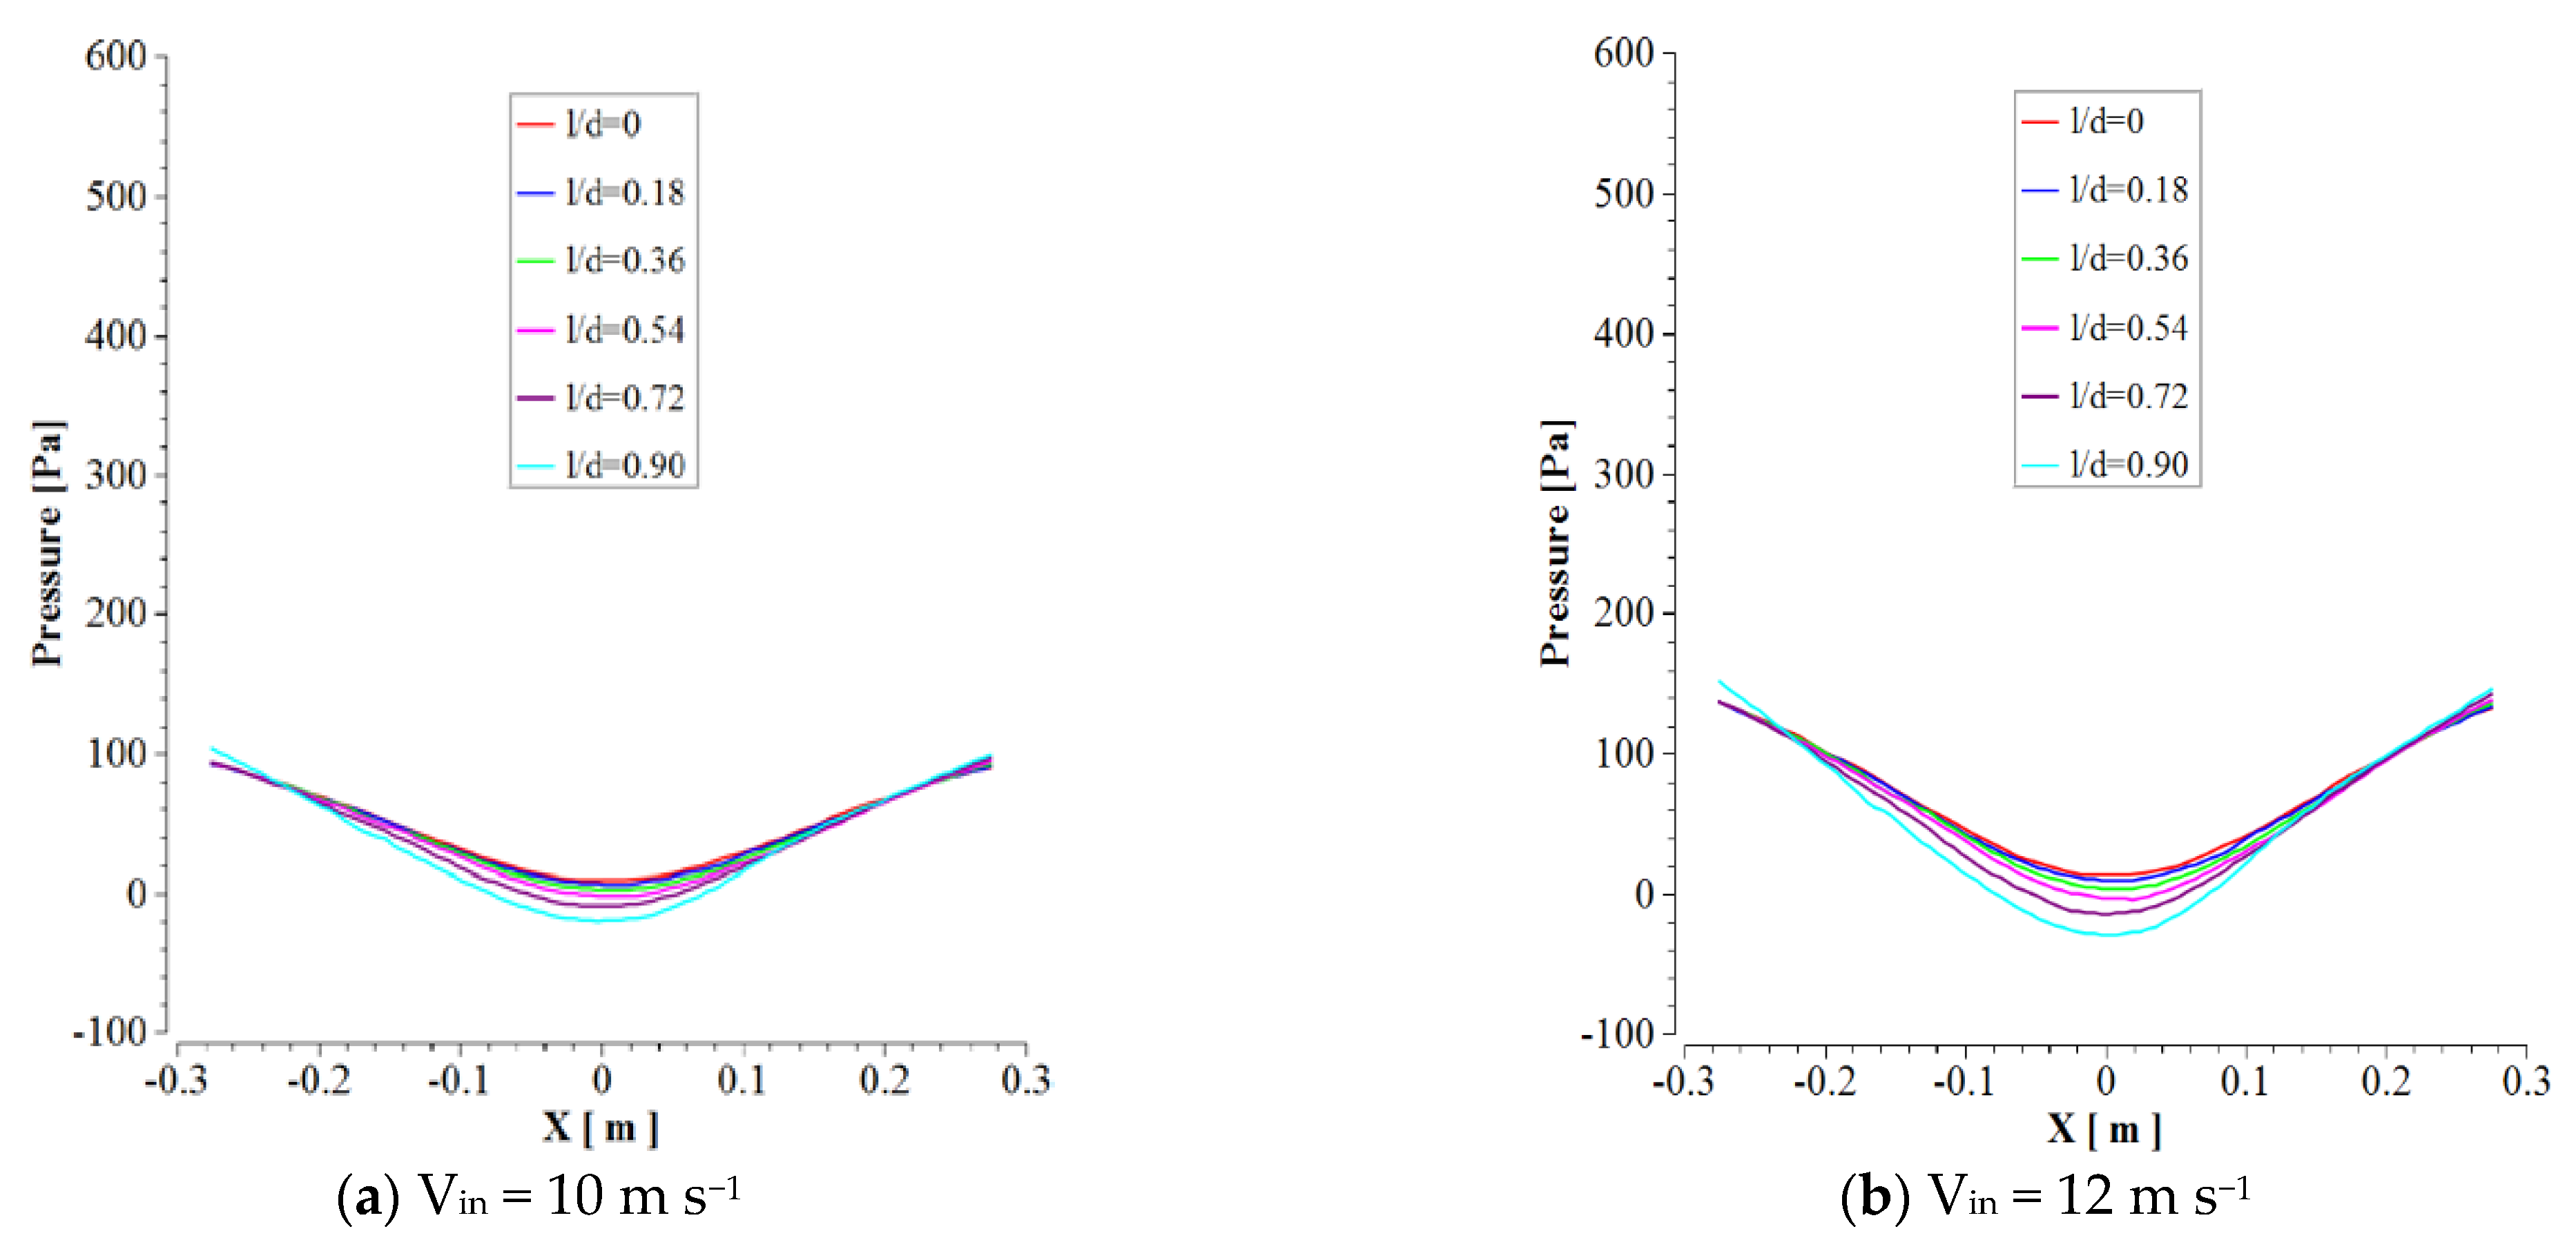
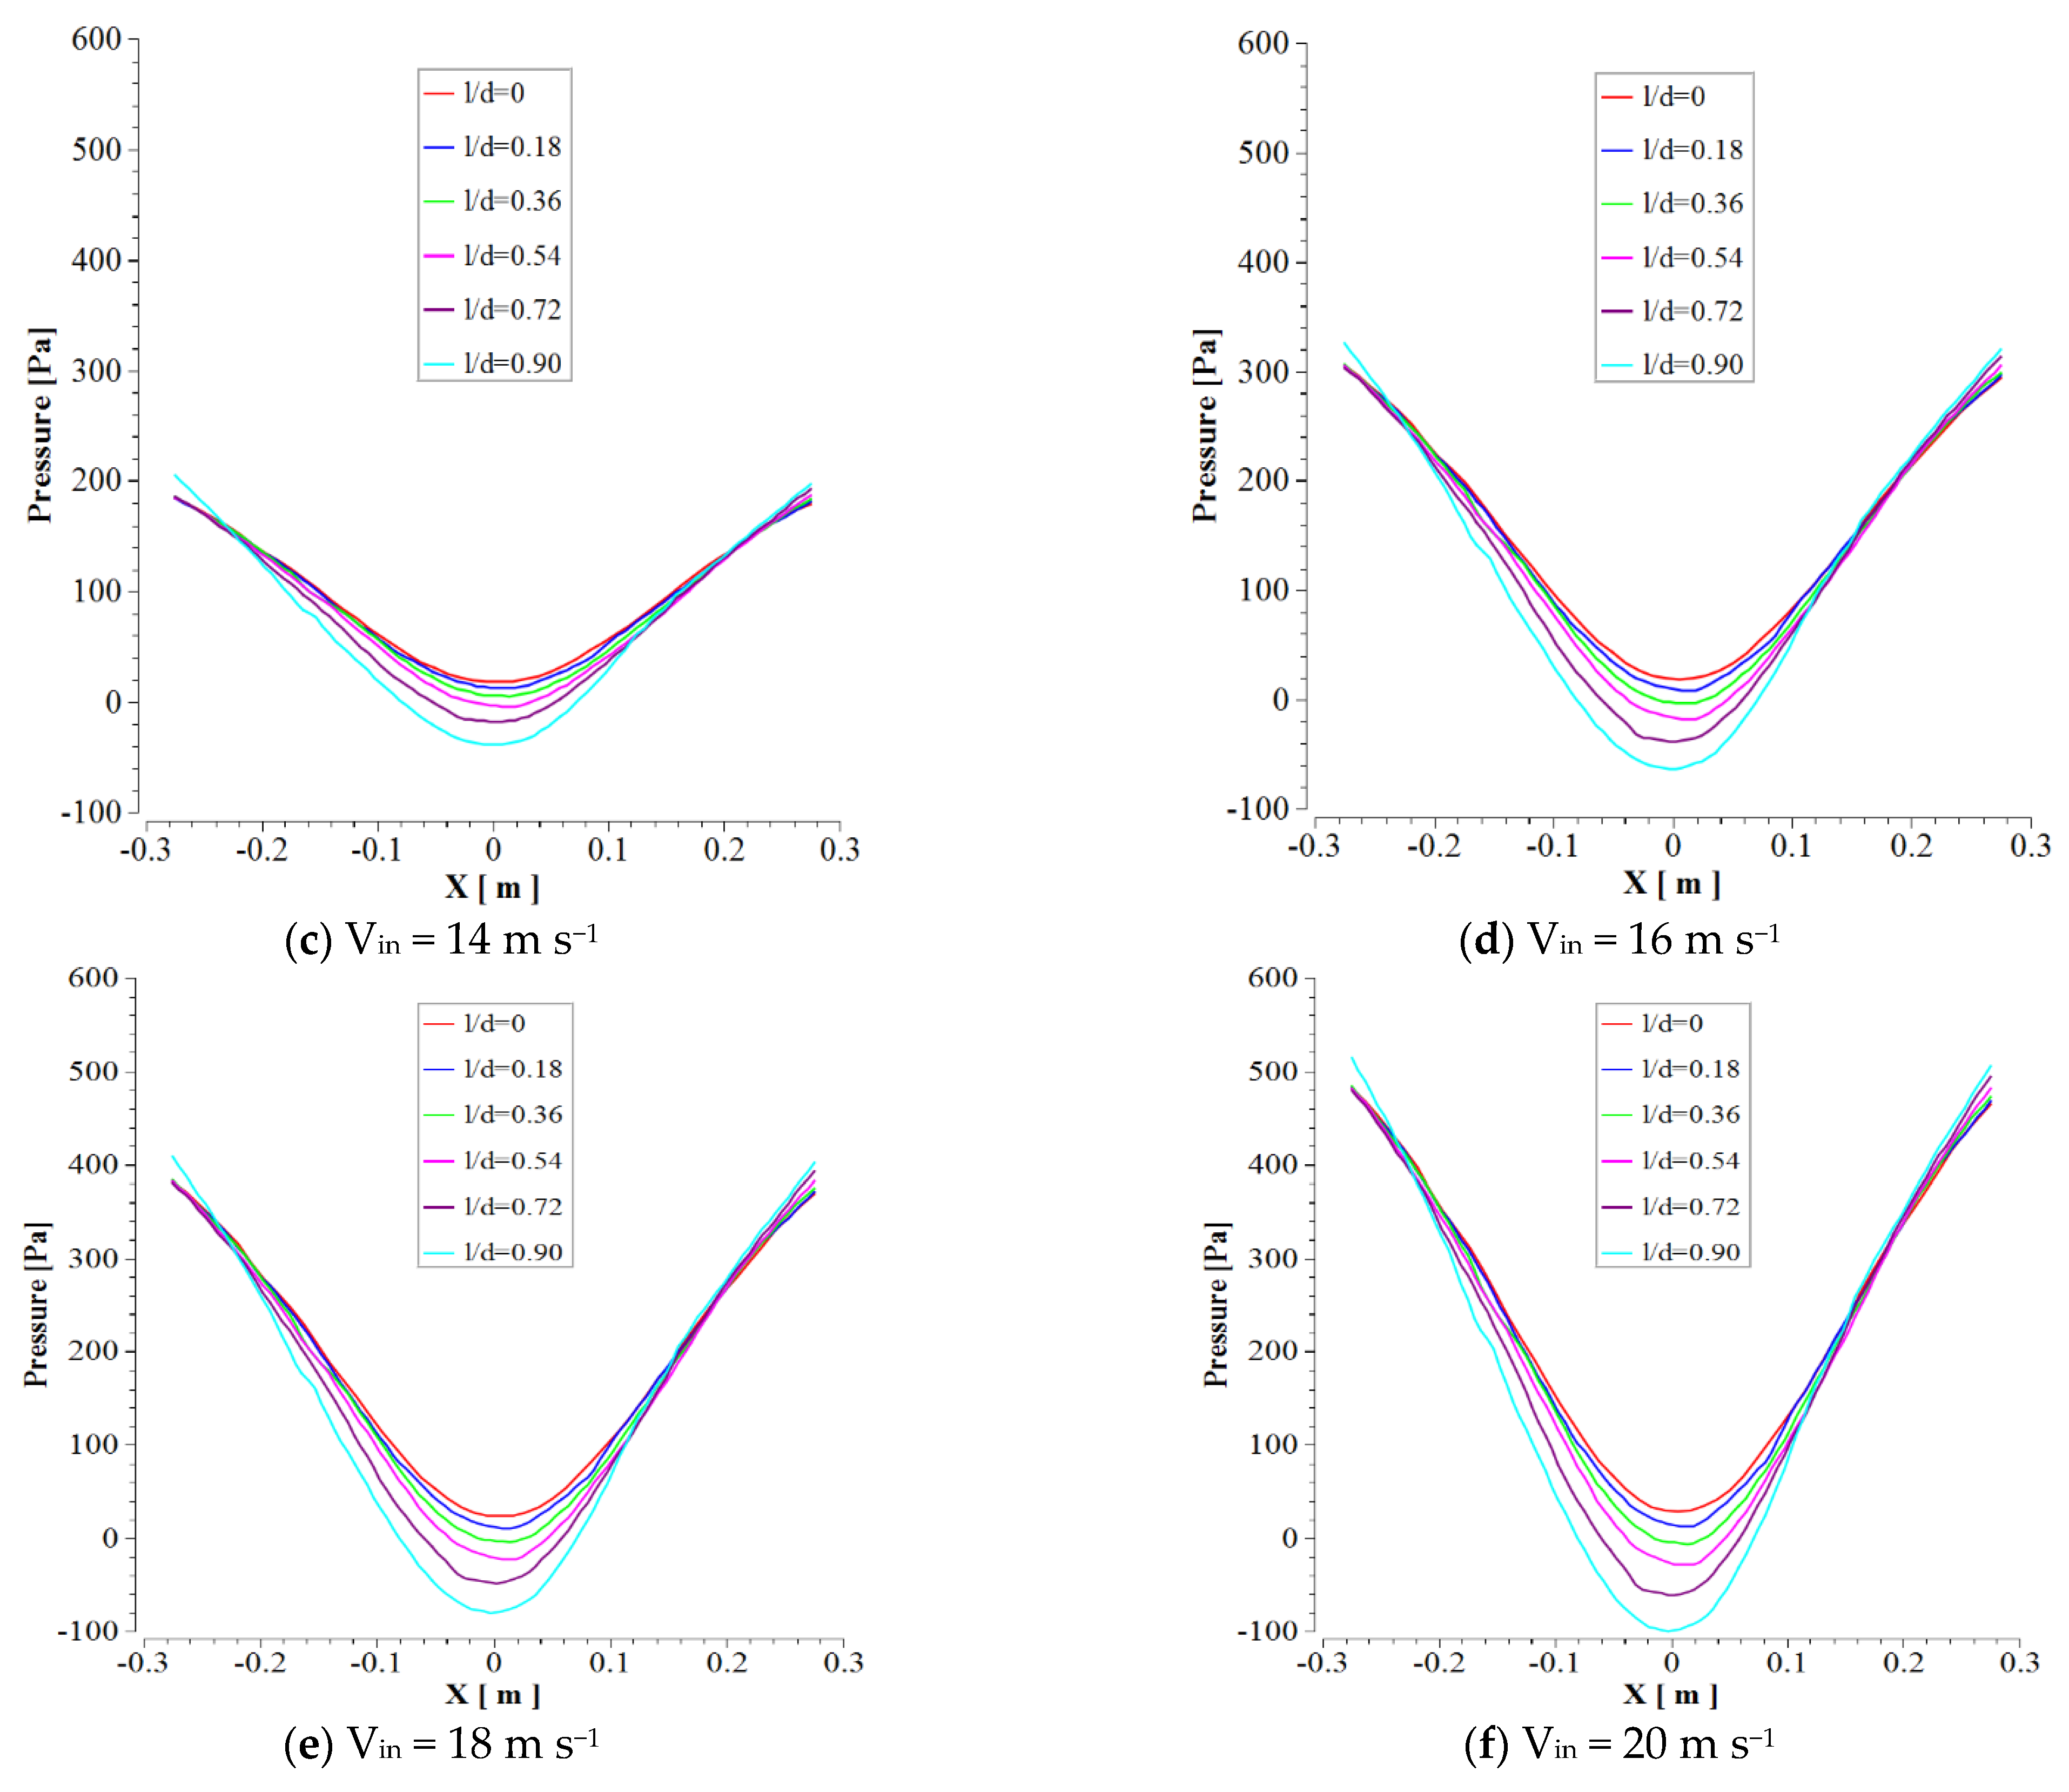
Additionally, the pressure drops plots in six various heights of cyclones (l/d = 0, l/d = 0.18, l/d = 0.36, l/d = 0.54, l/d = 0.72, l/d = 0.9) are illustrated in Figure 16.
Zhou et al. indicated that increasing the inlet velocity increases the pressure drop. In their work, four levels of inlet velocities, including 10, 15, 20, and 25 m s−1 were evaluated [29].

3.7. Separation Efficiency

The separation efficiency in various flow inlet velocities is illustrated in Figure 17. Additionally, the variation of maximum static pressures (pressure drop) was presented against inlet velocity change. The pressure drop increased directly regarding increasing the inlet velocities, whereas the separation efficiency increased to the velocity of 16 m s−1 and afterward decreased. The main reason for this significant decrement is the less time to obtain high separation efficiency in velocities more than Vin = 16 m s−1. Additionally, the turbulent intensity increased with increasing inlet velocity, which was significant in decrement separation efficiency.
Additionally, Zhou et al. reported that the separation efficiency has an increasing–decreasing result with increasing inlet velocity [29].

3.8. Static Pressure and Separation Efficiency in Various Mass Flow Rate

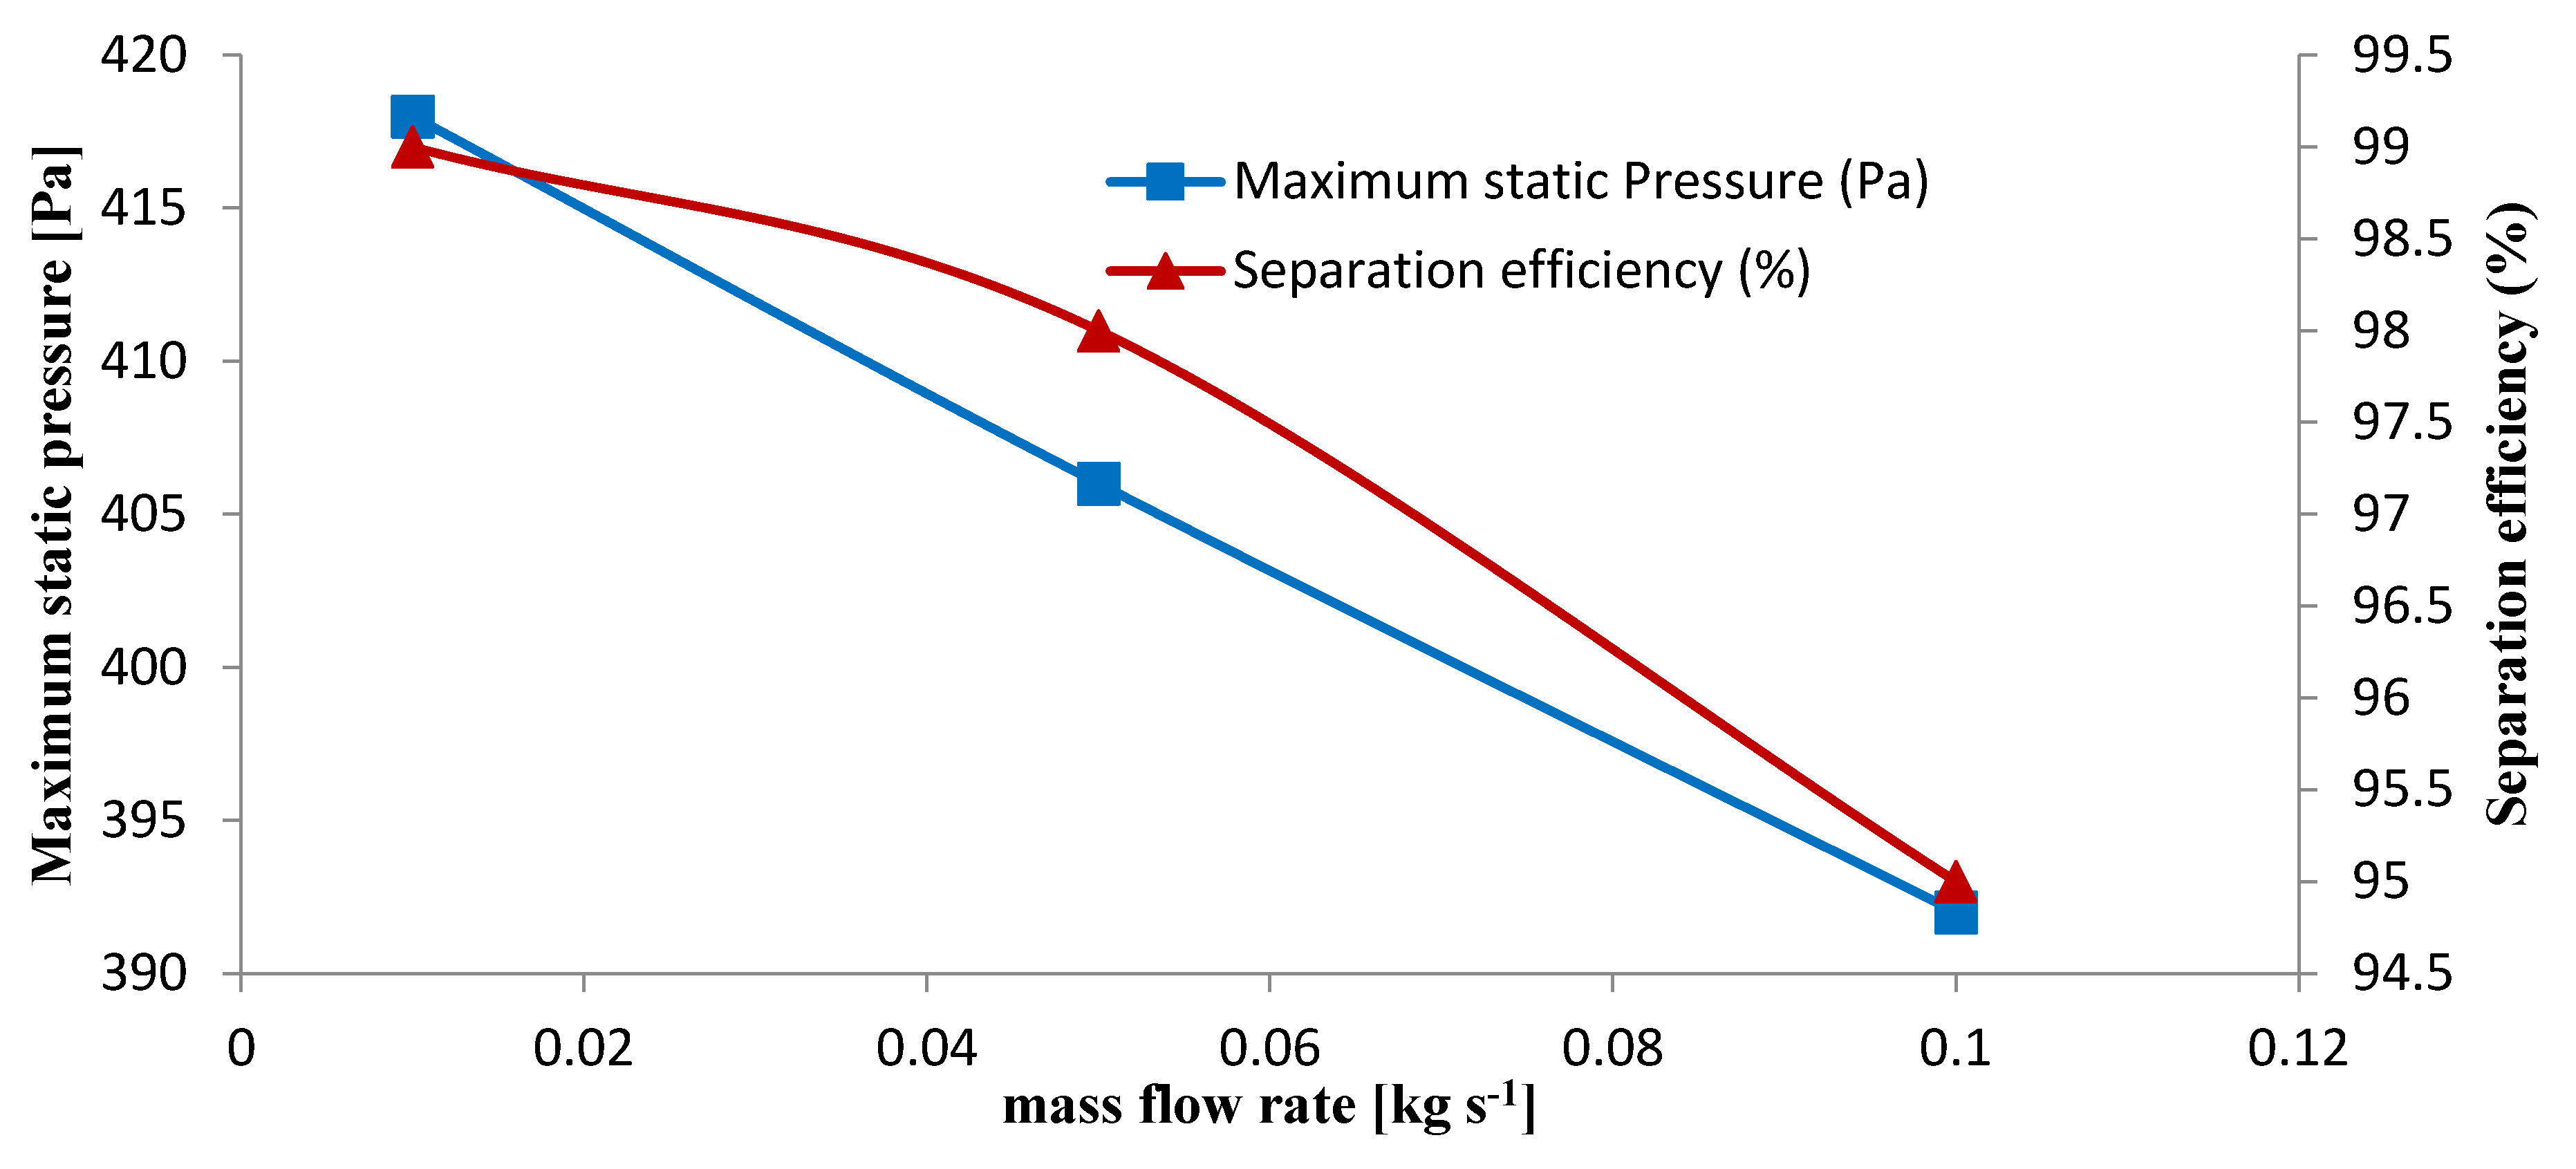
Both Static pressure and separation efficiency were decreased by increasing the mass flow rate (Figure 18). The increasing mass flow rate regarding constant inlet velocity is the main reason for this treatment (16 m s−1). Increasing the mass flow rate leads to an increase in the particle velocity and a reduction in the friction and pressure drop. As shown in Figure 19, a reasonable compromise should be made between pressure drop and separation efficiency to obtain the best performance.

4. Conclusions

A comprehensive assessment of flow behavior was carried out for six various inlet velocities and three mass flow rates of a wheat conveying cyclone separator. Along with CFD, experimental tests were performed to calibrate pressure drop, separation efficiency, axial, and tangential velocity, and turbulent intensity. The significant results and conclusions may be drawn as:
  • The pressure drop increased with increasing inlet velocity, while the separation efficiency increased to 16 m s−1, and subsequently indicated a decreasing trend for 18 and 20 m s−1 inlet velocities. Minimum pressure drop was obtained along the vortex finder axis, and the maximum pressure drop was obtained in the top section of the cyclone wall, demonstrating a uniform trend in all inlet velocities. In terms of compromise between the pressure drop and separation efficiency in wheat conveying within a cyclone, the velocity of 16 m s−1 was determined as the best inlet velocity between all inlet velocities.
  • The turbulent intensity as an effective factor in separation efficiency increased with increasing inlet velocity. One of the factors to reduce separation efficiency is the increase in the turbulent intensity and effectiveness.
  • In the second case, increasing the mass flow rate resulted in a decrement in pressure drop and separation efficiency. Additionally, the distribution of axial velocity in the mass flow rate of 0.01 to 0.05 remained almost constant and increasing to 0.1 observed a minor increase. It can be conducted that increasing the mass flow rate in the desired range has a negligible effect on the axial velocity distribution. The tangential velocity decreased with increasing mass flow rate. Additionally, increasing the mass flow rate was insignificant in the turbulent intensity within the cyclone.
To summarise, it can be conducted that for inlet velocity and mass flow rate ranges, the inlet velocity 16 m s−1 and mass flow rate of 0.01 is the best choice in the conveying process in similar conditions.

Author Contributions

Conceptualization, G.S. and S.N.D.; methodology, A.R.F., V.R.S.; software, V.R.; validation, G.S. and S.N.D.; formal analysis, A.R.F.; investigation, A.R.F.; resources, V.R. and M.S.; data curation, M.S., G.S.; writing—original draft preparation, G.S., S.N.D.; writing—review and editing, M.S., A.R.F., G.S.; visualization, V.R.S., A.R.F.; Writing – review & editing, A.M. All authors have read and agreed to the published version of the manuscript.

Funding

This research received no external funding.

Institutional Review Board Statement

Not applicable.

Informed Consent Statement

Not applicable.

Data Availability Statement

Data sharing is not applicable to this article.

Conflicts of Interest

The authors declare that they have no known competing financial interests or personal relationships that could have appeared to influence the work reported in this paper.

References

  1. Misiulia, D.; Elsayed, K.; Andersson, A.G. Geometry optimization of a deswirler for cyclone separator in terms of pressure drop using CFD and artificial neural network. Sep. Purif. Technol. 2017, 185, 10–23. [Google Scholar] [CrossRef]
  2. Miller, B.G. Clean Coal Engineering Technology; Butterworth-Heinemann: Oxford, UK, 2011. [Google Scholar]
  3. Gimbun, J.; Chuah, T.; Fakhru’L-Razi, A.; Choong, T.S. The influence of temperature and inlet velocity on cyclone pressure drop: A CFD study. Chem. Eng. Process. Process. Intensif. 2005, 44, 7–12. [Google Scholar] [CrossRef]
  4. Gimbun, J.; Chuah, T.G.; Choong, T.S.Y.; Engineering, N.R. Evaluation on Empirical Models for the prediction of cyclone efficiency. J. Inst. Eng. 2006, 67, 54–58. [Google Scholar]
  5. Gimbun, J. CFD Simulation of Aerocyclone Hydrodynamics and Performance at Extreme Temperature. Eng. Appl. Comput. Fluid Mech. 2008, 2, 22–29. [Google Scholar] [CrossRef] [Green Version]
  6. Wasilewski, M.; Brar, L.S. Effect of the inlet duct angle on the performance of cyclone separators. Sep. Purif. Technol. 2019, 213, 19–33. [Google Scholar] [CrossRef]
  7. Brar, L.S.; Sharma, R.; Elsayed, K. The effect of the cyclone length on the performance of Stairmand high-efficiency cyclone. Powder Technol. 2015, 286, 668–677. [Google Scholar] [CrossRef]
  8. Zhao, B. Prediction of gas-particle separation efficiency for cyclones: A time-of-flight model. Sep. Purif. Technol. 2012, 85, 171–177. [Google Scholar] [CrossRef]
  9. Wan, G.; Sun, G.; Xue, X.; Shi, M. Solids concentration simulation of different size particles in a cyclone separator. Powder Technol. 2008, 183, 94–104. [Google Scholar] [CrossRef]
  10. Sun, X.; Kim, S.; Yang, S.D.; Kim, H.S.; Yoon, J.Y. Multi-objective optimization of a Stairmand cyclone separator using response surface methodology and computational fluid dynamics. Powder Technol. 2017, 320, 51–65. [Google Scholar] [CrossRef]
  11. Sun, X.; Yoon, J.Y. Multi-objective optimization of a gas cyclone separator using genetic algorithm and computational fluid dynamics. Powder Technol. 2018, 325, 347–360. [Google Scholar] [CrossRef]
  12. Brar, L.S.; Elsayed, K. Analysis and optimization of cyclone separators with eccentric vortex finders using large eddy simulation and artificial neural network. Sep. Purif. Technol. 2018, 207, 269–283. [Google Scholar] [CrossRef]
  13. Farahani, S.M.N.; Tahmasbi, V.; Safikhani, H.; Abbassi, A. Effects of Using Ribs on Flow Pattern and Performance of Cyclone Separators. Eng. Appl. Comput. Fluid Mech. 2011, 5, 180–187. [Google Scholar] [CrossRef] [Green Version]
  14. Shukla, S.K.; Shukla, P.; Ghosh, P. Evaluation of Numerical Schemes for Dispersed Phase Modeling of Cyclone Separators. Eng. Appl. Comput. Fluid Mech. 2011, 5, 235–246. [Google Scholar] [CrossRef] [Green Version]
  15. Le, D.K.; Yoon, J.Y. Numerical investigation on the performance and flow pattern of two novel innovative designs of four-inlet cyclone separator. Chem. Eng. Process. Process. Intensif. 2020, 150, 107867. [Google Scholar] [CrossRef]
  16. Lim, J.-H.; Park, S.-I.; Lee, H.-J.; Zahir, M.Z.; Yook, S.-J. Performance evaluation of a tangential cyclone separator with additional inlets on the cone section. Powder Technol. 2020, 359, 118–125. [Google Scholar] [CrossRef]
  17. Nassaj, O.R.; Toghraie, D.; Afrand, M. Effects of multi inlet guide channels on the performance of a cyclone separator. Powder Technol. 2019, 356, 353–372. [Google Scholar] [CrossRef]
  18. Qiang, L.; Qinggong, W.; Weiwei, X.; Zilin, Z.; Konghao, Z. Experimental and computational analysis of a cyclone separator with a novel vortex finder. Powder Technol. 2020, 360, 398–410. [Google Scholar] [CrossRef]
  19. Gao, Z.; Wang, J.; Wang, J.; Mao, Y.; Wei, Y. Analysis of the effect of vortex on the flow field of a cylindrical cyclone separator. Sep. Purif. Technol. 2019, 211, 438–447. [Google Scholar] [CrossRef]
  20. Zhou, Y.; Xu, Z.; Xiao, G.; Hu, X.; Chen, H.; Zhang, R.; Luo, X.; Wang, J.; Yang, Y. Monitoring the hydrodynamics and critical variation of separation efficiency of cyclone separator via acoustic emission technique with multiple analysis methods. Powder Technol. 2020, 373, 174–183. [Google Scholar] [CrossRef]
  21. Fanayi, A.R.; Nikbakht, A.M. A CFD Study of the Effects of Feed Diameter on the Pressure Drop in Acyclone Separator. Int. J. Food Eng. 2015, 11, 71–77. [Google Scholar] [CrossRef]
  22. Coffield, D.; Shepherd, D. Tutorial guide to Unix sockets for network communications. Comput. Commun. 1987, 10, 21–29. [Google Scholar] [CrossRef]
  23. Elsayed, K.; Lacor, C. Numerical modeling of the flow field and performance in cyclones of different cone-tip diameters. Comput. Fluids 2011, 51, 48–59. [Google Scholar] [CrossRef]
  24. Xiang, R.; Lee, K. Numerical study of flow field in cyclones of different height. Chem. Eng. Process. Process. Intensif. 2005, 44, 877–883. [Google Scholar] [CrossRef]
  25. Haider, A.; Levenspiel, O. Drag coefficient and terminal velocity of spherical and nonspherical particles. Powder Technol. 1989, 58, 63–70. [Google Scholar] [CrossRef]
  26. Elsayed, K.; Lacor, C. Optimization of the cyclone separator geometry for minimum pressure drop using mathematical models and CFD simulations. Chem. Eng. Sci. 2010, 65, 6048–6058. [Google Scholar] [CrossRef]
  27. Chuah, T.; Gimbun, J.; Choong, T.S. A CFD study of the effect of cone dimensions on sampling aerocyclones performance and hydrodynamics. Powder Technol. 2006, 162, 126–132. [Google Scholar] [CrossRef]
  28. Parvaz, F.; Hosseini, S.H.; Elsayed, K.; Ahmadi, G. Influence of the dipleg shape on the performance of gas cyclones. Sep. Purif. Technol. 2020, 233, 116000. [Google Scholar] [CrossRef]
  29. Zhou, F.; Sun, G.; Zhang, Y.; Ci, H.; Wei, Q. Experimental and CFD study on the effects of surface roughness on cyclone performance. Sep. Purif. Technol. 2018, 193, 175–183. [Google Scholar] [CrossRef]
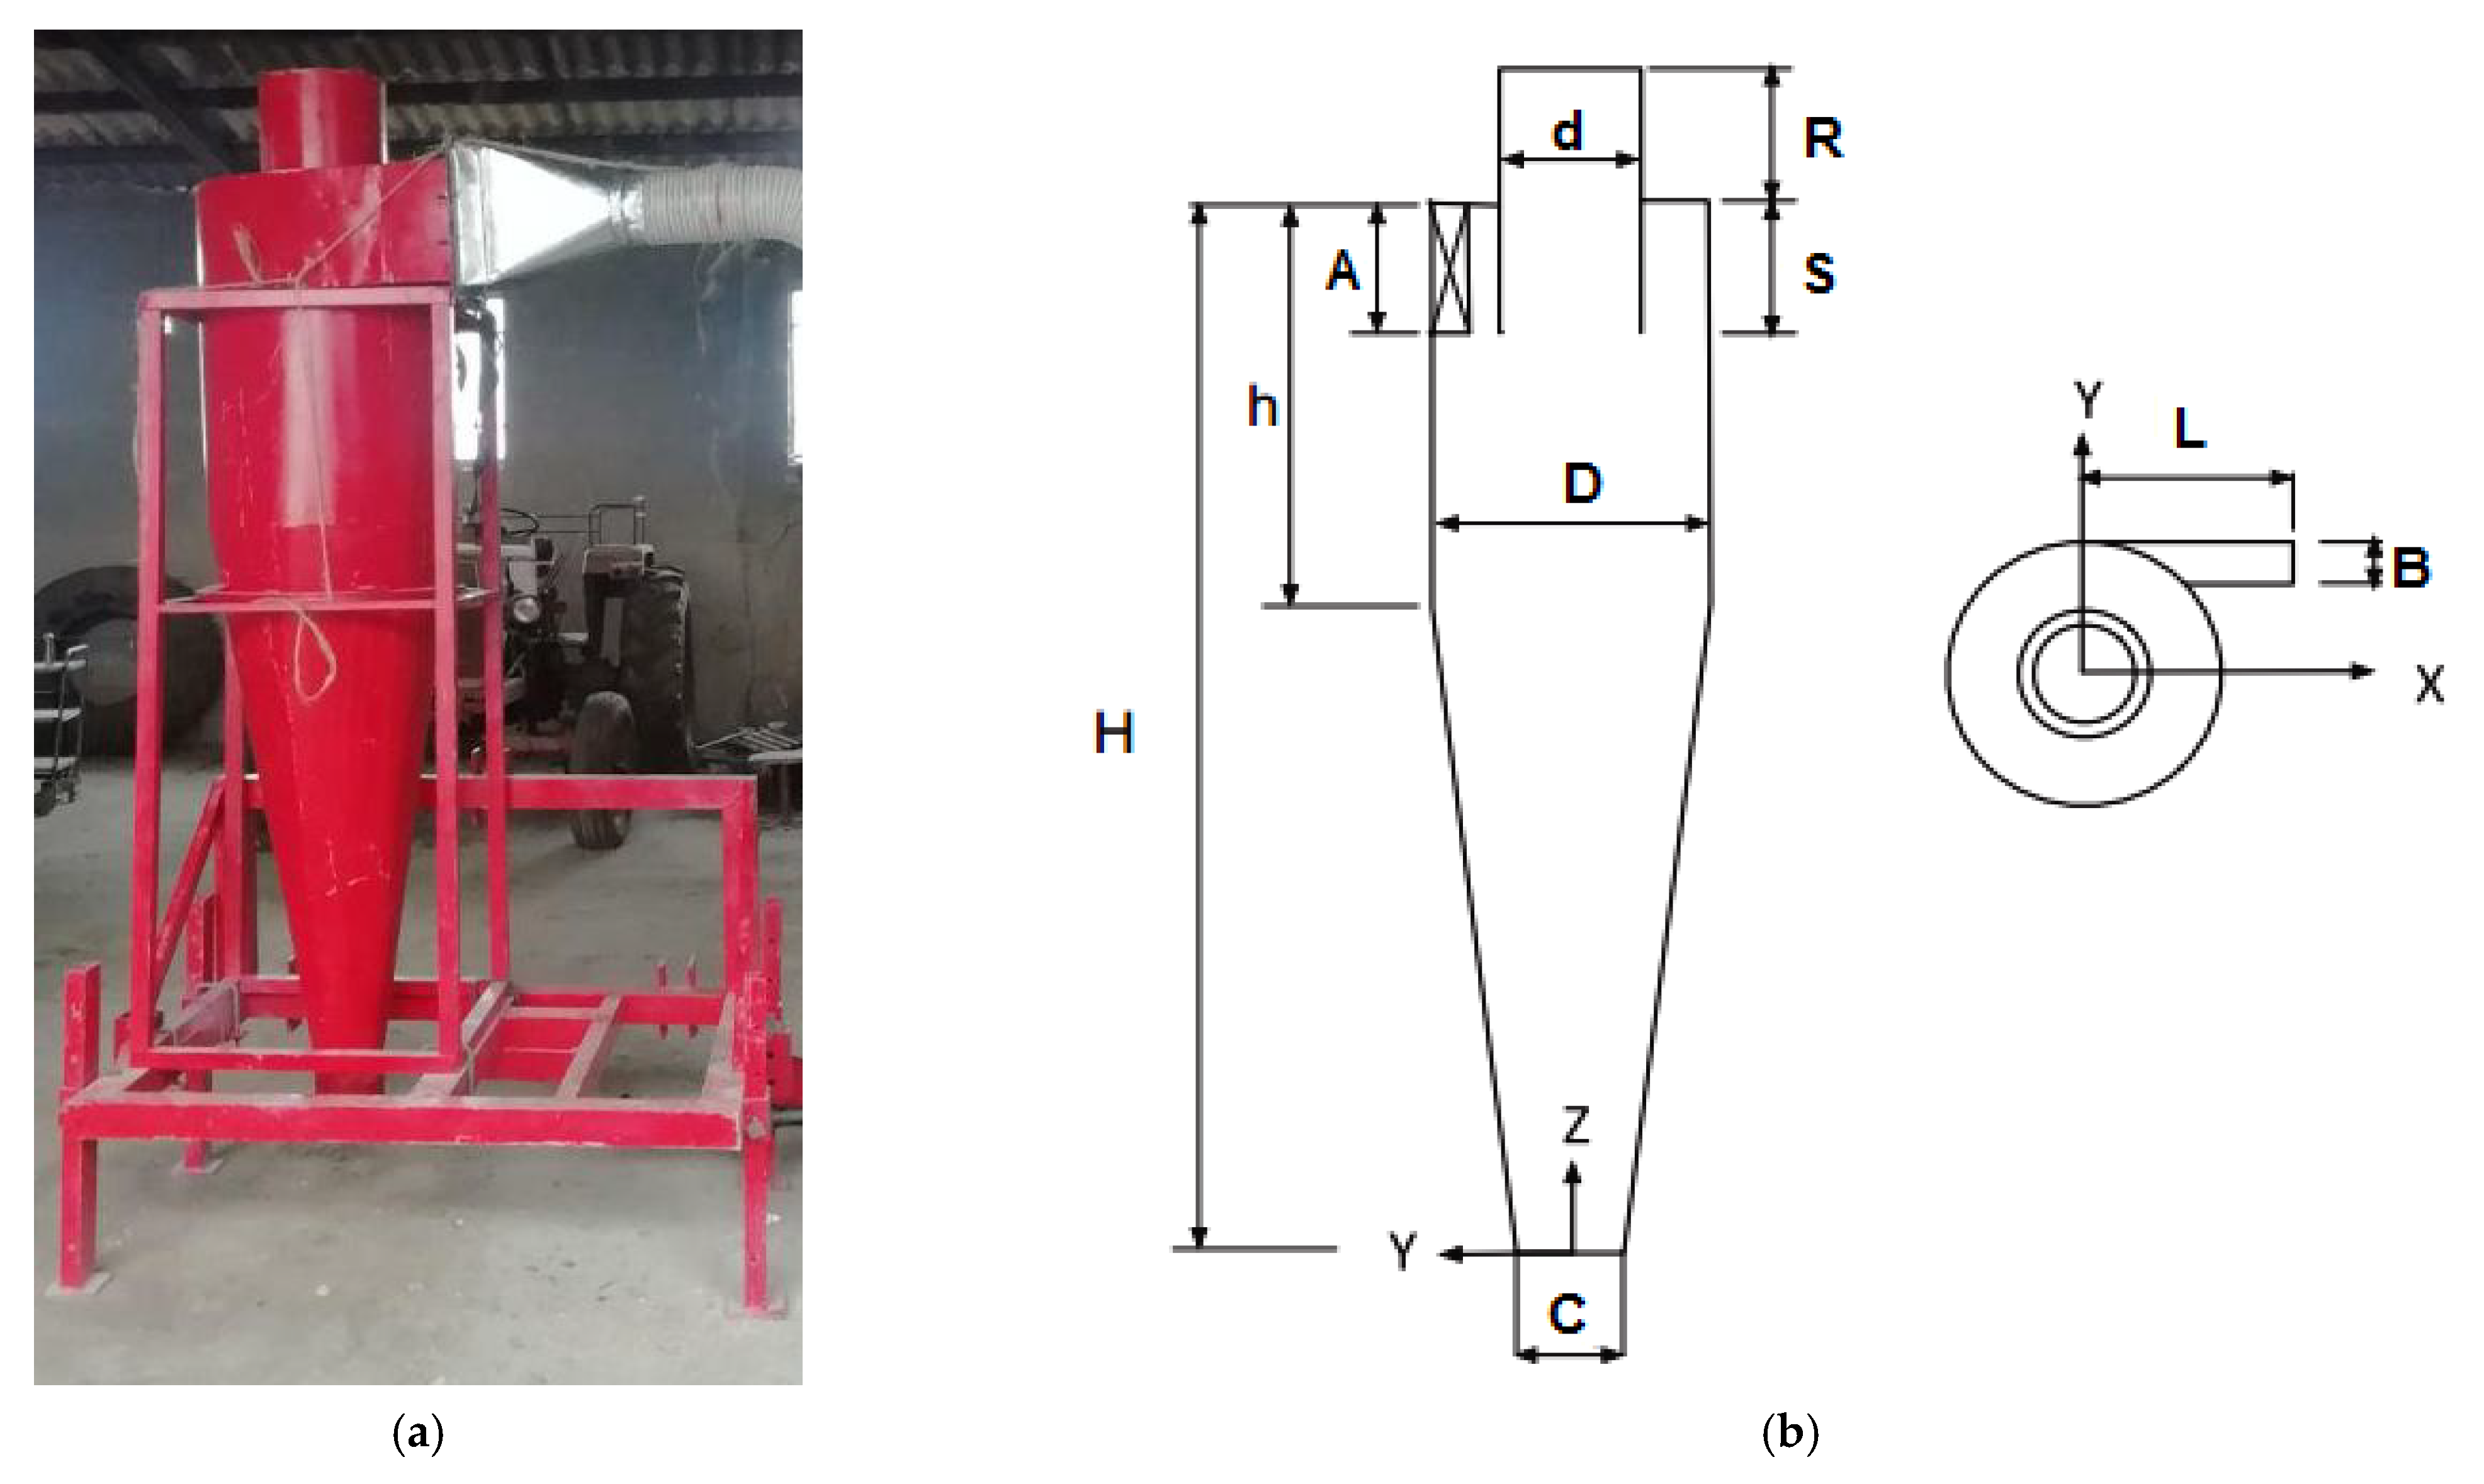
Figure 1. (a) Schematic of used cyclone in experiments, (b) dimensions of cyclone.
Processes 10 00001 g001
Figure 2. Experimental set-up for validation process.
Processes 10 00001 g002
Figure 3. Meshing of cyclone in Gambit: (a) Front view, (b) top view.
Processes 10 00001 g003
Figure 4. Validation between numerical results and experimental data for pressure drop.
Processes 10 00001 g004
Figure 5. Validation between numerical results and experimental data for tangential velocity.
Processes 10 00001 g005
Figure 6. Axial velocity contours in various inlet velocities.
Processes 10 00001 g006
Figure 7. The variation of axial velocity graphs of 6 various cyclone cylinder heights in various inlet velocities.
Processes 10 00001 g007aProcesses 10 00001 g007b
Figure 8. Axial velocity contours in various mass flow rates.
Processes 10 00001 g008
Figure 9. Tangential velocity contours in various inlet velocities.
Processes 10 00001 g009
Figure 10. Tangential velocity variation in various cyclone cylinder heights.
Processes 10 00001 g010
Figure 11. Tangential velocity contours in various mass flow rates.
Processes 10 00001 g011
Figure 12. Turbulent intensity contours in various inlet velocities.
Processes 10 00001 g012
Figure 13. Variation of axial velocity, tangential velocity and turbulent intensity in various inlet velocities.
Processes 10 00001 g013
Figure 14. Turbulent intensity contours in various mass flow rates.
Processes 10 00001 g014
Figure 15. Static pressure contour in various inlet velocities.
Processes 10 00001 g015
Figure 16. The variation of static pressure graphs of 6 various cyclone cylinder heights in various inlet velocities.
Processes 10 00001 g016aProcesses 10 00001 g016b
Figure 17. Maximum static pressure and separation efficiency in various inlet velocities.
Processes 10 00001 g017
Figure 18. Static pressure contours in various mass flow rates.
Processes 10 00001 g018
Figure 19. Maximum static pressure and separation efficiency variations in various mass flow rates.
Processes 10 00001 g019
Table 1. Cyclone separator dimensions.
ParametersValues (cm)
Body diameter (D)55
Gas outlet diameter (d)27.5
Inlet height (A)27.5
Inlet width (B)11
Gas outlet duct length (R)27.5
Total Height (H)220
Cylindrical section Height (h)82.5
Cone-tip diameter (C)19.25
Vortex finder height (S)27.5
Inlet length (L)35
Table 2. Boundary conditions.
Boundary Condition TypeValue/Condition
velocity inletm s−1
Pressure outletAtmospheric pressure
WallNo-slip condition
Table 3. Solid phase properties.
PropertyValue
Density790 kgm−3
Minimum diameter0.2 cm
Maximum diameter0.8 cm
Mean Diameter0.5 cm
Table 4. Numerical scheme for simulations.
Numerical SettingScheme
Pressure distributionPRESTO
Pressure-velocity couplingSIMPLE
Momentum discretizationSecond-Order Upwind
Turbulent Kinetic EnergySecond-Order Upwind
Turbulent Dissipation RateSecond-Order Upwind
Publisher’s Note: MDPI stays neutral with regard to jurisdictional claims in published maps and institutional affiliations.